Article

An Improved Model Equation Based on a Gaussian Function Trinomial for State of Charge Estimation of Lithium-ion Batteries

1
New Energy Research Center, School of Electric Power, South China University of Technology, Guangzhou 510640, China
2
Guangdong Key Laboratory of Clean Energy Technology, School of Electric Power, South China University of Technology, Guangzhou 510640, China
*
Author to whom correspondence should be addressed.
Energies 2019, 12(7), 1366; https://doi.org/10.3390/en12071366
Submission received: 15 March 2019 / Revised: 30 March 2019 / Accepted: 5 April 2019 / Published: 9 April 2019

Abstract

:
Establishing a model equation with high accuracy and high computational efficiency is very important for the estimation of battery state of charge (SOC). To ensure better SOC estimation results, most studies have focused on the improvement of the algorithm, while the impact of the model equation which may offset the benefits of advanced algorithms has been overlooked. To address this problem, this paper studies the widely used model equations and presents a new model equation based on a Gaussian function that improves the SOC estimation accuracy and computational efficiency. With the Worldwide harmonized Light Vehicles Test Cycle (WLTC) which is highly dynamic and more realistic than any other driving cycles, the proposed model equation is applied to different filtering algorithms to validate its performance in SOC estimation. The results indicate that the proposed model equation can greatly improve the accuracy of SOC estimation without an increase of computation. In addition, for the traditional polynomial-based model equations, the 6th-order power function polynomial has better performance in SOC estimation than polynomials with other orders.

1. Introduction

Developing electric vehicles (EVs) is an important measure to build a modern energy system which is clean, safe, and efficient [1]. To solve the universal cruising range, safety, battery energy density and battery life problems of EVs, an efficient and reliable battery management system (BMS) is essential. Accurate estimation of state of charge (SOC) is the basis for efficient operation of other functions of BMS [2].
The SOC estimation methods mainly include five categories [3,4]: conventional methods, adaptive filtering algorithms, learning algorithms, nonlinear observers and hybrid methods. The adaptive filtering algorithms, nonlinear observers and hybrid methods derived from them, which provides satisfactory performance in SOC estimation, all rely on an accurate battery model to describe the operating characteristics of batteries. Commonly used battery models can be divided into two major categories [5]: the electrochemical models and the equivalent circuit models (ECMs). Compared with electrochemical models which involve a number of partial differential equations and unknown parameters [6,7], ECMs are more suitable for engineering practice. They have fewer parameters and are convenient to derive empirical results from evaluations and data analyses, and are more likely to achieve higher precision in practices due to its simpler parameter identification [8,9]. These inherent merits make ECMS a preferred choice for BMS [10].
Typical ECMs for lithium-ion battery include an ideal voltage source to describe the open circuit voltage (OCV). The OCV is a very important parameter for lithium-ion battery. Since it has a very close relationship with SOC [11,12,13], it not only affects the identification results of other model parameters, but also affects the accuracy of the ECM and SOC estimation. In order to obtain more accurate SOC estimations, scholars around the world have proposed many advanced algorithms over the years [14,15,16,17]. Benefiting from these improvements in algorithms, the accuracy and robustness of SOC estimation have been improved, however, the description of the relationship between OCV and SOC, which also affects the estimation results, is often overlooked. In related researches, the OCV is described as a function of SOC by a power function polynomial. Different researchers have selected model equations with different orders in their studies [18,19,20,21,22,23]. It is generally believed that higher polynomial orders lead to more accurate SOC estimation results, and lower orders lead to more convenient calculations. To make the estimation results sufficiently accurate, high-order power function polynomials are usually selected. However, a too high polynomial order will increase the amount of calculation and badly distort the OCV curve (detailed in Section 3.2), and even cause oscillations due to the Runge’s phenomenon, all of which will reduce the estimation accuracy. In other studies, the OCV equation is expressed by polynomials consisting of power function and logarithmic function [24,25]. Because of their low orders, these hybrid polynomials can effectively reduce the computational complexity and do not cause distortion of the OCVs curve. Their disadvantage is that due to the use of a logarithmic function, the error increases when the SOC approaches 0% or 100%.
Establishing a model equation with sufficient accuracy and appropriate complexity is important for SOC estimation. In this paper, a new model equation based on a Gaussian function are proposed. It has higher accuracy than other model equations over the entire range of SOC from 0% to 100%, and is convenient to calculate. The excellent performance of this model equation is demonstrated by applying it to different filtering algorithms. In addition, this paper also studies the model equations based on power function polynomials. The results show that polynomials with high order not only increase the amount of calculation, but also have a negative impact on accuracy. In contrast, the 6th-order power function polynomial has better performance than polynomial with other orders.
The remainder of this paper is organized as follows: Section 2 introduces our model of a lithium-ion battery and the filtering algorithms for SOC estimation used in this paper. Section 3 analyzes the shortcomings of the traditional model equations based on power function polynomials, and proposes a model equation based on a Gaussian function trinomial. Section 4 introduces the battery test bench and experimental projects. In Section 5, a new typical driving cycle is conducted on the lithium-ion batteries to compare the accuracy of different model equations, then these model equations are applied to different algorithms for SOC estimation, respectively. The experimental results show that the proposed GFT-based model equation can greatly improve the accuracy of SOC estimation. Finally, the conclusions of this work are given in Section 6.

2. Battery Model and SOC Estimation Approach

2.1. Physical and Mathematical Description of Lithium-ion Battery

To estimate the SOC, a reasonable and effective battery model is necessary. Among various models, the dual polarization (DP) model has been proven to be the most accurate model for describing the dynamic processes inside the battery, and offers the best performance when applying a Kalman filter algorithm to estimate the SOC [8,9,26]. As shown in Figure 1, the DP model is composed of the OCV, ohmic resistance R0, and two RC networks (Rp1, Cp1, Rp2, Cp2) that represent the concentration and electrochemical polarizations.
According to the Kirchhoff’s voltage law, the model can be expressed as the following equations:
{ U · p 1 = 1 C p 1 R p 1 U p 1 + 1 C p 1 I L U · p 2 = 1 C p 2 R p 2 U p 2 + 1 C p 2 I L U L = U O C V I L R 0 U p 1 U p 2
The SOC is defined as follows:
S O C ( t ) = S O C ( t 0 ) + 1 C a t 0 t η i I L ( t ) d t
where SOC(t) is the current SOC at time t; SOC(t0) is the initial SOC; IL(t) is the current at time t; ηi is the Coulomb efficiency; Ca is the present available capacity, which may be different from the rated capacity for the effects of age and temperature [4,27,28].

2.2. SOC Estimation Approach

Different approaches have been proposed to estimate the battery SOC with the development of EVs. Among various SOC estimation methods, the Kalman filter is considered to be a very suitable approach for online SOC estimation of EV batteries [18,29,30,31]. Due to its excellent ability in dealing with the problems brought by measurement errors and inaccurate initial SOC, the Kalman filter is more accurate and reliable than conventional methods such as the Coulomb counting method and the OCV method. On the other hand, it does not require time-consuming training or have high computational costs like neural networks or fuzzy logic. Therefore, this paper adopts this type of filtering algorithm to estimate the battery SOC.
Since the lithium-ion battery is a complicated nonlinear system, it is necessary to use nonlinear Kalman filters for SOC estimation. Three different algorithms are adopted in this study, including the extended Kalman Filter (EKF), the cubature Kalman Filter (CKF) and the adaptive cubature Kalman Filter (ACKF). The EKF uses partial derivatives and a first-order Taylor series expansion to linearize the nonlinear equation [32,33,34]. It has become a standard technique used in a number of nonlinear estimation and machine learning applications. The CKF, which is based on the spherical-radial cubature rule, uses a set of sample points to capture the mean and covariance of the states of a nonlinear system with additive Gaussian noise [35]. It has less errors than the EKF, and is even more accurate than the unscented Kalman filter which also adopts a Gaussian probability density function to deal with nonlinear problems. The ACKF is based on CKF and introduces an adaptive law to update the process noise covariance and measurement noise covariance. It improves the accuracy and robustness of SOC estimations [36].
To prove the validity and wide applicability of the proposed model equation, it is applied to EKF, CKF and ACKF, respectively. Details of these filtering algorithms can be found in [32,35,36].

3. Establishment of Model Equation Based on Gaussian Function Trinomial

3.1. Subsection

Parameter Identification

The establishment of a model equation is based on accurate parameter identification. There are two categories of parameters that need to be identified, one is the relationship between the OCV and SOC, the other is ECM parameters, including R0, Rp1, Cp1, Rp2, and Cp2.
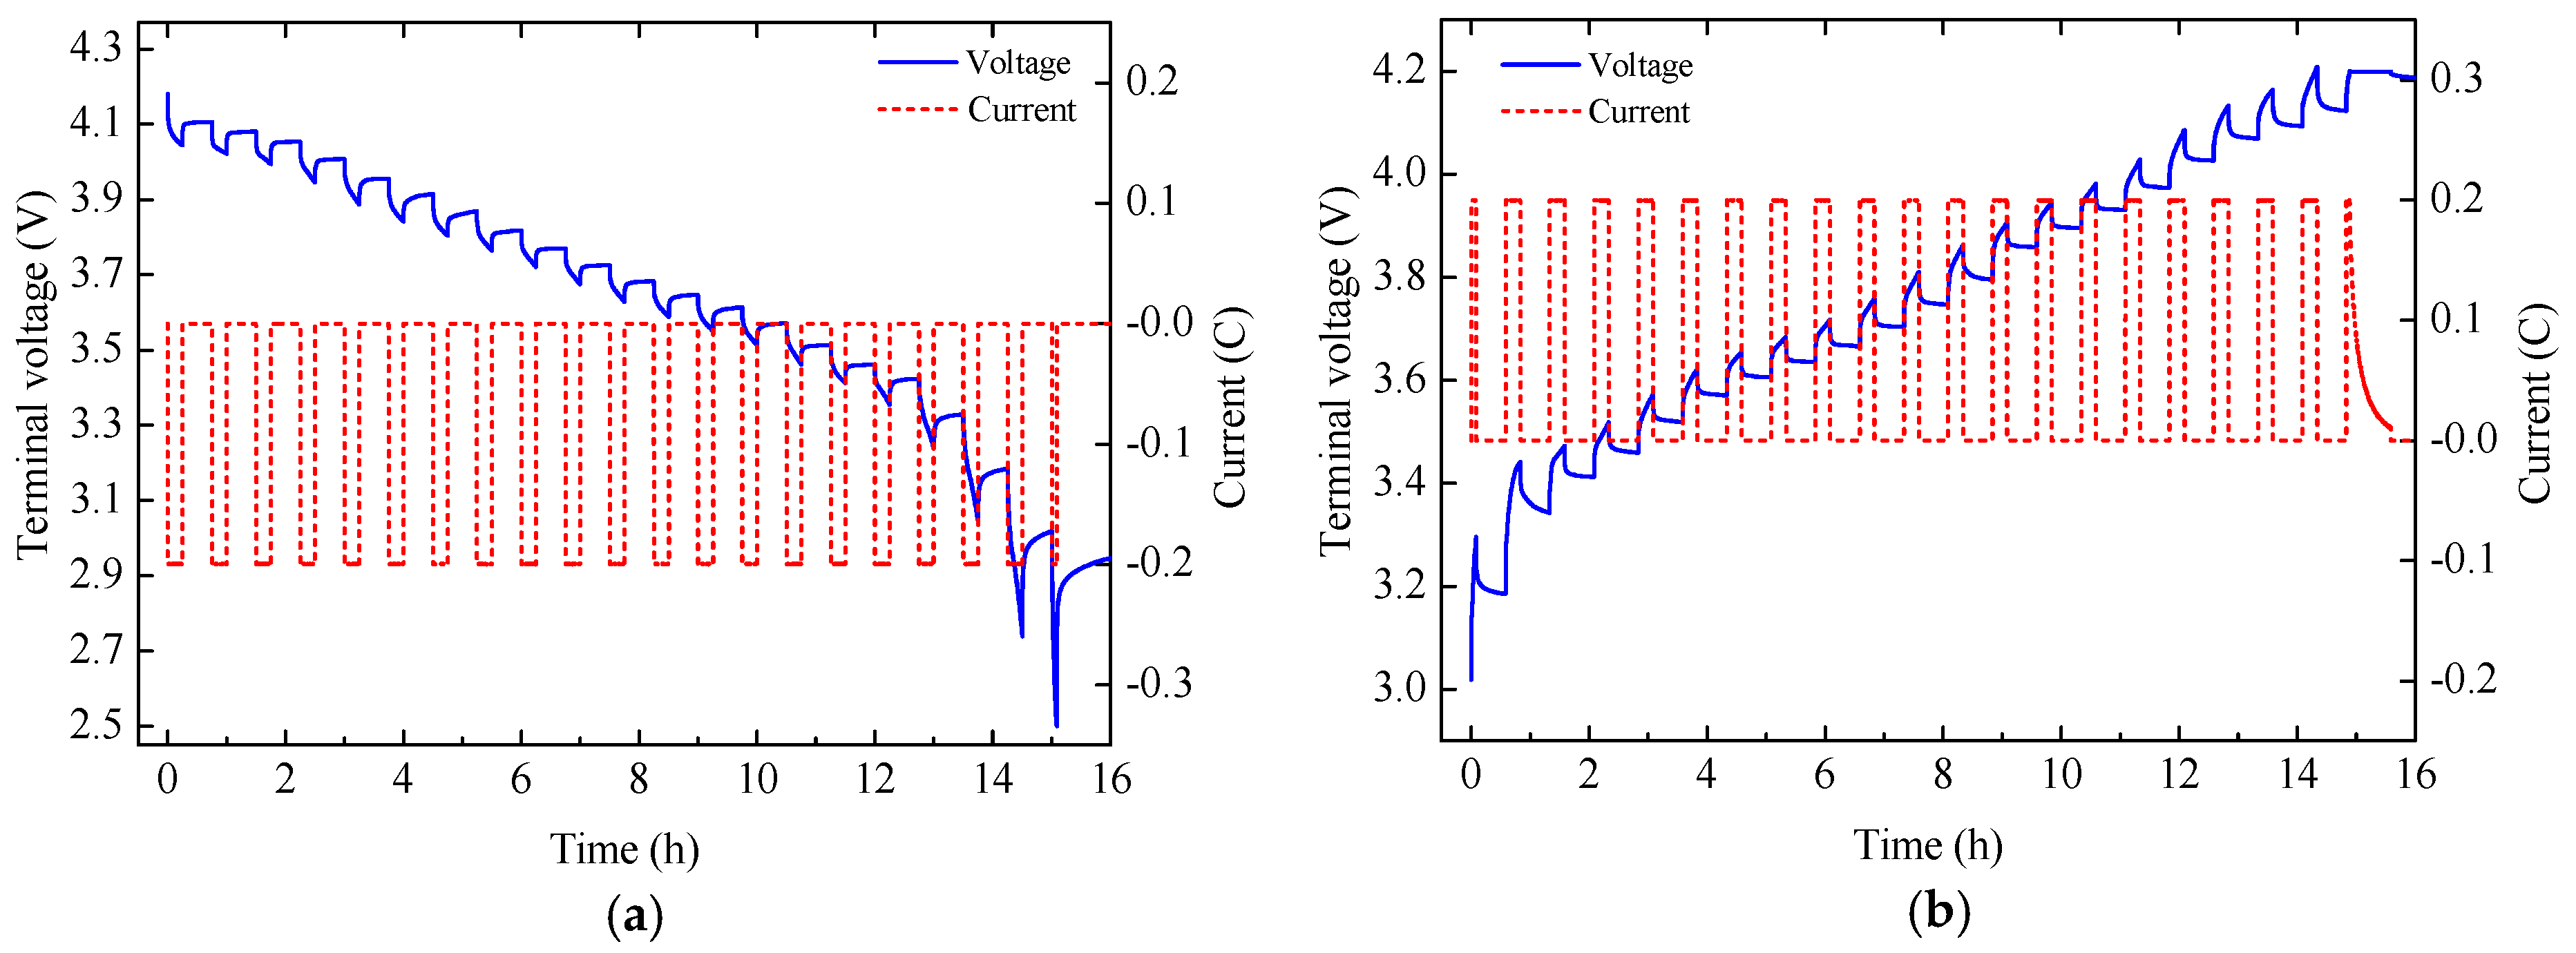
The identification of the relationship between OCV and SOC directly affects the accuracy of ECM parameter identification. In this paper, the OCV at different SOCs are measured through the constant current intermittent discharge (CCID) test and the constant current intermittent charge (CCIC) test, which will be introduced in Section 4.2.1. As shown in Figure 2, the terminal voltage of battery rises during the rest time of the CCID test, and drops during the rest time of the CCIC test. After a 30 min rest, the measured terminal voltage is approximately regarded as equilibrium potential. The equilibrium potentials measured from CCID test and CCIC test are shown in Figure 3. It can be seen that the equilibrium potentials in the CCIC test are higher than those of the CCID test, and the deviation is more obvious when the SOC is low. The average of the two is the OCV at the corresponding SOC [37]. It should be noted that the value of OCV at 100% SOC is the terminal voltage rested for 5 hours after charging to the upper voltage limit, and the value of OCV at 0% SOC is the terminal voltage rested for 5 hours after discharging to the lower voltage limit. Table 1 shows the identification results of the relationship between OCV and SOC.
For ECM parameters, this paper uses the method proposed in [38] to identify parameters including R0, Rp1, Cp1, Rp2 and Cp2, according to the voltage response at different SOCs in the CCID test.

3.2. Establishment of UOCV = f(SOC) Based on the Gaussian Function

In most studies, the function UOCV = f(SOC) is described by an nth-order polynomial as follows:
U O C V = a n S O C n + a n 1 S O C n 1 + + a 1 S O C + a 0
where the coefficients an, an−1, …, a0 can be obtained by the least squares method. In general, the higher the order, the closer the resulting curve is to a given data point.
Power function polynomials are often used to establish UOCV = f(SOC) because of its simple principle. However, this method also has some obvious shortcomings. Firstly, it is only suitable for occasions where the curve changes gently. If the data points change drastically, the fit will be poor. Secondly, a low order will make it difficult for the equation \to accurately reflect the data trend. However, increasing the order will not only increase the amount of calculation, but also may lead to the Runge phenomenon which causes the curve to oscillate [39,40,41]. As shown in Figure 4, the curve of the 10th-order polynomial is closer to the measured data points than curves of other equations, and even excessively distorts the curve to make it approach the measured data points. This will result in a large deviation between the calculated OCV and the actual value. Therefore, this paper proposes a polynomial that not only accurately reflects the real OCV, but also improve the computational efficiency.
It is well known that in statistics and probability theory, Gaussian functions appear as the density function of the normal distribution, which is a limiting probability distribution of complicated sums, according to the central limit theorem. In the Kalman filter theory, the process noise and measurement noise are assumed to be Gaussian white noise whose probability density obeys a Gaussian distribution. In fact, the Gaussian function also has many good features [42]: the derivatives of the Gaussian function can be represented using Hermite functions, the integral calculation of the Gaussian function is also very convenient, etc. In mathematics, the Gaussian function is a function of the following form:
f ( x ) = a e ( x b ) 2 / c
where the parameter a is the height of the curve’s peak, b is the position of the center of the peak; and c = 2σ2 (where σ is the standard deviation) controls the width of the curve.
Taking the logarithm on both sides of Equation (4), it becomes:
ln f ( x ) = ( 1 / c 2 ) x 2 + ( 2 b / c 2 ) x + ( ln a b 2 / c 2 ) = A 2 x 2 + A 1 x + A 0
where A2 = −1/c2, A1 = 2b/c2, A0 = lna − b2/c2. All of these coefficients can be calculated by the following equation according to the least squares method:
{ ( x 2 , x 2 ) A 2 + ( x 2 , x ) A 1 + ( x 2 , 1 ) A 0 = ( x 2 , ln f ( x ) ) ( x , x 2 ) A 2 + ( x , x ) A 1 + ( x , 1 ) A 0 = ( x , ln f ( x ) ) ( 1 , x 2 ) A 2 + ( 1 , x ) A 1 + ( 1 , 1 ) A 0 = ( 1 , ln f ( x ) )
where (φk, φi) is the inner product of two function value vectors φk and φi. By solving Equation (6), the coefficients A0, A1 and A2 are obtained. Then the parameters a, b and c in Equation (4) are also obtained.
Considering that the increase of accuracy is very small and the computational complexity is increased when the number of polynomial terms is greater than three, we adopt a polynomial based on Gaussian function which we call it Gaussian function trinomial (GFT) to establish the function UOCV = f(SOC). Its form is as follows:
U O C V = i = 1 3 a i e ( S O C b i ) 2 / c i = a 1 e ( S O C b 1 ) 2 / c 1 + a 2 e ( S O C b 2 ) 2 / c 2 + a 3 e ( S O C b 3 ) 2 / c 3
The results of the coefficients in Equation (7) are listed in Table 2.

3.3. Model Equation for SOC Estimation

By discretizing both the Equation (1) and Equation (2), the state space equation of the battery ECM is obtained as follows:
{ ( U p 1 , k + 1 U p 2 , k + 1 S O C k + 1 ) = ( e T / τ 1 0 0 0 e T / τ 2 0 0 0 1 ) ( U p 1 , k U p 2 , k S O C k ) + ( R p 1 ( 1 e T / τ 1 ) R p 2 ( 1 e T / τ 2 ) η i T C a ) I L , k + ( v 1 , k v 2 , k v 3 , k ) [ U L , k ] = [ 1 1 0 ] ( U p 1 , k U p 2 , k S O C k ) + [ R 0 ] I L , k + [ U O C V ] + [ w k ]
where T is the sample time; τ1 and τ2 are the time constants of the two RC networks, respectively; v1,k, v2,k and v3,k are the process noise; wk is the observation noise.
Since the parameters listed in Table 1 are changed at each 5% SOC, in order to make the model more accurate, all parameters will change with SOC. For parameters R0, Rp1, Cp1, Rp2, and Cp2, the interpolation method is used to obtain the corresponding values between adjacent SOCs. On the other hand, the function UOCV = f(SOC) is described by the Gaussian function trinomial as shown in Equation (7).

4. Experiments

4.1. Battery Test Bench

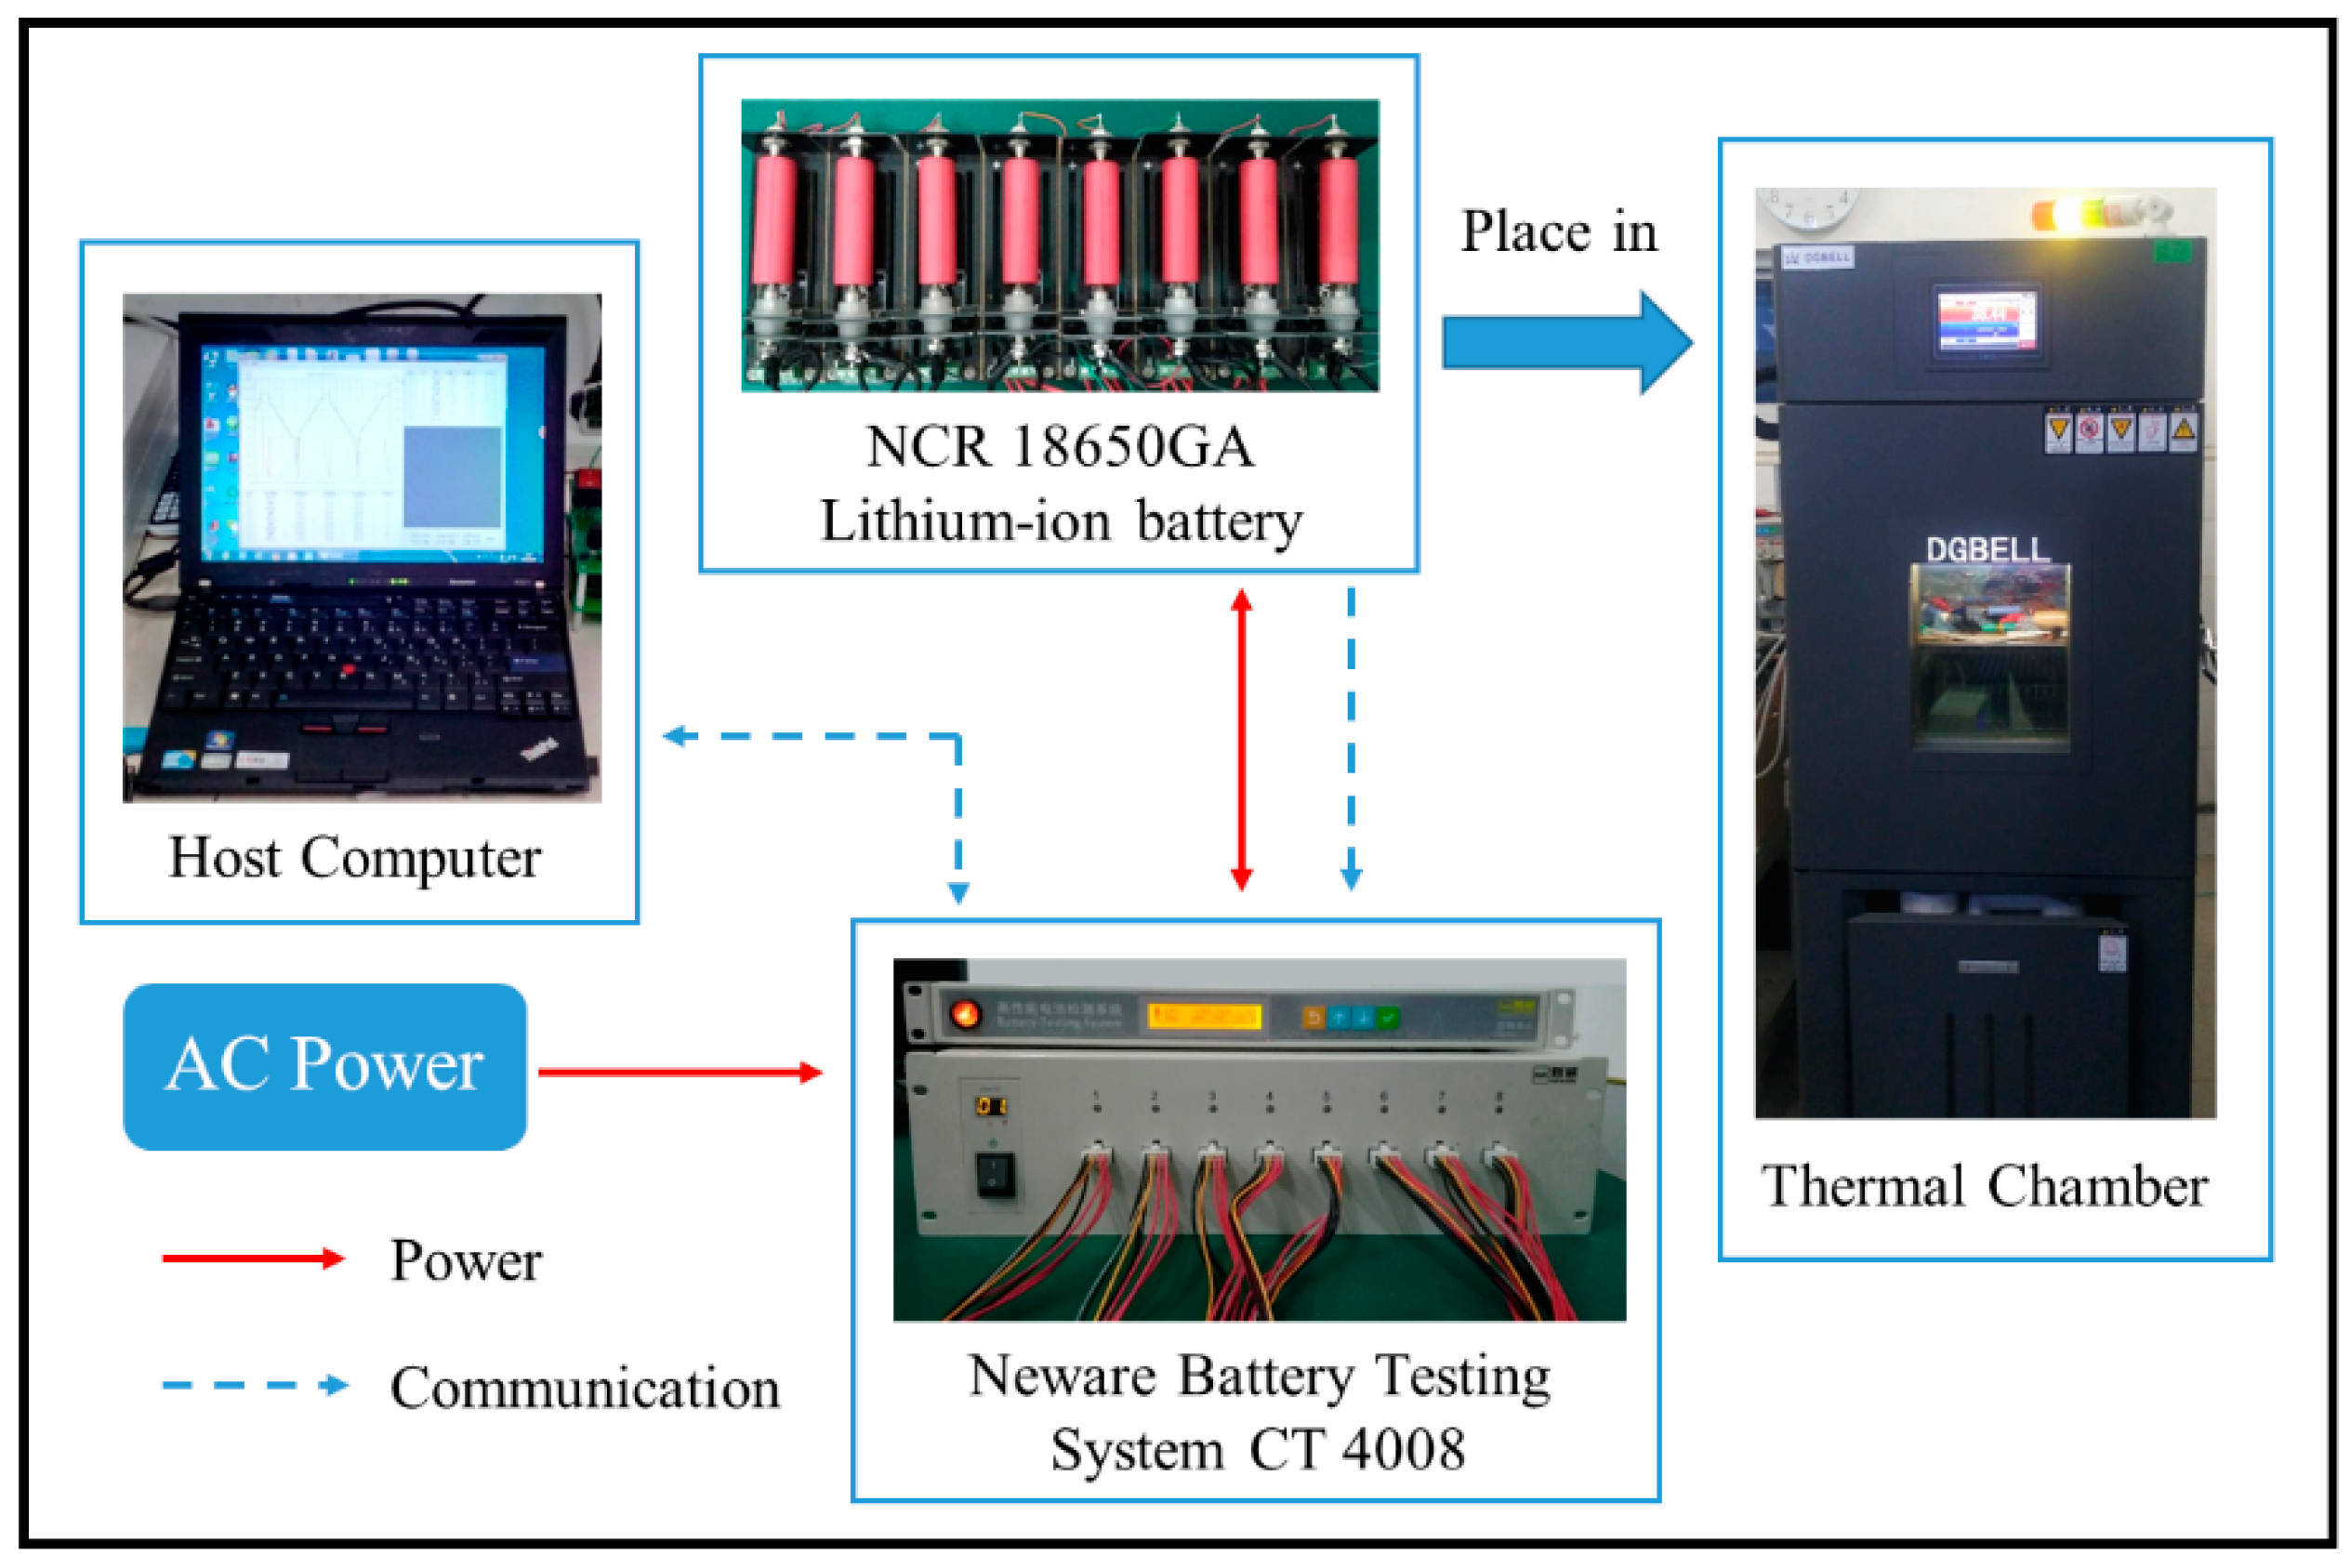
This study selected as test object a ternary polymer battery, which has gradually become the mainstream type of power batteries for EVs due to its high voltage platform and high energy. The key specifications of the tested cells are shown in Table 3. The test bench is shown in Figure 5, which consists of a Neware battery test system, a host computer with the battery testing software installed, and a thermal chamber with test batteries in it. The current detection accuracy and voltage detection accuracy of the facility are both ±0.05%, the maximum current rise time is 1ms, and the minimum data record interval is 100ms. All tests were performed in the laboratory and batteries were kept in the thermal chamber where the temperature was controlled at 25 °C (±1 °C).

4.2. Experiment Projects

There are two main types of experiments in this paper: one for parameter identification and the other for verification.

4.2.1. Experiments for Parameter Identification

To measure the OCV and identify the model parameter of battery, a constant current intermittent charge/discharge (CCIC/CCID) test was conducted. Before the test, the battery was fully charged by constant current and constant voltage (CCCV) charging method with a current rate of 0.5C, until the current reduced to 0.01C rate. As shown in Figure 2a, the battery was discharged at a constant current for 5% of rated capacity and then rested for 30 min. This process was repeated until the voltage drops to 2.5 V. After a 4 hours rest, the constant current intermittent charge test was added, the current and voltage curve of CCIC test is shown in Figure 2b. It was performed in a manner similar to the CCID test until the voltage reached 4.2 V, and then it was transferred to the constant voltage charge.

4.2.2. Experiments for Verification

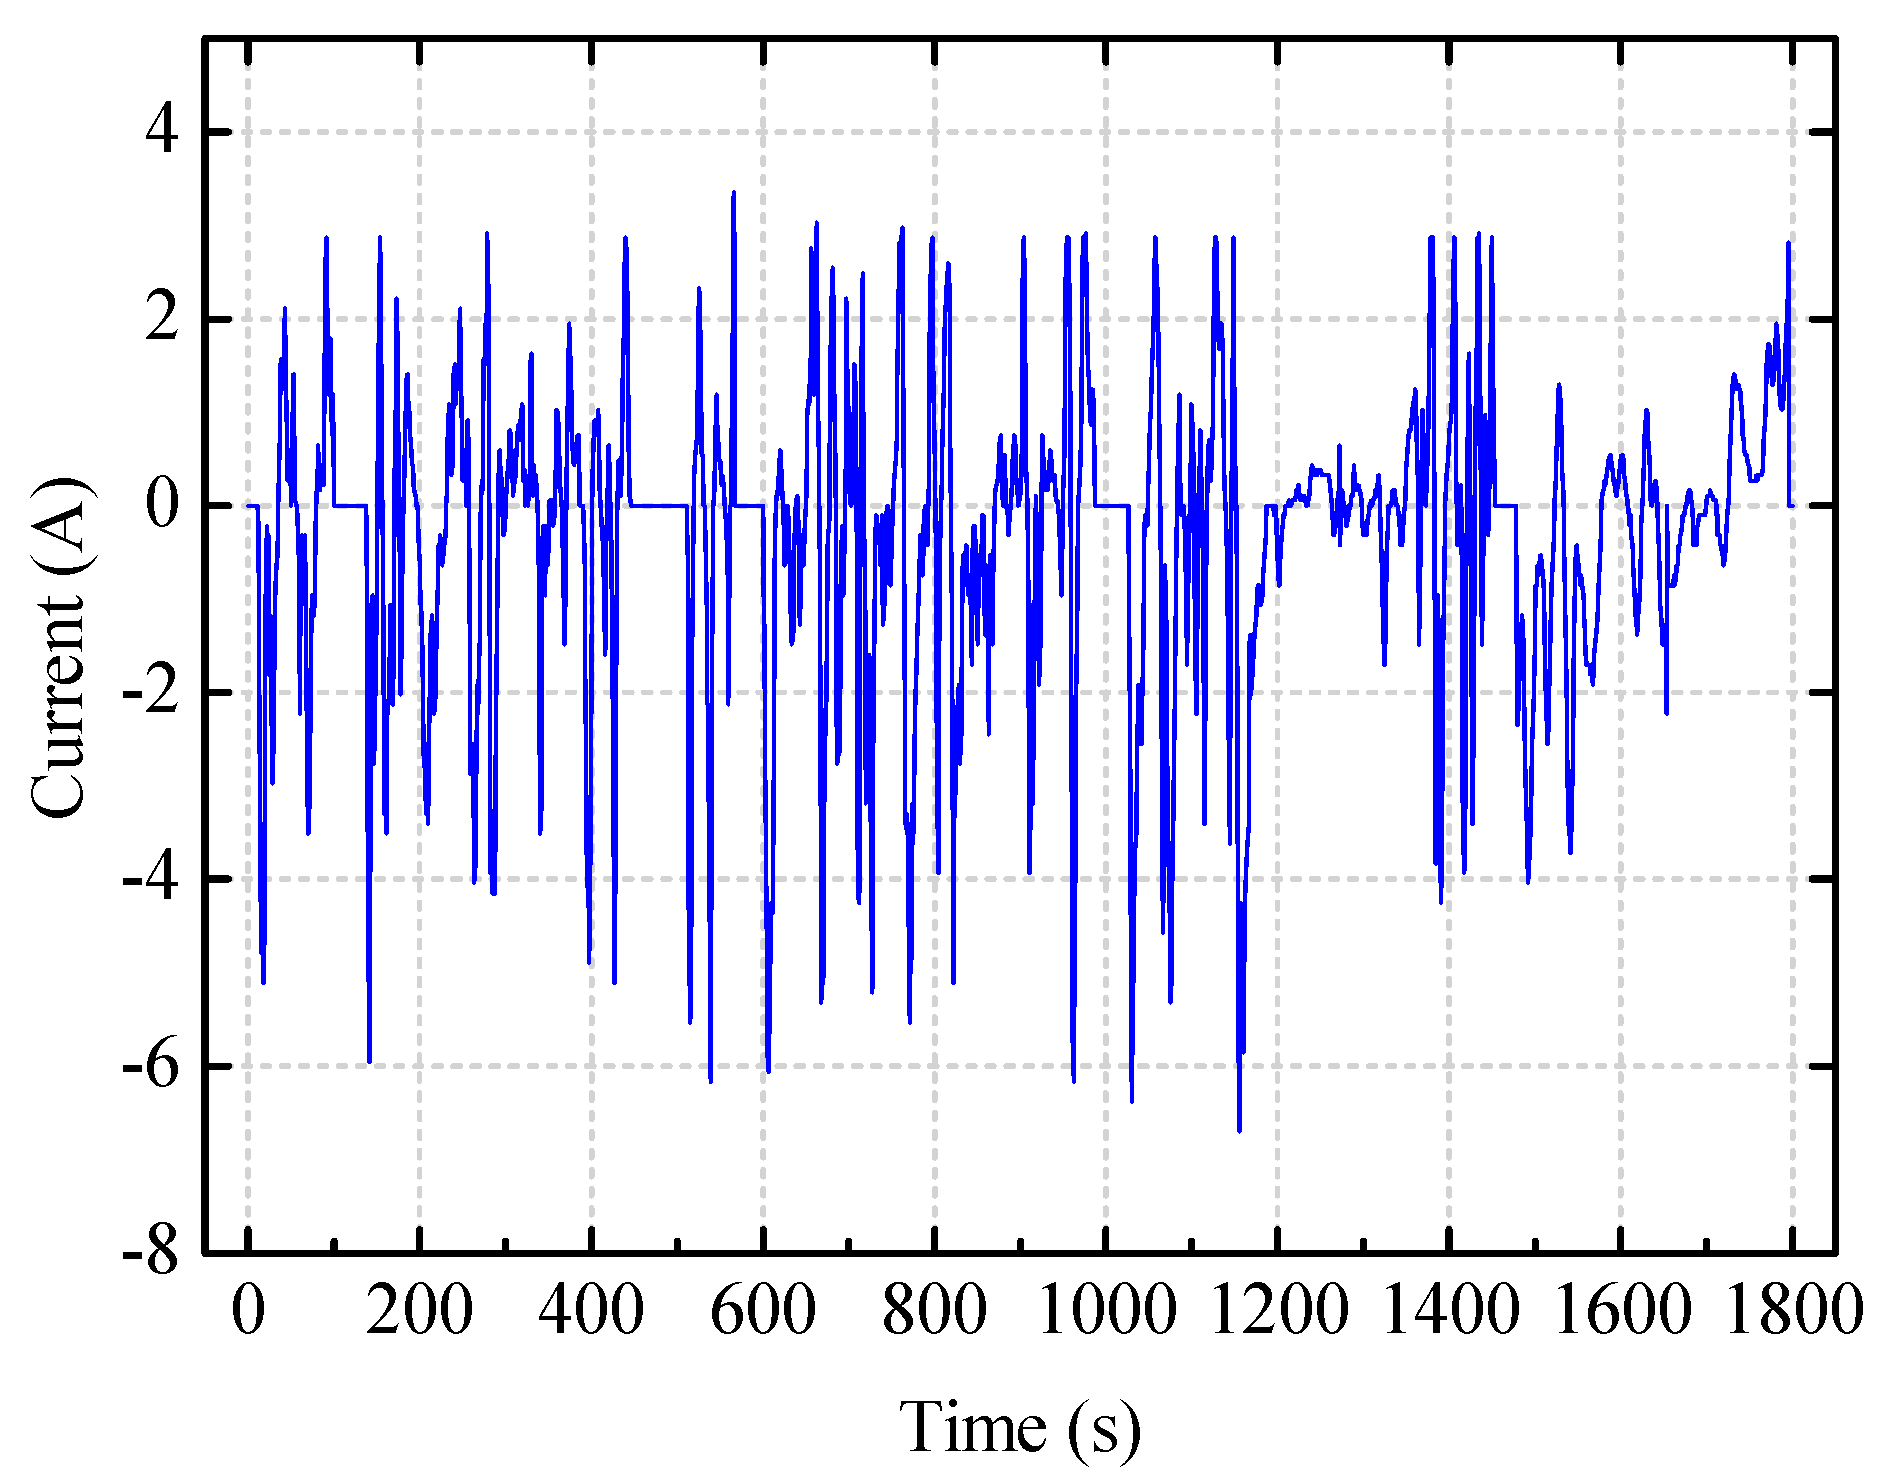
In order to verify the applicability of the proposed model equation, the Worldwide harmonized Light Vehicles Test Cycle (WLTC) is conducted on the lithium-ion cell. The WLTC is a part of the Worldwide harmonized Light vehicles Test Procedures (WLTP) that has been introduced to replace the New European Driving Cycle (NEDC), with the transition from NEDC to WLTP occurring over 2017–2019. Compared with NEDC, the WLTC is more dynamic, and covers a wider range of vehicle categories, road types and driving conditions [43]. The WLTC has three different driving cycles. In this study, the WLTC class 3 is used for test, which is the most comprehensive of the three classes. It includes four phases from low speed phase to extra-high speed phase. The current profile of WLTC class 3 is shown in Figure 6. Since the WLTC test include some short-term charging process, it was started from 90% SOC to avoid the terminal voltage exceeding the upper cutoff voltage and causing damage to the batteries.

5. Results and Discussion

5.1. Accuracy Verification for Model Equations

Building an accuracy and effective model equation is the key factor to obtain highly credible SOC estimation results. In this work, the WLTC test is used to verify the accuracy of the model equations, and the accuracy is evaluated by the maximum absolute error (max AE), the mean absolute error (MAE) and the root mean square error (RMSE).
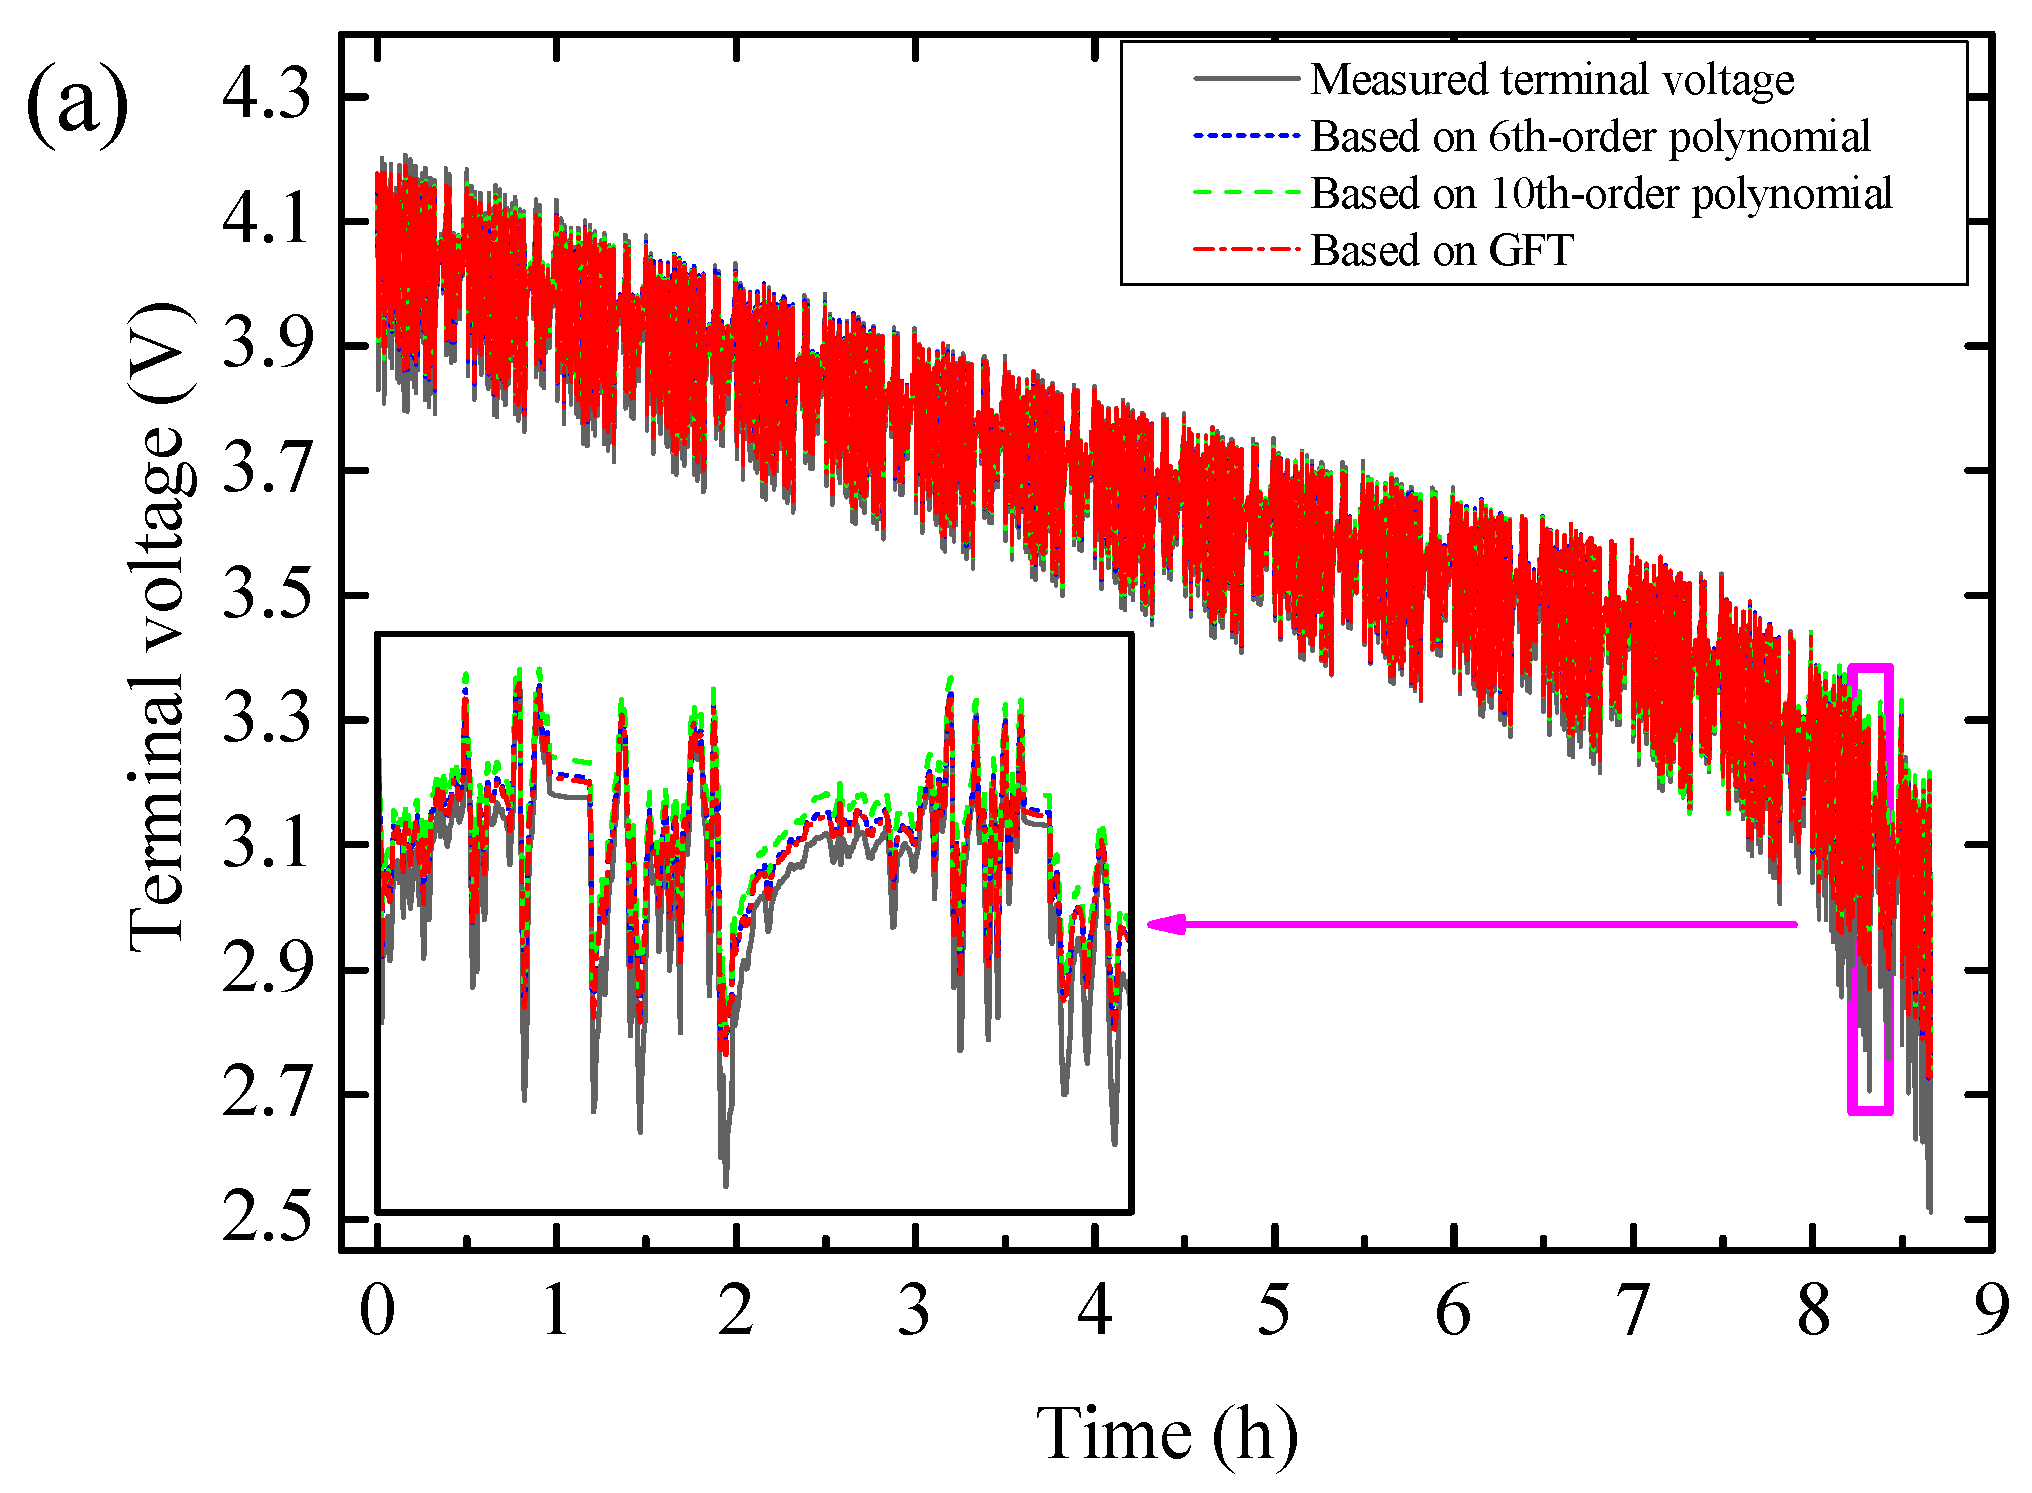
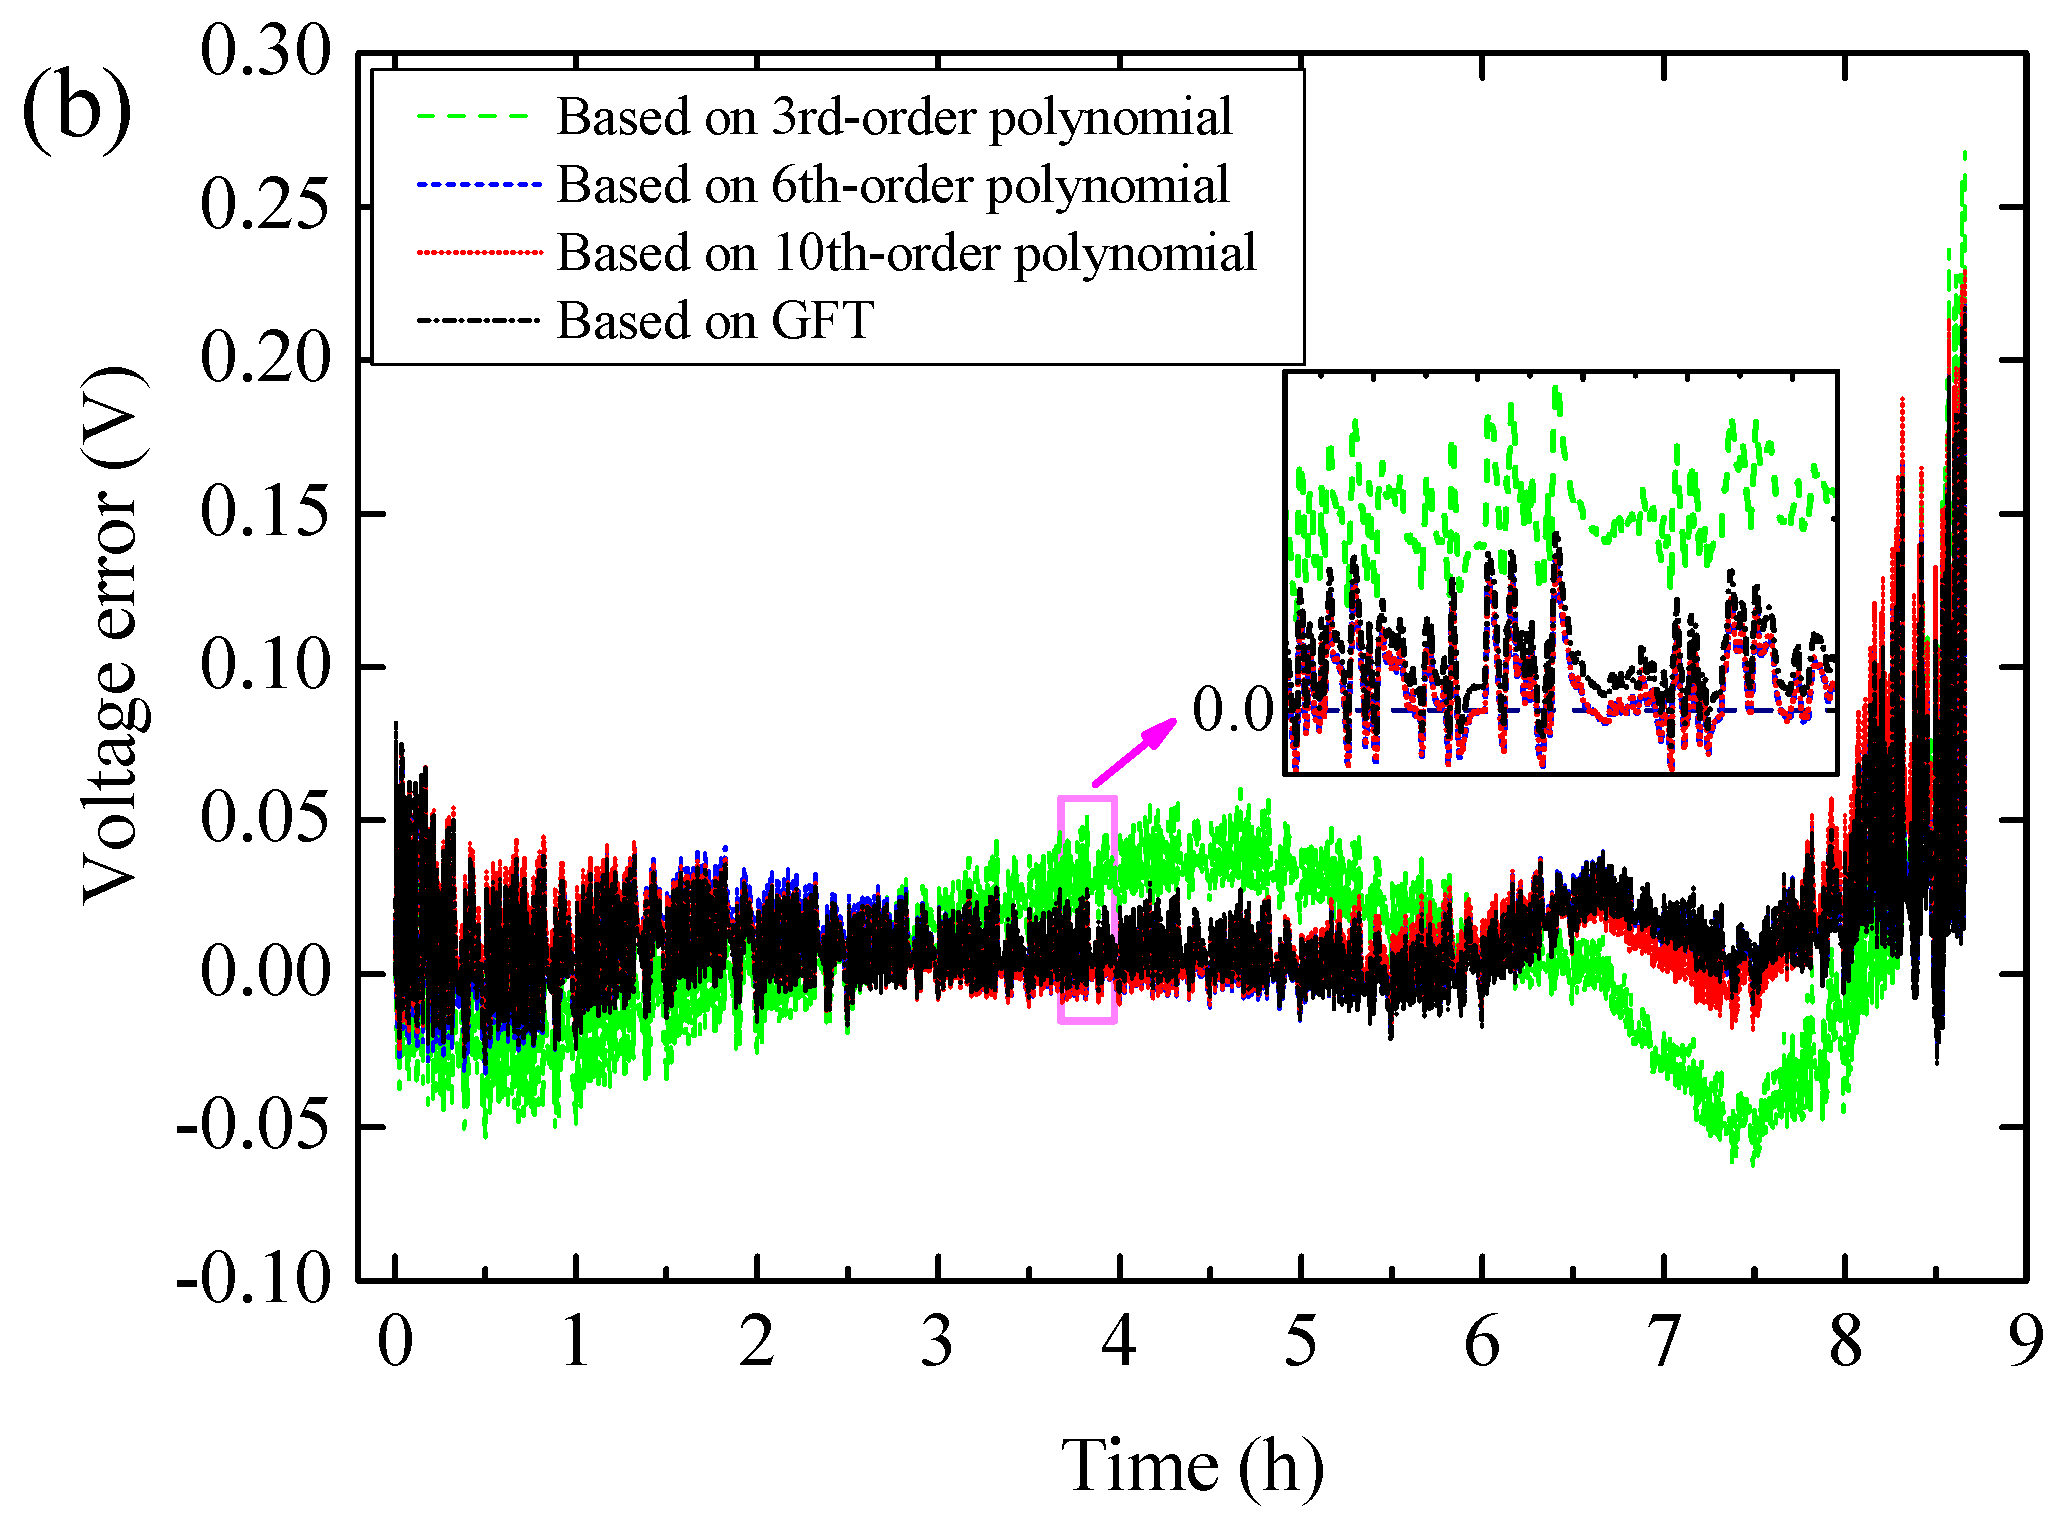
Figure 7a shows the curves of terminal voltage simulated by model equations based on three different power function polynomials with different orders in WLTC test. (Since the curves more than four will reduce the readability of the graph, the curve of equation based on 3rd-order polynomial is omitted here, but the error curve of it will be shown in Figure 7b). In general, the curves of the three model equation are close to the measured one. A larger deviation occurs only when the SOC drops below 15%. The voltage estimation error curves of model equations based on power function polynomials with different orders in WLTC test are shown in Figure 7b. As it shows, the error of model equation based on 3rd-order polynomial is significantly larger than that of other model equations. The error curves of the other three model equations are very close.
To make a more comprehensive analysis, Table 4 lists the detailed error data. From it we can see that the error of model equation based on 6th-order polynomial is smaller than that of model equation based on 3rd-order polynomial or 10th-order polynomial. The results indicate that low-order polynomials perform poorly, and so do higher-order polynomials. On the other hand, the max AE, the error of the GFT-based model equation is smaller than that of any model equations based on the power function polynomial.

5.2. Accuracy Verification for SOC Estimation

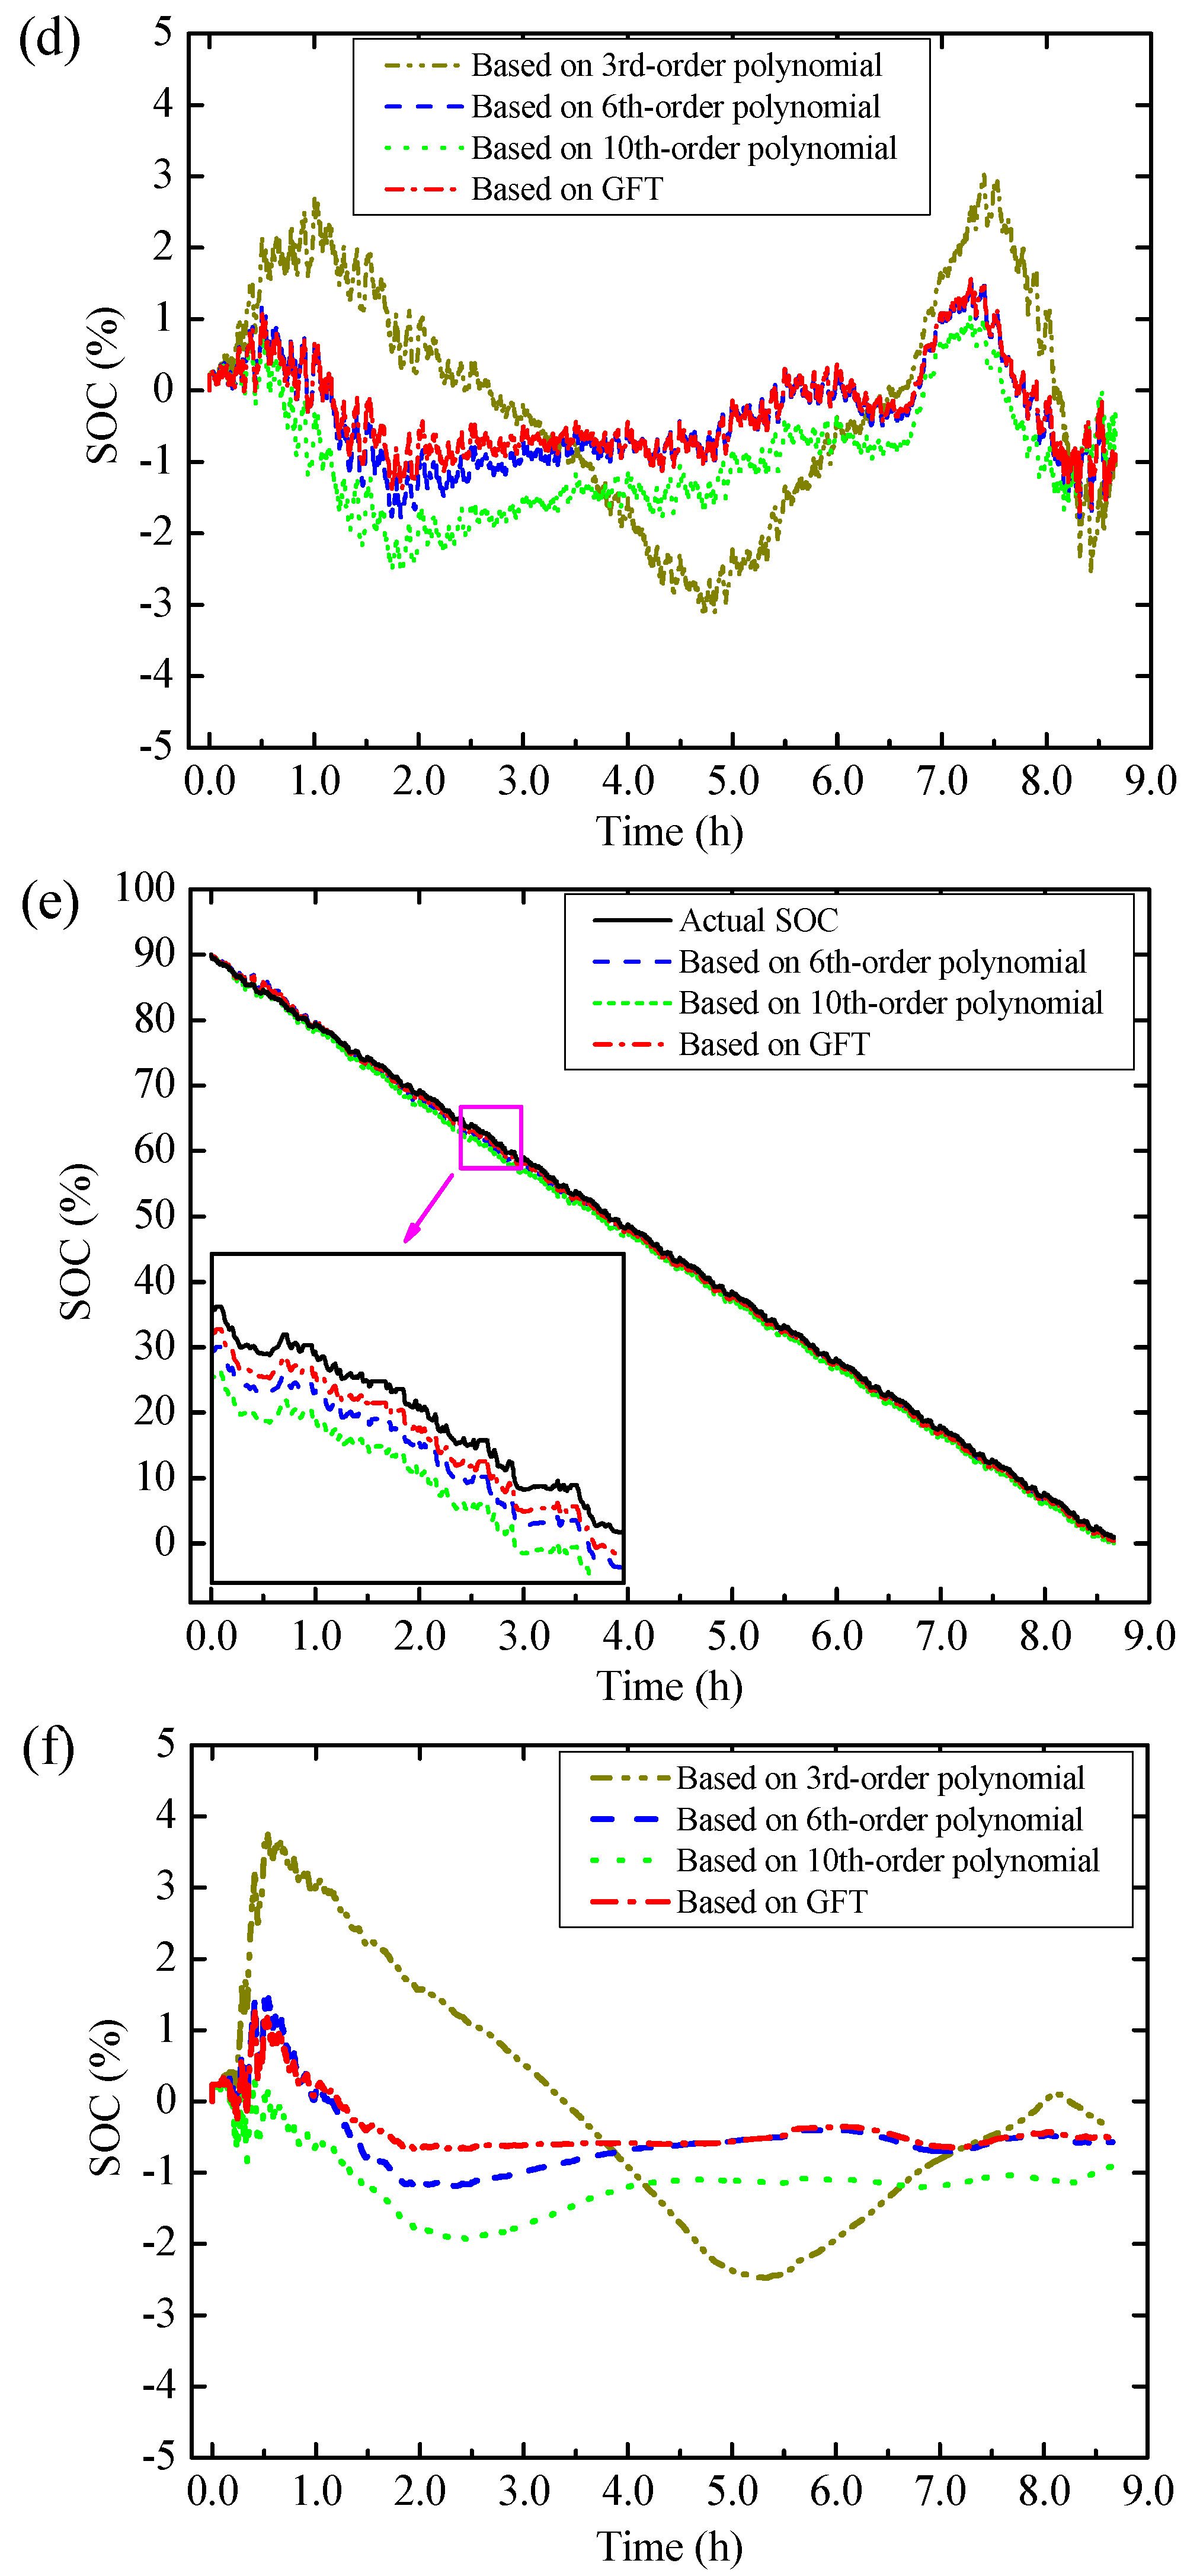
In this section, the performance of model equations in SOC estimation are verified by applying them to EKF, CKF and ACKF, respectively. The initial SOC value for estimators is accurate. The results of different estimators based on different model equations are shown in Figure 8.
Figure 8a,c,e show the SOC curves of EKF, CKF and ACKF, respectively. It can be seen that, compared with other model equations, the SOC curves of the model equation based on GFT is closer to the measured one. The error curves of different filtering algorithms are shown in Figure 8b,d,f, respectively. From them we can see that the estimation error of SOC based on GFT model equation is obviously smaller than that of other model equations. In addition, as the algorithms become more advanced, the errors become smaller.
Error analysis of SOC estimation results are listed in Table 5. It shows that whether applied to EKF, CKF or ACKF, the error of model equation based on 6th-order polynomial is smaller than that of model equations based on 3rd-order polynomial or 10th-order polynomial. In general, the estimation error of SOC becomes smaller as the algorithm becomes more advanced. However, when the model equation based on 3rd-order polynomial is applied to ACKF, the accuracy of SOC estimation is lower than that when applied to CKF. These results indicate that improper selection of polynomial order has a great impact on the SOC estimation results, and may even offset the benefits of improvement in the algorithm.
On the other hand, as can be seen from Table 5, no matter which algorithm the model equation based on GFT is applied to, the resulting estimation error is the smallest. The GFT-based model equation has a great contribution to the improvement of SOC estimation accuracy. When the algorithm is improved from EKF to CKF, the RMSE of the model equation based on the 6th-order polynomial is reduced by 0.086%; from CKF to ACKF, the RMSE of it is reduced by 0.074%. However, after changing the model equation based on the power function polynomial to the model equation based on GFT, the accuracy of SOC estimation can be greatly improved even in the same algorithm. Compared with the model equation based on the 6th-order polynomial, the GFT-based model equation can reduce the RMSE by 0.181% in the EKF algorithm. Similarly, in CKF and ACKF, the RMSE can be reduced by 0.106% and 0.183%, respectively. These increase in accuracy are even greater than those brought by the improvements on the algorithm. In terms of max AE, the advantages of the GFT-based model equation are more pronounced. By applying to ACKF, the max AE of it is 0.263% smaller than that of model equation based on the 6th-order polynomial.
Actually, the GFT-based model equation not only reduces the estimation error of SOC, but also has an advantage in computational efficiency. Table 6 shows the comparison of average run time for SOC estimation. It can be seen that from EKF to ACKF, every upgrade of the algorithm is accompanied by an increase in computational complexity. However, in different filtering algorithms, the GFT consumes less computing time than the 6th-order polynomial. It indicates that the GFT-based model equation not only reduces the estimation error of SOC, but also reduces the computation.

6. Conclusions

In this paper, a new model equation based on a Gaussian function has been proposed to improve the accuracy of terminal voltage prediction and SOC estimation of lithium-ion battery. By conducting the WLTC test and applying it to different filtering algorithms, the performance of the GFT-based model equation was verified. The results indicated that without improving the filtering algorithm, the GFT-based model equation can reduce the RMSE of the SOC estimation by 0.106% to 1.162%. This progress is even greater than that brought by the improvement of the algorithm. Moreover, unlike the improvement of the algorithm, the proposed model equation does not increase the computational burden. Compared with the most excellent polynomials based on power functions, it has more advantages in computational efficiency. Besides, by studying the model equations based on power function polynomial, we found that the accuracy of SOC estimation does not necessarily increase as the polynomial order of the model equation increases. In contrast, the 6th-order power function polynomial has better performance in SOC estimation than polynomials with other orders. For practical applications, complex calculation often results in an increase in hardware costs. In other words, using complex calculation is not necessarily the best option, especially when it does not lead to improvements in performance. The GFT-based model equation proposed in this paper ensures the estimation accuracy while reducing the computational burden, and thus can be easily applied to new BMS with online SOC estimation. In future work, the proposed GFT-based model equation can be applied to more advanced algorithms to achieve better performance in SOC estimation.

Author Contributions

Conceptualization, J.L. and L.K.; Data curation, M.L.; Formal analysis, L.K. and M.L.; Investigation, J.L., M.L. and Z.W.; Methodology, J.L.; Project administration, L.K.; Resources, L.K.; Software, L.K. and B.H.; Validation, J.L., B.H. and Z.W.; Writing—original draft, J.L.; Writing—review & editing, L.K. and M.L.

Funding

This research was funded by Science and Technology Development Special Foundation of Guangdong, China, grant number 2017B010120001.

Acknowledgments

I would like to express my sincere gratitude to my supervisor, Longyun Kang, who has given me a lot of effective during the experiments and the paper-writing. I would also like to than the anonymous reviewers for dedicating the time to review my paper despite their busy schedules.

Conflicts of Interest

The authors declare no conflict of interest.

References

  1. Shaukat, N.; Khan, B.; Ali, S.M.; Mehmood, C.A.; Khan, J.; Farid, U.; Majid, M.; Anwar, S.M.; Jawad, M.; Ullah, Z. A survey on electric vehicle transportation within smart grid system. Renew. Sustain. Energy Rev. 2018, 81, 1329–1349. [Google Scholar] [CrossRef]
  2. Xiong, R.; Cao, J.; Yu, Q.; He, H.; Sun, F. Critical Review on the Battery State of Charge Estimation Methods for Electric Vehicles. IEEE Access 2018, 6, 1832–1843. [Google Scholar] [CrossRef]
  3. Hannan, M.A.; Lipu, M.S.H.; Hussain, A.; Mohamed, A. A review of lithium-ion battery state of charge estimation and management system in electric vehicle applications: Challenges and recommendations. Renew. Sustain. Energy Rev. 2017, 78, 834–854. [Google Scholar] [CrossRef]
  4. Li, Z.; Huang, J.; Liaw, B.Y.; Zhang, J. On state-of-charge determination for lithium-ion batteries. J. Power Sources 2017, 348, 281–301. [Google Scholar] [CrossRef]
  5. Hu, X.; Li, S.; Peng, H. A comparative study of equivalent circuit models for Li-ion batteries. J. Power Sources 2012, 198, 359–367. [Google Scholar] [CrossRef]
  6. Schmidt, A.P.; Bitzer, M.; Imre, Á.W.; Guzzella, L. Experiment-driven electrochemical modeling and systematic parameterization for a lithium-ion battery cell. J. Power Sources 2010, 195, 5071–5080. [Google Scholar] [CrossRef]
  7. Smith, K.A.; Rahn, C.D.; Wang, C.Y. Model-Based Electrochemical Estimation and Constraint Management for Pulse Operation of Lithium Ion Batteries. IEEE Trans. Control Syst. Technol. 2010, 18, 654–663. [Google Scholar] [CrossRef] [Green Version]
  8. He, H.; Xiong, R.; Guo, H.; Li, S. Comparison study on the battery models used for the energy management of batteries in electric vehicles. Energy Convers. Manag. 2012, 64, 113–121. [Google Scholar] [CrossRef]
  9. Jiang, J.; Zhang, C. Fundamentals and Applications of Lithium-Ion Batteries in Electric Drive Vehicles; John Wiley: Singapore, 2015. [Google Scholar]
  10. Zhang, C.; Allafi, W.; Dinh, Q.; Ascencio, P.; Marco, J. Online estimation of battery equivalent circuit model parameters and state of charge using decoupled least squares technique. Energy 2018, 142, 678–688. [Google Scholar] [CrossRef]
  11. He, H.; Zhang, X.; Xiong, R.; Xu, Y.; Guo, H. Online model-based estimation of state-of-charge and open-circuit voltage of lithium-ion batteries in electric vehicles. Energy 2012, 39, 310–318. [Google Scholar] [CrossRef]
  12. Pan, H.; Lü, Z.; Lin, W.; Li, J.; Chen, L. State of charge estimation of lithium-ion batteries using a grey extended Kalman filter and a novel open-circuit voltage model. Energy 2017, 138, 764–775. [Google Scholar] [CrossRef]
  13. Zheng, F.; Xing, Y.; Jiang, J.; Sun, B.; Kim, J.; Pecht, M. Influence of different open circuit voltage tests on state of charge online estimation for lithium-ion batteries. Appl. Energy 2016, 183, 513–525. [Google Scholar] [CrossRef]
  14. Guo, X.; Kang, L.; Yao, Y.; Huang, Z.; Li, W. Joint Estimation of the Electric Vehicle Power Battery State of Charge Based on the Least Squares Method and the Kalman Filter Algorithm. Energies 2016, 9, 100. [Google Scholar] [CrossRef]
  15. Yang, J.; Bing, X.; Shang, Y.; Huang, W.; Mi, C.C. Adaptive State-of-charge Estimation Based on a Split Battery Model for Electric Vehicle Applications. IEEE Trans. Veh. Technol. 2017, 66, 10889–10898. [Google Scholar] [CrossRef]
  16. Lin, C.; Hao, M.; Xiong, R.; Shen, W. A novel multi-model probability battery state of charge estimation approach for electric vehicles using H-infinity algorithm. Appl. Energy 2016, 166, 76–83. [Google Scholar] [CrossRef]
  17. Wei, J.; Dong, G.; Chen, Z. On-board adaptive model for state of charge estimation of lithium-ion batteries based on Kalman filter with proportional integral-based error adjustment. J. Power Sources 2017, 365, 308–319. [Google Scholar] [CrossRef]
  18. Chen, Z.; Fu, Y.; Mi, C.C. State of Charge Estimation of Lithium-Ion Batteries in Electric Drive Vehicles Using Extended Kalman Filtering. IEEE Trans. Veh. Technol. 2013, 62, 1020–1030. [Google Scholar] [CrossRef]
  19. Li, D.; Ouyang, J.; Li, H.; Wan, J. State of charge estimation for LiMn 2 O 4 power battery based on strong tracking sigma point Kalman filter. J. Power Sources 2015, 279, 439–449. [Google Scholar] [CrossRef]
  20. Li, W.; Liang, L.; Liu, W.; Wu, X. State of Charge Estimation of Lithium-Ion Batteries Using a Discrete-Time Nonlinear Observer. IEEE Trans. Ind. Electron. 2017, 64, 8557–8565. [Google Scholar] [CrossRef]
  21. Tian, Y.; Li, D.; Tian, J.; Xia, B. State of charge estimation of lithium-ion batteries using an optimal adaptive gain nonlinear observer. Electrochim. Acta 2017, 225, 225–234. [Google Scholar] [CrossRef]
  22. Xia, B.; Sun, Z.; Zhang, R.; Lao, Z.; Xia, B.; Sun, Z.; Zhang, R.; Lao, Z. A cubature particle filter algorithm to estimate the state of the charge of lithium-ion batteries based on a second-order equivalent circuit model. Energies 2017, 10, 457. [Google Scholar] [CrossRef]
  23. Xiong, R.; He, H.; Sun, F.; Zhao, K. Evaluation on State of Charge Estimation of Batteries with Adaptive Extended Kalman Filter by Experiment Approach. IEEE Trans. Veh. Technol. 2013, 62, 108–117. [Google Scholar] [CrossRef]
  24. Wang, Y.; Liu, C.; Pan, R.; Chen, Z. Modeling and state-of-charge prediction of lithium-ion battery and ultracapacitor hybrids with a co-estimator. Energy 2017, 121, 739–750. [Google Scholar] [CrossRef]
  25. Sun, F.; Rui, X.; He, H. Estimation of state-of-charge and state-of-power capability of lithium-ion battery considering varying health conditions. J. Power Sources 2014, 259, 166–176. [Google Scholar] [CrossRef]
  26. Wang, Q.; Wang, J.; Zhao, P.; Kang, J.; Yan, F.; Du, C. Correlation between the model accuracy and model-based SOC estimation. Electrochim. Acta 2017, 228, 146–159. [Google Scholar] [CrossRef]
  27. Mejdoubi, A.E.; Oukaour, A.; Chaoui, H.; Gualous, H.; Sabor, J.; Slamani, Y. State-of-Charge and State-of-Health Lithium-Ion Batteries’ Diagnosis According to Surface Temperature Variation. IEEE Trans. Ind. Electron. 2016, 63, 2391–2402. [Google Scholar] [CrossRef]
  28. Wu, W.; Yang, X.; Zhang, G.; Chen, K.; Wang, S. Experimental investigation on the thermal performance of heat pipe-assisted phase change material based battery thermal management system. Energy Convers. Manag. 2017, 138, 486–492. [Google Scholar] [CrossRef]
  29. Zhang, W.; Shi, W.; Ma, Z. Adaptive unscented Kalman filter based state of energy and power capability estimation approach for lithium-ion battery. J. Power Sources 2015, 289, 50–62. [Google Scholar] [CrossRef]
  30. Wang, Y.; Zhang, C.; Chen, Z. An adaptive remaining energy prediction approach for lithium-ion batteries in electric vehicles. J. Power Sources 2016, 305, 80–88. [Google Scholar] [CrossRef]
  31. Dong, G.; Chen, Z.; Wei, J.; Zhang, C.; Wang, P. An online model-based method for state of energy estimation of lithium-ion batteries using dual filters. J. Power Sources 2016, 301, 277–286. [Google Scholar] [CrossRef]
  32. Plett, G.L. Extended Kalman filtering for battery management systems of LiPB-based HEV battery packs: Part 1. Background. J. Power Sources 2004, 134, 277–292. [Google Scholar] [CrossRef]
  33. Plett, G.L. Extended Kalman filtering for battery management systems of LiPB-based HEV battery packs: Part 2. Modeling and identification. J. Power Sources 2004, 134, 262–276. [Google Scholar] [CrossRef]
  34. Plett, G.L. Extended Kalman filtering for battery management systems of LiPB-based HEV battery packs: Part 3. State and parameter estimation. J. Power Sources 2004, 134, 252–261. [Google Scholar] [CrossRef]
  35. Arasaratnam, I.; Haykin, S. Cubature Kalman Filters. IEEE Trans. Autom. Control 2009, 54, 1254–1269. [Google Scholar] [CrossRef] [Green Version]
  36. Xia, B.; Wang, H.; Tian, Y.; Wang, M.; Sun, W.; Xu, Z. State of Charge Estimation of Lithium-Ion Batteries Using an Adaptive Cubature Kalman Filter. Energies 2015, 8, 5916–5936. [Google Scholar] [CrossRef] [Green Version]
  37. Abu-Sharkh, S.; Doerffel, D. Rapid test and non-linear model characterisation of solid-state lithium-ion batteries. J. Power Sources 2004, 130, 266–274. [Google Scholar] [CrossRef]
  38. Gholizadeh, M.; Salmasi, F.R. Estimation of State of Charge, Unknown Nonlinearities, and State of Health of a Lithium-Ion Battery Based on a Comprehensive Unobservable Model. IEEE Trans. Ind. Electron. 2013, 61, 1335–1344. [Google Scholar] [CrossRef]
  39. Berrut, J.P.; Trefethen, L.N. Barycentric Lagrange interpolation. SIAM Rev. 2004, 46, 501–517. [Google Scholar] [CrossRef]
  40. Higham, N.J. The numerical stability of barycentric Lagrange interpolation. IMA J. Numer. Anal. 2004, 24, 547–556. [Google Scholar] [CrossRef] [Green Version]
  41. Sauer, T. Numerical Analysis: International Edition; Pearson Schweiz AG: Zug, Switzerland, 2011; pp. 510–512. [Google Scholar]
  42. Dereniak, E.L.; Kupinski, M.; Hagen, N. Gaussian profile estimation in one dimension. Appl. Opt. 2007, 46, 5374–5383. [Google Scholar]
  43. Ciuffo, B.; Marotta, A.; Tutuianu, M.; Anagnostopoulos, K.; Fontaras, G.; Pavlovic, J.; Serra, S.; Tsiakmakis, S.; Zacharof, N. The development of the World-wide Harmonized Test Procedure for Light Duty Vehicles (WLTP) and the pathway for its implementation into the EU legislation. Transp. Res. Rec. J. Transp. Res. Board 2015, 2503, 110–118. [Google Scholar] [CrossRef]
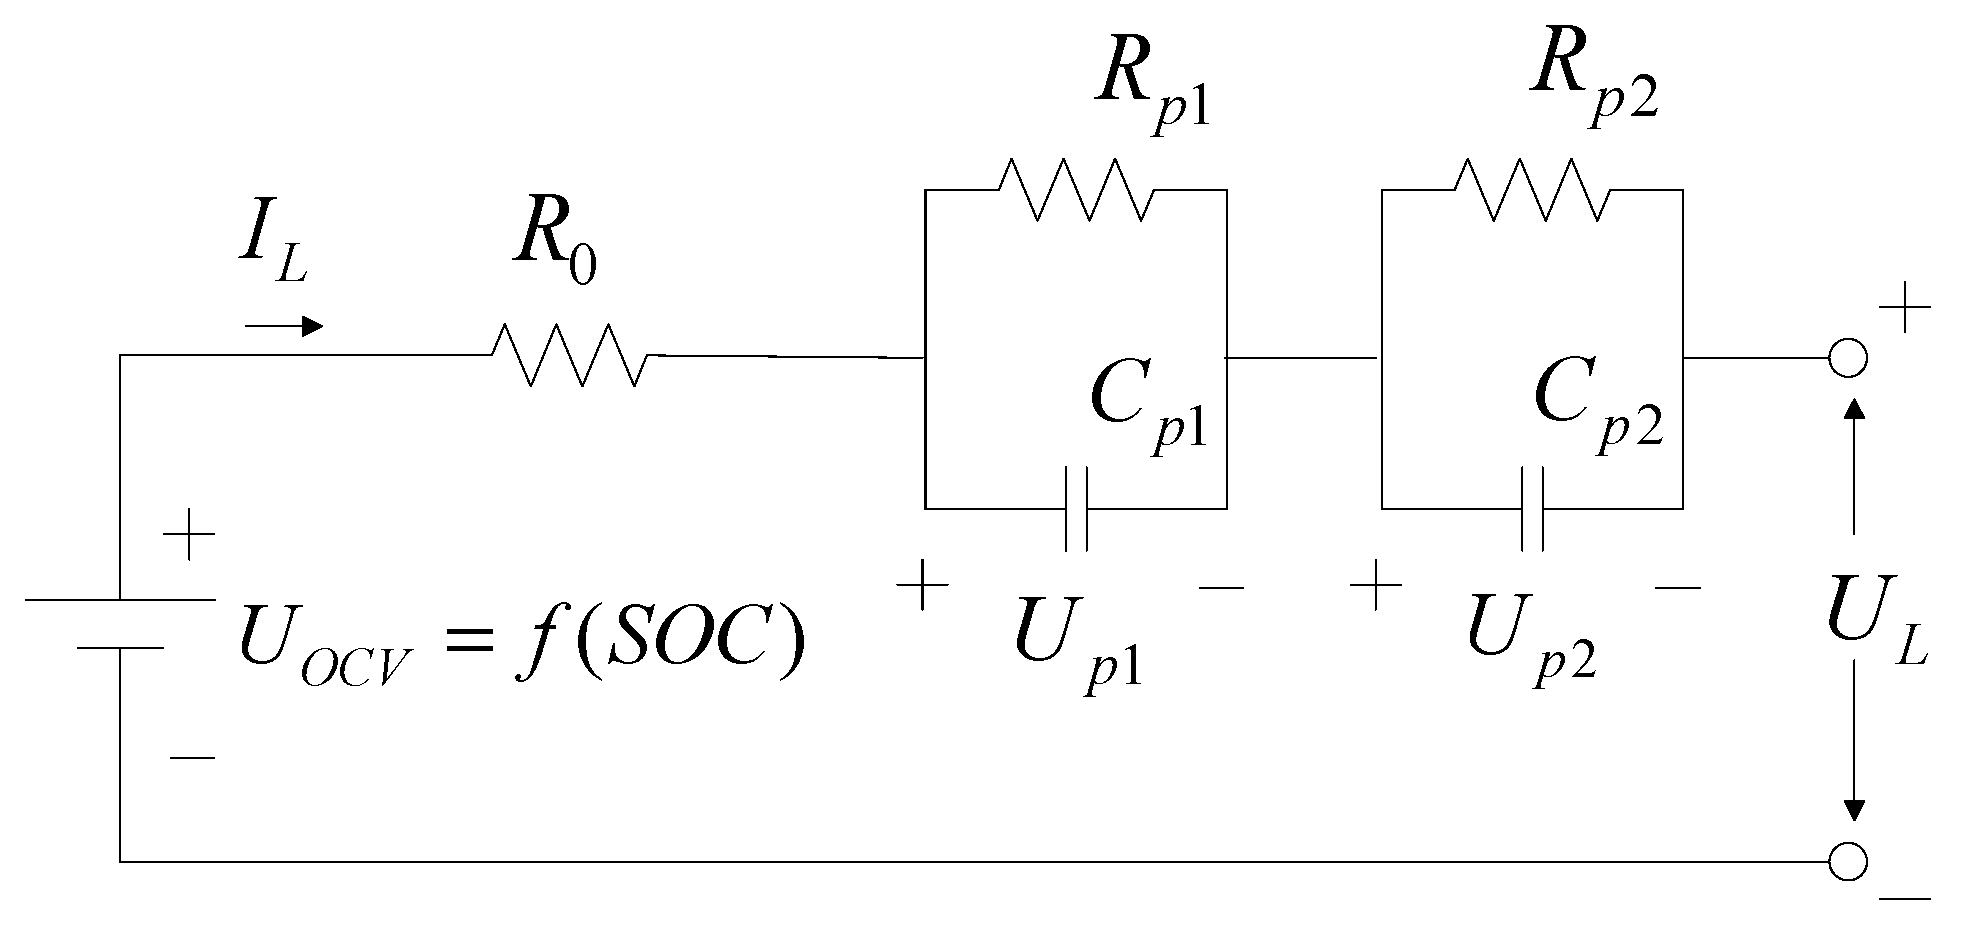
Figure 1. The dual polarization model of a lithium-ion battery.
Energies 12 01366 g001
Figure 2. The curves of current and voltage: (a) in the CCID test; (b) in the CCIC test.
Energies 12 01366 g002
Figure 3. The measured equilibrium potential at different SOCs during charging and discharging.
Energies 12 01366 g003
Figure 4. The comparison of OCV curves for different equations.
Energies 12 01366 g004
Figure 5. Schematic of the battery test bench.
Energies 12 01366 g005
Figure 6. The current profile in WLTC test.
Energies 12 01366 g006
Figure 7. The comparison of voltage prediction in the WLTC test: (a) curves of terminal voltage; (b) error curves.
Energies 12 01366 g007aEnergies 12 01366 g007b
Figure 8. The results of SOC estimators based on different model equations in the WLTC test: (a) SOC curves of the EKF; (b) error curves of the EKF; (c) SOC curves of the CKF; (d) error curves of the CKF; (e) SOC curves of the ACKF; (f) error curves of the ACKF.
Energies 12 01366 g008aEnergies 12 01366 g008b
Table 1. The parameter identification results.
SOC (%)OCV (V)R0 (mΩ)Rp1 (mΩ)Cp1 (kF)Rp2 (mΩ)Cp2 (kF)
1004.17938.2740.111.034.53406.1
95.084.11536.1222.432.243.76446.0
90.164.08734.0921.593.092.99523.1
85.254.06233.7420.493.625.32371.0
80.334.01732.4319.232.3210.36168.9
75.413.96532.2518.451.9112.66165.8
70.493.91132.3417.141.6511.32146.5
65.583.88332.2318.752.3610.60183.0
60.663.83831.8618.632.688.03481.0
55.743.78331.8620.042.574.54475.2
50.823.73631.8721.592.694.51439.7
45.913.69332.3223.053.105.26401.2
40.993.65732.6123.533.517.23299.0
36.073.62433.0722.644.139.26244.5
31.153.58933.4320.845.459.20201.8
26.243.54234.1717.624.4310.51400.3
21.323.49035.1921.442.328.90515.0
16.403.44236.3931.681.966.60407.1
11.483.37139.0735.351.7013.68279.5
6.563.26441.2945.491.0629.39168.1
02.99950.9964.740.5129.2074.8
Table 2. The coefficients for UOCV = f(SOC) based on a Gaussian function trinomial.
Coefficientabc
i = 14.1757116.9738108.2812
i = 21.234021.226548.8118
i = 30.68460.306425.8738
Table 3. The key specifications of the test cells.
Cell TypeRated CapacityNominal VoltageCharging/Discharging End VoltageMaximum Continuous Discharge Current
NCR18650GA3350 mAh 13.6 V4.2 V/2.5 V10 A
1 Measured by the discharge at 0.67 A until end voltage of 2.5 V after fully charged at 25 °C.
Table 4. Error analysis of terminal voltage predicted by different model equations.
Model FunctionMax AE (V)MAE (V)RMSE (V)
3rd-order polynomial0.2590.0230.029
6th-order polynomial0.2130.0130.019
10th-order polynomial0.2150.0130.020
GFT0.2110.0120.018
Table 5. Error analysis of SOC estimation results.
AlgorithmModel FunctionMax AE (%)MAE (%)RMSE (%)
EKF3rd-order polynomial3.8741.5811.862
6th-order polynomial1.9560.7310.881
10th-order polynomial2.7201.2961.459
GFT1.8260.6080.700
CKF3rd-order polynomial3.1171.3211.570
6th-order polynomial1.7860.6790.795
10th-order polynomial2.5631.0911.238
GFT1.6950.5900.689
ACKF3rd-order polynomial3.7461.3811.684
6th-order polynomial1.5180.6640.721
10th-order polynomial1.9341.1561.229
GFT1.2550.5130.538
Table 6. The comparison of runtimes for SOC estimation in WLTC.
Model EquationRuntime (s)
EKFCKFACKF
Based on 6th-polynomial22.1327.7030.02
Based on GFT21.9227.5229.84