Abstract
The growth of the scale of cities intensifies urban heat island (UHI) by obstructing the wind and building more radiation at pedestrian level, thus leading to an energy consumption. Commercial pedestrianized-zones cannot only become symbols of cities but also an important factor increasing local economic income. This study conducts on-site measurement and numerical simulation to evaluate the cooling energy efficiency of different parameters (building, vegetation, pavement material) in Fo Shan city, which locates in hot-summer and warm-winter climate region of China. Also, calculations are done to evaluate the index physiological equivalent temperature (PET) for understanding thermal sensation at a pedestrian level (1.5 m). To evaluate different impacts of this zone renewal on the environment and choose the most energy-saving method, it is easy for us to utilize the linear regression for understanding the relationship between coverage ratio of trees (TCR) and thermal comfort in canyon space, which shows that ∆PET = 0.1703 × TCR + 0.2444 with a most important R2 value of 0.9836, for TCR increases from 12.5% to 22%. In open space, also increasing coverage ratio of trees (TCR) can effectively improve humans’ thermal comfort, which shows that ∆PET = 0.2644 × TCR + 0.3955 with a most important R2 value of 0.8892.
1. Introduction
Increasing population density and fast urban growth have increased the vulnerability of different cities to the global climate change [1]. With the urban heat island effect (UHI) and high-density development of cities, increasing heat issues have triggered a series of health problems for humans; moreover, outdoor thermal discomfort and extreme heat are becoming more fatal to the elderly and the people with chronic disease [2]. Humans’ outdoor thermal comfort is mainly about thermo-physiology and outdoor heat energy balance [3]. In addition, heat stress may lead to the excessive energy consumption of buildings; in densely populated cities, particularly Asian cities, the energy cost of buildings is nearly 40% of the total energy cost. According to the national standard, the Thermal Design Code for Civil Building (GB50176-93), China consists of five different climate regions, including a temperate climate region, hot-summer and cold-winter climate region, cold climate region, hot-summer and warm-winter climate region, and severe cold climate region [4]. A previous study on the trends of energy consumption in a hot-summer and warm-winter climate region during summer showed that the energy cost of air conditioning constitutes 50% of buildings’ energy costs each year [3]. Because air-conditioned buildings in the built environment are also affected by outdoor microclimates, building a more efficient outdoor environment can effectively decrease indoor energy consumption. Urban pedestrianized zones are known for their convenience, vitality, and commercial value and are not only landmarks of cities or metropolises, but they can also increase local financial income. Unlike in urban canyon space, local design specifications ensure that the average building height does not exceed three stories in order to maintain the commercial value [5]. According to prior studies, humans’ thermal sensation in outdoor built blocks is affected by building density [6], street orientation and typology [7,8,9], urban greening planted in different canyons [10,11], and the thermal properties of pavement materials [12].
The outdoor environment is different from the indoor environment. Humans standing in the street will experience fluctuations in the outdoor stimuli due to two different forms of radiation, which influence thermal sensation directly. The first form is called short-wave radiation, which is emitted from the sun. The second form is long-wave radiation, which is emitted by the terrestrial surfaces that surround humans [13]. To the extent that human bodies come in direct contact with other surfaces, they will gain and lose heat by conduction. In addition, human bodies on urban streets dissipate heat through evaporation. Human energy balance can be expressed in terms of the rate at which energy is absorbed or emitted by a unit area of the surface of the human body and combined as a net exchange of solar radiation Rn between humans and the outdoor environment (Figure 1):
where Kdir means the direct short-wave radiation incident on humans, Kdif means the diffuse short-wave radiation incident on humans, Kh is the indirect radiation incident on humans reflected by horizontal surfaces, Kv is the indirect radiation incident on humans reflected by vertical surfaces, as is the albedo of human skin and clothes, (1 − as) is the ratio of the short-wave radiation that is absorbed by humans, Ld is the long-wave radiation incident on humans that is emitted downwards by the sky, Lh is the long-wave radiation incident on humans emitted by horizontal surfaces, Lv is the long-wave radiation incident on humans emitted by vertical surfaces, and Ls is the long-wave radiation emitted by humans into the outdoor environment.
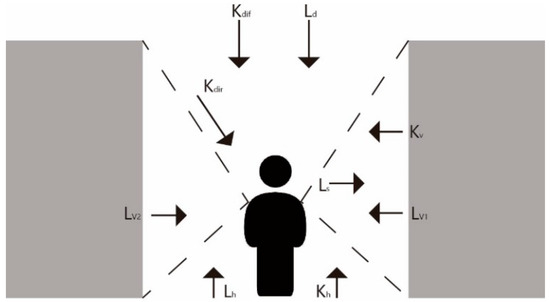
Figure 1.
Outdoor energy exchange between block and surrounding urban environments.
In fact, many previous studies have focused on reducing the demand for saving energy and enhancing human life [14,15,16]. The alteration of urban morphology is an effective method to attenuate solar radiation in the daytime. Increasing building height can decrease the sky view factor (SVF) and increase the aspect ratio (H/W). Several studies have shown that there is a strong correlation between humans’ thermal comfort and H/W; a street with a high H/W will produce a large shading region, which can mitigate heat stress effectively [7,9,17]. SVF is a number ranging from 0 to 1 that controls the incoming of solar radiation. Studies have investigated whether a street with a low SVF has a lower daytime air temperature [18,19]. In addition, a study on the effect of street canyons explained that street orientation has the largest influence on improving humans’ thermal comfort at a pedestrian level in southern China. Additionally, trees and other vegetation can provide shading for canyon space and reduce ambient air temperature [8]. Vegetation’s evaporation and transpiration can effectively alleviate heat stress. Previous studies have shown that the cooling effect of shading is better than evapotranspiration, thus contributing to energy saving [20,21]. A microclimatic study on the block scale showed that a 10% increase in the coverage ratio of green plants would produce a 0.8 °C cooling effect [22,23]. The modification of paving material is also another method to alleviate heat stress in extreme summer temperatures [24,25]. In order to obtain a deep understanding of humans’ thermal sensation in extreme summer temperatures, some thermal comfort indices have been proposed. These indices include the standard effective temperature (SET) [26], perceived temperature (PT) [27], outdoor standard effective temperature (OUT_SET) [28], physiological equivalent temperature (PET) [29], and universal thermal climate (UTCI) [30,31]. The PET index aims to simplify the outdoor microclimate as an index for a person, which depends on the Munich energy balance model of individuals (MEMI) [29,30,31,32]. This model is based on thermoregulatory processes, such as the constriction of peripheral blood vessels and physiological sweat rate. In addition, the model is based on the equation: M + W + R + C + ED + ERe + ESW + S = 0, where M represents the metabolic rate, W represents humans’ physical working output, R represents humans’ net radiation, C is the convective heat, ED is the imperceptible perspiration, ERe is the sum of the heat of inhaled air, ESW is the heat flow related to evaporation, and S is the storage of heat flow. So far, previous studies have generally performed on-site measurements and numerical simulations. The utilization of numerical simulations can overcome the limitations of on-site measurements and get a temporal scenario of the interest domain [33,34,35]. Taha used vegetation model software as a strategy to alleviate the UHI effect [36]. Dimoudi and Nikolopoulou used the computational fluid dynamics (CFD) modeling to test the cooling effect of various parameters [24]. Bruce and Fleer utilized a CFD model that simulates microclimates in summer, ENVI-met, to investigate impacts on mitigating the UHI effect [37]. ENVI-met 4.0 is a three-dimensional microclimate tool designed to simulate the relation between building surfaces, vegetation, and outdoor air with a resolution of 0.5–10 m in space and 10 s in time. The reason for choosing ENVI-met is that it is the most suitable model in terms of the calculation of outdoor thermal comfort. To date, there have been many studies conducted on the development of UHI effects on humans’ thermal comfort in urban spaces [15,38,39,40], but most of them discuss the individual parameters separately, lacking a comparative standard to assess the relative importance of different parameters in the urban built environment; moreover, no study has been conducted to analyze the commercial pedestrian block. In addition, many thermal studies on reducing the UHI effect have been conducted in the USA [41], Japan [42], Dubai [43], and Greece [44]. There have been few studies related to the hot-summer and warm-winter climate region in China. Therefore, the aim of this study is to perform on-site measurements and numerical simulations to calculate different urban design parameters’ efficiencies on a commercial pedestrian block. Regression analyses are conducted to consider the characteristics of each different parameter in this zone. The final findings of this research will provide a comparative assessment that considers the effect of multiple parameters on reducing PET and improving humans’ thermal comfort during business hours, thus helping local managers and policymakers to enhance outdoor energy efficiency and improve environmental sustainability. Moreover, this study will fill a gap in the literature on thermal studies of commercial pedestrianized zones.
2. Methods
2.1. Subsection
Fo Shan (23°02′ W, 113°06′ E), located in Guang Dong province (southern China) (Figure 2), is in a hot-summer and warm-winter climate region (Figure 3) [4].
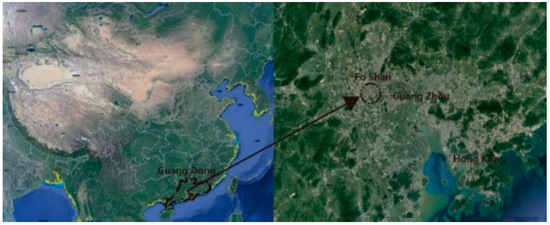
Figure 2.
Introduction to Fo Shan.
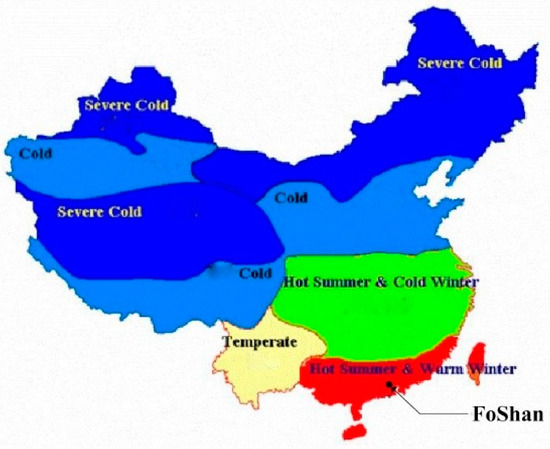
Figure 3.
The detailed climate region of Fo Shan.
Recently, according to data concerning the local weather of Fo Shan, the maximum air temperature in hot summer can reach 37 °C [45]. Figure 4 shows the daily maximum air temperature in July 2016.
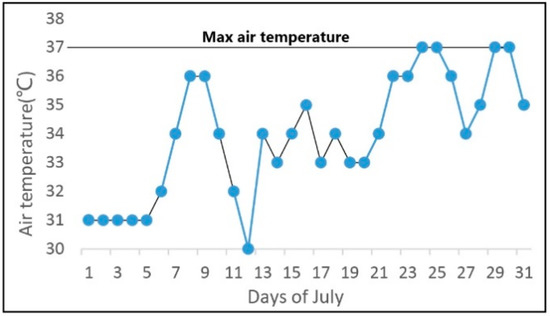
Figure 4.
Daily air temperature in July 2016.
Ling Nan Tian Di block is located in the center of Fo Shan city, which is a significant space for increasing local tourism. Despite the uncomfortable thermal conditions in extreme summer, visiting the pedestrianized zone in this season is still popular [46]. Figure 5 shows the location of this commercial region.
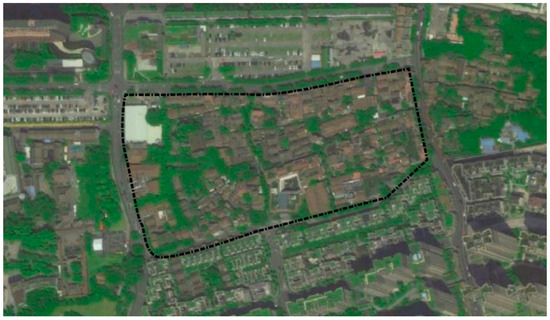
Figure 5.
The location of the Ling Nan Tian Di block.
According to the different spatial geometry of this region, the whole area is divided into seven parts. Figure 6 shows detailed information about the different selected points.
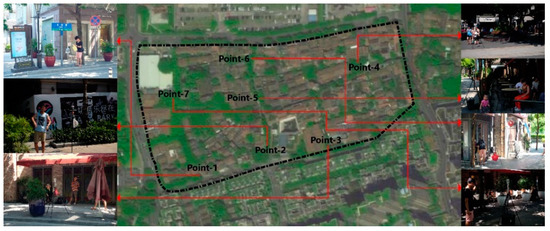
Figure 6.
The location of the different selected points.
In order to obtain an accurate understanding of the different spatial geometry of the chosen points, hemispherical photos of these selected points are captured by fisheye lens in Figure 7.
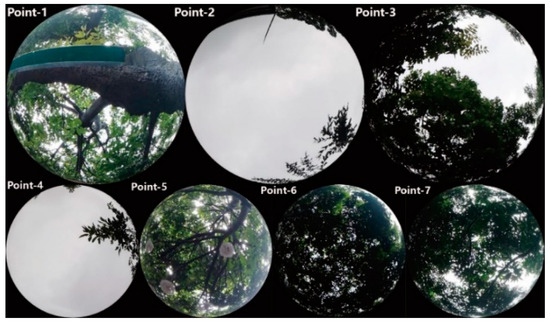
Figure 7.
Hemispherical photo of the selected points.
2.2. Methodological Framework
The methodological framework is displayed in Figure 8. The current study includes numerical simulations and on-site measurements by validating a process of on-site measurements against an initial software model to develop some suggestions to redesign this area and find out the most effective way to improve outdoor energy efficiency. We conducted the on-site measurement to obtain the information of the whole commercial zone (Including grass, trees, paving material, and building) and then parameterize the simulated model using software ENVI-met. On-site measurement at 7 different areas were carried out, where the measured data is compared to the simulated results of ENVI-met by linear regression to validate the simulated results. The output data from ENVI-met, including air temperature, relative humidity, wind speed, and mean radiant temperature, together were initial data for calculating thermal comfort index PET. Consequently, regression analyses were conducted between PET and percentage of different design parameter to assess their relationship. At last, the final conclusions and suggestions for the architects, urban planners, and policy makers are given.
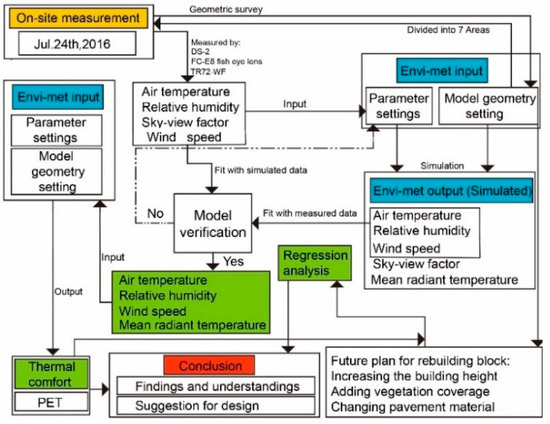
Figure 8.
Methodological framework of this study. (PET: physiological equivalent temperature).
2.3. On-Site Measurement
On-site measurements were evaluated to understand the outdoor thermal environment to characterize the microclimate of this zone. Measurements were carried out on 24 July 2016 (the hottest day in July 2016), and all the data were recorded from 9:00 to 17:00. The equipment was covered by a radiation shield and lifted up to a height of 1.5 m above the ground. Detailed information regarding the instruments is shown in Table 1.

Table 1.
The measured variables and technical data of the instruments.
2.4. The Numerical Simulation
2.4.1. The Simulated Conditions in This Study
As mentioned above, the microclimatic model was used in ENVI-met software, mainly because of the capability of model, based on the theory of CFD, to build plant–surface–atmosphere interactions concerning the outdoor environment by using different buildings, various pavement materials, and various vegetation in different configurations [47].
The accuracy of ENVI-met has been assessed in many previous studies by comparing the simulated result to the measured result [15,41,42,43,48,49,50]. These tests have proven that ENVI-met can accurately simulate outdoor microclimates in different climates. The vegetation in ENVI-met can not only be designed as a porous media to solar radiation and incoming wind, but also can be represented as a biological body that interacts with the outdoor microclimate through evapotranspiration.
As we all know, ENVI-met builds vegetation based on the leaf area density (LAD) and the leaf area index (LAI). The following equation explains the relationship between the two factors:
where h means the height of the tree (m) and z means the vertical grid size. With respect to energy absorption, the distribution of the leaf density and the height of the plant are estimated in the simulations to illustrate two different kinds of solar radiation. A folder concerning the leaf area density of this planted border tree in this zone was set as the measured tree, based on the on-site measurements, including the fisheye images and vertical configurations. The images were then put into software Hemisfer for calculating the LAD and LAI. According to the on-site measurement, the name of local border tree is the Bischofia Javanica (Figure 9), and the detailed information about this tree species was added to the plant database to finish this research (Table 2).
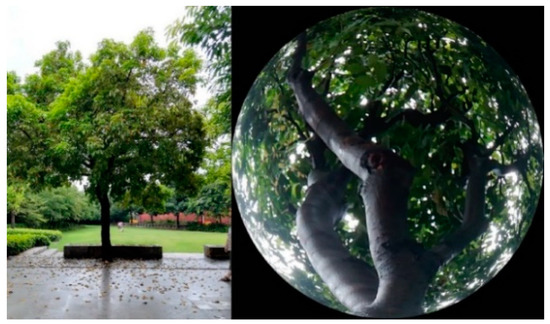
Figure 9.
Vertical configuration of the tree (Bischofia javanica).
Table 2.
The leaf area density (LAD) distribution of the ‘Bischofia Javanica’.
The green grass used in this block is shown in Figure 10.
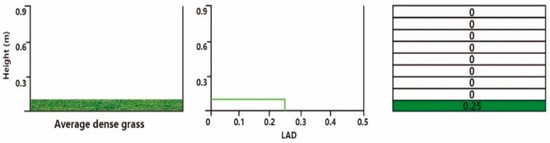
Figure 10.
Schematic of the grass database model for ENVI-met.
2.4.2. The Simulated Model in ENVI-Met
The vegetation models were provided by ENVI-met database; however, all the simulated modeling systems must be validated against the on-site measurements to ensure their accuracy with respect to their ability to produce outputs in the outdoor environment. Therefore, on-site measurements were conducted in this research to validate the simulated results against the measured results. The initial input data of the different meteorological parameters used in ENVI-met for the simulations are displayed in Table 3. The total simulation time was 24 h, starting at 0:00 on 24 July 2016, with a calculation each minute. The simulated results were output on a one-hour basis.
Table 3.
Initial simulated data for the simulations.
The modeled region in ENVI-met is shown in Figure 11, in which the buildings occupy 63.3% of this whole area, the trees covers 12.5%, grass is 3.0%, and the pavement material is 21.2%.
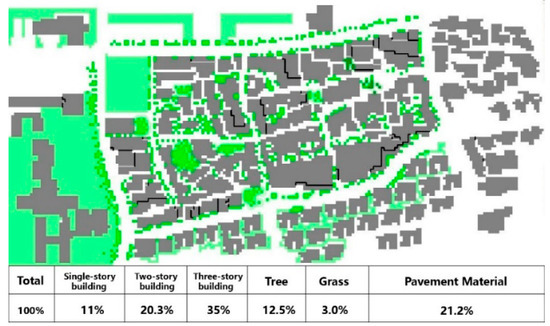
Figure 11.
Various types of different coverage ratios of the base case.
In this study, the whole area was modeled in three ways. First, a satellite photo obtained from Google Maps was used to model some built-up elements in this site. Second, the location and plant types were defined. Third, the pavement material of this area was characterized (Figure 12).
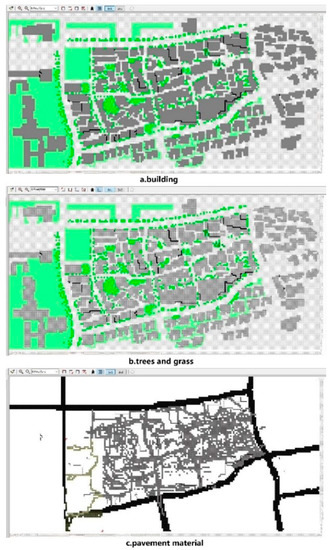
Figure 12.
Various types of different coverage ratios of the base case.
2.4.3. The Validation between the Simulated and Measured Data
As mentioned above, in this study, the PET index was used to assess the outdoor thermal sensation in summer, and it can be understood as the air temperature that makes the human body’s thermal conditions in the indoor environment in balance with humans’ skin and core temperatures in the complicated outdoor environment. Moreover, this index has been approved as an outdoor thermal comfort index by the VDI (Association of German Engineers) standard of Germany and has also been used for a long time.
Based on published data by the nearest weather station [45], Fo Shan city is in a calm wind area, which shows that the PET is not influenced by wind velocity. The corresponding value and impact of different parameters can be estimated as follows:
where PET represents humans’ thermal comfort in this region; PETS is the new thermal comfort after changing different parameters; and ∆PET is the gap between PET and PETS. Equation (3) can explain the modification of outdoor thermal comfort in new cases.
∆PET = PET − PETS
According to previous research, the outdoor humans’ thermal sensation in a hot-summer and warm-winter climate region is shown in Table 4 [50]. To evaluate the deviation between the measured result and the simulated result, the root mean square error (RMSE) was used in this study. The index RMSE is a frequently used measure of the differences between values predicted by a model or an estimator and the values observed, representing the square root of the second sample moment of the differences between the predicted values and the observed values, which is a significant factor for the calculation of error [51,52].
Table 4.
Thermal sensation of a hot-summer and warm-winter climate region [50].
If the RMSE reaches or approaches zero, the most accurate model is achieved. Lower RMSE values mean that the simulated results are within the measured value. In our study, each RMSE is calculated through nine sets of data from 9:00 a.m. to 5:00 p.m. Figure 13 shows that, given the RMSE values between the measured and simulated data (in Figure 13a), the model demonstrates favorable performance with respect to the aspect of wind speed, with RMSE values from 0.01 to 0.08 m/s. Figure 13b shows the RMSE of air temperature, in which point-4 has the highest error during daytime, reaching 4.6 °C. This error can be attributed to the position of the instruments. Because point-4 is an open space, the data instrument is not fixed at the middle of this space and instead is fixed along the sidewalk. Other points range from 1.1 to 3.1 °C. In Figure 13c, similar to the results for air temperature, a big gap also appears at point-4 in the results for relative humidity.
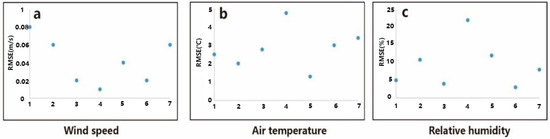
Figure 13.
Root-mean-square error (RMSE) between the measured and the simulated data.
Besides the RMSE index, analyzing the regression between the measured and simulated data is another step to evaluate the simulated model. A good linear regression was obtained, as shown in Figure 14, where the correlation coefficient (R2) value for wind speed is between 0.7307 and 0.9001, R2 value for air temperature of this region ranges from 0.7544 to 0.9847, and the values for relative humidity are within 0.7664 and 0.9813. The gap between the simulated and measured data may be caused by anthropogenic heat from humans during the measured period. These results are similar or even smaller than in previous studies [11,53,54]. The final linear regression values prove that ENVI-met is a reliable software to conduct the type of research used in this study.

Figure 14.
The correlation between three kinds of data on 24 July 2016.
3. Discussions and Results
The simulations in this study aimed to achieve a comparative evaluation of the cooling effect of different urban design parameters and choose the most effective strategy to improve outdoor thermal comfort in a commercial pedestrianized zone. Simulations of the true urban environment were carried out, including the geometry of the buildings and street canyons, to assess the effect of different parameters on thermal processes and increasing the outdoor energy efficiency. For each parameter, hourly PET was carried out by ENVI-met. The new strategies were modeled in four different ways. As explained above, the new models were simulated under the same microclimate conditions as the existing scenario. In case-1, the building height was increased in accordance with the local design specification, which restricts buildings in the pedestrianized zone from exceeding three floors to protect the commercial value of this region [5]. In case-2, the total numbers of trees were increased to supply extra canopy coverage for this zone in accordance with local design specifications (increasing the green coverage ratio to 25%) [5]. In case-3, the grass coverage ratio was increased to alleviate heat stress, and the green coverage ratio was the same as in the second case. Case-4 aimed to research the cooling effect of the pavement material with higher albedo. Table 5 shows the cases modeling the future scenarios.
Table 5.
The new scenarios.
3.1. Spatial Distribution of PET at Hottest Time
According to previous studies, the hottest time of the day occurs between 14:00 and 15:00. The distribution of PET values in this block at 14:00 is shown in Figure 15.
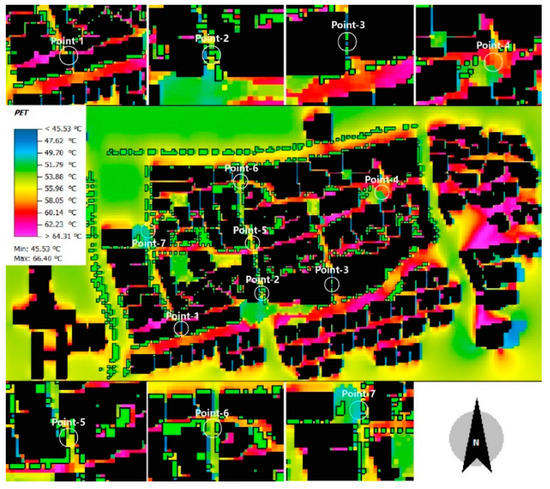
Figure 15.
Spatial distribution of PET at 14:00.
In accordance with humans’ thermal sensation in the hot-summer and warm-winter climate region of China [54], almost all the selected points are located within the “hot” and “very hot” stages. In addition, in order to obtain a deep understanding of the thermal sensation of the different selected points, Figure 16 was established to show the existing scenario, in which the extreme summer PET of different points can reach up to between 45.7 and 65.6 °C
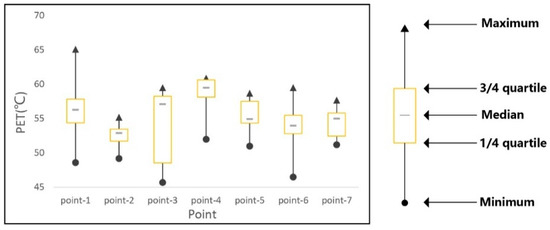
Figure 16.
The PET of the selected points at 14:00.
3.2. Cooling Effect of Different Parameters
As mentioned above, based on the current conditions of the simulated model, this existing case is defined as the base case, and four new cases were developed to compare and evaluate the cooling effect of different parameters.
Figure 17 shows the base case and the four new cases with different coverage ratios of different parameters.
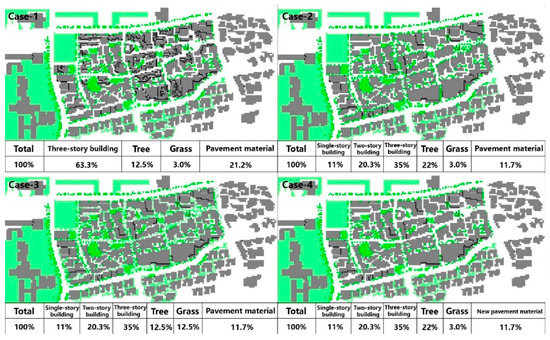
Figure 17.
The new cases: Various types of different coverage ratios.
In case-1, as mentioned above, the buildings in the pedestrianized zone did not exceed three stories. This case aimed to increase building height to understand its cooling effect, in which the three-story building coverage ratio was increased to 63.3% of the area.
In case-2, the tree coverage ratio was increased to 22% in order to better understand its influence. As in case-2, in case-3, the grass coverage ratio was increased to improve outdoor thermal comfort and evaluate its cooling effect in accordance with the local design specification.
Case-4 changed the existing pavement material to assess its cooling effect and determine its potential to increase the outdoor energy efficiency.
3.3. The PET Improvement (∆PET) of New Cases
Figure 18 and Figure 19 show the improvement of PET the study area based on the new cases. The PETs at peak time (14:00) were compared to that of the base case at the pedestrian level (1.5 m) (Figure 18).
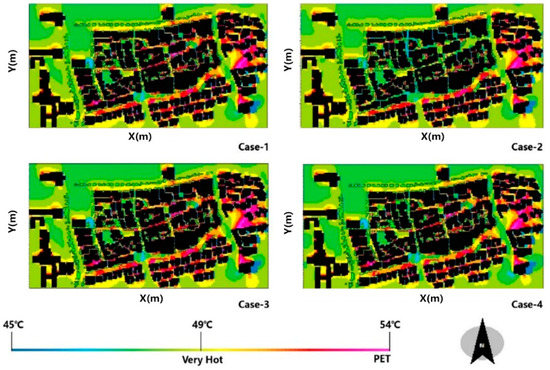
Figure 18.
New PET distribution in different cases at 14:00 during the measured day.
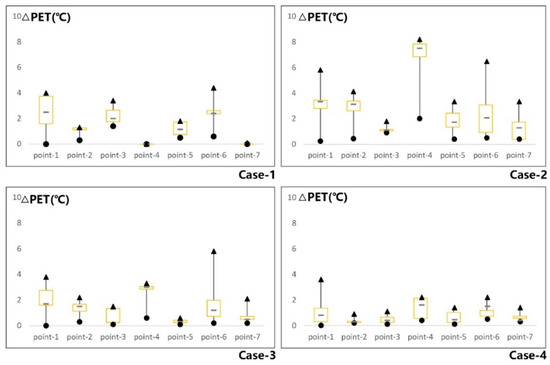
Figure 19.
Cooling effect of the new cases at 14:00.
In Figure 18, the detailed cooling effect of different cases can be observed, in which the PET results were processed with the same range and conditions to obtain a fair comparison between the existing scenario and the four new cases.
In the simulated result, increasing the tree coverage ratio of case-2 can significantly improve humans’ thermal comfort, especially in open spaces (point-4), where ∆PET ranges from 2.0 to 8.2 °C. In addition, trees also can affect the thermal comfort in canyon space, which can reduce the PET from 0.3 to 6.3 °C (case-2). Its function can be attributed to transpiration and shading during daytime. In case-1, even increasing building height and increasing the coverage ratio of three-story buildings can also alleviate heat stress.
However, it is not obvious what is worse. The microclimatic conditions in open space (point-4, point-7) do not change too much. Meanwhile, increasing the grass coverage ratio (case-3) and replacing pavement material with higher albedo material (case-4) also can reduce PET effectively. However, the extent cannot be analyzed in case-1 and case-2.
In this research, numerical simulations were conducted to evaluate the correlation between different cases and outdoor thermal sensation in hot summer. The current results display the distribution of PET modifications through the synergistic effect of the different parameters. The next section will provide more detailed information about the effects of each different case.
3.4. Correlation between Different Parameters and Humans’ Thermal Comfort
As mentioned above, the study area consisted of open space and canyon space. Each parameter had different influence on different spaces. The effectiveness of different parameters in open space is shown in Figure 20.
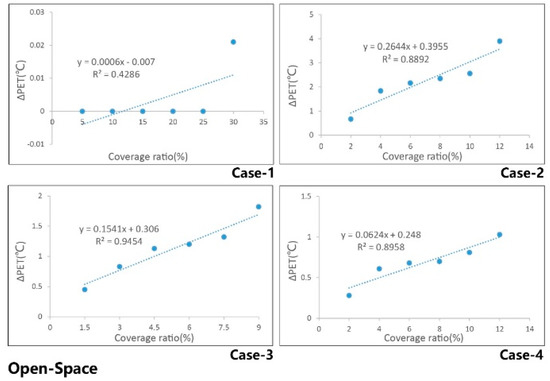
Figure 20.
Correlation between thermal comfort and the coverage ratios of different parameters in open space at 14:00.
The R2 between PET and a different parameter represents the proportion that can be interpreted by variables of different regression models [54]. In the above figure, a strong positive correlation was found between the tree coverage ratio and ∆PET (case-2), in which we can conclude that a 2% increase of the percentage of trees would reduce the PET by 0.8 °C. Meanwhile, an invalid relationship between the percentage of three-story buildings and ∆PET can be observed (case-1). The impacts of grass (case-3) and pavement material with a high albedo (case-4) were found to reduce PET effectively, but the extent is limited.
As in open space, in canyon space (Figure 21), increasing the tree coverage ratio can also reduce PET effectively (case-2). An increase of 2% in the percentage of trees would lead to a 0.4 °C of PET in canyon space. In addition, increasing the percentage of three-story buildings can make a contribution to improve thermal comfort (case-2); thus, the effect can be attributed to the canopy-shading, which can impede radiation. In accordance with the multiple regression analysis of the other two cases (case-3 and -4), it can be concluded that grass land and pavement material with a high albedo can also improve thermal comfort in canyon space. Grass can improve thermal comfort by reducing reflected radiation. Pavement material with lower albedo may be easily heated up by radiation, so it is necessary to reduce the coverage ratio of such materials in this zone.
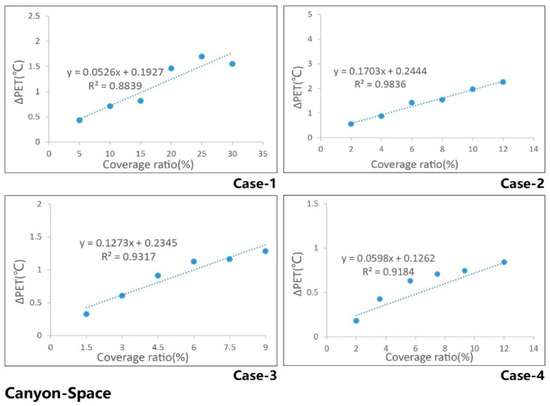
Figure 21.
Correlation between thermal comfort and the coverage ratio of different parameters in canyon space at 14:00.
In order to obtain a deep understanding of the contribution of each parameter during daytime in different spaces, the result, which indicates the R2, is presented in Figure 22, and the R2 is classified into different levels of importance.

Figure 22.
Correlation between different parameter and thermal comfort.
In view of thermal comfort, the PET index in this study was used to calculate the energy balance of the human body, which is directly affected by surrounding factors. The numerical simulation results suggest that a useful prediction of the effects of a pedestrianized zone’s renewal can assist policymakers and city planners in choosing the best way to improve humans’ thermal sensation, thus helping to reduce outdoor energy consumption and improve energy efficiency effectively.
4. Discussion and Conclusions
There is no doubt that the different parameters (building, tree, grass, and pavement material coverage) can supply different ecosystem services and should be incorporated into our urban development. In this work, we employed ENVI-met software to assess the potential effect of different parameters in the tropical environment of Fo Shan city. Numerical simulations and on-site measurements were conducted to evaluate the outdoor thermal comfort of this zone, which can help policymakers obtain a deep understanding of the correlation between thermal comfort and different parameters, thus allowing them to choose the best way to improve thermal comfort and outdoor energy efficiency. Even if some conclusions are common sense, these quantitative results are valuable, especially in a pedestrianized zone in the studied region, which has not been investigated in depth before.
In this study, the distributions of the PET values at 14:00 showed that thermal comfort in the studied area can be better improved under new scenarios, with ∆PET ranges with maximum and minimum values at 8.2 °C and 0.02 °C, respectively. According to the simulated results and the regression analyses, the most effective way to reduce heat stress in open space and in canyon space is to increase the tree coverage ratio.
According to the results of this study, we developed the following suggestions for designers and local managers:
- In open space, it is obvious that shading is the only effective way to ameliorate heat stress in extreme summer, and therefore, increasing coverage ratio of tree is very necessary.
- In canyon space, increasing the building height can impede the solar radiation and improve outdoor thermal comfort.
- Increasing a landscape parameter, such as grass, is recommended. Although the cooling extent of grass seems to be limited, it can also improve the subjective sensation of humans by supplying attractive scenery.
- Reducing the coverage ratio of hardened ground is another important way to reduce heat stress. The results here show that pavement material with higher albedo can provide better thermal comfort.
The following limitations of this work will be solved in the future:
- In this study, we only consider a single tree species. It is very important to consider more species in future work.
- It is important to mention that the building façade material in ENVI-met software is assumed to be the same material, but this may not be the case in the real world.
- In this study, we do not consider other parameters, such as water bodies and so on.
Author Contributions
Conceptualization, X.M.; methodology, X.M.; software, X.M.; validation, X.M., H.F., and D.Z.; formal analysis, H.F.; investigation, H.F. and D.Z.; resources, D.Z.; data curation, D.Z.; original draft preparation, X.M.; review and editing, M.W.; visualization, H.F. and D.Z.; supervision, H.F. and D.Z.; project administration, D.Z.; and funding acquisition, D.Z.
Funding
This research was funded by the Natural Science Foundation of China under the project No. 2013FY112500.
Conflicts of Interest
The authors declare no conflict of interest.
References
- Rosenzweig, C.; Solecki, W.D.; Hammer, S.A.; Mehrotra, S. Climate Change and Cities: First Assessment Report of the Urban Climate Change Research Network; Cambridge University Press: Cambridge, UK, 2011. [Google Scholar]
- Tan, Z.; Lau, K.K.L.; Ng, E. Urban tree design approaches for mitigating daytime urban heat island effects in a high-density urban environment. Energy Build. 2016, 114, 265–274. [Google Scholar] [CrossRef]
- Huang, K.T.; Li, Y.J. Impact of street canyon typology on building’s peak cooling energy demand: A parametric analysis using orthogonal experiment. Energy Build. 2017, 154, 448–464. [Google Scholar] [CrossRef]
- TDCFCB. Thermal Design Code for Civil Buildings, GB 50176–51993. Available online: https://zhidao.baidu.com/question/492628757.html (accessed on 5 April 2019).
- CSADI. The Commercial Building Design Specification. 2018. Available online: https://wenku.baidu.com/view/4c4a9df76529647d272852bb.html (accessed on 5 April 2019).
- Ignatius, M.; Wong, N.H.; Jusuf, S.K. Urban microclimate analysis with consideration of local ambient temperature, external heat gain, urban ventilation, and outdoor thermal comfort in the tropics. Sustain. Cities Soc. 2015, 19, 121–135. [Google Scholar] [CrossRef]
- Krüger, E.; Pearlmutter, D.; Rasia, F. Evaluating the impact of canyon geometry and orientation on cooling loads in a high-mass building in a hot dry environment. Appl. Energy 2010, 87, 2068–2078. [Google Scholar] [CrossRef]
- Zhang, Y.; Du, X.; Shi, Y. Effects of street canyon design on pedestrian thermal comfort in the hot-humid area of China. Int. J. Biometeorol. 2017, 61, 1421–1432. [Google Scholar] [CrossRef] [PubMed]
- Cao, A.; Li, Q.; Meng, Q. Effects of orientation of urban roads on the local thermal environment in Guang Zhou city. Procedia Eng. 2015, 121, 2075–2082. [Google Scholar] [CrossRef]
- Morakinyo, T.E.; Lam, Y.F. Simulation study on the impact of tree-configuration, planting pattern and wind condition on street-canyon’ s micro-climate and thermal comfort. Build. Environ. 2016, 103, 262–275. [Google Scholar] [CrossRef]
- Morakinyo, T.E.; Kong, L.; Lau, K.K.-L.; Yuan, C.; Ng, E. A study on the impact of shadow-cast and tree species on in-canyon and neighborhood’s thermal comfort. Build. Environ. 2017, 115, 1–17. [Google Scholar] [CrossRef]
- Erell, E.; Pearlmutter, D.; Boneh, D.; Kutiel, P.B. Effect of high-albedo materials on pedestrian heat stress in urban street canyons. Urban Clim. 2014, 10, 367–386. [Google Scholar] [CrossRef]
- Ma, X.; Fukuda, H.; Zhou, D.; Gao, W.; Wang, M. The study on outdoor pedestrian thermal comfort in blocks: A case study of the Dao He Old Block in hot-summer and cold-winter area of southern China. Sol. Energy 2019, 179, 210–225. [Google Scholar]
- Memon, R.A.; Leung, D.Y.C.; Liu, C.-H. Effects of building aspect ratio and wind speed on air temperatures in urban-like street canyons. Build. Environ. 2010, 45, 176–188. [Google Scholar] [CrossRef]
- Bowler, D.E.; Buyung-Ali, L.; Knight, T.M.; Pullin, A.S. Urban greening to cool towns and cities: A systematic review of the empirical evidence. Landsc. Urban Plan. 2010, 97, 147–155. [Google Scholar] [CrossRef]
- Ai, Z.T.; Mak, C.M. CFD simulation of flow in a long street canyon under a perpendicular wind direction: Evaluation of three computational settings. Build. Environ. 2017, 114, 293–306. [Google Scholar] [CrossRef]
- Pearlmutter, D.; Berliner, P.; Shaviv, E. Integrated modeling of pedestrian energy exchange and thermal comfort in urban street canyons. Build. Environ. 2007, 42, 2396–2409. [Google Scholar] [CrossRef]
- Oke, T.R. Boundary Layer Climates; Routledge: Abingdon, UK, 1988; Volume 5, pp. 103–113. [Google Scholar]
- Johnson, G.T.; Oke, T.R.; Lyons, T.J.; Steyn, D.G.; Watson, I.D.; Voogt, J.A. Simulation of surface urban heat islands under ‘IDEAL’ conditions at night part 1: Theory and tests against field data. Bound.-Layer Meteorol. 1991, 56, 275–294. [Google Scholar] [CrossRef]
- McPherson, E.G.; Nowak, D.J.; Rowntree, R.A. Chicago’s Urban Forest Ecosystem: Results of the Chicago Urban Forest Climate Project; US Department of Agriculture, Forest Service, Northeastern Forest Experiment Station: Radnor, PA, USA, 1994.
- Shashua-Bar, L.; Hoffman, M.E. Quantitative evaluation of passive cooling of the UCL microclimate in hot regions in summer, case study: Urban streets and courtyards with trees. Build. Environ. 2004, 39, 1087–1099. [Google Scholar] [CrossRef]
- Dimoudi, A.; Nikolopoulou, M. Vegetation in the urban environment: Microclimatic analysis and benefits. Energy Build. 2003, 35, 69–76. [Google Scholar] [CrossRef]
- Yang, S.R.; Lin, T.P. An integrated outdoor spaces design procedure to relieve heat stress in hot and humid regions. Build. Environ. 2016, 99, 149–160. [Google Scholar] [CrossRef]
- Yang, X.; Zhao, L.; Bruse, M.; Meng, Q. Evaluation of a microclimate model for predicting the thermal behavior of different ground surfaces. Build. Environ. 2013, 60, 93–104. [Google Scholar] [CrossRef]
- Gagge, A.P.; Fobelets, A.P.; Berglund, L.G. A standard predictive index of human response to the thermal environment. ASHRAE Trans. 1986, 92, 709–731. [Google Scholar]
- Staiger, H.; Bucher, K.; Jendritzky, G. Die physiologisch gerechte Bewertung von Wärmebelastung und Kältestress beim Aufenthalt im Freien in der Maßzahl Grad Celsius. Ann. Meteorol. 1997, 33, 100–107. [Google Scholar]
- Pickup, J.; de Dear, R.J. An outdoor thermal comfort index (OUT_SET*)—Part I—The model and its assumptions. In Selected Papers from the ICB-ICUC’99 Conference; World Meteorological Organization: Geneva, Switzerland, 2000. [Google Scholar]
- Mayer, H.; Höppe, P. Die Bedeutung des Waldes für die Erholung aus der Sicht der Human bioklimatologie. Forstwiss Cent. 1984, 103, 125–131. [Google Scholar] [CrossRef]
- Höppe, P. The physiological equivalent temperature e a universal index for the biometeorological assessment of the thermal environment. Int. J. Biometeorol. 1999, 43, 71–75. [Google Scholar] [CrossRef] [PubMed]
- Fiala, D.; Havenith, G.; Bröde, P.; Kampmann, B.; Jendritzky, G. UTCI-Fiala multimode model of human heat transfer and temperature regulation. Int. J. Biometeorol. 2012, 56, 429–441. [Google Scholar] [CrossRef] [PubMed]
- Bröde, P.; Fiala, D.; Błażejczyk, K.; Holmér, I.; Jendritzky, G.; Kampmann, B.; Tinz, B.; Havenith, G. Deriving the operational procedure for the Universal Thermal Climate Index (UTCI). Int. J. Biometeorol. 2012, 56, 481–494. [Google Scholar] [CrossRef]
- Höppe, P. Heat balance modelling. Experientia 1993, 49, 741–746. [Google Scholar] [CrossRef] [PubMed]
- Taleb, D.; Abu-Hijleh, B. Urban heat islands: Potential effect of organic and structured urban configurations on temperature variations in Dubai, UAE. Renew. Energy 2013, 50, 747–762. [Google Scholar] [CrossRef]
- Taleghani, M.; Kleerekoper, L.; Tenpierik, M.; van den Dobbelsteen, A. Outdoor thermal comfort within five different urban forms in The Netherlands. Build. Environ. 2015, 83, 65–78. [Google Scholar] [CrossRef]
- Wong, N.H.; Jusuf, S.K.; la Win, A.A.; Thu, H.K.; Negara, T.S.; Xuchao, W. Environmental study of the impact of greenery in an institutional campus in the tropics. Build. Environ. 2007, 42, 2949–2970. [Google Scholar] [CrossRef]
- Taha, H. Urban climates and heat islands: Albedo, evapotranspiration, and anthropogenic heat. Energy Build. 1997, 25, 99–103. [Google Scholar] [CrossRef]
- Bruse, M.; Fleer, H. Simulating surface–plant–air interactions inside urban environments with a three dimensional numerical model. Environ. Mod. Softw. 1998, 13, 373–384. [Google Scholar] [CrossRef]
- Srivanit, M.; Hokao, K. Evaluating the cooling effects of greening for improving the outdoor thermal environment at an institutional campus in the summer. Build. Environ. 2013, 66, 158–172. [Google Scholar] [CrossRef]
- Alexandri, E.; Jones, P. Temperature decreases in an urban canyon due to green walls and green roofs in diverse climates. Build. Environ. 2008, 43, 480–493. [Google Scholar] [CrossRef]
- Vidrih, B.; Medved, S. Multiparametric model of urban park cooling island. Urban For. Urban Green. 2013, 12, 220–229. [Google Scholar] [CrossRef]
- Taleghani, M.; Tenpierik, M.; van den Dobbelsteen, A.; Sailor, D.J. Heat mitigation strategies in winter and summer: Field measurements in temperate climates. Build. Environ. 2014, 81, 309–319. [Google Scholar] [CrossRef]
- Hamada, S.; Ohta, T. Seasonal variations in the cooling effect of urban green areas on surrounding urban areas. Urban For. Urban Green. 2010, 9, 15–24. [Google Scholar] [CrossRef]
- Taleb, H.; Taleb, D. Enhancing the thermal comfort on urban level in a desert area: Case study of Dubai, United Arab Emirates. Urban For. Urban Green. 2014, 13, 253–260. [Google Scholar] [CrossRef]
- Shashua-Bar, L.; Tsiros, I.X.; Hoffman, M.E. A modeling study for evaluating passive cooling scenarios in urban streets with trees. Case study: Athens, Greece. Build. Environ. 2010, 45, 2798–2807. [Google Scholar] [CrossRef]
- WOOTZ. Weather Organization of Tai Zhou. Available online: http://tianqi.2345.com/wea_history/ (accessed on 5 April 2019).
- Tourism Organization of Fo Shan. Available online: https://baike.baidu.com/item /9476214 (accessed on 5 April 2019).
- OOE. Organization of ENVI-met. Available online: http://www.envi-met.info/ (accessed on 1 January 2019).
- Middel, A.; Häb, K.; Brazel, A.J.; Martin, C.A.; Guhathakurta, S. Impact of urban form and design on mid-afternoon microclimate in Phoenix Local Climate Zones. Landsc. Urban Plan. 2014, 122, 16–28. [Google Scholar] [CrossRef]
- Salata, F.; Golasi, I.; de Lieto Vollaro, R.; de Lieto Vollaro, A. Urban microclimate and outdoor thermal comfort. A proper procedure to fit ENVI-met simulation outputs to experimental data. Sustain. Cities Soc. 2016, 26, 318–343. [Google Scholar] [CrossRef]
- Thimonier, A.; Sedivy, I.; Schleppi, P. Estimating leaf area index in different types of mature forest stands in Switzerland: A comparison of methods. Eur. J. For. Res. 2010, 129, 543–562. [Google Scholar] [CrossRef]
- Willmott, C.J. On the validation of models. Phys. Geogr. 1981, 2, 184–194. [Google Scholar] [CrossRef]
- Willmott, C.J. Some comments on the evaluation of model performance. Bull. Am. Meteorol. Soc. 1982, 63, 1309–1313. [Google Scholar] [CrossRef]
- Qaid, A.; Lamit, H.B.; Ossen, D.R.; Shahminan, R.N.R. Urban heat island and thermal comfort conditions at micro-climate scale in a tropical planned city. Energy Build. 2016, 133, 577–595. [Google Scholar] [CrossRef]
- Morakinyo, T.E.; Dahanayake, K.K.C.; Adegun, O.B.; Balogun, A.A. Modelling the effect of tree-shading on summer indoor and outdoor thermal condition of two similar buildings in a Nigerian university. Energy Build. 2016, 130, 721–732. [Google Scholar] [CrossRef]
© 2019 by the authors. Licensee MDPI, Basel, Switzerland. This article is an open access article distributed under the terms and conditions of the Creative Commons Attribution (CC BY) license (http://creativecommons.org/licenses/by/4.0/).