Article

Particle Swarm Optimization-Based Power and Temperature Control Scheme for Grid-Connected DFIG-Based Dish-Stirling Solar-Thermal System

1
Department of Electrical Engineering, School of Automation, Wuhan University of Technology, Wuhan 430070, Hubei, China
2
China Ship Development and Design Center, Wuhan 430064, Hubei, China
*
Author to whom correspondence should be addressed.
Energies 2019, 12(7), 1300; https://doi.org/10.3390/en12071300
Submission received: 6 February 2019 / Revised: 25 March 2019 / Accepted: 29 March 2019 / Published: 4 April 2019
(This article belongs to the Section A2: Solar Energy and Photovoltaic Systems)

Abstract

:
Variable-speed operation of a dish-Stirling (DS) concentrated solar-thermal power generating system can achieve higher energy conversion efficiency compared to the conventional fixed-speed operation system. However, tuning of the controllers for the existing control schemes is cumbersome due to the presence of a large number of control parameters. This paper proposes a new control system design approach for the doubly-fed induction generator (DFIG)-based DS system to achieve maximum power point tracking and constant receiver temperature regulation. Based on a developed thermo-electro-pneumatic model, a coordinated torque and mean pressure control scheme is proposed. Through steady-state analysis, the optimal torque is calculated using the measured insolation and it serves as the tracking reference for direct torque control of the DFIG. To minimize the tracking error due to temperature variation and the compressor loss of the hydrogen supply system, four optimal control parameters are determined using particle swarm optimization (PSO). Model-order reduction and the process of the pre-examination of system stability are incorporated into the PSO algorithm, and it effectively reduces the search effort for the best solution to achieve maximum power point tracking and maintain the temperature around the set-point. The results from computational simulations are presented to show the efficacy of the proposed scheme in supplying the grid system with smoothened maximum power generation as the solar irradiance varies.

1. Introduction

Modern electricity supply systems have experienced significant changes due to the rapid increase of renewable energy generation in the past decades. Amongst various renewable energy technologies, dish-Stirling (DS) concentrated solar-thermal power generating system uses a parabolic dish-like reflector to collect and concentrate sunlight to a small heat receiver located at the focal point of the reflector. The high temperature achieved at the focal point, in which the receiver is located, is used as a heat source for a closed-cycle external heat engine called Stirling engine [1]. The DS system is capable of operating at a high energy conversion efficiency and releases no emissions, and thus it is considered to be a promising sustainable technology for future power grid structures such as microgrid and distributed generation [2].
For these reasons, in recent years, grid-connected DS system has received the attention of researchers aiming toward improving its modelling, design, control, and simulation, in order to increase the energy conversion efficiency and lower the overall cost of the system. A mathematical model intended for the optimal opto-geometric design of the concentrator and heat receiver is proposed in [3] and it is experimentally verified in [4]. Thermal efficiency of the heat receiver is studied and validated in [5]. A thermal model of a cavity receiver is developed for optimization in [6] where radiative exchange is evaluated using the radiosity method. The authors in [7] show that the global energy efficiency ranges between 19% and 26%, which can be achieved through optimal design based on a modified Iwamoto model of a Stirling engine and a solar prediction model. Further increase of utilization and efficiency can be achieved by incorporating novel components such as a free-piston Stirling engine [8], high-temperature superconducting linear synchronous generator [9], or integrated thermal energy storage [10]. These works mainly focus on the optimization and design for a specific component. System-level modelling, control, and simulation have been studied in References [11,12], where an ideal adiabatic model of a double-acting kinematic Stirling engine was used. In order to achieve acceptable accuracy, this Stirling engine model requires a very small step size (about 2 μs) for time-domain simulation as it has to be solved numerically as a cyclic boundary problem [13]. Due to the high complexity of the model, the control system can only be designed using empirical methods. A simple controller with proportional gain has to be used for the receiver temperature control, which causes lower thermal efficiency during the low insolation period. In [14], an averaged-value model of a solar Stirling engine is developed for the purpose of grid-integration studies and model-based control system design. The required step size for simulation is greatly increased to be compatible with that of electromechanical transient simulation. The control system has been improved with reduced impact on the interconnected grid system during insolation variation and/or grid fault. However, the scale of the conventional grid-connected DS system using squirrel-cage induction generators (SCIGs) is restricted due to the lack of control capability to meet the grid code requirements such as to provide frequency and voltage support. Although frequency support, such as a fixed-speed generation system, could be achieved by changing the working temperature [15], the significant reactive power injected to the grid system can still cause a severe voltage stability problem especially in a weak grid, as has been investigated in works [16,17].
In contrast, a variable-speed DS system is equipped with a doubly-fed induction generator (DFIG) [18,19] or permanent magnet synchronous generator (PMSG) [20,21]. With the back-to-back ac/dc/ac converters and advanced control techniques, independent regulation of the active power and reactive power becomes feasible. Maximum power point tracking (MPPT) and ancillary services, such as the frequency and voltage regulation, can be achieved for additional technological and economic benefits. Compared to PMSG, DFIG is more attractive as it is cheaper than PMSG and its power converter devices have a lower power rating. In [18], the authors propose two effective MPPT schemes by using direct power control, and perturbation and observation method, but the behaviors and limitations of thermodynamics and heat transfer of the prime mover have not been considered. In [19], it is found that the detailed modelling of the prime mover is important for a DS system as the control strategy of the prime mover can affect system stability when it is connected to the utility grid. However, the analysis and control system design presented is based on a simplified electrical model of DFIG, power converter, and grid system. In order to reduce the negative impact of temperature variation, a Takagi-Sugeno fuzzy supervisor is designed for several local state-feedback temperature controller to handle the nonlinearity of the system. As the control system is complex, the tuning of control parameters is cumbersome and no detailed discussion has been given.
To this end, in order to achieve the variable-speed operation of DS system with reduced effort in the control system design, this paper develops a new coordinated torque and mean pressure control scheme as well as a control parameter tuning method for MPPT and constant temperature regulation. The contribution of the work includes three aspects. First, a multi-physics dynamic model for a DFIG-based DS system has been established. For the first time, the detailed pneumatic model of the hydrogen supply system has been incorporated with the capability to consider the loss due to a gas compressor and limitation of external tanks. Second, a control scheme for a DFIG-based DS system is proposed to achieve simultaneous maximum power point tracking and temperature regulation with less complexity. Through steady-state analysis of the developed model, the optimal torque to for maximum power harnessing is calculated from the measured insolation, and then implemented using direct torque control, while a simple PI controller is used for temperature regulation. Third, to minimize the tracking error due to the disturbance of the temperature variation and the consumed power by the compressor, the optimal control parameters are determined using particle swarm optimization (PSO). With the incorporation of model order reduction and pre-examination of the system stability, the search effort can be greatly reduced.
The rest of the paper is organized as follows. Section 2 presents the overall system configuration and the modeling of the grid-connected DFIG-based DS system. Section 3 develops the control scheme with a simple control structure using direct torque control for active power regulation and using mean pressure control for temperature regulation. Section 4 proposes a method to use PSO to obtain the optimal control parameters with the consideration of system stability. Numerical examples are included in Section 5 to show the validity of the developed model and the effectiveness of the proposed control system. Section 6 concludes the main findings of the work.

2. Modeling of a DFIG-Based DS System

2.1. System Configuration

The energy conversion of a typical DS system consists of three processes: First, the parabolic dish collects, reflects, and concentrates the direct normal irradiance of the sunlight into a small hollow chamber called the receiver. Second, a Stirling engine converts the high temperature heat accumulated in the receiver into mechanical energy. Finally, an electrical generator, driven by the Stirling engine, converts mechanical energy into electricity. Figure 1 shows the schematic of the DS system as well as the power and mass flows between/with the sub-systems.
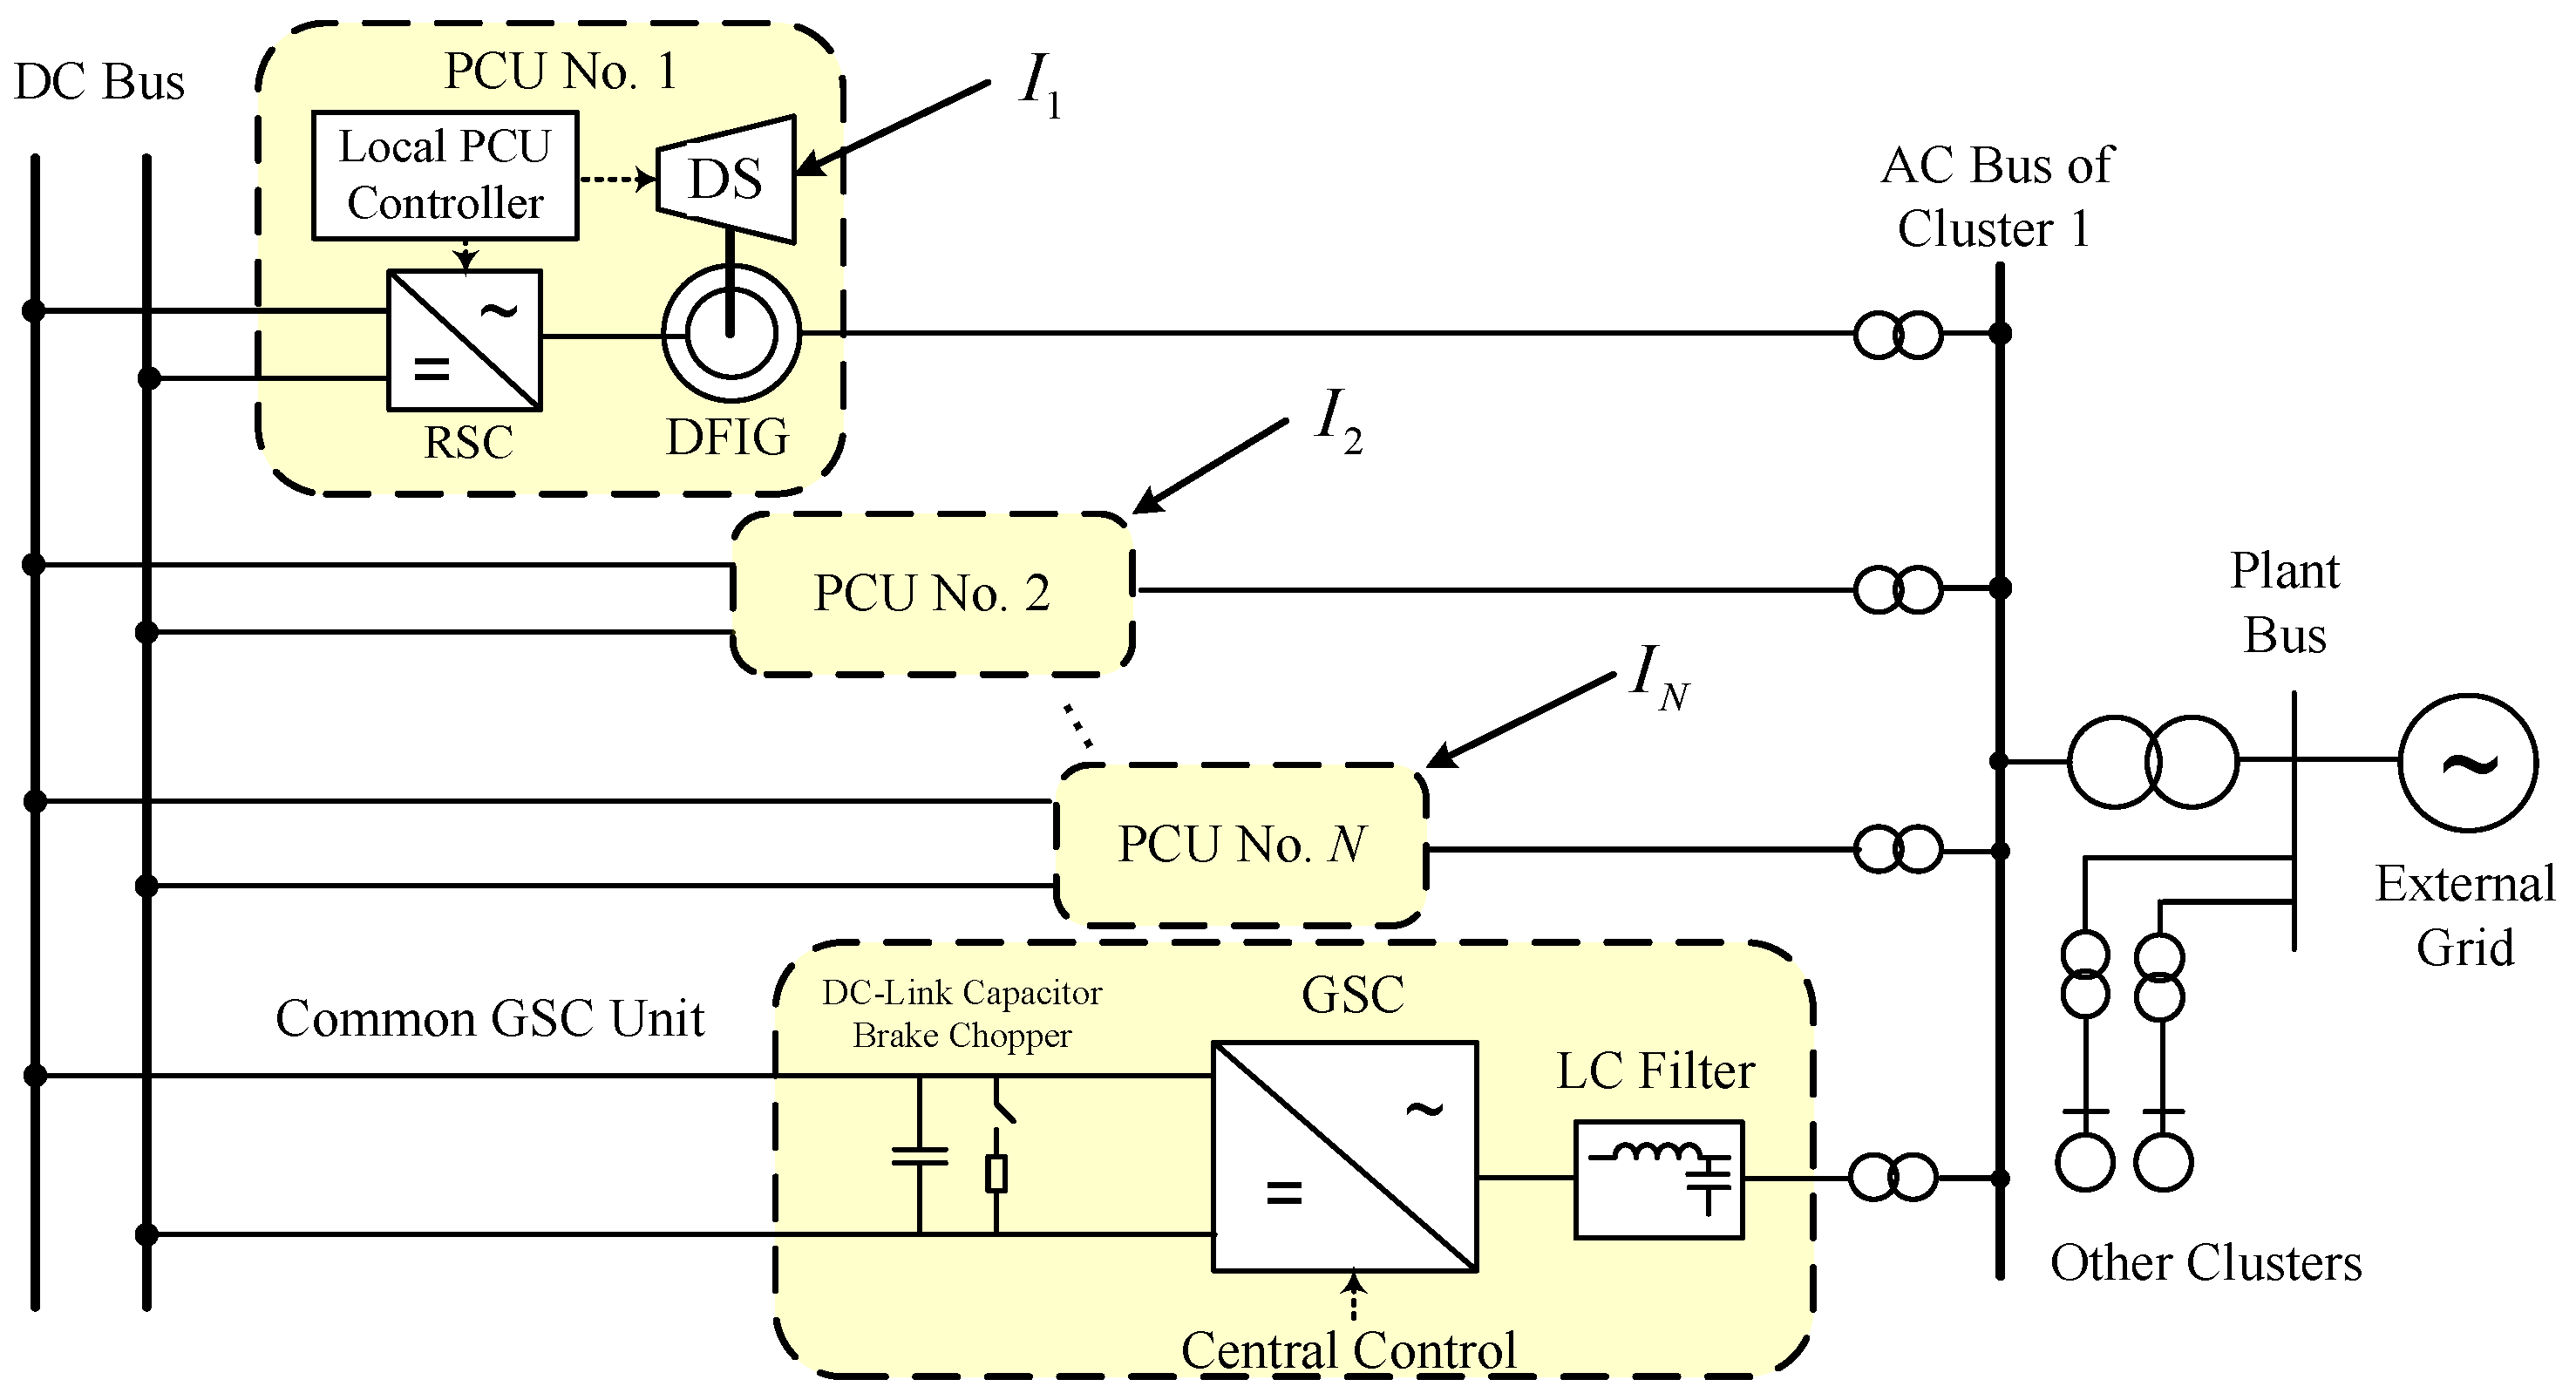
In contrast to the use of a fixed-speed SCIG in a conventional DS system [1], the variable-speed DFIG-based DS system studied in References [18,19] incorporates a wound-rotor induction generator and a back-to-back ac/dc/ac converter to interconnect the rotor windings of the generator to the grid. Although with similar structure to commercially-available DFIG-based wind turbine generator (WTG), the power rating of the prime mover of DS system, i.e., the Stirling engine, is much lower than that of a wind turbine. Many such generating units would have to be aggregated in some suitable manner to realize a utility-scale power station. Figure 2 shows the schematic of a possible configuration of such a power generating station. It is based on the use of a multi-string-converter, consisting of a common dc-link and a common grid-side converter (GSC) similar to that described in [22] for a photovoltaic plant.
In Figure 2, the DFIG-based DS power plant is shown to consist of a number of clusters in which each cluster is consists of N power conversion units (PCU) and one common GSC unit. Each PCU contains a prime mover (the DS), a DFIG, a rotor-side converter (RSC), and a corresponding local control system. The dc terminals of RSCs from the N PCUs are connected to a common dc bus. The common GSC unit consists of a three-phase voltage source inverter, dc-link capacitor, the associated line filter, and a GSC controller. Similar to the observations made in [22], there are several distinct advantages in the proposed configuration. First, power flows can still be controlled through the individual PCU. However, as a GSC with a larger power-rating tends to have a lower specific cost ($/kW) than that of a lower-rating GSC in this power level, the multi-string-converter configuration is therefore economically attractive. Moreover, a smoothing effect due to the expected diversity of the insolation level (Ik) among the PCU in a cluster would yield smaller power variations on the common dc bus. This would facilitate the control of the common GSC. Enhanced functionality of GSC, such as with regard to power quality and reactive power control, can also be achieved more economically using the larger-capacity converter.
Thus, with the configuration shown in Figure 2, each RSC is to achieve active power control of its PCU and to provide reactive power to the external grid. As long as the dc-link voltage is effectively maintained by the common GSC, the RSC can be individually controlled. The main drawback of the common GSC is that should it malfunction, the dc-link voltage may increase to some unacceptable level as the cluster is unable to export power to the grid. If this occurs, a braking resistor in the common brake chopper circuit in Figure 2 is inserted to dissipate the surplus energy and maintain the dc voltage. Other possible solution includes the use of an AC crowbar to short-circuit the rotor windings, and the DFIG then operates as a SCIG. However, such a contingency condition is not discussed in this article as this is considered a rare occurrence.
This work mainly studies the modeling and the local control of the PCU. The modeling of the power converters, dc bus, and grid system can be found in various literature such as [23].

2.2. Prime Mover Model

The prime mover of the PCU consists of the concentrator (i.e., the dish), the heat receiver/absorber, and the Stirling engine. It is shown as “DS” in Figure 1 and Figure 2. The dish and the receiver are modelled using a normalized heat transfer equation [24]:
T rec d T h d t = K rec ( K con I Q h ) ( T h T a )
where I is the insolation level, Ta is the ambient temperature, Qh is the rate of the heat flow absorbed by the Stirling engine, and the receiver temperature is assumed to be the same as the absorber/heater temperature Th of the Stirling engine. Constants Trec, Krec, and Kcon are as defined in [24], and their parametric values are determined according to the thermal characteristics of the receiver/absorber materials.
For the study of the variable-speed operation of the DS system, the behaviors of a double-acting kinematic Stirling engine with four series-connected cylinders can be described by an average-value adiabatic model with single-cylinder equivalence and the correction of losses:
Q h = a 00 + a 10 p mean + a 01 ω m + a 11 p mean ω m + A ( g A se ) + C p mean d T h d t
P m = τ m ω m = b 00 + b 10 p mean + b 01 ω m + b 11 p mean ω m + b 02 ω m 2 + b 12 p mean ω m 2
p mean = K p m se
where Pm, τm, and ωm are mechanical power, mechanical torque, and rotating angular speed of the Stirling engine, respectively. pmean and mse are the average mean pressure and the total mass of the hydrogen in the engine cylinder, respectively. pmean is proportional to mse, and the gain Kp is a constant. gAse is the mass flow rate of the hydrogen from engine cylinder to hydrogen tanks. The constants a00, a01, a10, a11, b00, b01, b10, b11, b02, and b12 are multivariable coefficients to represent the steady-state performance of the Stirling engine. Constants A and C are also defined in [24], and their parametric values are governed by the dimension and performance characteristics of the Stirling engine. These parameters shall also be affected by the working temperature Th. However, as Th is assumed to be well maintained at a maximum value Th,max, the effect of temperature variation on the these parameters is ignored. Note that all the parameters and variables given in Equations (1)–(4) are expressed in per unit, and the base values are selected and given in Table 1. The per unit parameters of the prime mover model used in this work are given in Table 2.

2.3. Hydrogen Supply System Model

The hydrogen supply system considered in this work consists of a high-pressure tank, a low-pressure tank, a gas compressor, and two solenoid valves, denoted as HV and LV, respectively. The thermodynamic behavior of the hydrogen stored in each of the pressure tanks is governed by Beattie–Bridgeman equation [25]. In Appendix A, the Beattie–Bridgeman equation is normalized to:
p X = f X ( m X ) = T X ( m X V X ) + k = 2 4 β k ( m X V X ) k
where the gas pressure pX in the tank is expressed as a fourth degree polynomial function fX(·) of the hydrogen mass mX. The subscript X can be H or L, which denote the high- or low-pressure tank respectively. VX denotes the tank volume, and temperature TX is assumed to be the same as the cold sink temperature Tk of the Stirling engine.
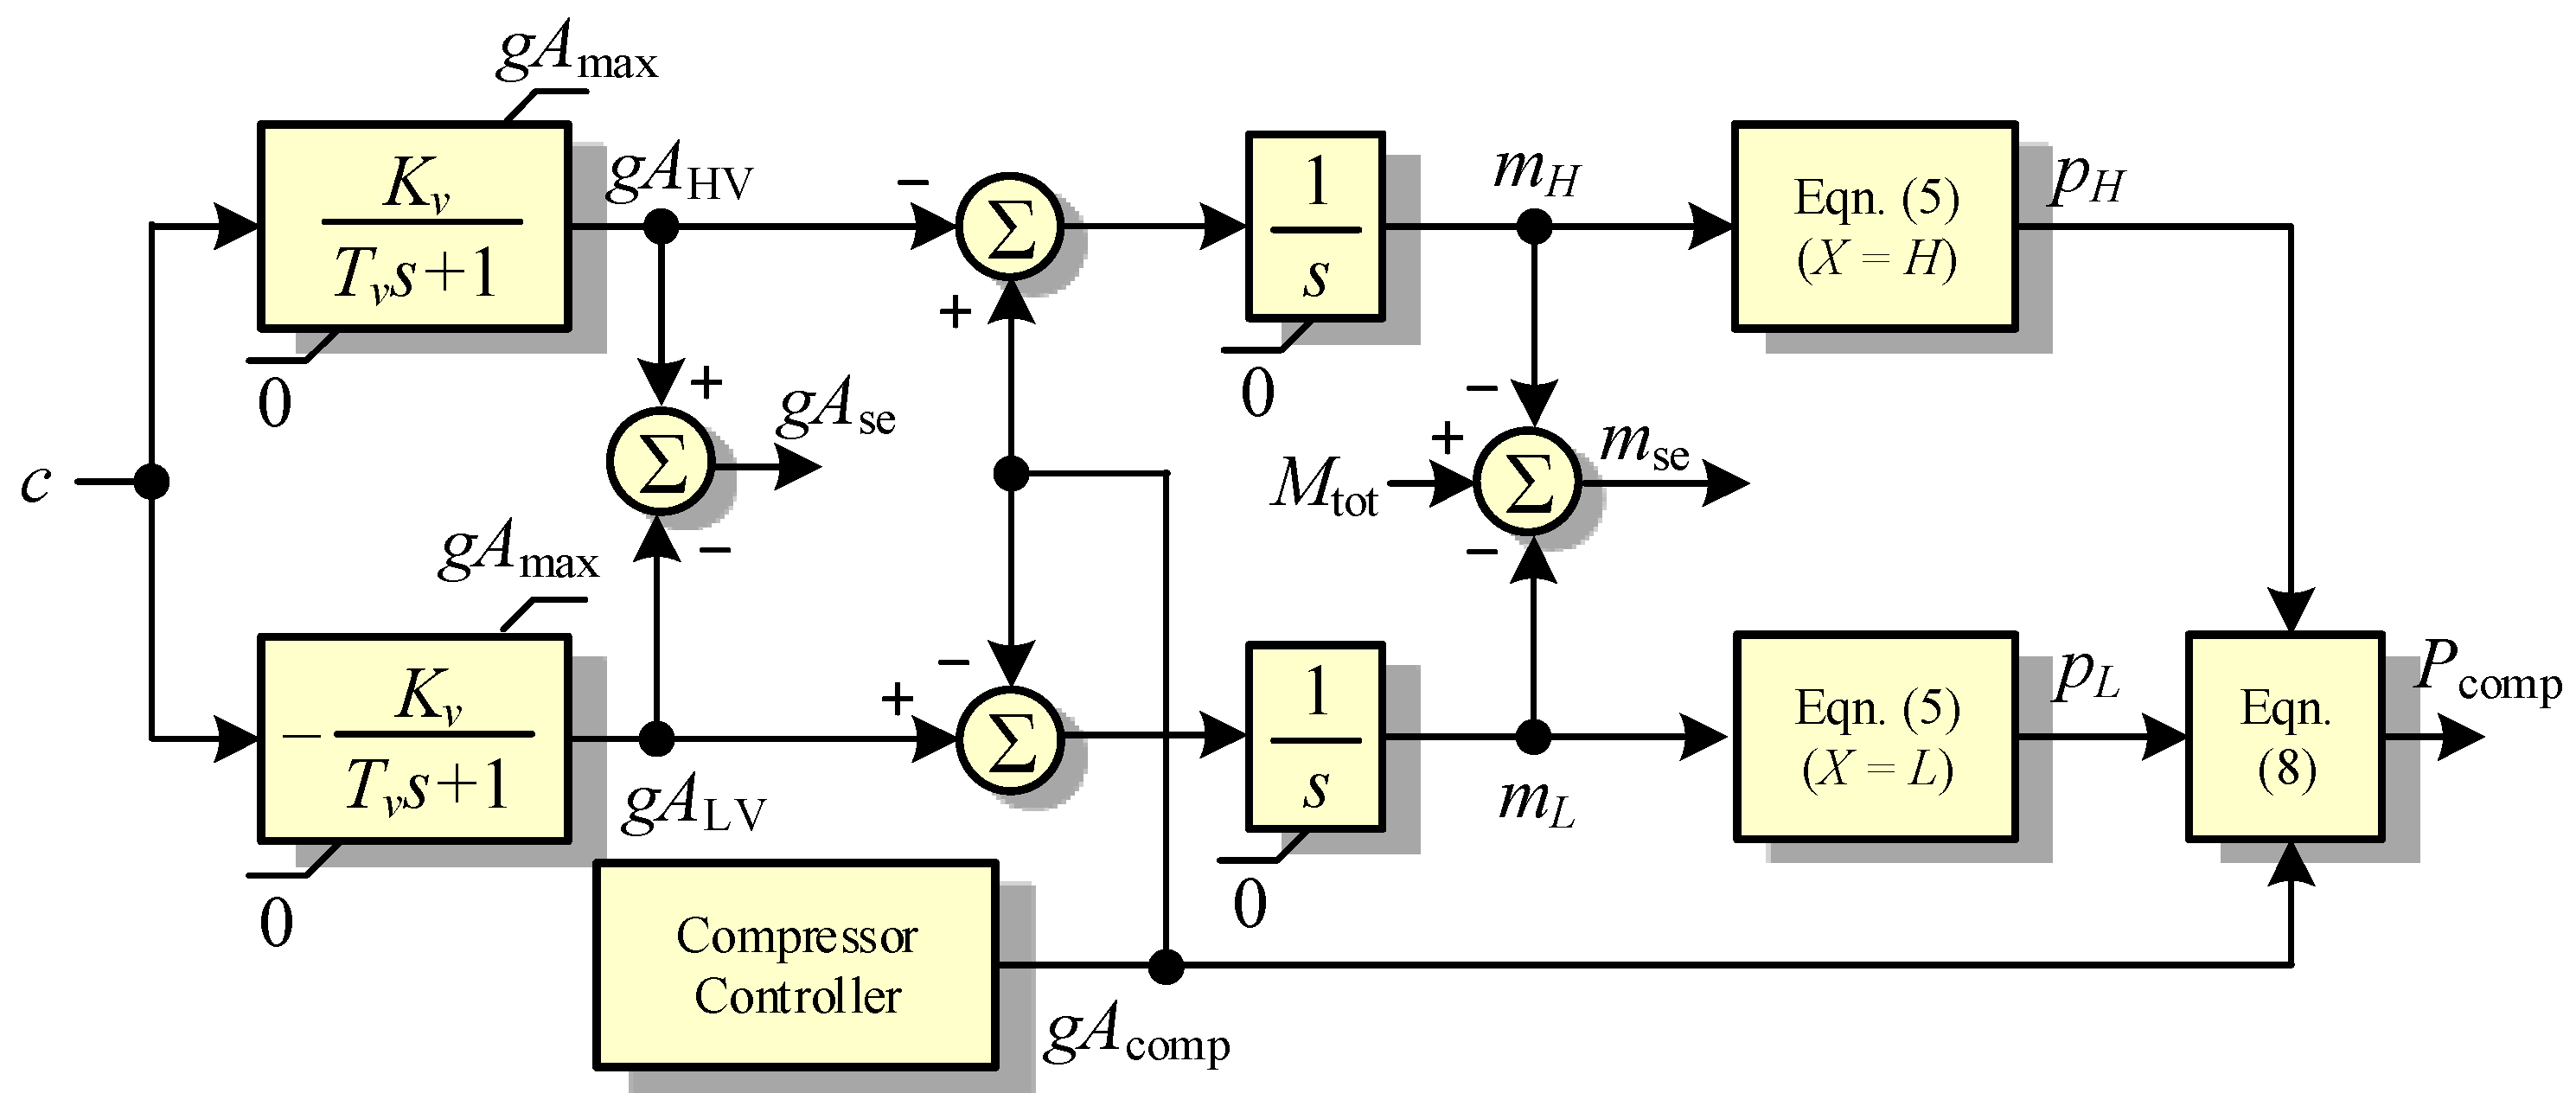
Fast-responding solenoid valves HV and LV are used to regulate the mean pressure pmean of the hydrogen in the engine cylinder by controlling the mass exchange rate gAHV and gALV respectively [11]. The control law, described by Equations (6) and (7), is such that if a positive valve command c is given, HV will open to allow hydrogen to flow into the cylinder while LV will close. This will increase both the mass and mean pressure of the hydrogen in the cylinder. Conversely, the reverse actions are taken for a negative command c. Thus,
T v d ( g A HV ) d t = { g A HV + K v c , c > 0 0 , c 0
T v d ( g A LV ) d t = { 0 , c > 0 g A LV K v c , c 0
In Equations (6) and (7), Kv and Tv are the gain and the time constant of the solenoid valves, respectively. As pH > pmean > pL, hydrogen can only flow from the high- to the low-pressure tanks via the cylinder. As this flow continues, pH will be decreasing while pL will correspondingly increase. This is an unsustainable situation. A compressor is therefore used to maintain the gas pressures in the tanks at suitable levels. Considering the thermodynamic process to be a two-state polytropic compression, the power Pcomp consumed by the compressor can be expressed as [25]:
P comp = p N T N R P m , N M 2 T comp n c n c 1 [ ( p H p L ) n c 1 n c 1 ] g A comp η comp
where ηcomp is the overall efficiency of the compressor, nc is the polytropic constant, and the compressor temperature Tcomp is assumed to be the same as the cold sink temperature Tk. gAcomp is the mass flow rate of the gas in the compressor. With the compressor in operation, the mass balance equations are:
d m H d t = g A comp g A HV
d m L d t = g A LV g A comp
m se = M tot m H m L
g A se = g A HV g A LV
where Mtot is the total mass of the hydrogen in the DS system.
The block diagram of the pneumatic model, containing Equations (5)–(12), of the hydrogen supply system is shown in Figure 3, and the parameters used in this work are given in Table 2. Note that the operation of the valves is limited by the maximum mass flow rate gAmax, as indicated in Figure 3.

2.4. DFIG Model

For the time-domain simulation and control system design, a fifth-order induction machine model has been widely used [18,26]. Expressed in the synchronous reference frame, the voltage equations, flux linkage equations, and electromagnetic equation of this per-unit DFIG model are given as Equations (13)–(15), respectively:
{ v ds = R s i ds + ψ qs 1 ω e d ψ ds d t v qs = R s i qs ψ ds 1 ω e d ψ qs d t v dr = R r i dr + ( 1 ω r ) ψ qr 1 ω e d ψ dr d t v qr = R r i qr ( 1 ω r ) ψ dr 1 ω e d ψ qr d t
{ ψ ds = L s i ds + L m i dr ψ qs = L s i qs + L m i qr ψ dr = L r i dr + L m i ds ψ qr = L r i qr + L m i qs
T e = L m ( i qr i ds i dr i qs )
where vds and vqs are d- and q-axis stator voltages, respectively; vdr and vqr are d- and q-axis rotor voltages, respectively; ids and iqs are d- and q-axis stator currents, respectively; idr and iqr are d- and q-axis rotor currents, respectively; ψds and ψqs are d- and q-axis stator flux linkages, respectively; ψdr and ψqr are d- and q-axis rotor flux linkages, respectively; Rs and Rr are the stator and rotor resistances; Ls, Lr, and Lm are the stator self-inductance, rotor self-inductance, and mutual inductance, respectively; ωr is the shaft angular speed; and Te is the electromagnetic torque Te of the DFIG, respectively. Note that the generator convention is used and all the quantities are expressed in per-unit except the synchronous speed ωe =f, where f is the nominal system frequency.
Moreover, the motion equation of the DFIG is:
2 H d ω r d t = T m T e D ω r
where H is the inertia constant of a one-mass lumped-parameter shaft model of the DFIG-based DS system and D is the damping constant. Tm is the mechanical torque of the DFIG. Note that the selected base values for angular speed and torque quantities of the DFIG per-unit system are different from those given in Table 1, and the following equations are used for unit conversion:
ω m = 2 π f N / p n ω m , N 1 r ω ω r
T m = 2 π f N / p n S N P m , N ω m , N 1 r ω τ m
where SN is the nominal apparent power rating of the DFIG, pn is the number of pole pairs of the DFIG, and rω represents the gearbox ratio.
Finally, taking the power Pcomp consumed by the compressor into consideration, the total active power generated by the PCU is thus:
P PCU = P s + P r P m , N S N P comp = ( v ds i ds + v qs i qs ) + ( v dr i dr + v qr i qr ) P m , N S N P comp
where Ps and Pr are the stator and rotor powers of the DFIG, respectively. The model parameters of DFIG used in this work are given in Table 3.

3. Local Control System of the PCU

The design of the local control system for each PCU is presented in this section. There are three main control objectives under consideration, including (1) active power control, (2) receiver/absorber temperature control, and (3) tank pressure control. The study of the interaction between PCU and the grid system, including the reactive power and voltage control, is not the focus of the present investigation. Hence, we assume the DS system is connected to a single-machine infinite bus system and the terminal voltage at the point of connection is ideally maintained at the nominal voltage.

3.1. Direct Torque Control

For active power regulation, direct torque control (DTC) can simplify the procedure of controller design and reduce the parameter dependence of the system compared to the conventional voltage-modulated control schemes [27]. This approach is employed by taking advantage of the main features of this control concept, i.e., lower machine parameters dependency, simpler structure, no coordinate transformation, high dynamic performances, and minimal response time, which achieves better torque control conditions than field-oriented control.
The schematic of the DTC is shown in Figure 4. First, the measured three-phase rotor and stator currents are transformed into the components iαr, iβr, iαs, and iβs in the two-phase stationary reference frame using a Clark transformation. The electromagnetic torque Te, the magnitude Ψr and angle θΨr of the rotor flux linkage are then estimated using Equations (20)–(22), respectively:
T e = ψ α r i β r ψ β r i α r
ψ r = ψ α r 2 + ψ β r 2
θ ψ r = arctan ( ψ β r / ψ α r )
where ψαs and ψβs are calculated using:
{ ψ α r = L r i α r + L m i α s ψ β r = L r i β r + L m i β s
The estimated Te is compared with the torque reference Te* obtained from the optimal torque control (OTC), which will be discussed in Section 3.2. The difference ΔTe is used as the input of a three-level hysteresis comparator to generate the torque index KT. Similarly, the estimated Ψr is compared with the flux reference Ψr* to meet the requirement of reactive power control (which is not specifically discussed in this article). The difference ΔΨr is sent to a two-level hysteresis comparator to generate the flux linkage index KΨ. Furthermore, θΨr is used to determine the sector number Ks. The six gate signals for the RSC will be selected using a switching table based on the calculated combination of indices KT, KΨ, and Ks. The detail of the implementation of DTC can be found in [27] and it is not elaborated on in this article.

3.2. Optimal Torque Control

The DTC introduced in the previous subsection decouples the regulation of the generated active power and the reactive power. By setting the torque reference Te*, the active power of the DFIG-based DS system can be regulated. In order to achieve MPPT, the steady-state analysis is conducted in this subsection to obtain the relationship between the optimal operating speed and the optimal torque.
First, using Equation (3), the steady-state mechanical torque τm of the engine can be expressed as:
τ m = ( b 00 ω m + b 01 + b 02 ω m ) + ( b 10 ω m + b 11 + b 12 ω m ) p mean
Substituting Equation (2) into Equation (1) to eliminate Qh, and setting dTh/dt = 0 and Th = 1 p.u. in the resulting equation, the steady-state mean pressure pmean of the working gas can be expressed as a function of the insolation level I and the engine speed ωm:
p mean = ( K con I ( 1 T a ) / K rec ( a 00 + a 01 ω m ) a 10 + a 11 ω m )
Next, substituting Equation (25) into Equation (24) to eliminate pmean yields an expression of τm as a function of insolation level I and engine speed ωm:
τ m = ( b 00 ω m + b 01 + b 02 ω m ) + ( b 10 ω m + b 11 + b 12 ω m ) × K con I ( 1 T a ) / K rec ( a 00 + a 01 ω m ) a 10 + a 11 ω m
Using Equation (26), a family of τm versus ωm curves at different insolation levels can be obtained and plotted, as shown in Figure 5. It can be seen that at the same insolation level, there is a decreasing trend in τm as the engine speed ωm increases. In order to achieve the maximum energy harness, one can evaluate the engine power Pm = τmωm at every insolation level, and the theoretical MPPT or OTC curve on the τm versus ωm plane can then be obtained and shown as H-K in Figure 5.
However, the practical operation of the DS system is restricted by several physical limits. In Figure 5, these limits are indicated by: (a) the maximum mean pressure curve A-H (pmean = pmax = 1.0 p.u.), (b) the minimum mean pressure curve D-G (pmean = pmin), (c) the maximum insolation curve A-B (I = 1.0 p.u.), (d) the minimum speed limit F-G (ωm = ωm,min), and (e) the maximum speed limit B-C (ωm = ωm,max). Consequently, the feasible OTC curve becomes A-H-K-G, in which A-H and K-G are restricted by the maximum mean pressure of the working gas and the minimum engine speed, respectively. As such, it is expected that the DS system can track A-H-K-G in order to extract as much power when insolation varies.
When implementing A-H-K-G in the control system, the torque reference shall be determined using the measured speed quantities. However, it can be seen that the torque is not uniquely determined by the speed when the system is operating on the minimum speed line G-K. Therefore, the tracking curve A-H-K-G is modified by replacing the constant speed line G-K with a ramp line G-T as shown in Figure 5. The revised feasible MPPT curve is thus A-H-T-G instead. The feasible optimal torque is thus expressed as a function fopt of engine speed:
τ m , opt = f opt ( ω m )
Using Equations (16)–(18) and Equation (27), one can obtain the steady-state Te versus ωr relationship that will be used in the DFIG control system, as shown in Figure 4:
T e * = T e , opt = 2 π f N / p S N P m , N ω m , N f opt ( 2 π f N / p ω m , N ω r ) D ω r

3.3. Receiver/Absorber Temperature Control

Temperature control of a DS system is essential because it ensures the safe and efficient operation of the PCU. The receiver/absorber temperature Th is anticipated to be as high as possible to increase the thermal efficiency (which is defined as the energy conversion efficiency from the absorbed heat transfer rate Qh to the mechanical power Pm of the Stirling engine) of the Stirling engine, while the material of the receiver/absorber will be damaged if the maximum tolerable temperature is exceeded [11].
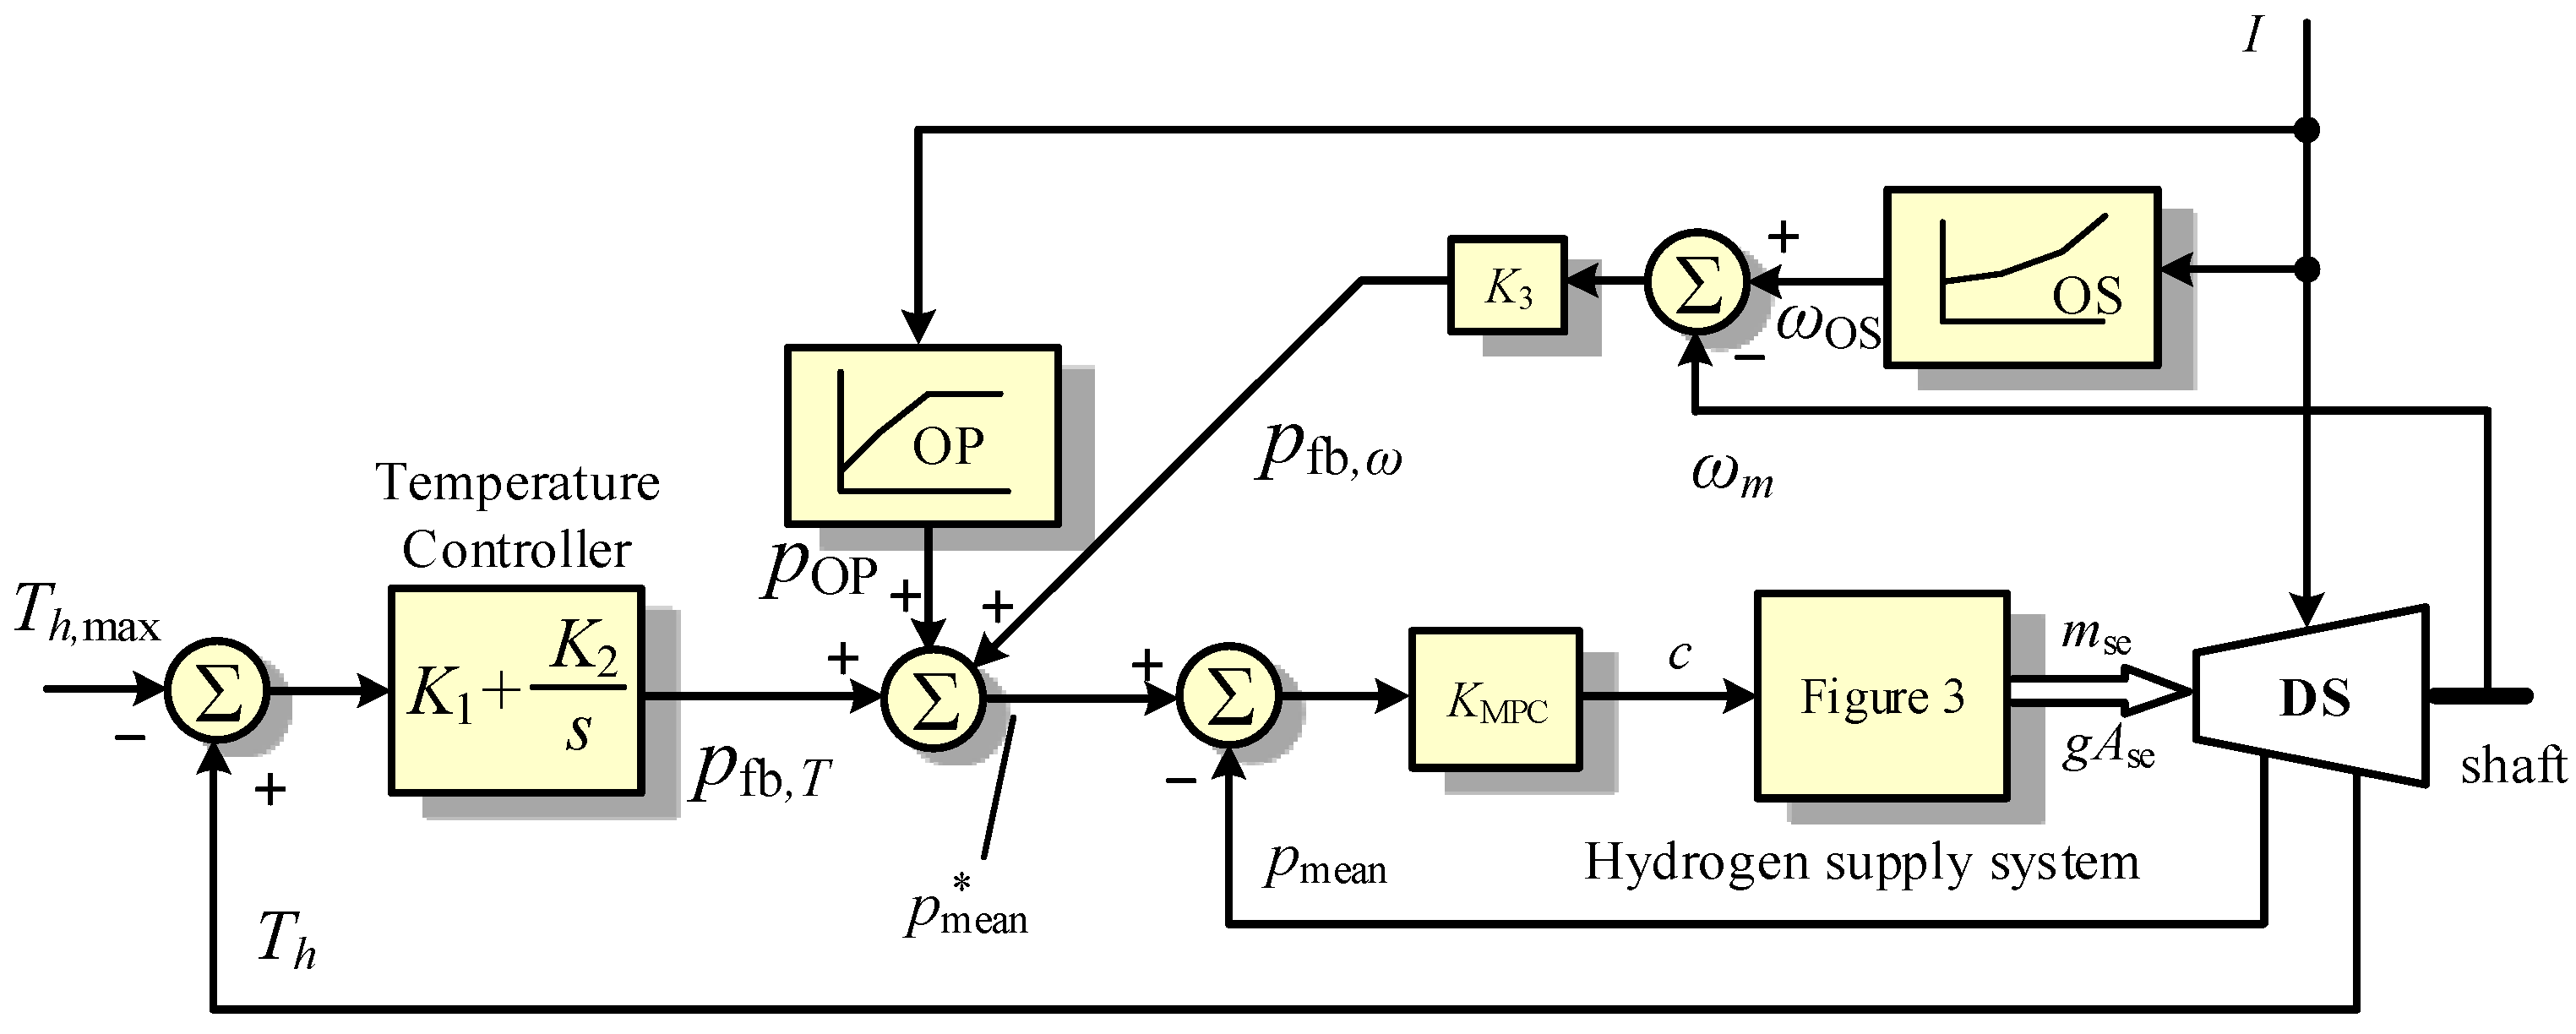
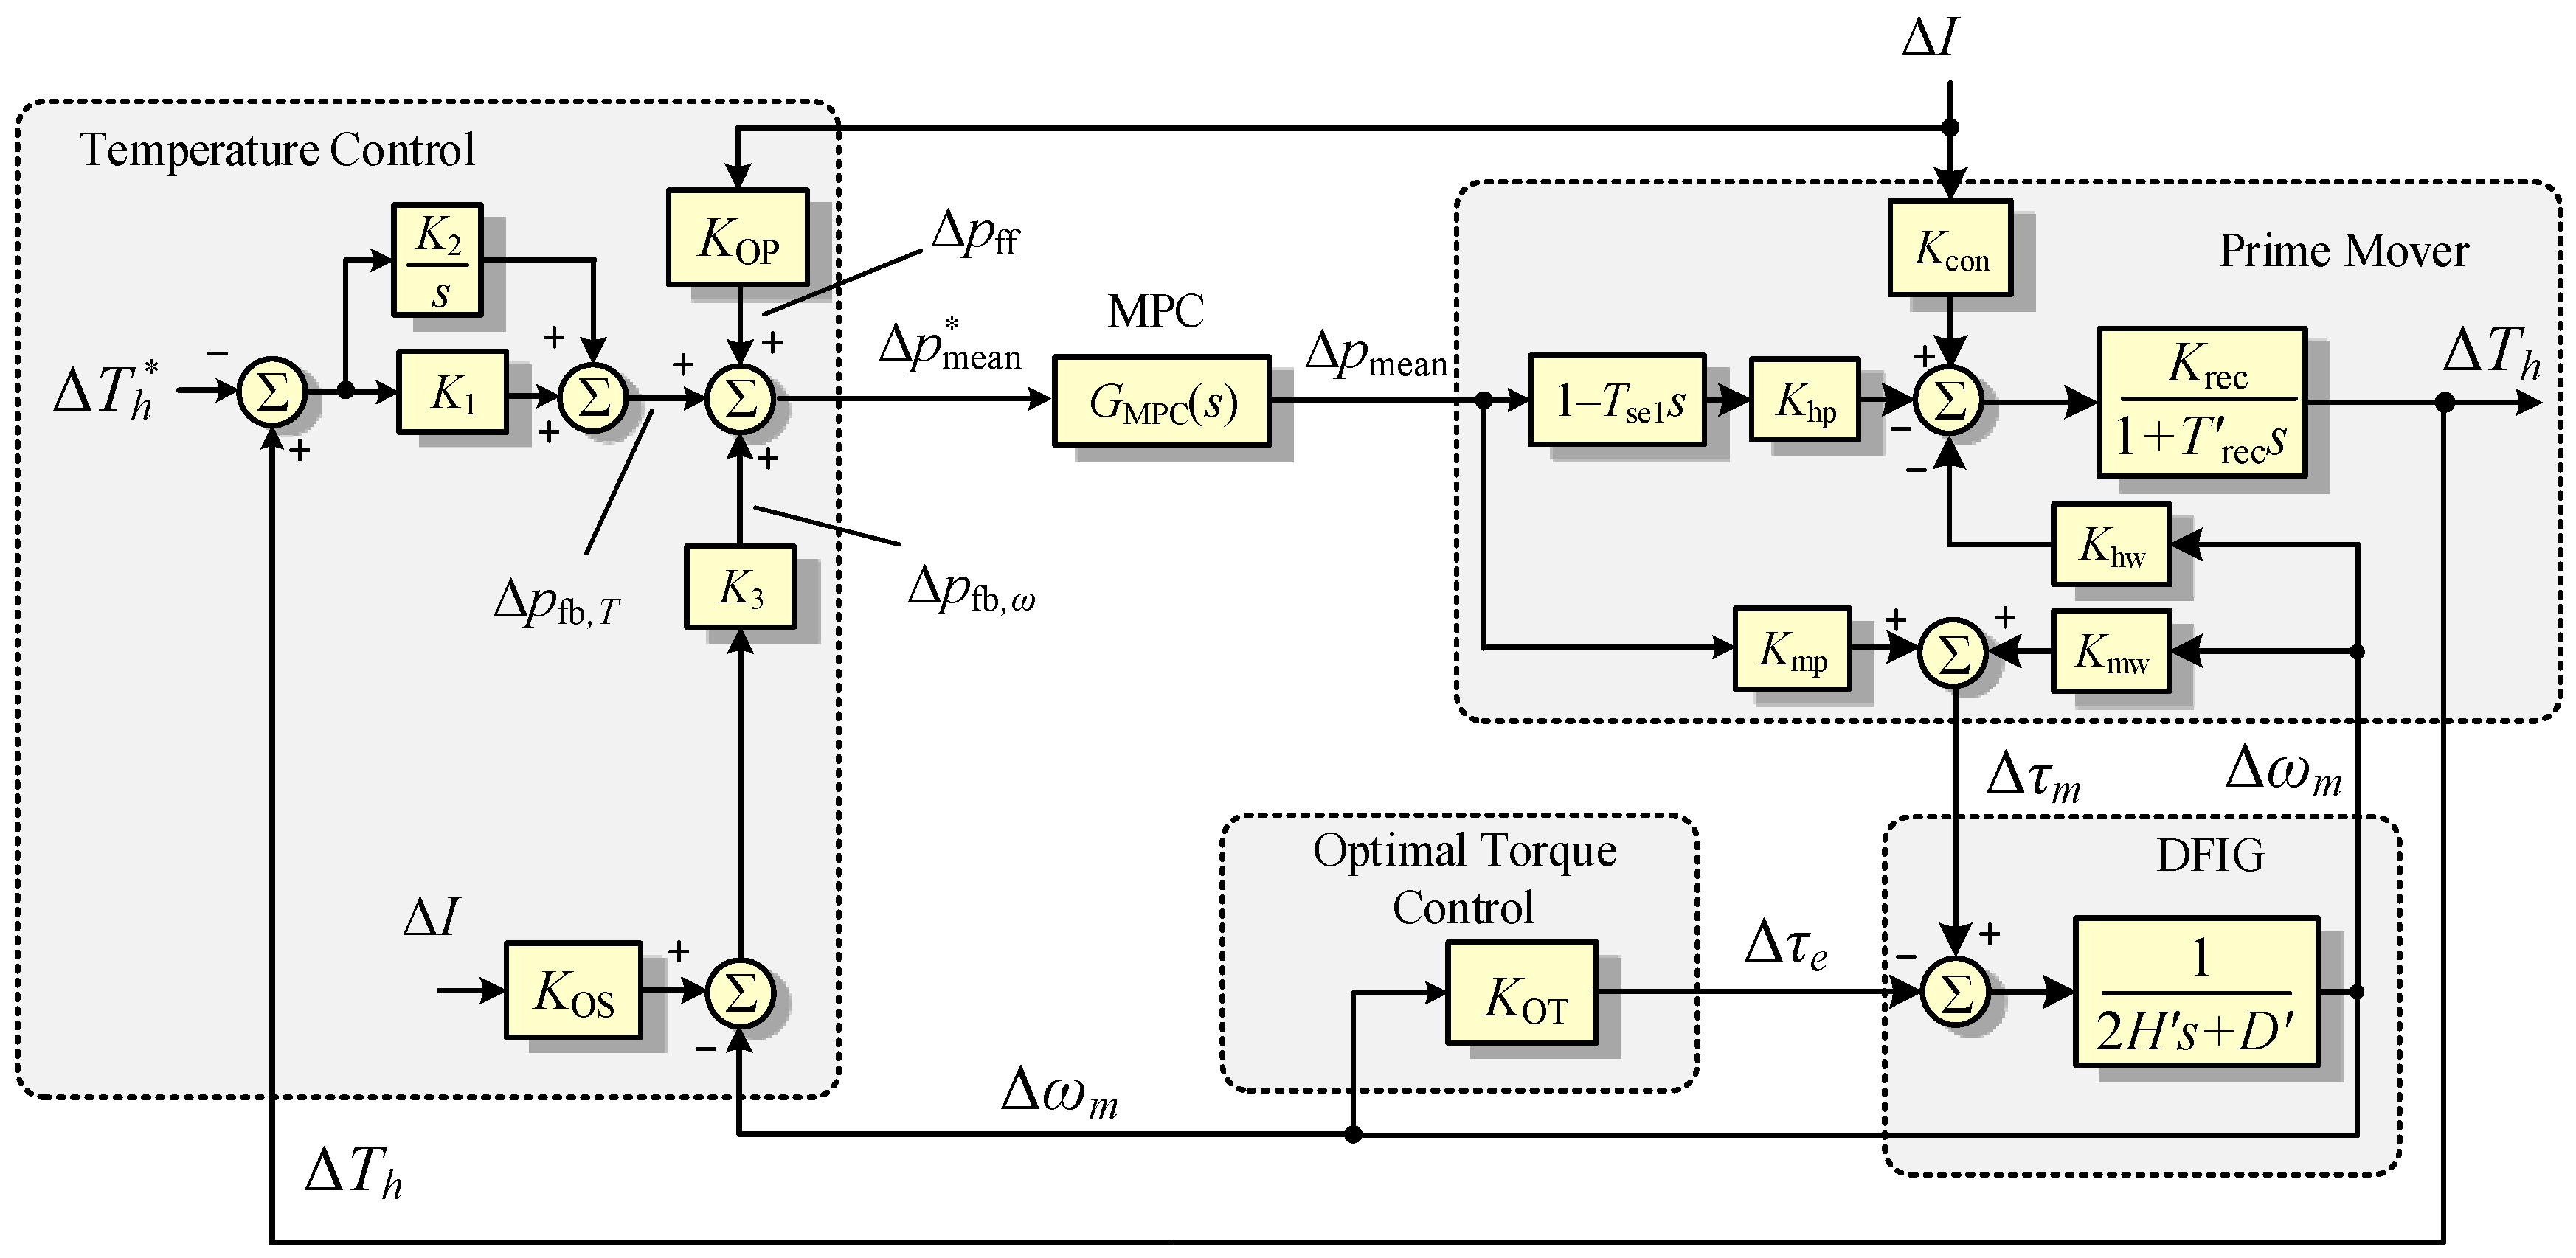
As explained in [19], to overcome the problems caused by speed variation and system nonlinearity in a variable-speed DS system, a fuzzy supervisory control can be designed by taking advantage of the relatively slow variation of the insolation. Several local temperature controllers are designed using the pole-placement method by linearizing the system model at several selected operating points. The supervisor determines the control decision c of the solenoid valves. Although effective, a large set of control parameters have to be tuned. The selection of suitable positions of poles are empirical due to the complex control structure. In this subsection, we propose a simple temperature control scheme and only three control parameters need to be determined. The schematic of the proposed temperature control system is shown in Figure 6.
As shown in Figure 6, instead of using the pole placement method for the design of a state feedback controller, a mean pressure control (MPC) scheme for the conventional fixed-speed DS system is used here, which is expressed as [14]:
c = K MPC ( p mean * p mean )
where p mean * is the set-point of the mean pressure of the working gas, and KMPC is the control gain of MPC. In order to reduce the negative impact of the disturbances of the varying insolation and speed, in the proposed temperature control scheme, the pressure set-point p mean * is expressed as:
p mean * = K 1 ( T h T h , max ) + K 2 ( T h T h , max ) d t p fb , T + p OP ( I ) + K 3 ( ω OS ( I ) ω m ) p fb , ω
Here p mean * consists of three components: pfb,T is the output of the temperature PI controller, pOP is the term for feedforward compensation of the disturbance due to the insolation variation, and pfb,ω is the term to compensate for the disturbance due to the speed variation.
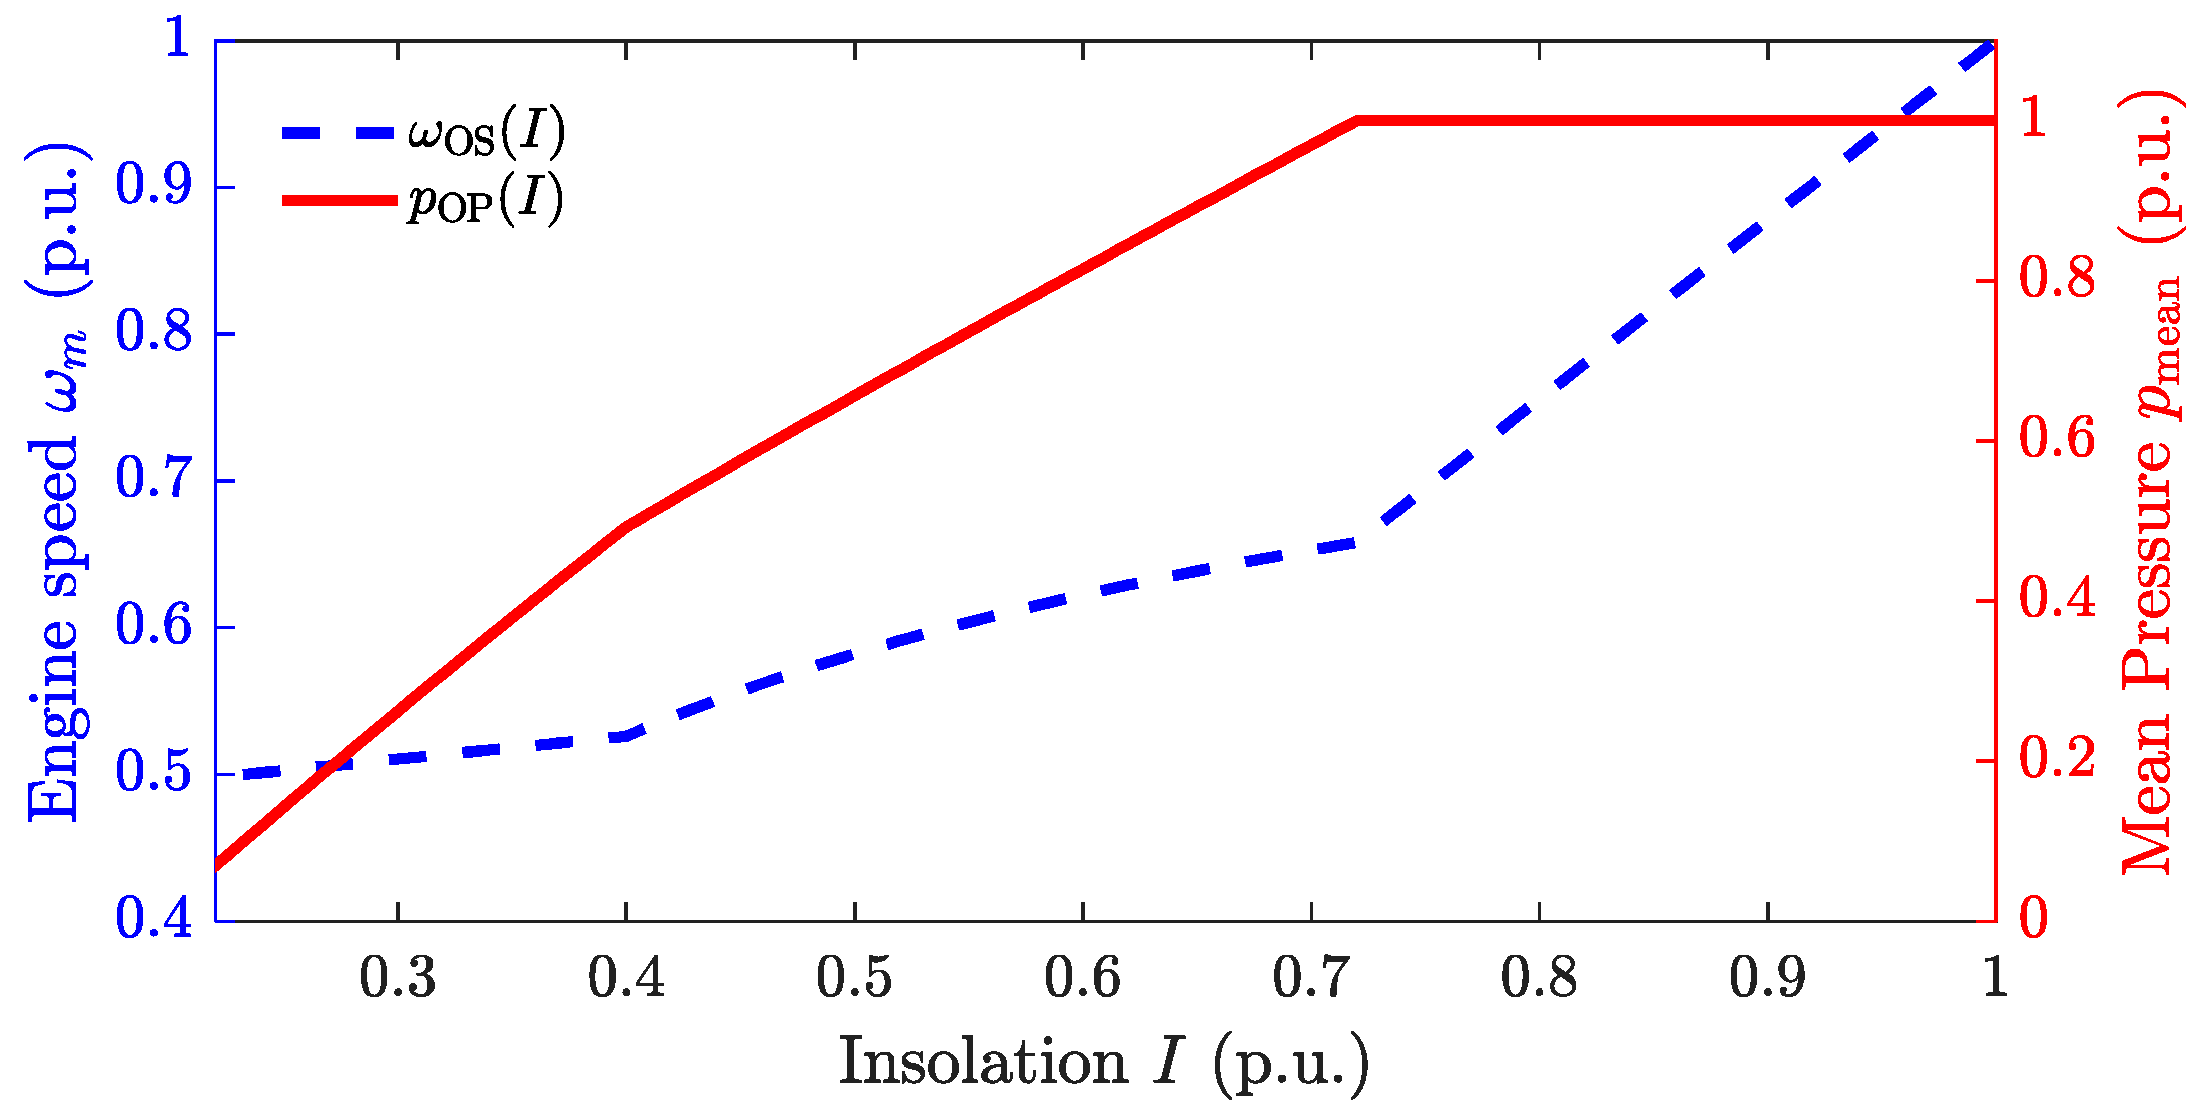
The optimal mean pressure (OP) function pOP(I) and the optimal speed (OS) function ωOS(I) depend on the steady-state pmean versus I and ωm versus I relationships, respectively, which can be predetermined analytically as follows. First, substituting Equation (27) into Equation (26) yields the ωm versus I relationship. Next, using this ωm versus I relationship and Equation (25) gives the pmean versus I relationship. These relationships are shown in Figure 7 and they can be implemented using two look-up tables.

3.4. Tank Pressure Control

Moreover, as shown in Figure 3, the compressor shall be used to maintain the tank pressure. The control law is expressed as:
g A comp = K 4 ( p H * p H )
Hence, it can be seen that only four control parameters K1, K2, K3, and K4 are required to be determined in Equations (30) and (31). The selection of the optimal control parameters will be determined using the PSO method in the next section.

4. Determination of Control Parameters

4.1. Constraints on Temperature Control Parameters

To determine the optimal control parameters, model order reduction is done first to simplify the stability analysis and to reduce the simulation time. First, to study the stability of the temperature control system, the effects of the compressor and pressure tanks are ignored by setting gAcomp = 0 and Pcomp = 0. In doing so, the hydrogen supply system model described using Equations (5)–(12) collapses to that shown in [19]:
T v d ( g A se ) d t = g A se + K v c
d p mean d t = K p ( g A se )
With Equations (32), (33), and (29), the transfer function GMPC(s) of the MPC is:
G MPC ( s ) = p mean ( s ) p mean * ( s ) = 1 T v T p s 2 + T p s + 1
where Tp = 1/(KMPCKvKp) = 4ξ2Tv and ξ is the damping ratio. For ξ = 0.707, Tp = 2Tv. As Tv << 1, the effect of the dynamics of the MPC system is ignored in a temperature control system design (i.e., pmean = p mean * ).
Second, as the DTC of the DFIG provides very fast response to active power regulation, the torque is assumed ideally controlled by τe = τe*.
The resulting reduced order model made up of Equations (1)–(3), (16), (27), (29), and (30) with the assumptions pmean = p*mean and τe = τe*, is hereafter denoted the TC-ROM. The small-signal model for temperature control design can be obtained by linearizing TC-ROM at an operating point x0 = [pmean0 Th0 ωm0]. The corresponding block diagram of the linearized TC-ROM is shown in Figure 8, where the gains are defined as:
K mp = τ m p mean , K mw = τ m ω m , K hp = Q h p mean , K hw = Q h ω m , K OT = τ e ω m , K OP = p mean I , K OS = ω m I
As can be seen in Figure 8, the plant for the temperature control design (including the prime mover, DFIG, MPC, and OTC) is a third-order single-input-single-output (SISO) system with one disturbance (insolation I).
The characteristic equation of the system can be readily obtained as:
Δ ( s ) = a 3 s 3 + a 2 s 2 + a 1 s + a 0
where:
a 3 = 2 H ( T rec T se 1 K rec K hp K 1 ) a 2 = 2 H + ( D + K 3 ) T rec + K rec K hp ( 2 H T se 1 D ) K 1 2 H T se 1 K rec K hp K 2 a 1 = ( D + K 3 ) + K rec K 1 ( D K hp + K mp K hw ) + K rec K hp ( 2 H T se 1 D ) K 2 a 0 = K rec K 2 ( D K hp + K mp K hw )
Applying the Routh–Hurwitz stability criterion to Equation (35) gives the following Constraints (36)–(38):
0 < K 1 < T r e c T se 1 K rec K hp
( D + K 3 ) + K rec K 1 ( D K hp + K mp K hw ) K rec K hp ( 2 H T se 1 D ) < K 2 < 2 H + ( D + K 3 ) T rec + K rec K hp ( 2 H T se 1 D ) K 1 2 H T se 1 K rec K hp
( 2 H + ( D + K 3 ) T rec + K rec K hp ( 2 H T se 1 D ) K 1 2 H T se 1 K rec K hp K 2 ) × ( ( D + K 3 ) + K rec K 1 ( D K hp + K mp K hw ) + K rec K hp ( 2 H T se 1 D ) K 2 ) > 2 H K rec K 2 ( T rec T se 1 K rec K hp K 1 ) ( D K hp + K mp K hw )
Constraints (36)–(38) will be used as constraints in the next subsection for particle swarm optimization to determine the optimal control parameters.

4.2. Particle Swarm Optimization

In the present investigation, the control objective is to maximize the energy generation, while maintain the operating temperature at a suitable level. Moreover, the hydrogen pressure in the tanks shall be maintained. For a given insolation profile I(t), we formulate the selection of control parameters as a finite horizon constrained optimization problem:
min K 1 , K 2 , K 3 , K 4 J = min K 1 , K 2 , K 3 , K 4 { 0 t max P PCU ( t ) d t + φ 1 ( T h ( t ) ) + φ 2 ( p H ( t max ) ) }
subject to system model using Equations (1)–(19) and Constraints (36)–(38). In Constraint (39), the first term represents the total generated energy, φ1 is used to implement a state constraint to limit the temperature within a narrow band|ThTh,max| ≤ ΔTh,max, and φ2 is used to introduce an additional cost to make sure that the final value of the tank pressure pH restores to its set-point. They are expressed as:
φ 1 ( T h ( t ) ) = α 0 t max max { T h , max Δ T h , max T h ( t ) , 0 , T h ( t ) T h , max Δ T h , max } d t
φ 2 ( p H ( t max ) ) = β max { p H * Δ p H , max p H ( t max ) , 0 }
where α and β are the penalty coefficients with large values. To obtain the cost J for each combination of control parameters (i.e., each particle), time-domain simulation has to be carried out. In order to reduce the searching time, the system model of Equations (1)–(19) will be simplified by assuming that the electromagnetic torque is ideally controlled using a DTC and no converter dynamics are considered, which yields τ e = τ e * . Next, representing Equation (16) in the per unit system of the prime mover and considering Equation (27), thus gives:
2 H d ω m d t = τ m τ e * D ω m = τ m f opt ( ω m )
where H′ and D′ are converted from H and D as given in Table 3. The PCU power Equation (19) is therefore modified to give:
P PCU = η ( I ) T e ω r P m , N S N P comp = P m , N S N ( η ( I ) τ e ω m P comp )
where η is a coefficient considering the losses in the DFIG windings, and it is expressed as a function of insolation I. Hence, the reduced order model for optimization algorithm design shall consists of Equations (1)–(12), (29)–(31), (42), and (43). Here we denote this model as the PSO-ROM.
In Equation (39), tmax is the time horizon of the insolation profile. Parameters α and β are penalties for the evaluation of the performance of active power regulation and temperature control, respectively.
PSO is a simple and effective metaheuristic optimization technique that is initialized with some population of random candidates and a search algorithm to reach the global optimum for the defined objective function [28]. In an n-dimensional optimization problem, the position vector x ∈ ℝn and velocity vector v ∈ ℝn of the i-th particle in the iteration number j are expressed as:
x i j = [ x i , 1 j x i , 2 j x i , n j ]
v i j = [ v i , 1 j v i , 2 j v i , n j ]
Each position vector represents a potential solution to the problem, while the velocity vector indicates the extent of variation in the updating procedure. The equations with which the velocity and the positions of the particles are updated are:
v i j + 1 = w v i j + c 1 r i j ( p i j x i j ) + c 2 s i j ( g j x i j )
x i j + 1 = x i j + v i j + 1
where p is the recorded best solution for specific particle and g is the global optimal solution among all p. r and s are two random numbers between 0 and 1. w, c1, and c2 are referred as the inertia constant, cognitive scaling parameter, and social scaling parameter, respectively. The recommended values c1 = c2 = 2 in [29] are used in this article and w is selected to be 0.8. These coefficients determine how much of each component from the previous iteration affects the next movement of the algorithm.
For the problem in hand, the position vector is a four-dimensional vector:
x = [ K 1 K 2 K 3 K 4 ]
For the control scheme proposed in [19], there are 20 control parameters that need to be determined: 18 for the temperature controller and 2 for the speed controller. Hence, the number of control parameters have been significantly reduced.
In this article, the values of K1, K2, and K3 shall satisfy Constraints (36)–(38). Hence, during the step to randomly select the particle, an additional step will be included to examine the stability requirement. Unaccepted particles will be abandoned before conducting the time-domain simulation.
However, as most of the parametric values of the gains in the linearized model depends on the insolation level I, the feasible range of K1, K2, and K3 varies. To illustrate this point, in Figure 9 we plot an example of the feasible search subspace (K1, K2) ∈ ℝ2 when K3 = 0. It can be observed that as the insolation increases, the maximum K1 also increases, which can be derived from Constraint (36). The other boundary also moves which is governed by Constraints (37) and (38). To guarantee system stability, the search subspace shall be shared area under all insolation levels. However, considering that all the gains change smoothly, only the cases for the maximum and the minimum insolation are investigated for simplicity. The feasible search subspace is therefore obtained and shown as the shaded area in Figure 9.

5. Results and Discussion

5.1. Model Validation and Comparison

In order to validate the accuracy of the proposed model, in this subsection, the simulation results from the developed model were compared with that obtained using the existing models. All the models were implemented and solved using MATLAB R2016a/Simulink 8.7 (The MathWorks, Inc., Natick, MA, USA). The parameters of the system model used in the simulation are given in Table 1, Table 2 and Table 3. The optimal control parameters obtained in the latter subsection are used.
First, for the Stirling engine, a multi-cylinder adiabatic model of the Stirling engine was used as the benchmark to evaluate the model accuracy of proposed model of Equations (1)–(19). This adiabatic model describes the thermodynamic cycles of four series-connected cylinders, and has been studied intensively in existing literature [11,12,21]. In this case, detailed representation of the converters and the grid system were established using the SymPowerSystems Toolbox. Figure 10 shows the simulation results when a step increase of insolation from 0.6 to 0.65 p.u. occurred at 0.5 s. The purpose was to compare the dynamic response of the models that could affect the stability of the system. It can be seen that using the average-value Stirling engine model, the dynamic behavior of the benchmark model could be successfully captured, while the high-frequency oscillating components in Figure 10c had an ignorable effect on other variables. This is in line with the conclusion of Reference [24]. Furthermore, the simulation results using an assumed prime mover model used in [18] are also presented. This model assumes the prime mover of the DS system is a first-order system and it ignores the detailed description of the thermodynamics of the Stirling engine and temperature control system. The mechanical torque was calculated according to the measured rotational speed of DFIG and insolation, according to the relationship presented in Figure 5. Corresponding temperature and absorbed heat transfer rate are not shown in Figure 10a,c as these variables are not considered in this assumed model. Clearly, it cannot reflect the dynamic characteristics of the DS system for the design of the temperature control system.
The effect of the tank volume VX was investigated next and the proposed hydrogen supply system model was compared with the simplified model used in References [12,19] (i.e., Equations (32) and (33)). The simplified model ignores the detailed representation of the tank and compressor, which leads to VX = +∞ and Pcomp = 0. In this case, the initial insolation level was 0.3 p.u., and it started to increase at 5 s with a ramp rate of 30 W/(m2·s) or 0.03 p.u./s. This value has been considered to be very fast for solar power generation studies [14]. Figure 11 shows the simulations results. A low-pass filter has been applied to the PCU power to remove the high-frequency components. From Figure 11b,d, it can be seen that for VX = 5.5 p.u., the gas pressure in the low pressure tank reached zero during the transient, and a large amount of power was consumed by the compressor from 5 s to 20 s. By increasing the tank volume, the Pcomp profile became flatter. For VX = 500 p.u., the simulation results were close to that of the simplified model. Hence, when designing the optimal control scheme, the effect of the pressure tank and gas compressor should be carefully considered to improve the model accuracy.
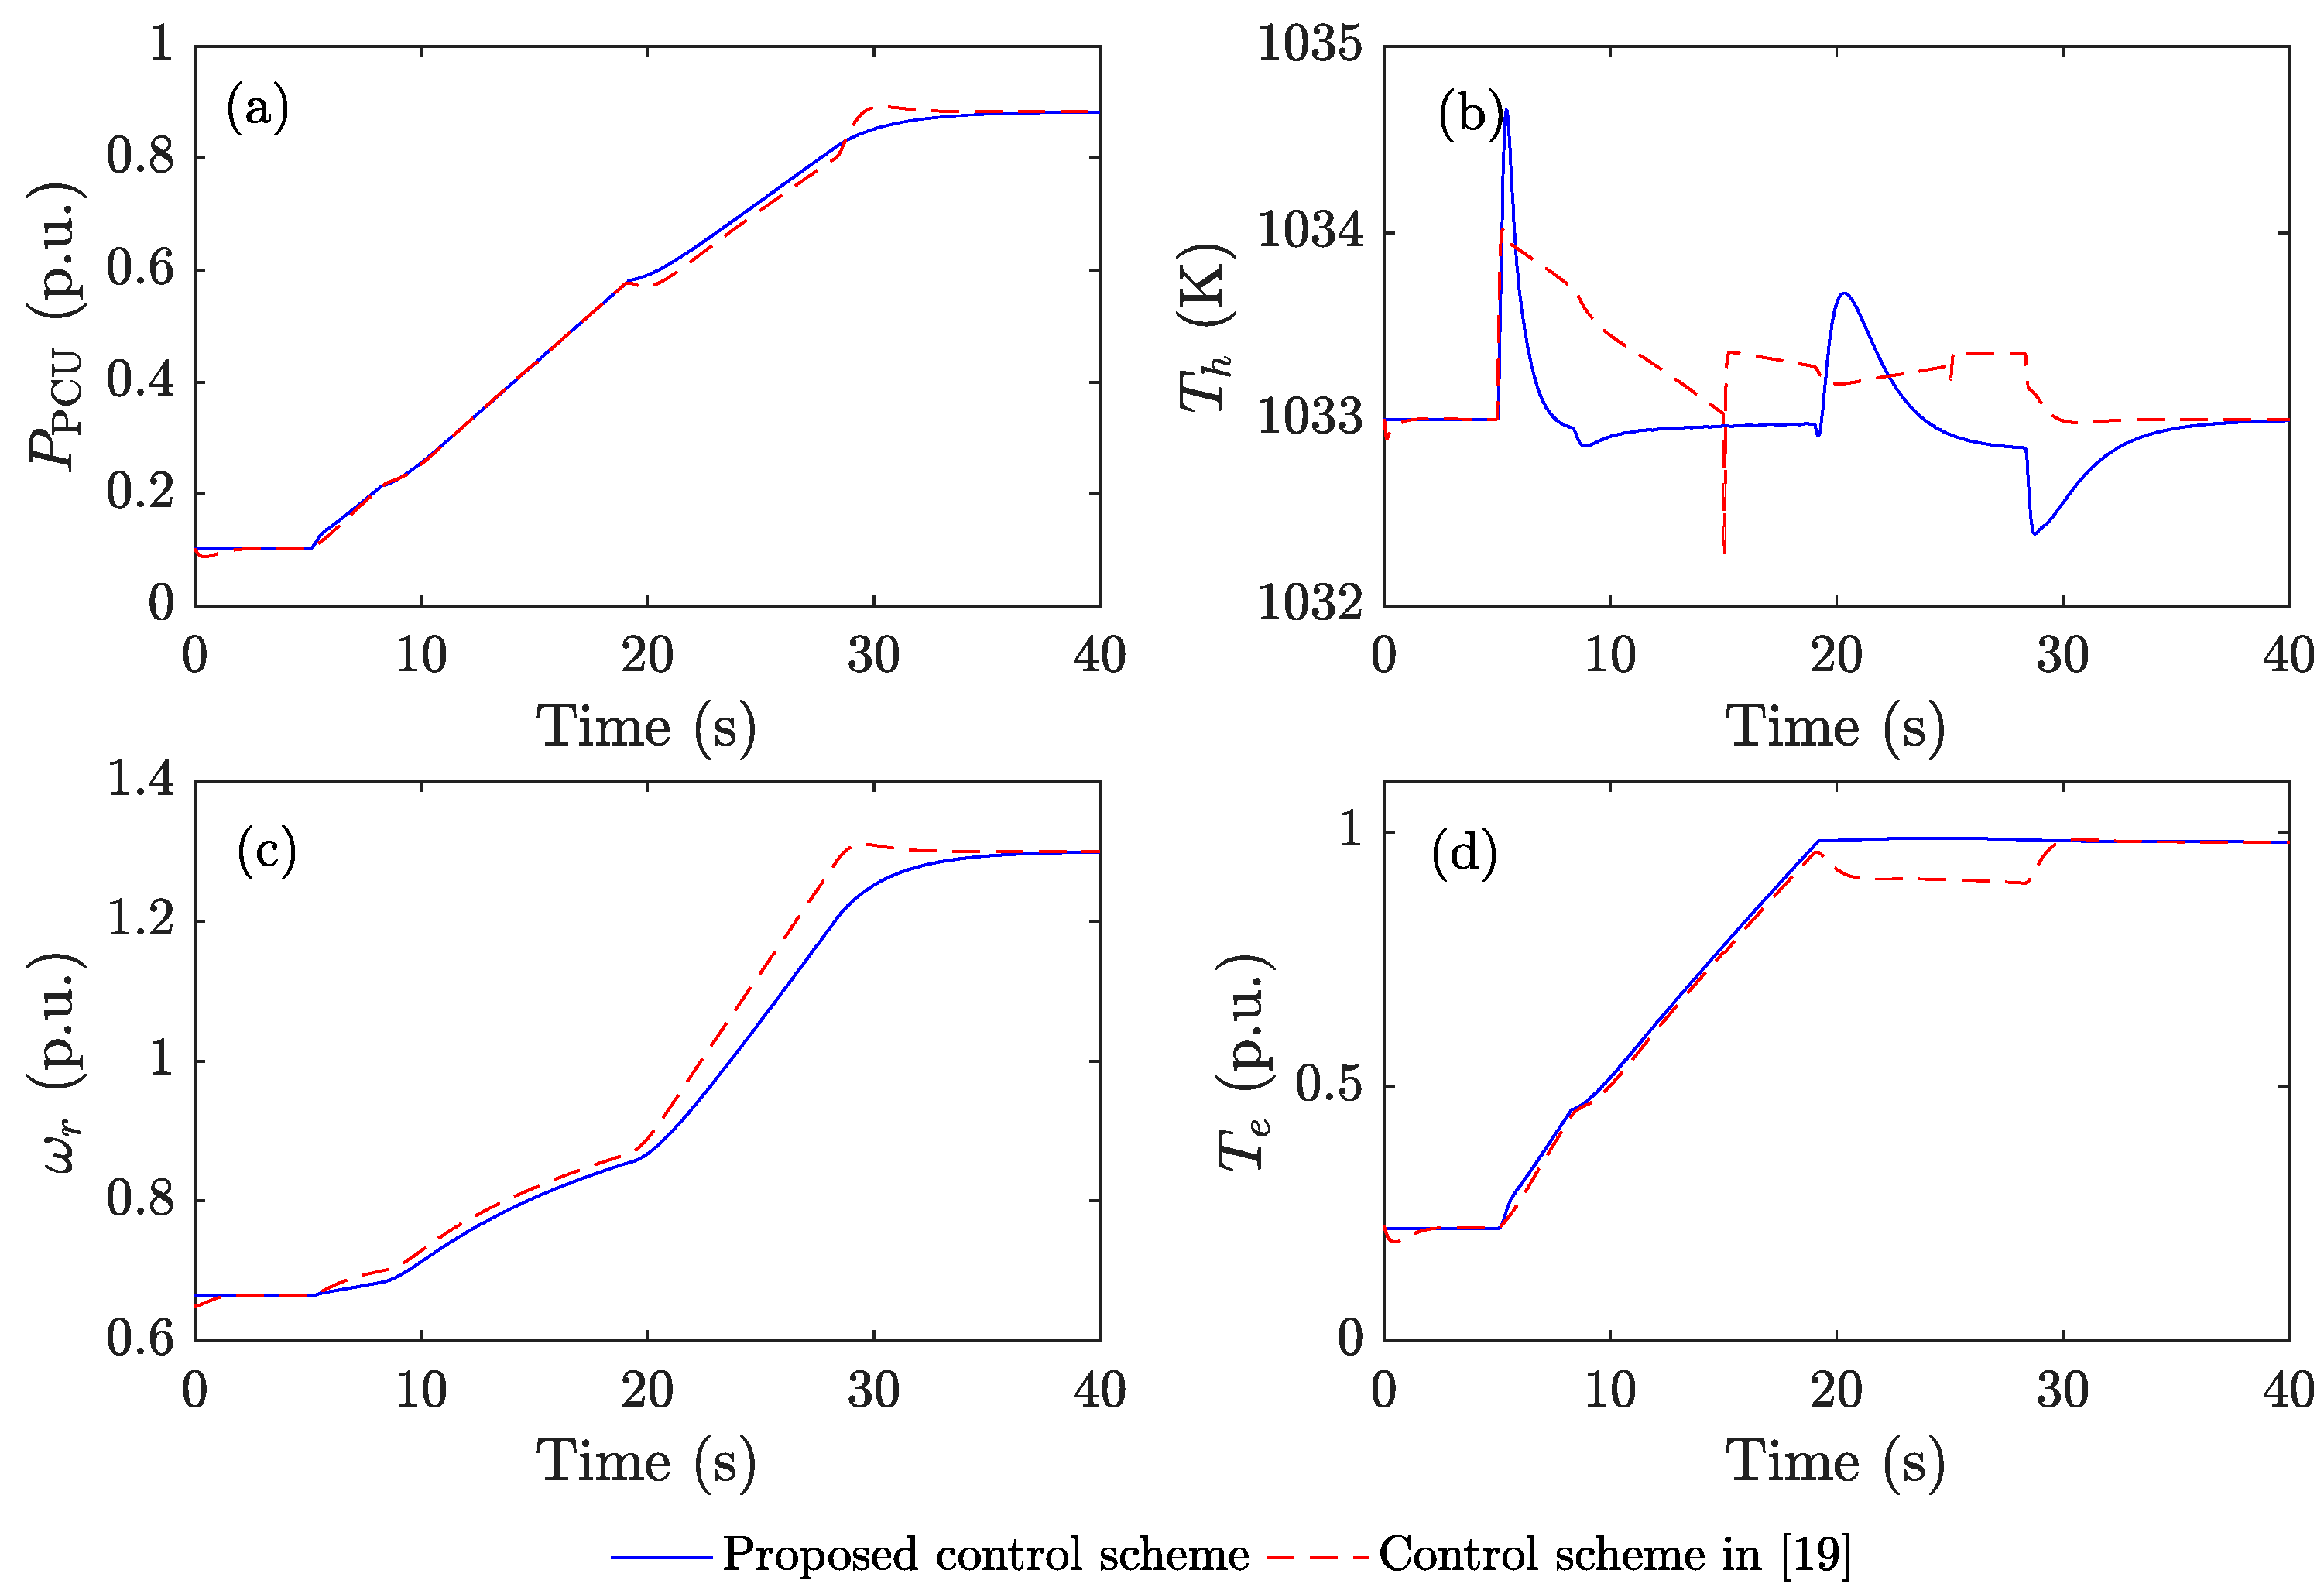
Furthermore, the proposed control scheme described in Section 3 was compared with an existing scheme proposed in [19]. In [19], MPPT was achieved using a classic double-loop control structure, with the outer feedback speed control loop and the inner current control loop. Space-vector pulse width modulation (SVPWM) was used to generate the gate signal for the converter. Detail of such a scheme can be found in most textbooks and thus it is not elaborated on here. Figure 12 shows the simulation results. Again, low-pass filters have been applied to the PCU power and electromagnetic torque.
It can be seen from Figure 12b that for both schemes, the receiver temperature can be effectively regulated around the set-point 1033 K. However, Figure 12a shows that the proposed control scheme provides a smoothened power profile as insolation changes. The reason is explained briefly as follows. For the feedback speed control, in order to track the maximum power points during the insolation increase, an accelerating torque has to be provided. In Figure 12c, a higher ramp rate of speed is observed from 20 s to 30 s, compared to that before 20 s. This was due to the steady-state characteristics of the MPPT curve given in Figure 5. Hence, during this period, the control system had to reduce the electromagnetic torque of the DFIG so that more accelerating torque could be provided, and this could be observed from Figure 12d. Meanwhile, for the proposed DTC scheme, the torque is directly regulated according to the measured insolation, such that an unexpected decrease in electromagnetic torque can be effectively avoided, resulting in a flatter speed profile, as shown in Figure 12c.

5.2. Case Study

This section will present a case study where the simulation results were obtained from MATLAB/Simulink software. In this case study, the following 100-second insolation profile I(t) was used for PSO: the initial insolation was 0.25 p.u. and the insolation was ramped up to the maximum insolation level 1.0 p.u. and then ramped down back to 0.25 p.u. The global optimal solution and the corresponding cost for each iteration are shown in Figure 13. Here, the particle size was 20. From Figure 13, it can be seen that the result converged and became stable at the 18th iteration, and the optimal control parameters were found to be K1 = 11.1, K2 = 11.8, K3 = 0.18, and K4 = 25.5.
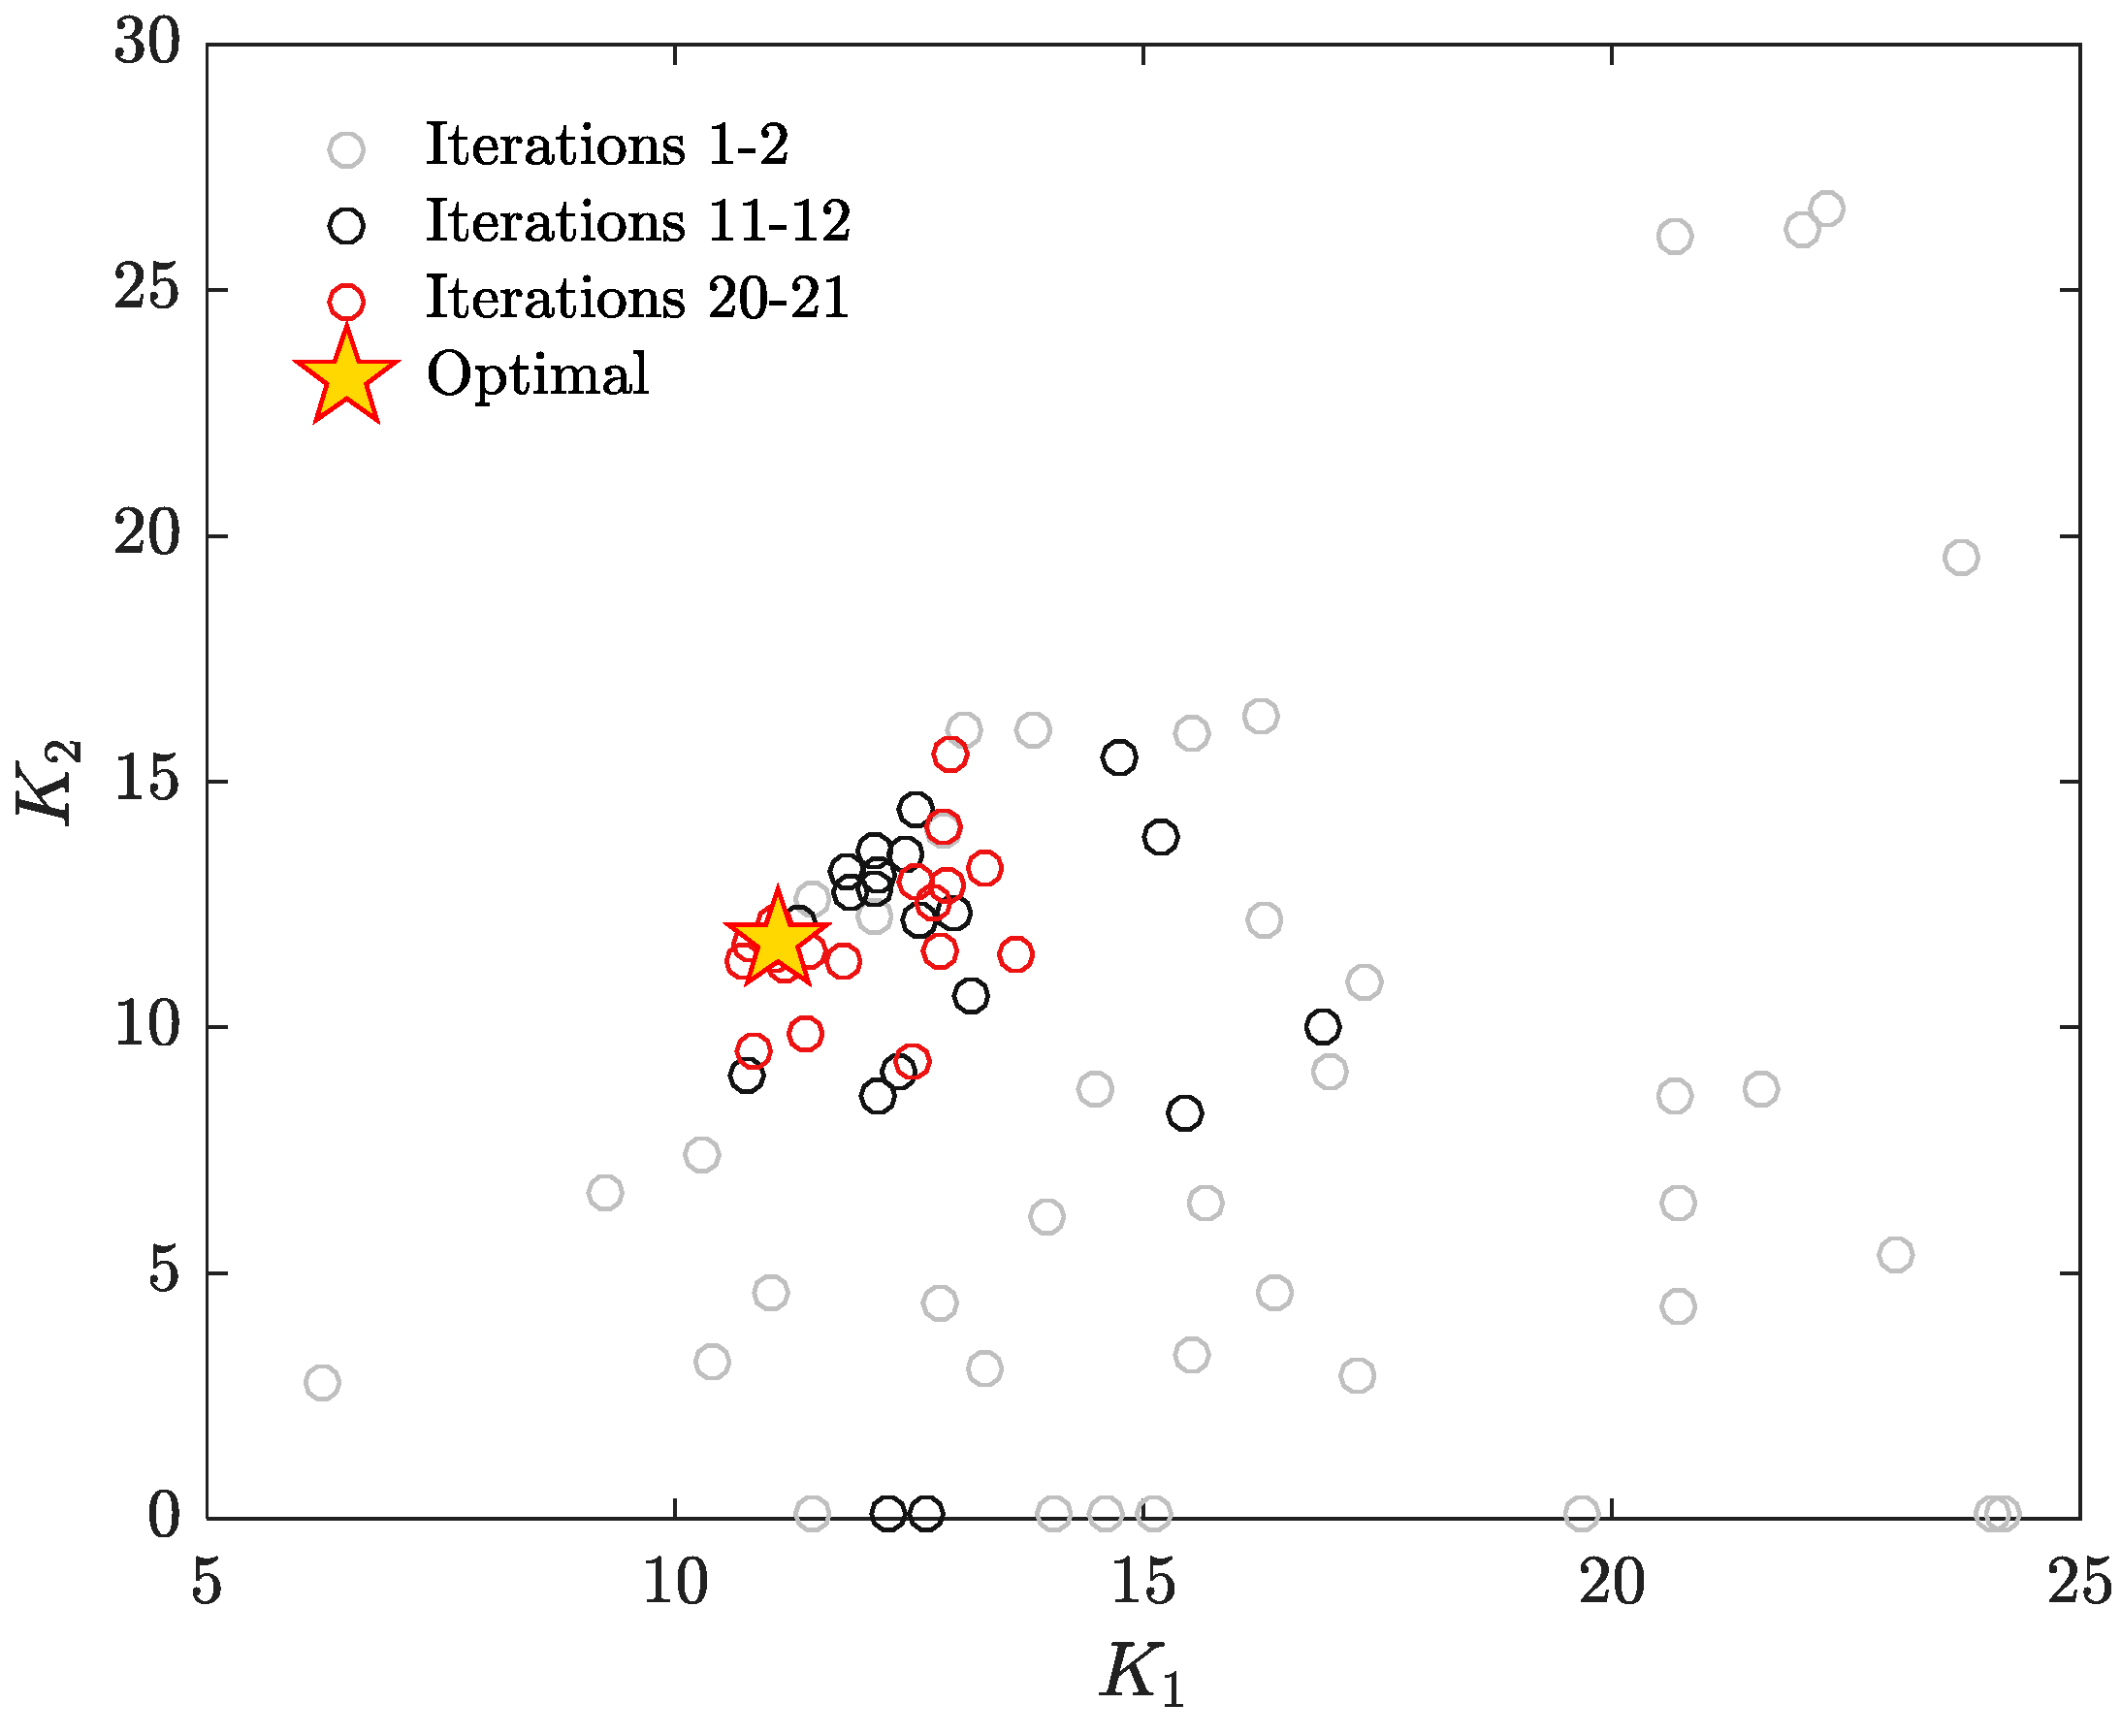
Figure 14 shows the positions of the randomly generated particles using PSO at iteration 1, 2, 11, 12, 20, and 21. Note that only two dimensions (K1, K2) are shown. It can be seen that the generated particles were approaching the optimal position as iterations increased, and all the particles fell within the feasible search subspace shown in Figure 9.
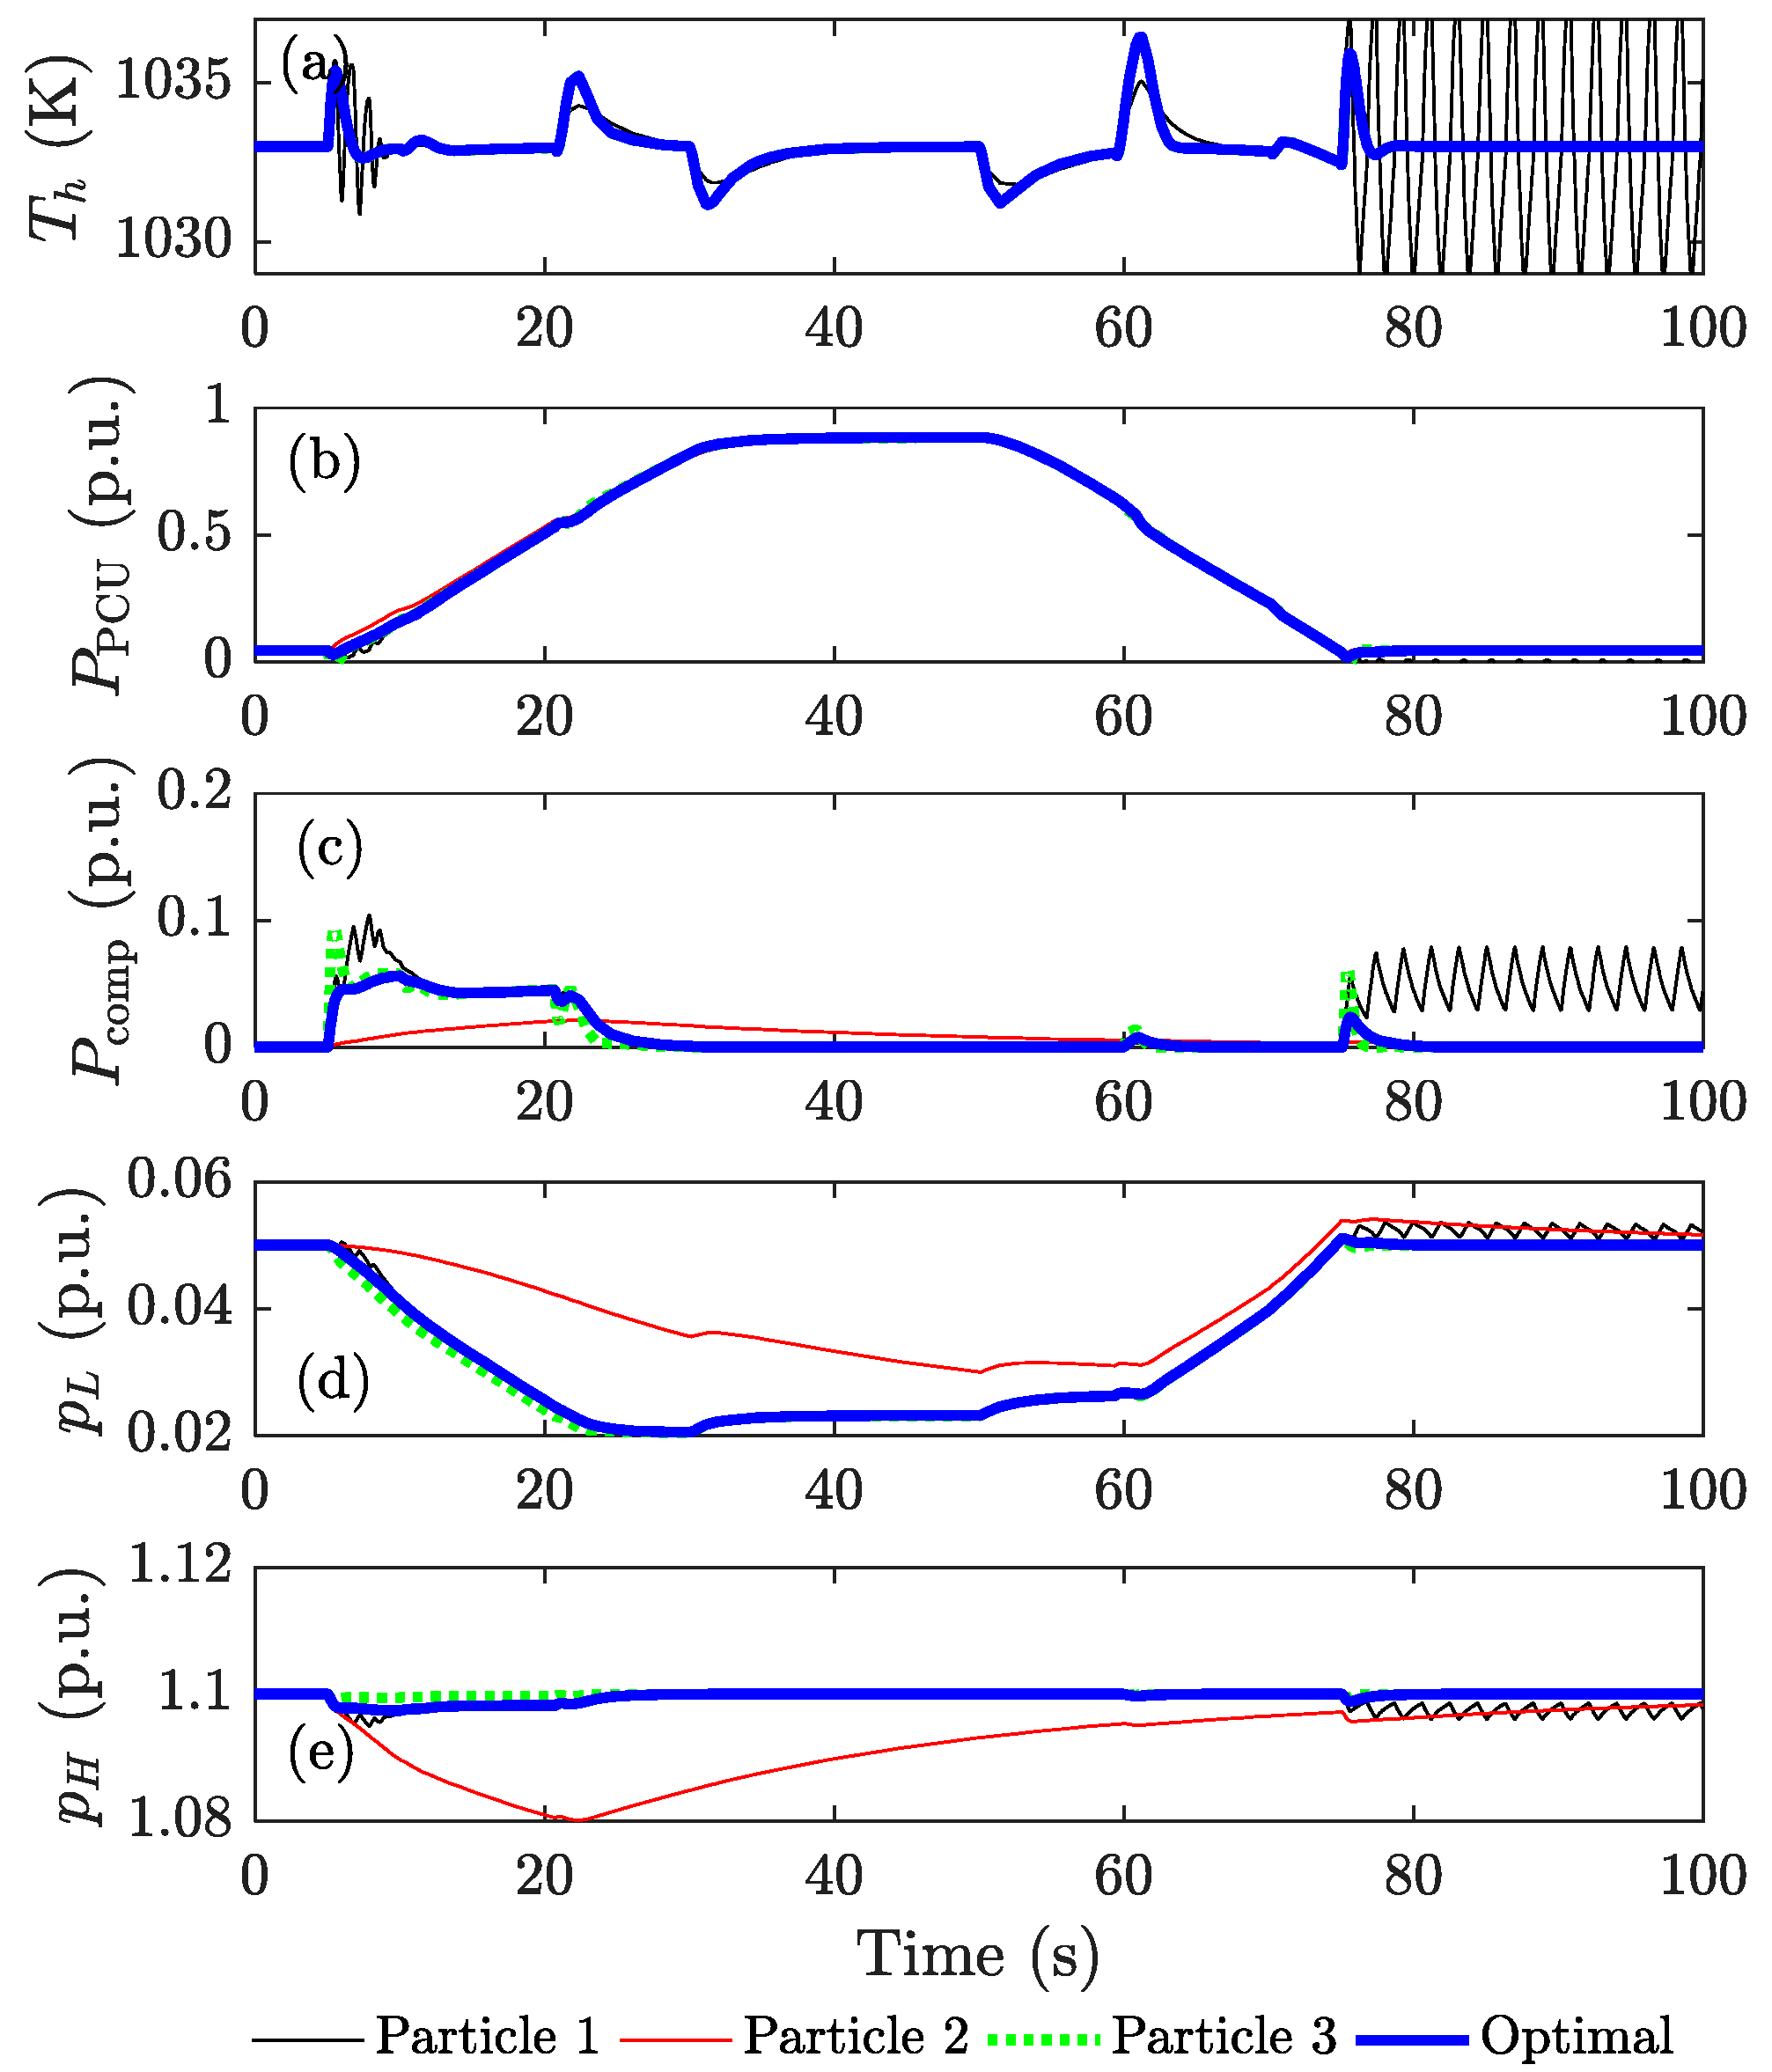
In order to show the efficacy of the obtained optimal control parameters, in Figure 15 we compare the simulation waveforms of the temperature Th, PCU power PPCU, compressor power Pcomp, and the tank pressures pH and pL using four groups of different control parameters, including the optimal one and three other groups of parameters. As each group of the parameters can be considered as a particle in the PSO search space, we denoted the control parameters as Particle 1, Particle 2, and Particle 3, respectively. The parametric values of the three particles were selected to be:
  • Particle 1: K1 = 20, K2 = 11.8, K3 = 0.18, and K4 = 25.5.
  • Particle 2: K1 = 11.1, K2 = 11.8, K3 = 0.18, and K4 = 0.03.
  • Particle 3: K1 = 11.1, K2 = 11.8, K3 = 0.18, and K4 = 100.
From Figure 15a, it can be seen that the temperature profiles from all four selected particles were limited within a narrow band between 1030 K (0.997 p.u) to 1036 K (1.003 p.u.). For the first particle, the system was unstable and the temperature was oscillating after the system reached the steady state after about 77 s. In the steady state, the compressor did not work and no power was be consumed by the compressor. However, it can be seen from Figure 15c that for the first particle, there is a persistent compressor power. The pressure in the high-pressure tank decreased and the pressure in the low-pressure tank increased, which can be observed from Figure 15d,e, respectively. Figure 15c shows the second particle consumed the least amount of compressor power, which helped to increase the total generated power from the PCU. However, from Figure 10e, it can be seen that at 100 s, the gas pressure in the high-pressure tank had not reached the set-point. For the third particle, although it provided a better control on the high pressure tank, it consumed more compressor power during the period of investigation.

6. Conclusions

This paper proposes an optimal control system design approach for a DFIG-based dish-Stirling concentrated solar-thermal generating system, aiming to achieve maximum power point tracking and constant temperature regulation. The overall system model with multi-physics nature has been developed for time-domain simulation studies in a grid-connected condition. The model incorporates an average-valued thermodynamic model of Stirling engine, a heat transfer model of the dish/receiver, and a pneumatic model of the hydrogen supply system. A coordinated torque and mean pressure control scheme were proposed to provide smoothened active power tracking and temperature regulation. This scheme requires tuning for only four control parameters, which is a significant reduction from 20 in the existing literature. The optimal control parameters were determined using the PSO method, and the process of the pre-examination of system stability was incorporated into the algorithm to effectively reduce the search effort. The results from the time-domain simulation were presented to show the efficacy of the proposed scheme in supplying the grid system with improved performance of active power and temperature regulation as solar irradiance varied. It also showed the importance of the detailed modeling of the hydrogen supply system as the parasitic loss due to the gas compressor and the limited tank volume can play negative impact on the energy conversion efficiency, which should be taken into consideration during the design of the DS system.

Author Contributions

Conceptualization, Y.L.; methodology, Y.L. and B.X.; software, Y.L. and Z.L.; validation, Y.L. and Z.L.; investigation, B.X.; writing—original draft preparation, Y.L.; writing—review and editing, Y.S. and J.T.; supervision, Y.L. and Y.S.; project administration, B.X.; funding acquisition, B.X.

Funding

This work was supported by National Natural Science Foundation of China (#61703318), Natural Science Foundation of Hubei Province (#2017CFB130), and Open Fund of State Key Laboratory of Operation and Control of Renewable Energy & Storage Systems (#DGB51201801584).

Conflicts of Interest

The authors declare no conflict of interest.

Nomenclature

D, Hdamping and inertia constants of DS system (p.u. in electrical system)
D′, H′damping and inertia constants of DS system (p.u. in mechanical system)
I(t)solar insolation (p.u.)
K1, K2proportional and integral gains of the temperature controller
K3gain of the speed feedforward controller
K4gain of the hydrogen compressor controller
Kv, Tvgain and time constant of solenoid valve
Kcongain of the concentrator
Krec, Trecgain and time constant of receiver
Kpengine pressure–mass gain
Mtottotal mass in the engine cylinders
Pe(t), Pm(t)electromagnetic power, mechanical power (p.u.)
Pcomp(t)power consumed by the hydrogen compressor (p.u.)
PPCU(t)power generated from PCU (p.u.)
Qh(t)heater and cooler heat transfer rate (p.u.).
Taambient temperature (p.u.)
Te(t), Tm(t)electromagnetic and mechanical torques (p.u. in electrical system)
Th(t)heater/receiver temperature (p.u.)
a00, a01, a10, a11
b00, b01, b10, b11, b02, b12
steady-state efficiency correction coefficients of Stirling engine
c(t)control command of solenoid valve (p.u.)
gAse(t)total mass flow rate from tanks to engine cylinder (p.u.)
mse(t)mass of the hydrogen in the engine cylinder
mH(t), mL(t)masses of the hydrogen in the high- and low-pressure tanks (p.u.)
pmean(t)mean pressure of the working gas in the Stirling engine cylinder (p.u.)
pmax, pminmaximum and minimum pressure in the Stirling engine cylinder (p.u.)
pH(t), pL(t)pressures of the hydrogen in the high- and low-pressure tanks (p.u.)
τe(t), τm(t)electromagnetic and mechanical torques (p.u. in mechanical system)
ωm(t)shaft speed of engine/generator (p.u. in mechanical system)
ωr(t)shaft speed of engine/generator (p.u. in electrical system)

Appendix A

The original Beattie–Bridgeman equation is given in [25] is:
p = n 2 R T V 2 ( 1 c 0 n V T 3 ) [ V n + B 0 ( 1 b 0 n V ) ] A 0 ( 1 a 0 n V ) ( n V ) 2
where n = m/M is the amount of the substance, and m is the mass and M is the molar mass of hydrogen. The units of the states of the equation are: p (atm), n (mol), m (kg), V (L), T (K). By using the base values given in Table 1, Equation (A1) can be normalized to:
p X ( m X ) = R T X ( m X V X ) 2 ( 1 c 0 T X 3 m X V X ) [ V X m X + B 0 ( 1 b 0 m X V X ) ] A 0 ( 1 a 0 m X V X ) ( m X V X ) 2
where the hydrogen constants are:
R = R m N T N p N M V N , A 0 = m N 2 p N M 2 V N 2 A 0 , B 0 = m N M V N B 0 , a 0 = m N M V N a 0 , b 0 = m N M V N b 0 , c 0 = m N M V N T N 3 c 0
Re-arranging Equation (A2) yields Equation (5), where the coefficients βk are:
β 2 = B 0 T X c 0 / T X 2 0 A 0 β 3 = A 0 a 0 b 0 B 0 b 0 T X c 0 B 0 / T X 2 β 4 = c 0 B 0 b 0 / T X 2
The hydrogen constants used in Equation (A1) are: R = 0.08206 atm·L/(mol·K), A0 = 0.1975 atm L2/mol2, B0 = 0.02096 L/mol, a0 = −0.00506 L/mol, b0 = −0.04359 L/mol, c0 = 504 L·K3/mol, and M = 2015.88 kg/mol. The normalized hydrogen constants used in Equation (A2) are: R′ = 1, A0′ = 0.0054, B0′ = 0.0489, a0′ = −0.0118, b0′ = −0.1016, and c0′ ≈ 0.

References

  1. Mancini, T.; Heller, P.; Butler, B.; Osborn, B.; Schiel, W.; Goldberg, V.; Buck, R.; Diver, R.; Andraka, C.; Moreno, J. Dish-Stirling systems: An overview of development and status. ASME J. Sol. Energy Eng. 2003, 125, 135–151. [Google Scholar] [CrossRef]
  2. Thombare, D.G.; Verma, S.K. Technological development in the Stirling cycle engines. Renew. Sustain. Energy Rev. 2008, 12, 1–38. [Google Scholar] [CrossRef]
  3. Mendoza Castellanos, L.S.; Carrillo Caballero, G.E.; Melian Cobas, V.R.; Silva Lora, E.E.; Martinez Reyes, A.M. Mathematical modeling of the geometrical sizing and thermal performance of a Dish/Stirling system for power generation. Renew. Energy 2017, 107, 23–35. [Google Scholar] [CrossRef]
  4. Mendoza Castellanos, L.S.; Galindo Noguera, A.L.; Carrillo Caballero, G.E.; De Souza, A.L.; Melian Cobas, V.R.; Silva Lora, E.E.; Venturini, O.J. Experimental analysis and numerical validation of the solar Dish/Stirling system connected to the electric grid. Renew. Energy 2019, 135, 259–265. [Google Scholar] [CrossRef]
  5. Gholamalizadeh, E.; Chung, J.D. Thermal Analysis of the Receiver of a Standalone Pilot Solar Dish–Stirling System. Entropy 2018, 20, 429. [Google Scholar] [CrossRef]
  6. Gil, R.; Monné, C.; Bernal, N.; Muñoz, M.; Moreno, F. Thermal Model of a Dish Stirling Cavity-Receiver. Energies 2015, 8, 1042–1057. [Google Scholar] [CrossRef] [Green Version]
  7. Sandoval, O.R.; Caetano, B.C.; Borges, M.U.; García, J.J.; Valle, R.M. Modelling, simulation and thermal analysis of a solar dish/Stirling system: A case study in Natal, Brazil. Energy Convers. Manag. 2019, 181, 189–201. [Google Scholar] [CrossRef]
  8. Zhu, S.; Yu, G.; Jongmin, O.; Xu, T.; Wu, Z.; Dai, W.; Luo, E. Modeling and experimental investigation of a free-piston Stirling engine-based micro-combined heat and power system. Appl. Energy 2018, 226, 522–533. [Google Scholar] [CrossRef]
  9. Wu, Z.; Jin, J.X. Novel concept of dish Stirling solar power generation designed with a HTS linear generator. IEEE Trans. Appl. Supercond. 2014, 24, 5203005. [Google Scholar] [CrossRef]
  10. Qiu, S.; Solomon, L.; Rinker, G. Development of an Integrated Thermal Energy Storage and Free-Piston Stirling Generator for a Concentrating Solar Power System. Energies 2017, 10, 1361. [Google Scholar] [CrossRef]
  11. Howard, D.F.; Liang, J.; Harley, R.G. Control of receiver temperature and shaft speed in dish-Stirling solar power plants to meet grid integration requirements. In Proceedings of the IEEE Energy Conversion Congress and Exposition, Atlanta, GA, USA, 12–16 September 2010; pp. 398–405. [Google Scholar]
  12. Howard, D.; Harley, R.G. Modeling of dish-Stirling solar thermal power generation. In Proceedings of the IEEE PES General Meeting, Providence, RI, USA, 25–29 July 2010. [Google Scholar]
  13. Urieli, I.; Berchowitz, D.M. Stirling Cycle Engine Analysis; A. Hilger: Bristol, UK, 1984. [Google Scholar]
  14. Li, Y.; Choi, S.S.; Yang, C. Dish-Stirling solar power plants: Modeling, analysis and control of receiver temperature. IEEE Trans. Sustain. Energy 2014, 5, 398–407. [Google Scholar] [CrossRef]
  15. Li, Y.; Choi, S.S.; Vilathgamuwa, D.M. Primary frequency control scheme for a fixed-speed dish-stirling solar-thermal power plant. IEEE Trans. Power Syst. 2018, 33, 2184–2194. [Google Scholar] [CrossRef]
  16. Hussain, I.; Das, D.C.; Sinha, N. Reactive power performance analysis of dish-Stirling solar thermal-diesel hybrid energy system. IET Renew. Power Gen. 2017, 11, 750–762. [Google Scholar] [CrossRef]
  17. Howard, D.F.; Harley, R.G.; Jiaqi, L.; Venayagamoorthy, G.K. Effects of variable solar irradiance on the reactive power compensation for large solar farm. In Proceedings of the IREP Symposium—Bulk Power System Dynamics and Control, Rio de Janeiro, Brazil, 1–6 August 2010; pp. 1–8. [Google Scholar]
  18. Santos-Martin, D.; Alonso-Martinez, J.; Eloy-Garcia, J.; Arnalte, S. Solar dish-Stirling system optimisation with a doubly fed induction generator. IET Renew. Power Gen. 2012, 6, 276–288. [Google Scholar] [CrossRef]
  19. Li, Y.; Choi, S.S.; Yang, C.; Wei, F. Design of variable-speed dish-Stirling solar-thermal power plant for maximum energy harness. IEEE Trans. Energy Convers. 2015, 30, 394–403. [Google Scholar] [CrossRef]
  20. Barreto, G.; Canhoto, P. Modelling of a Stirling engine with parabolic dish for thermal to electric conversion of solar energy. Energy Convers. Manag. 2017, 132, 119–135. [Google Scholar] [CrossRef]
  21. Kadri, Y.; Hadj Abdallah, H. Performance evaluation of a stand-alone solar dish Stirling system for power generation suitable for off-grid rural electrification. Energy Convers. Manag. 2016, 129, 140–156. [Google Scholar] [CrossRef]
  22. Meinhardt, M.; Cramer, G.; Burger, B.; Zacharias, P. Multi-string-converter with reduced specific costs and enhanced functionality. Sol. Energy 2001, 69, 217–227. [Google Scholar] [CrossRef] [Green Version]
  23. Wu, B.; Lang, Y.; Zargari, N.; Kouro, S. Power Conversion and Control of Wind Energy Systems; Wiley: Hoboken, NJ, USA, 2011. [Google Scholar]
  24. Li, Y.; Choi, S.S.; Yang, C. An average-value model of kinematic Stirling engine for the study of variable-speed operations of dish-stirling solar-thermal generating system. In Proceedings of the 11th IEEE International Conference on Control and Automation (ICCA), Taichung, Taiwan, 18–20 June 2014; pp. 1310–1315. [Google Scholar]
  25. Trifkovic, M.; Sheikhzadeh, M.; Nigim, K.; Daoutidis, P. Modeling and Control of a Renewable Hybrid Energy System With Hydrogen Storage. IEEE Trans. Control Syst. Technol. 2014, 22, 169–179. [Google Scholar] [CrossRef]
  26. Kundur, P.; Balu, N.J.; Lauby, M.G. Power System Stability and Control; McGraw-Hill: New York, NY, USA, 1994. [Google Scholar]
  27. Arnalte, S.; Burgos, J.C.; Rodríguez-Amenedo, J.L. Direct Torque Control of a Doubly-Fed Induction Generator for Variable Speed Wind Turbines. Electr. Power Compon. Syst. 2002, 30, 199–216. [Google Scholar] [CrossRef]
  28. Poli, R.; Kennedy, J.; Blackwell, T. Particle swarm optimization. Swarm Intell. 2007, 1, 33–57. [Google Scholar] [CrossRef]
  29. Venter, G.; Sobieszczanski-Sobieski, J. Particle Swarm Optimization. AIAA J. 2003, 41, 1583–1589. [Google Scholar] [CrossRef] [Green Version]
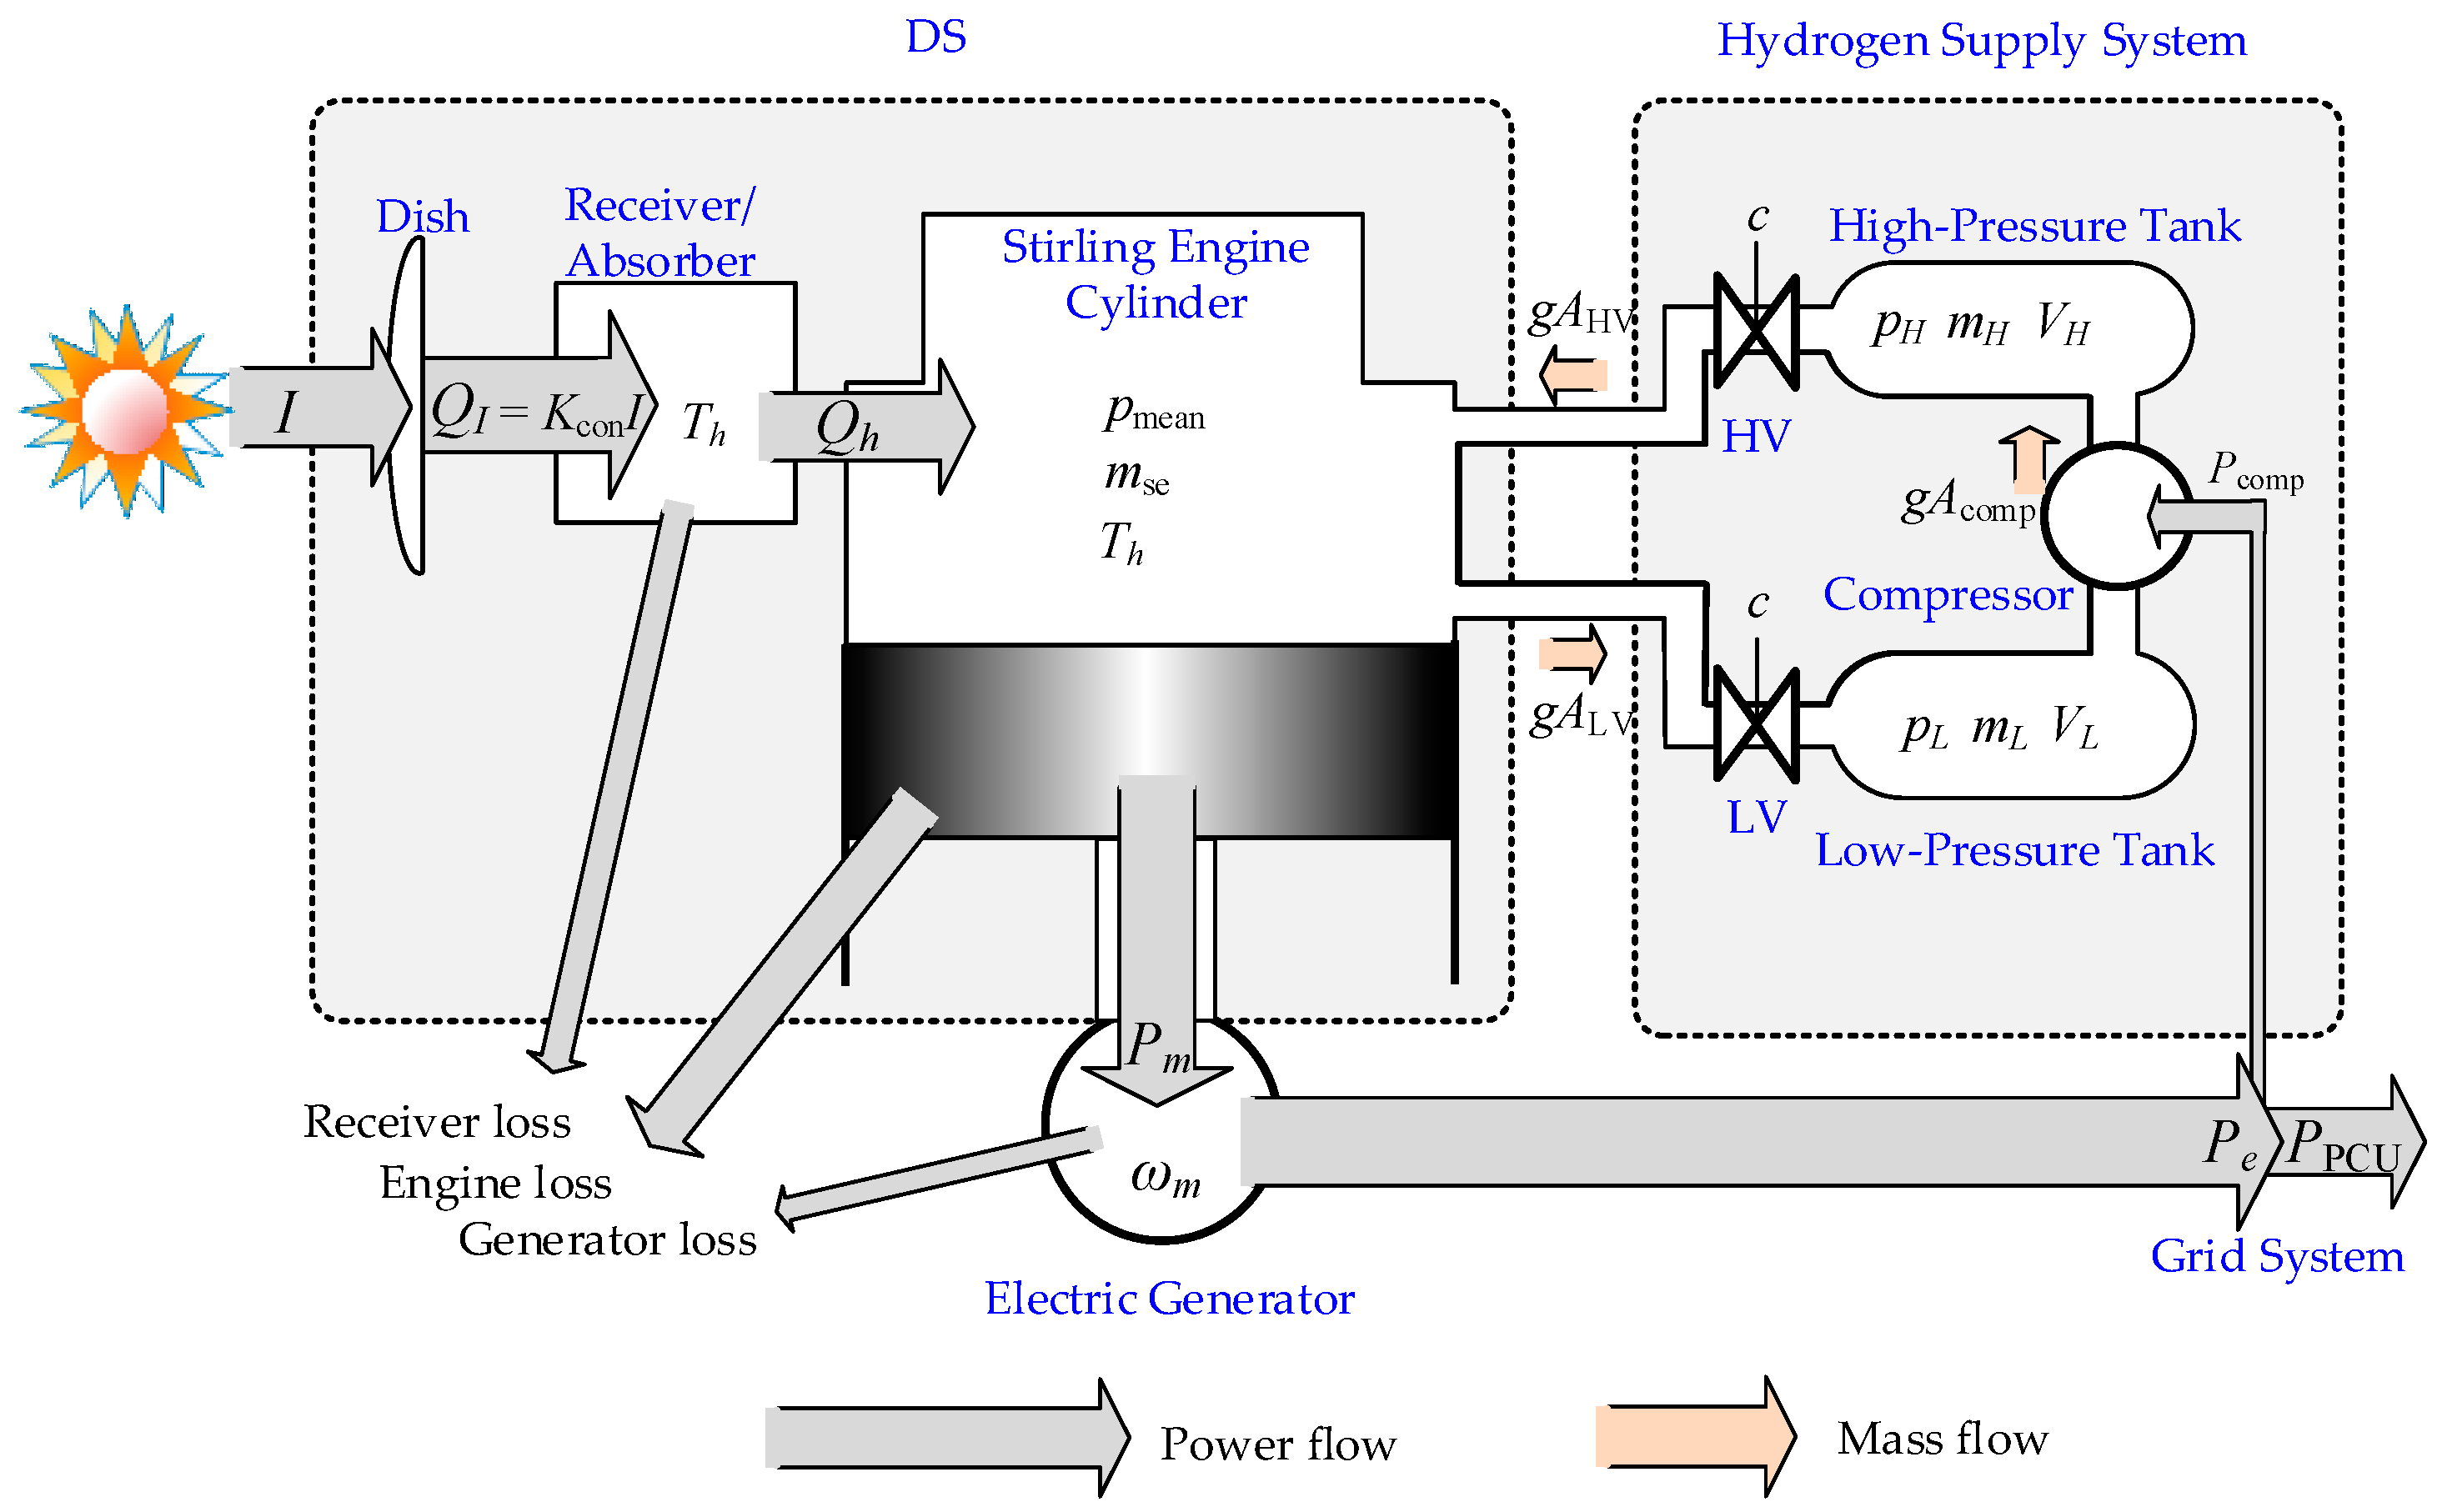
Figure 1. Schematic of dish/receiver-absorber, average-value single-cylinder equivalence to a double-acting kinematic Stirling engine, electric generator, and hydrogen supply system.
Energies 12 01300 g001
Figure 2. Proposed configuration of a DFIG-based DS solar-thermal power plant using a common dc bus and a common GSC unit.
Energies 12 01300 g002
Figure 3. Block diagrams of the hydrogen supply system model including solenoid values, pressure tanks, and gas compressor.
Energies 12 01300 g003
Figure 4. Schematic of the DFIG control.
Energies 12 01300 g004
Figure 5. Optimal torque vs engine speed relationship.
Energies 12 01300 g005
Figure 6. Schematic of the proposed prime mover control.
Energies 12 01300 g006
Figure 7. Steady-state pmean vs. I and ωm vs. I relationships.
Energies 12 01300 g007
Figure 8. Block diagram of linearized TC-ROM for temperature controller design.
Energies 12 01300 g008
Figure 9. Feasible search subspace for PSO to determine K1 and K2 for K3 = 0.
Energies 12 01300 g009
Figure 10. Comparison of simulation results with different Stirling engine model in response to a step change of insolation: (a) receiver temperature, (b) mechanical torque of the Stirling engine, (c) absorbed heat transfer rate of the Stirling engine, and (d) rotational speed of the DFIG.
Energies 12 01300 g010
Figure 11. Comparison of simulation results using a different hydrogen supply system model with different tank volumes: (a) power generated by the PCU, (b) power consumed by the gas compressor, (c) gas pressure in the high pressure tank, and (d) gas pressure in the low pressure tank.
Energies 12 01300 g011
Figure 12. Comparison of different control schemes under a ramped increase of insolation: (a) power generated from PCU, (b) receiver temperature, (c) rotational speed of the DFIG, and (d) electromagnetic torque of the DFIG.
Energies 12 01300 g012
Figure 13. The global optimal solution and cost for each iteration. (a) K1 vs. iteration number, (b) K2 vs. iteration number, (c) K3 vs. iteration number, (d) K4 vs. iteration number, and (e) Cost function J vs. iteration number.
Energies 12 01300 g013
Figure 14. Positions of the particles at different iteration steps. Only two dimensions (K1, K2) are shown.
Energies 12 01300 g014
Figure 15. Simulation results with different particles (control parameters): (a) receiver temperature, (b) power generated from the PCU, (c) power consumed by the compressor, (d) gas pressure in the high pressure tank, and (e) gas pressure in the low pressure tank.
Energies 12 01300 g015
Table 1. Per unit system for the prime mover and hydrogen supply system quantities.
QuantityDescriptionSymbolBase Value
InsolationMaximum insolationIN1000 W/m2
PowerNominal engine powerPm,N27 kW
Pressure Max. mean pressure in the cylinderpN20 MPa
TemperatureMax. heater/receiver temperatureTN1033 K
SpeedNominal engine speedωm,N190.63 rad/s
MassMax. hydrogen mass in the cylindermN0.0036 kg
Volume ( m N / M ) R T N / p N VN7.667 × 10−4 m3
TorquePm,N/ωm,NτN141.63 N
Table 2. Prime mover model and hydrogen supply system model parameters.
Param.ValueParam.ValueParam.Value
Kcon2.865 b010.055nc1.027
Krec1.756b111.21ηcomp0.7
Trec13.436 sb02−0.026Tk, Tcomp0.313
Ta0.288b12−0.13Th,max1
a000.045A−0.2735Mtot36.88
a100.068C0.8752VX10
a010.20Kp1β20.0098
a112.14Kv1β30.0016
b00−0.038Tv0.02 sβ40
b10−0.072----
Table 3. DFIG model parameters.
Param.ValueParam.Value
SN30 kVALm2.9
fN60 HzH0.685 s
Rs0.0046D0.01
Rr0.0032pn2
Ls3.08rω0.7614
Lr3.06--