1. Introduction
The availability of renewable energy in the oceans [
1] has long inspired many inventors of wave energy converters. In Europe, since the 1990s, several devices were developed by north-west European companies [
2]. Conversely, due to scarce wave energy resources in the Italian seas [
3,
4], for many years the Italian contribution to the development of wave energy converters has been limited to the pioneering work of Boccotti, through the REWEC 3 J-type WEC, patented in 1998 [
5].
The first WECs developed in the North European Countries reached a rather high technological readiness level [
6,
7] but suffered from the harsh oceanic environment at demonstration phase. Many developers eventually closed their companies or suspended their activities, losing part of their competitive advantage in favor of more recent concepts, so that now it is not too late to start with new patents.
In view of such problematic R&D processes of WECs, some authors even suggested that a mild wave climate, like the Mediterranean one [
8,
9], is suited to the development and, for some cleverly conceived concepts, to the commercial phase. In recent years, ENEA (the Italian National Agency for New Technologies, Energy and Sustainable Economic Development) started to gain interest in the marine energy sector, fostering new initiatives.
As a result, Italian inventors started proposing many new concepts. In the scientific literature we can find, beside the REWEC 3, the ISWEC [
10], OBREC [
11], SeaBreath [
4], ShoWED [
12], and DEIM [
13], Tecnomac (EDS, [
14]). Other devices have not published the tests in the scientific literature, but were presented to business events, e.g., 40South Energy (through several devices, the most recent being the interesting H24 module,
http://www.40southenergy.com/2018/09/2294/), Swaths, Generma, Onda, WaveAbsorber, WEM/WOM, EP4.
The last of these devices is the one studied in this paper. The full name is Energy and Protection, 4th generation (EP4), patented by Dario Bernardi. In order to overcome the disadvantages of the low energetic content of the Italian sea, the EP4 is designed to achieve a secondary objective, i.e., the protection of the coast from the wave action, thus providing a defense against erosion (similarly to other concepts, see [
15]).
Following a well-established R&D roadmap (see e.g., [
16]), the device was tested in a physical model hydraulic laboratory under regular waves, on a small scale. The inventor built a 1:10 model, with no generator, and tested it briefly at sea, to achieve a proof of concept, i.e., the ability to rotate a shaft. The same model (integrated to fit the flume frames) has been tested in the wave flume of Padova University.
The aim of the paper is to assess the device effectiveness in terms of power production and ability to protect the rear beach.
For a real WEC, the hydraulic, electrical or mechanical Power Take Off (PTO) is the system that allows the generation of electricity. On a small scale model, the real physical PTO cannot be modeled in detail, and no electricity is produced. To maintain the same overall dynamic behavior, a system is used that just mimics the damping and resistance effects, restraining the WEC movements in similitude to the physical PTO. Such system is termed dummy PTO.
It is well known [
17,
18] that an appropriate control technology has the capability to significantly affect the amount of energy taken from WECs, and the choice of the PTO significantly affects the final result. Therefore, the dummy PTO was built in agreement with the inventor’s requirements.
Finally, the restraining force and movements were measured, in order to obtain the amount of energy dissipated by the system, to be interpreted as the “converted energy”.
The paper layout is as follows. After this introduction, a classification of the different types of dummy PTOs used in the hydraulic tests is presented. Then, the experiments are described, including the facility, the scale model of the EP4, the selected dummy PTO, the test programme, the instrumentation and the analysis methods. Results are then described in terms of free oscillations, energy harvesting capacity and wave attenuation. Finally, the conclusions are drawn, with some comments on future developments.
2. Classification of Dummy PTOs
All WEC devices, under the wave action, are able to produce some movements or to spin a wheel. The ability to produce a movement (or rotation, e.g., of a turbine wheel) is considered a “proof of concept”, i.e., a proof that wave energy has been converted into kinetic energy in some instant.
In order to evaluate the amount of harvested energy it is possible to restrain the movement with a force (or torque, in case of a turbine), that mimics the effect of a real PTO. Such restraining force (torque) R is sometimes called the PTO “load”. The device that allows to apply such load is sometimes called “dummy” PTO.
The product of
R by the velocity (or angular velocity)
v is the power dissipated by the dummy PTO. The average of the dissipated power is assumed to be the “converted energy”
Ec:
Obviously, the velocity v is directly affected by the load. If the load is too large the device is totally restrained, with v = 0, and from Equation 1 we see that Ec = 0. If R = 0, v achieves the maximum value but, again, Ec = 0. The optimal value of the load is the one that gives the largest value of Ec.
It should be pointed out that the optimal R(t) is not constant, and may depend on the present and future state (position and velocity) of the WEC.
At prototype scale, the load is likely to be controlled (through the inverter) in real time, with substantial advantages in the achieved efficiency. During physical model tests, a similar system can be achieved with motor controlled by a PLC (available at the University of Padova) enabling the “active” PTO to exert any reaction force, based on the measured information of the system state (see e.g., by [
19]). This investigation, however, increases significantly the costs of the experiments.
This level of accuracy is not suited for devices at an initial stage of development, such as the case of the EP4. More frequently, passive PTOs are designed. On the one hand, the type of PTO significantly changes the overall performance at the lab scale and it must be selected with care. On the other hand, the inventor is usually not financially supported and the cost of the experiment must be kept extremely low.
A simple classification of the existing passive PTOs is given below, and it is based on the achieved value of R:
- (1)
R is constant. It is achieved by applying a friction force [
16]. As a mere example, we may imagine that the floating WEC induces the vertical movement of a bar. Then, the bar is forced to slither between jaws. The jaws apply a different friction force, based on the setting.
- (2)
R(
t) is proportional to the velocity
v(
t). It is achieved by oil filled dashpots or pneumatic dampers [
20]. In the example above, the bar may be attached to a recycled pneumatic cylinder. By varying the hole in the air cylinder, the piston proportionality constant is modified.
- (3)
R is affected by the position. This is the case selected for the experiments, as described in Sub-
Section 3.2. Another example is the pre-stressed piston applied to the Weptos in [
21], who described the possible benefits of a negative stiffness mechanism in terms of combined wave–PTO interaction (later confirmed by [
22]).
The passive PTO is usually realized with adjustable (and repeatable) “settings”. The optimal load is found by selecting the “setting” that gives the larger value of Ec, usually under regular waves.
The settings are assumed to depend on the wave period but not on wave height. There is no proof that the ideal load found under regular wave conditions (of given period) is optimal also under irregular waves (of same peak period), although this has been verified for some experiments (e.g., [
23]).
A final remark should address the PTO design load. The cost of the real PTO depends on the maximum value of power that may be converted. When the input power exceeds a threshold, the device may be either limited or disconnected, entering a “safe” mode. In [
24], a quick way to select the design value on the basis of the hydraulic model tests is suggested. Whenever the power exceeds the design value, and this is a frequent case for irregular extreme waves, it is not realistic to assume that energy is harvested. Therefore Equation 1 should be modified on the basis of the PTO expected behavior.
3. Experimental Investigation on the WEC
3.1. The Facility
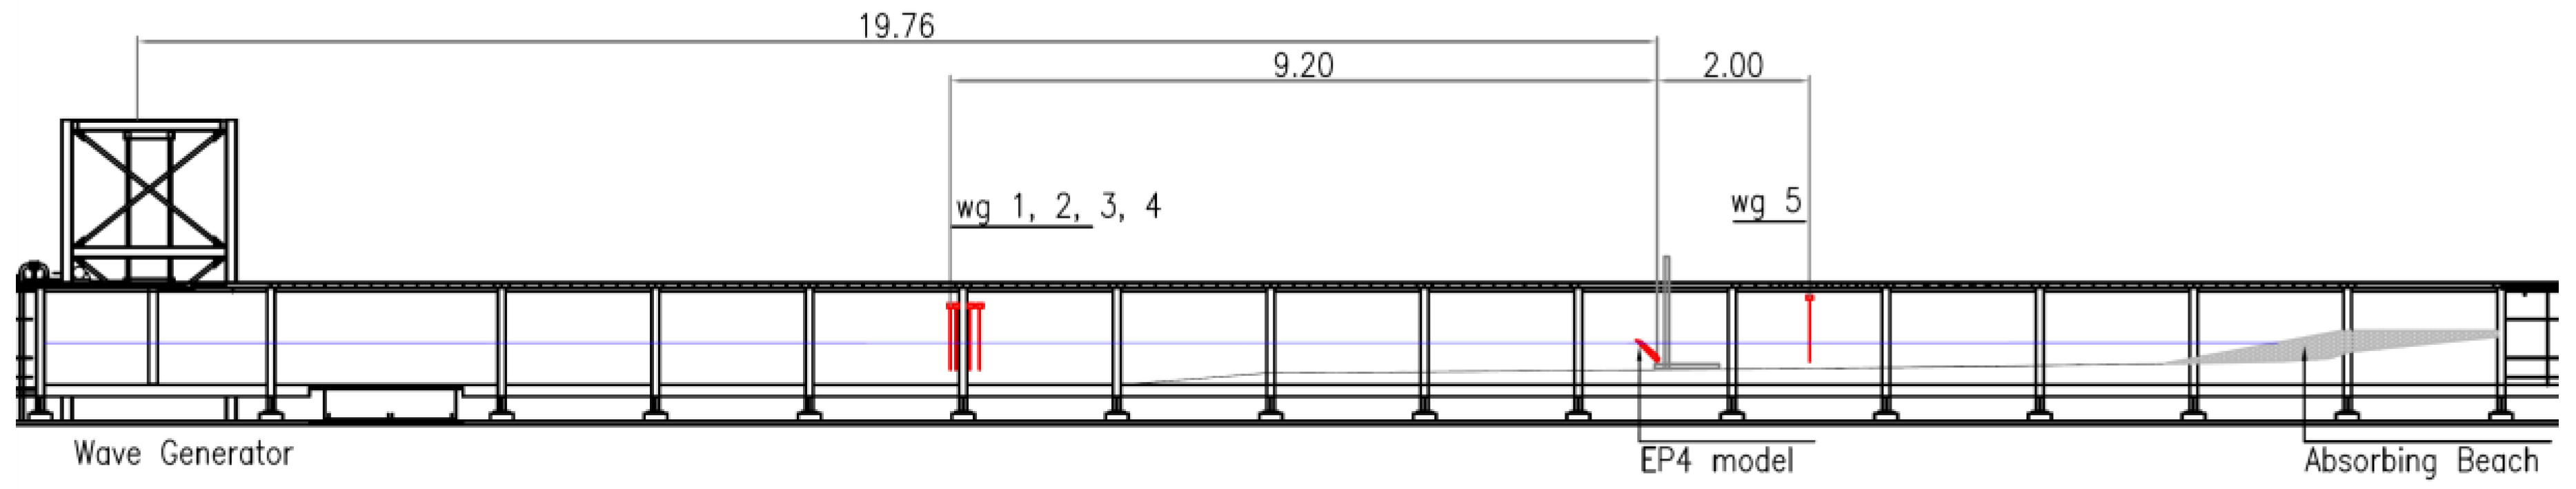
Physical model tests on the EP4 were carried out in the 36 m × 1.0 m × 1.4 m wave flume of Padova University (
Figure 1). The wavemaker is an oleodynamic roto-translational paddle equipped with a hardware wave absorption system. To perform the tests, a fixed bottom was used. For average tide conditions, water depth was 0.5 m at the paddle, and 0.4 m at the structure. An array composed of four wave gauges (WG) was located 9.2 m in front of the model to measure the incident and reflected waves. Another gauge was placed 2.0 m behind the device. The instrumentation used in the tests also comprised of a load cell and a video-camera used to monitor the displacements. A MATLAB-based code extracts the flap rotation in time
θ(
t). After a lowpass filter, the signal is derived in time to obtain the rotational velocity
v(
t).
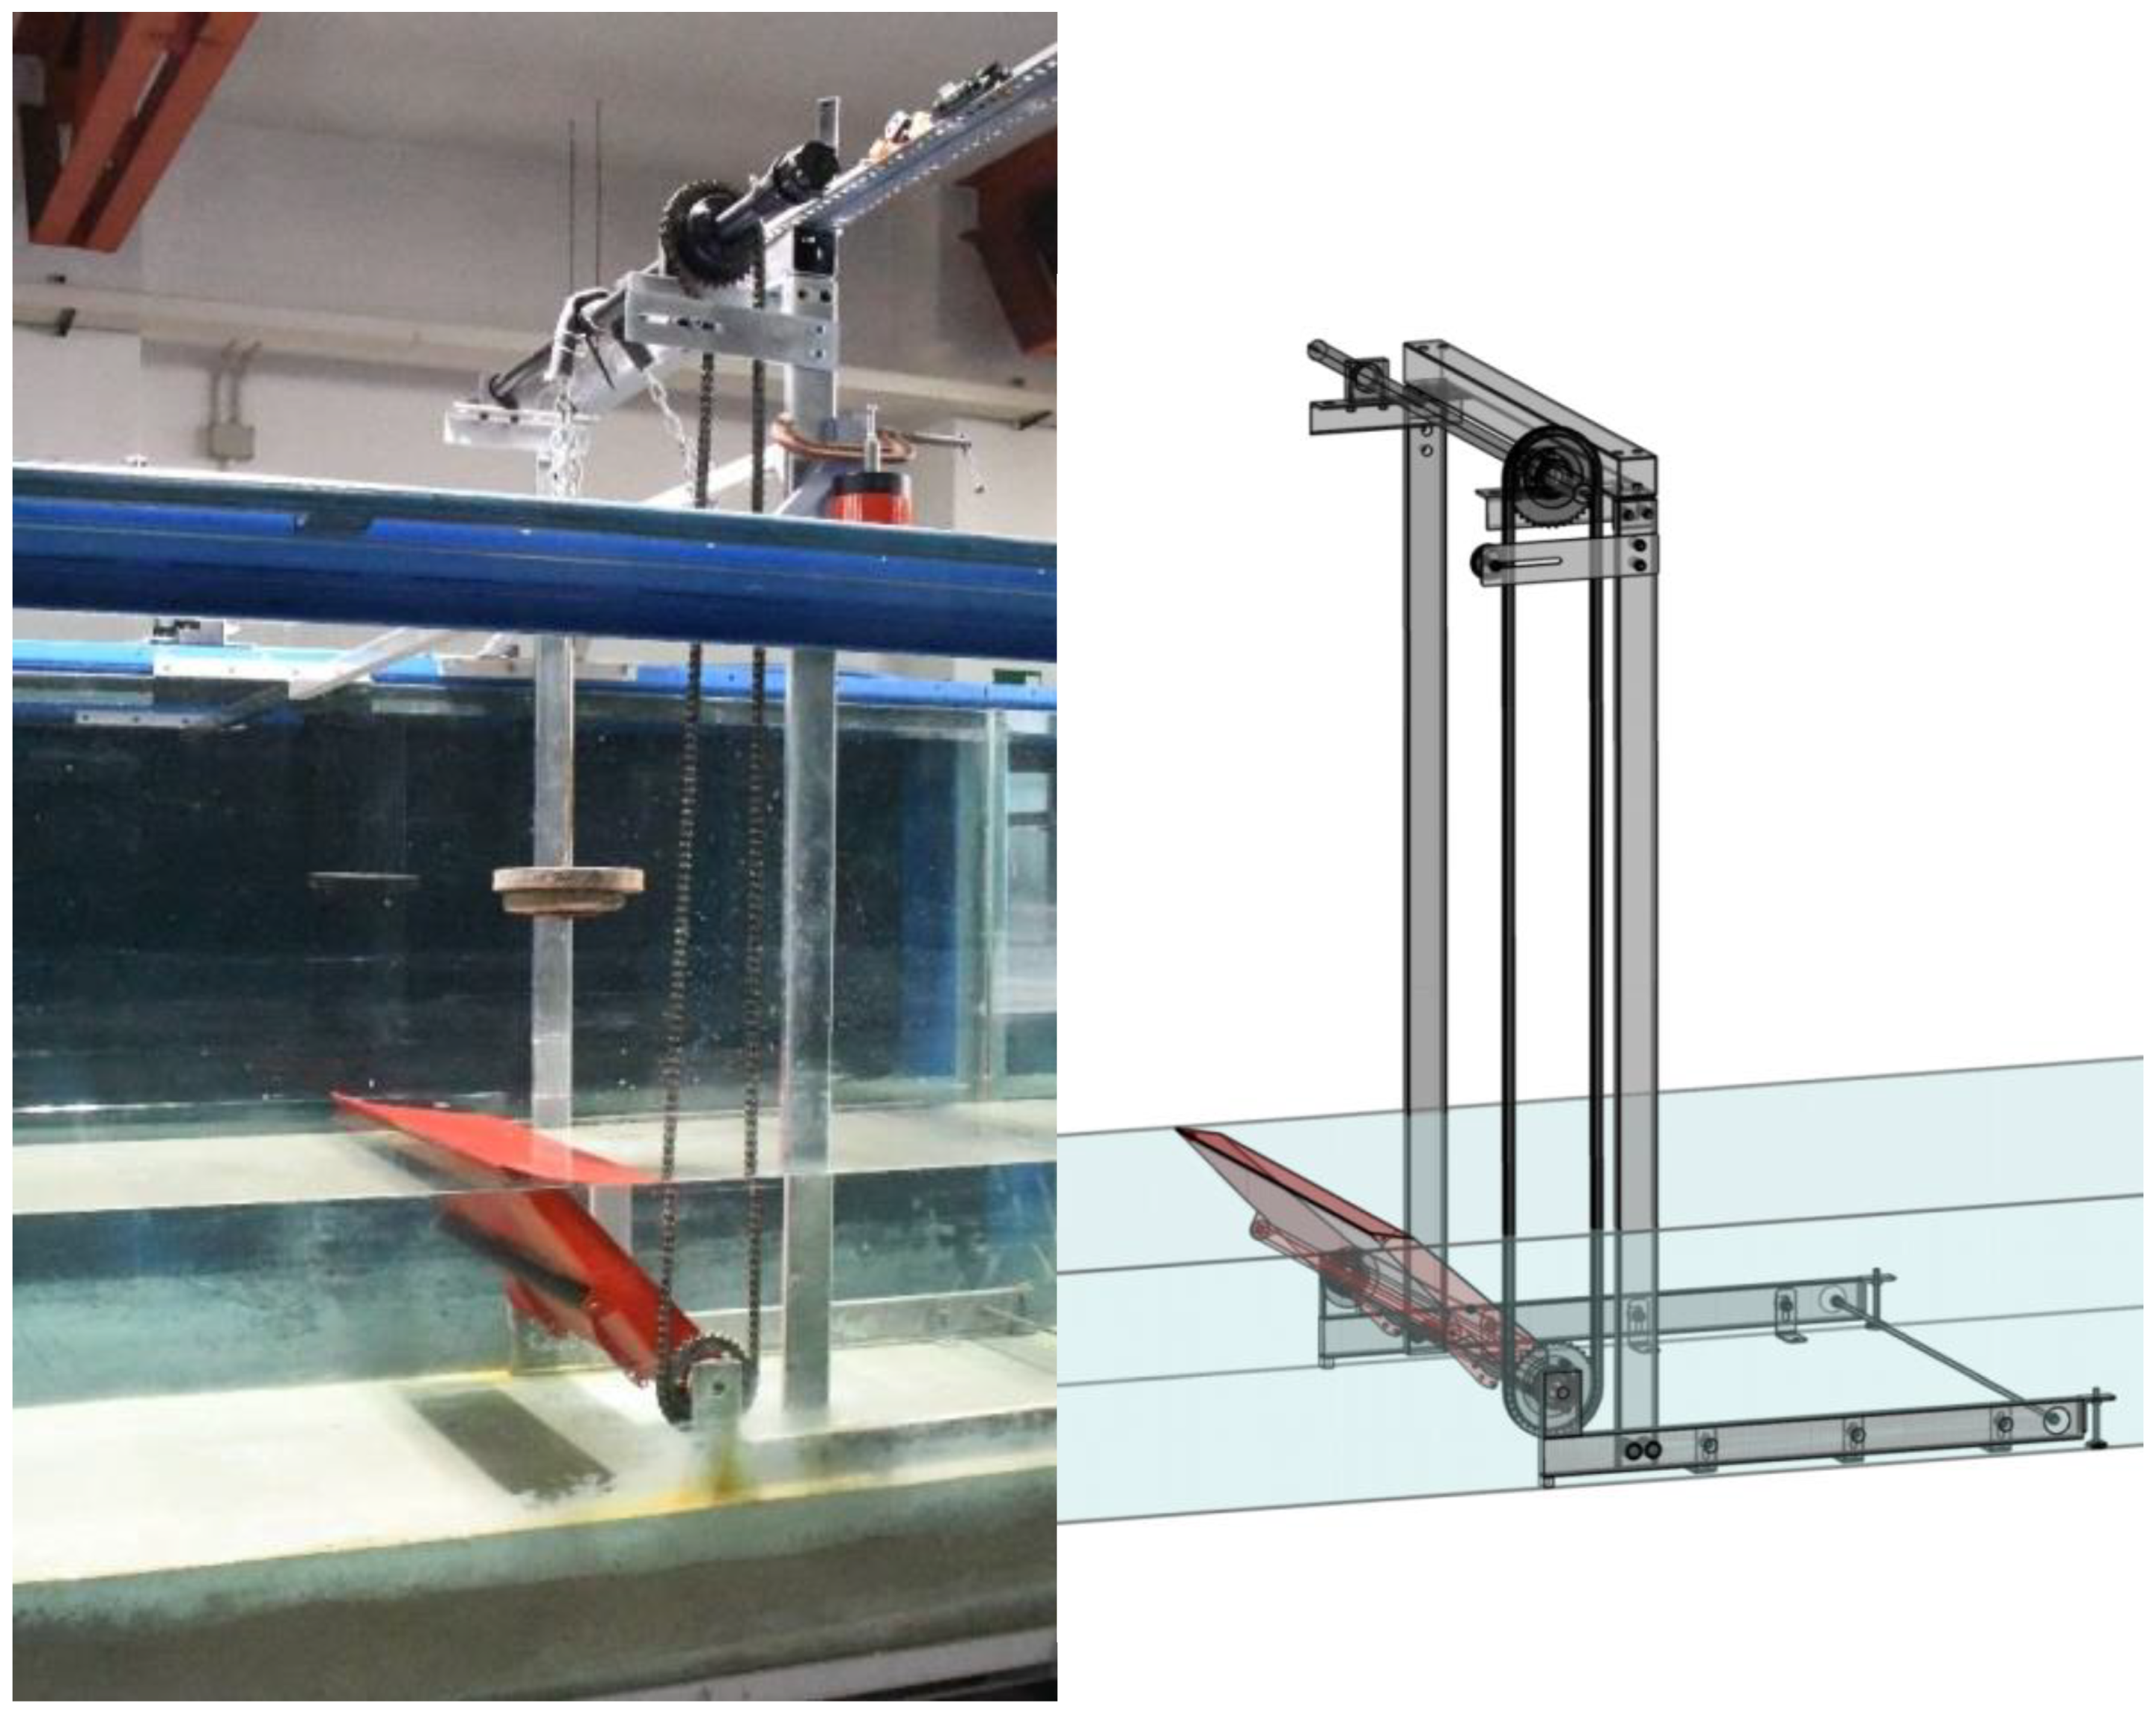
The EP4 is a floater hinged at the base, free to oscillate, and connected by a chain to an upper shaft (
Figure 2). The floater is 84 cm long, 37 cm wide, with total volume 0.013 m
3. In the initial position it bent toward the incident waves (the wave generator is at the left, in the figure). A stabilizing bar (black in the figure), placed at the side of the center of floatation, assures that only one position is stable (unless the water level was extremely low, in which case there are two stable positions). The model was built in scale 1:10.
The chain in
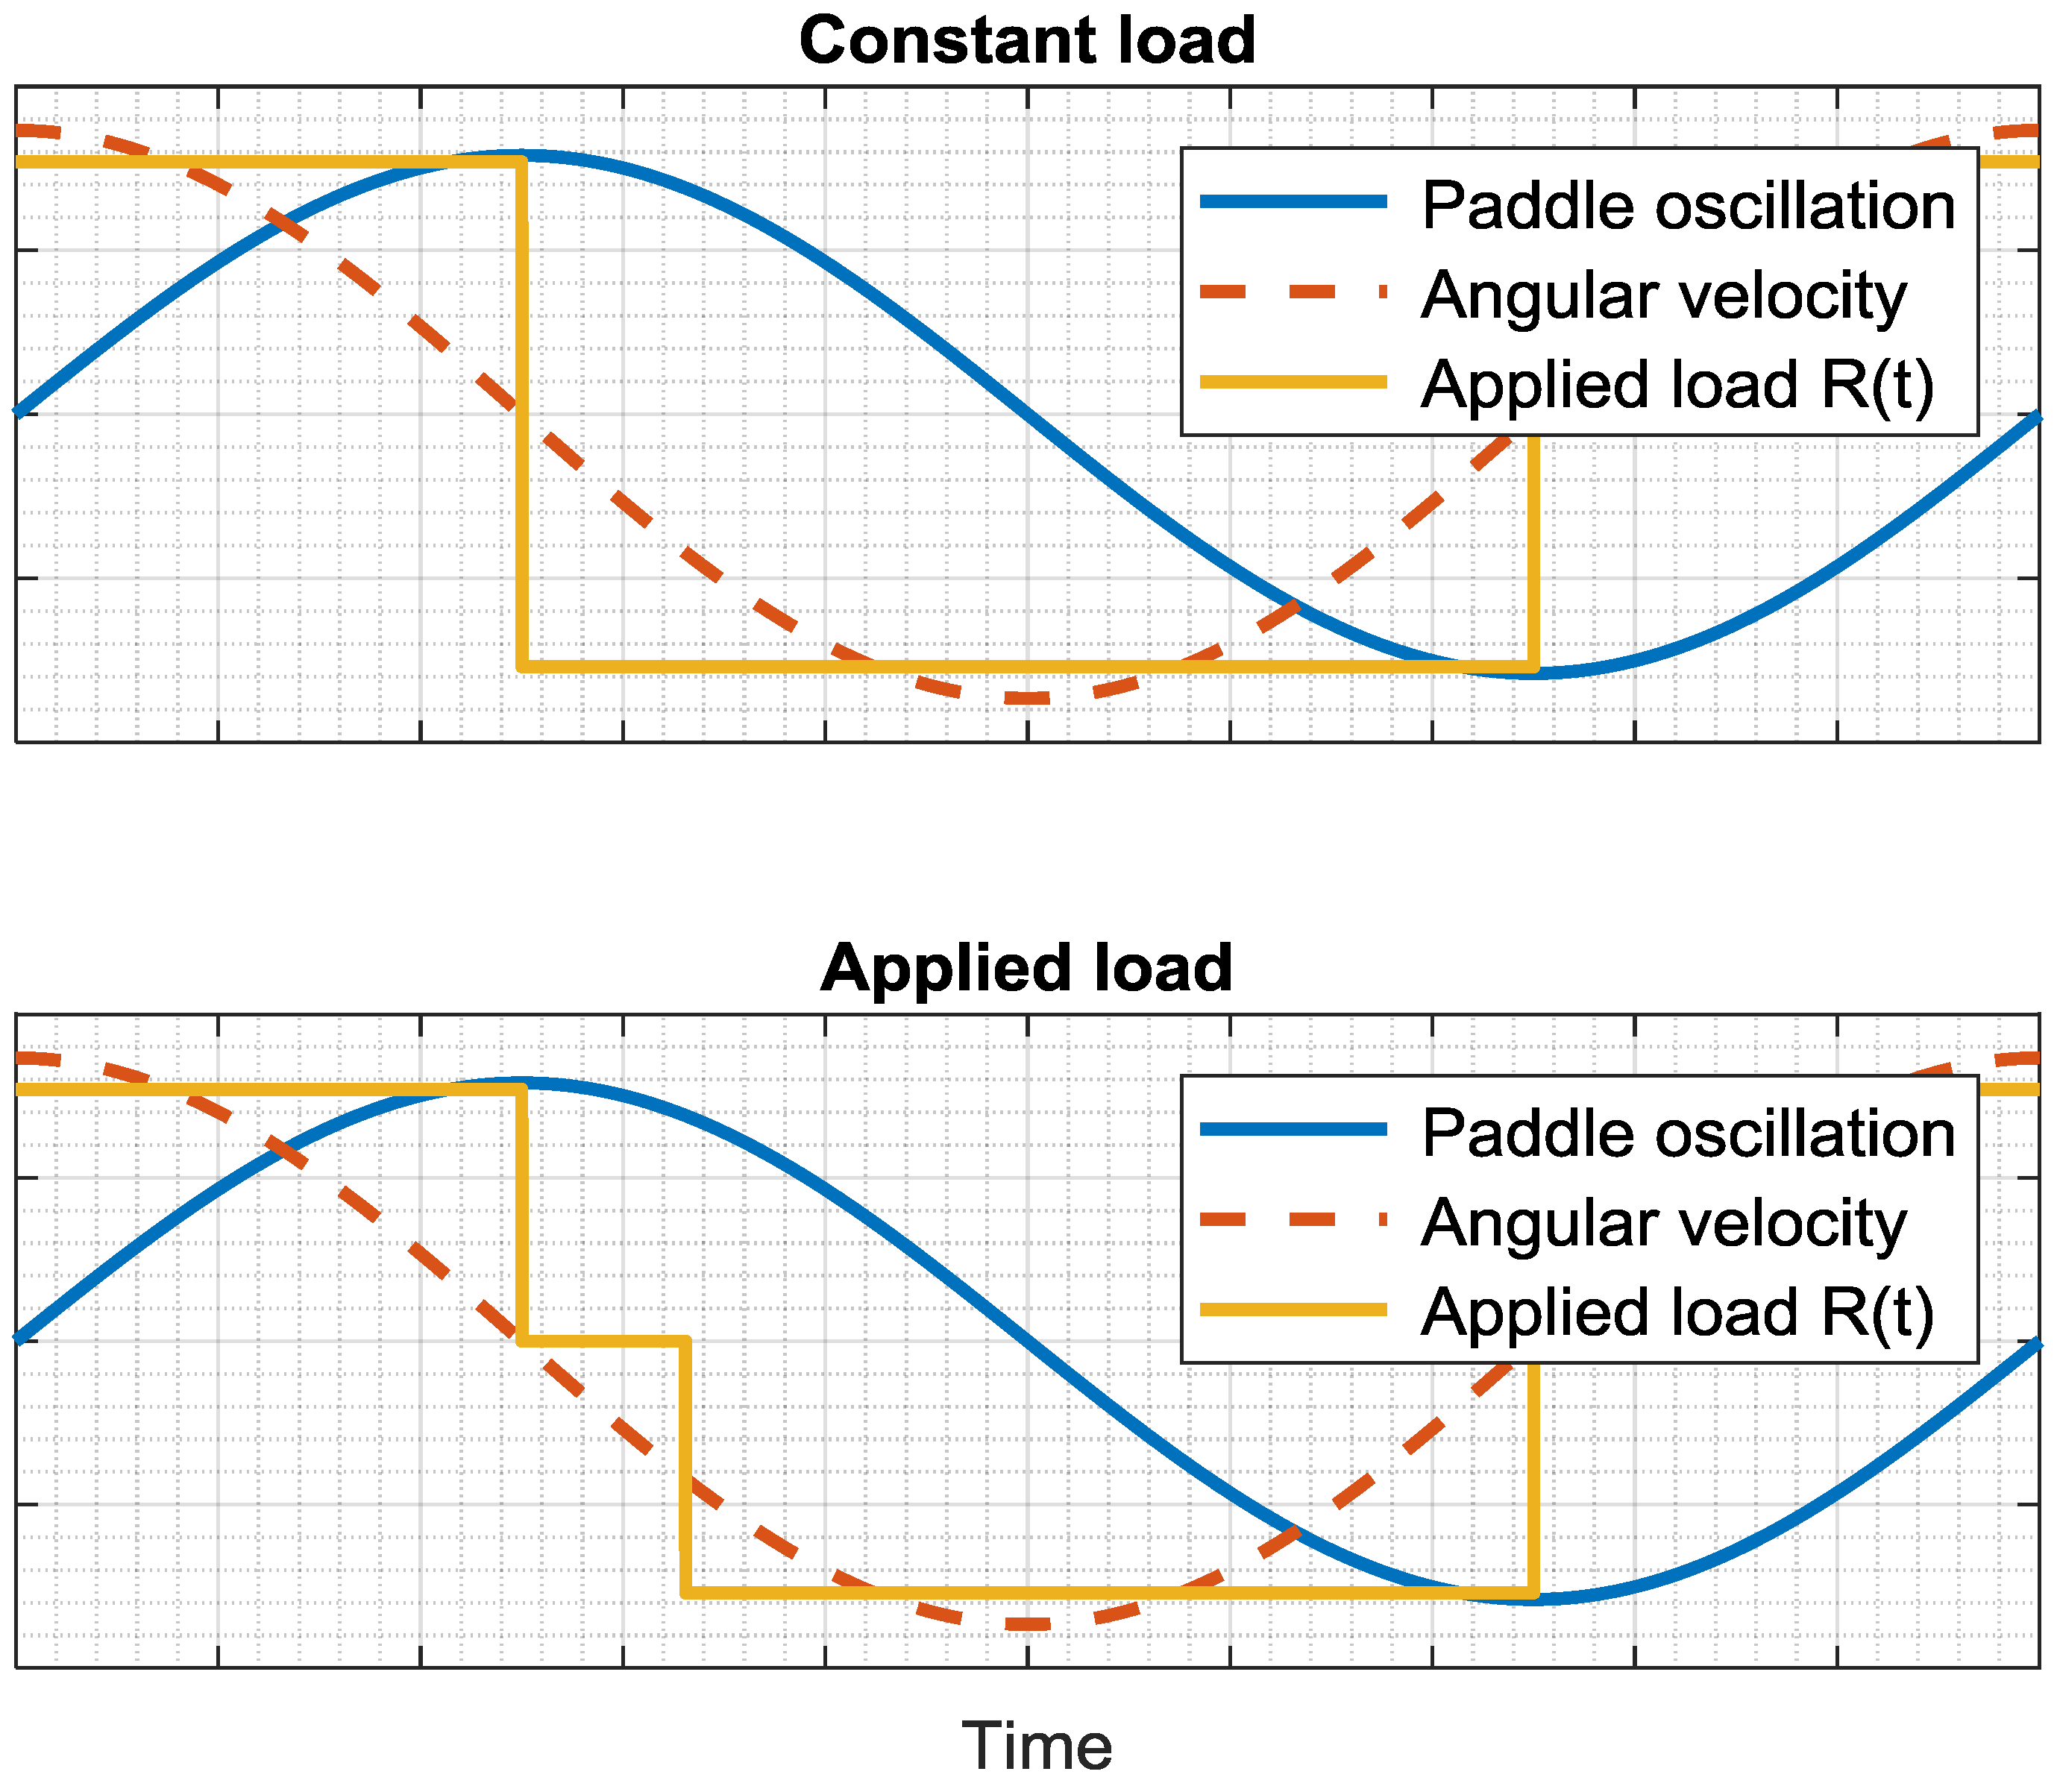
Figure 2 was attached to an upper disk. The most simple PTO is the application of a constant resistive friction force to the disk (i.e., case no. 1 in the previous Subsection), and the actual force time history
R(
t) is represented in
Figure 3, upper panel. Obviously the resistive force changed sign whenever the oscillation (the sinusoidal continuous line) reversed its direction. The dashed line represents the device velocity. A sinusoidal behavior is plotted for simplicity, being very similar to the actual measured signal
v(
t).
When the oscillation changed direction, i.e., when the paddle was at the extreme right or extreme left, the velocity was null. In these conditions, the friction force restrained the device movements, with no benefit, since the velocity was low and therefore the total contribution to the produced energy was minimal (Equation (1)).
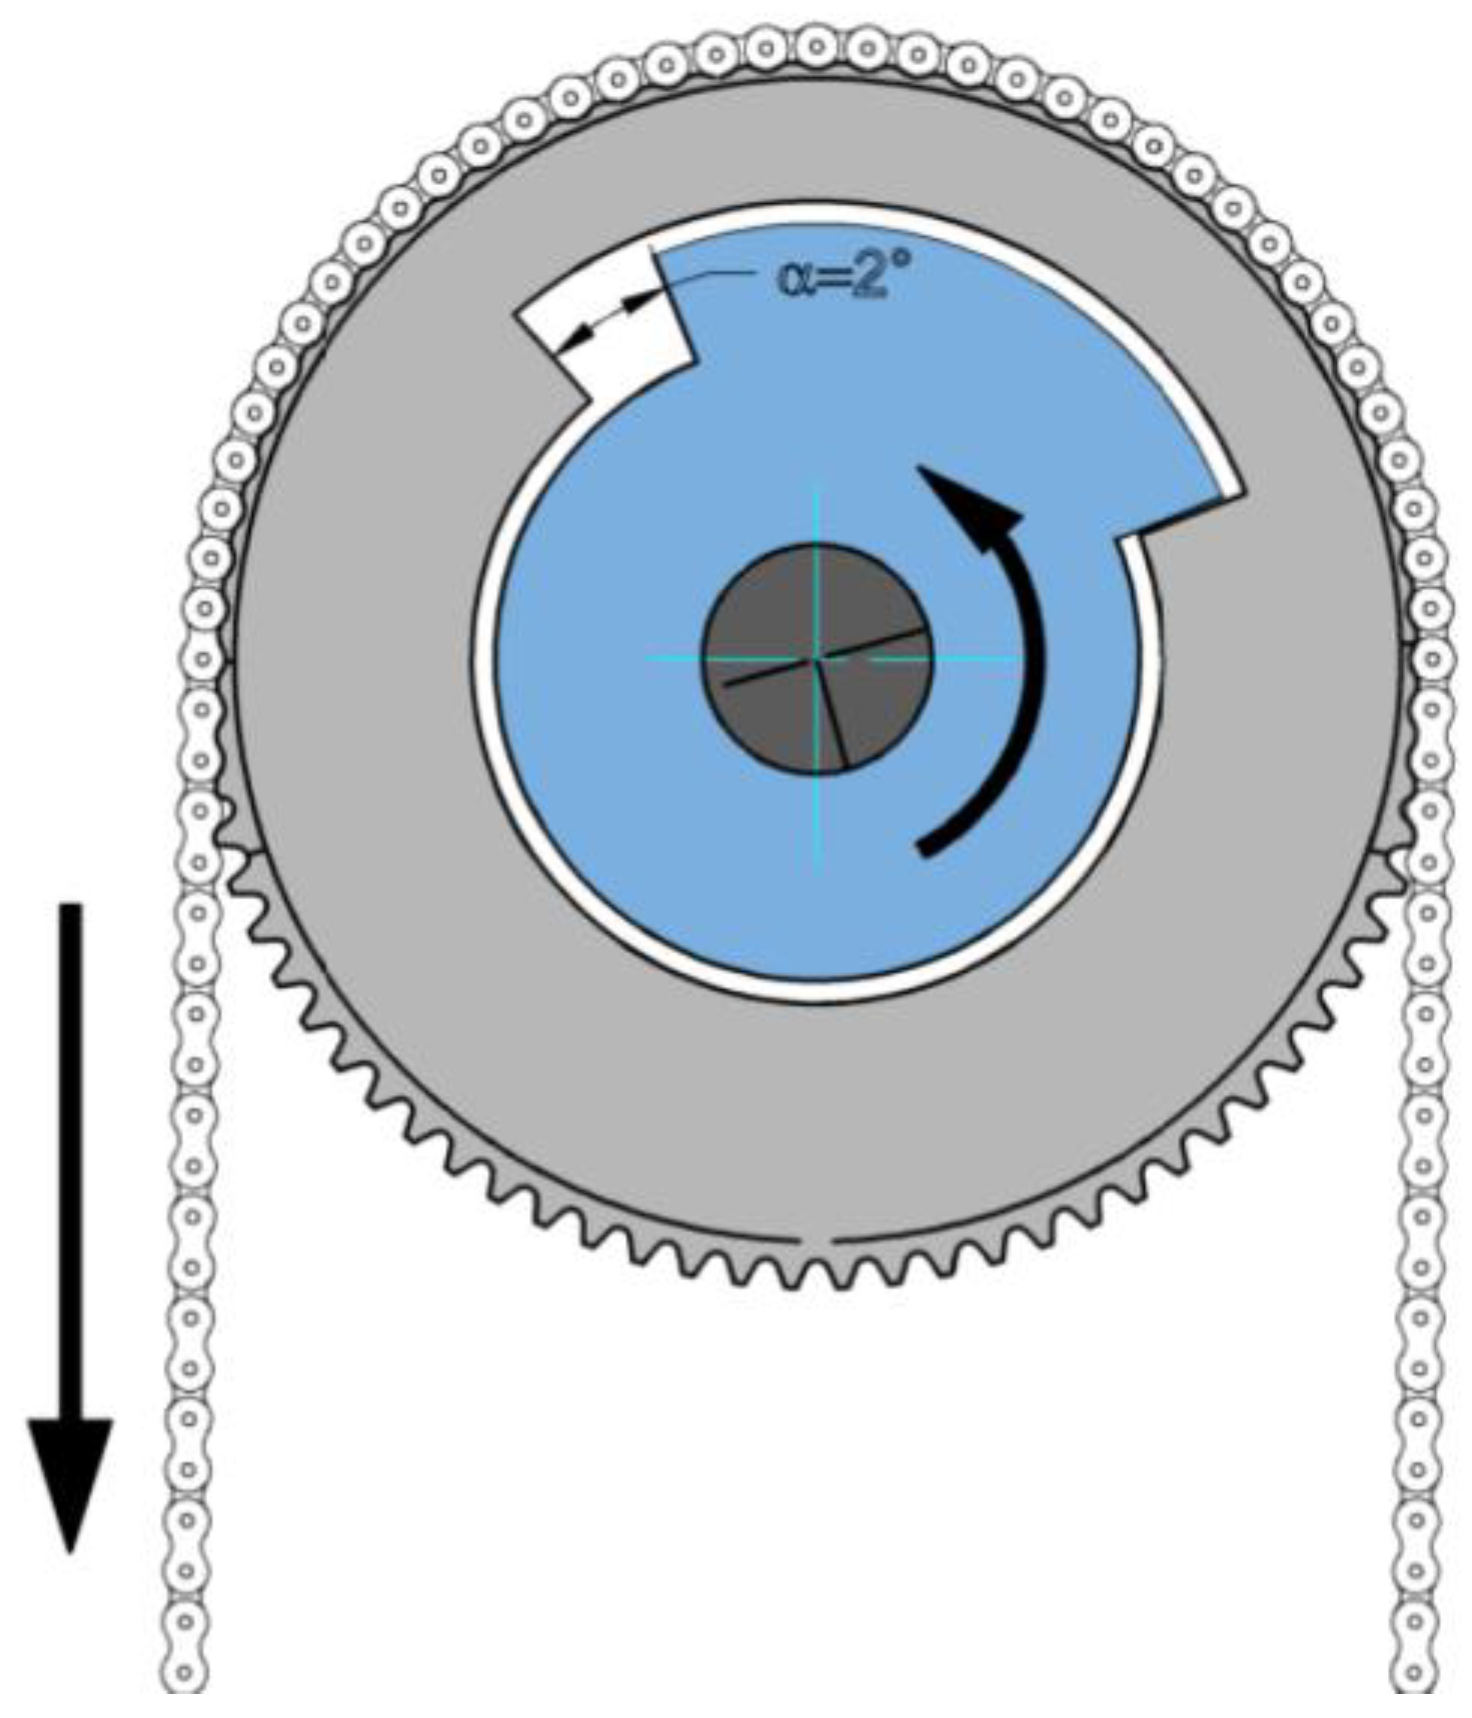
By a simple procedure, i.e., enlarging the hole that connects the crown gear to the shaft (
Figure 4), it was possible to delay the moment when the upper shaft was engaged.
Therefore, the force was applied with some delay, after the inversion of the motion.
Figure 3 lower panel shows this case. The rotating flap can therefore accelerated, arriving to a larger value of the velocity (with no useless restraining force).
A similar delay would occur in a possible improved design where the shaft is coupled to a “double gear and clutch system” used to spin a flywheel in the same direction. In order to engage with the flywheel, the velocity must exceed a certain threshold, or else the clutch does not engage. Therefore, the selected dummy PTO is coherent with the future developments.
A few settings of the PTO loads were preliminarily analyzed, and two were found more significant. In both cases, the restraining forces engaged after a rotation of approximately 1 degree. The two settings of the PTO were measured in static conditions to be 5.5 and 7.7 Nm. The friction force under dynamic conditions, used for the evaluation of
Ec (Equation (1)), was assessed to be much lower and approximately half of this value, and equal to
L1 = 2.9 Nm,
L2 =4.1 Nm when the shaft was engaged, 0 otherwise (see
Figure 3, lower panel).
3.2. Test Programme
The test programme includes an initial analysis of the free oscillation, with evaluation of the natural period of oscillation TN, that was found to be 6 s. This value appears to be too large (19 s at prototype scale) to favor resonance, and this is a first noteworthy conclusion.
Then, 3 water levels were considered, i.e., target depth, low tide and high tide. The scaled values are 0.40 m, 0.35 m and 0.45 m respectively. Free oscillations were measured for all water depth, whereas the power production was only evaluated for d = 0.40 m (see
Table 1). Wave height and period vary in the range 2–8 cm and 1–4 s, according to
Table 2 (free oscillations) and
Table 3 (with the applied load). A number of additional tests were also carried out with different loads, following in a confused pattern, that need not be presented here as they do not contribute to the conclusions.
4. Results
4.1. RAO
The first result presents the Response Amplitude Operator (RAO) measured in the absence of applied load (free oscillation). The RAO is defined as the ratio between the total extension of the oscillation and the incident wave height. Note that although the generated waves are regular, the signal is not “exactly periodic” in time. The incident wave component is separated from the reflected one by an array of wave gauges, through the Zelt–Skielbreya [
25] method. The incident wave height used to evaluate the RAO is assumed to be the
Hrms characteristic value of the incident component. In analogy, the oscillation amplitude used for the RAO is the rms value (among the possible averages, the “rms” is chosen since this characteristic value preserves the total energy). The generated period is found to be equal to the target.
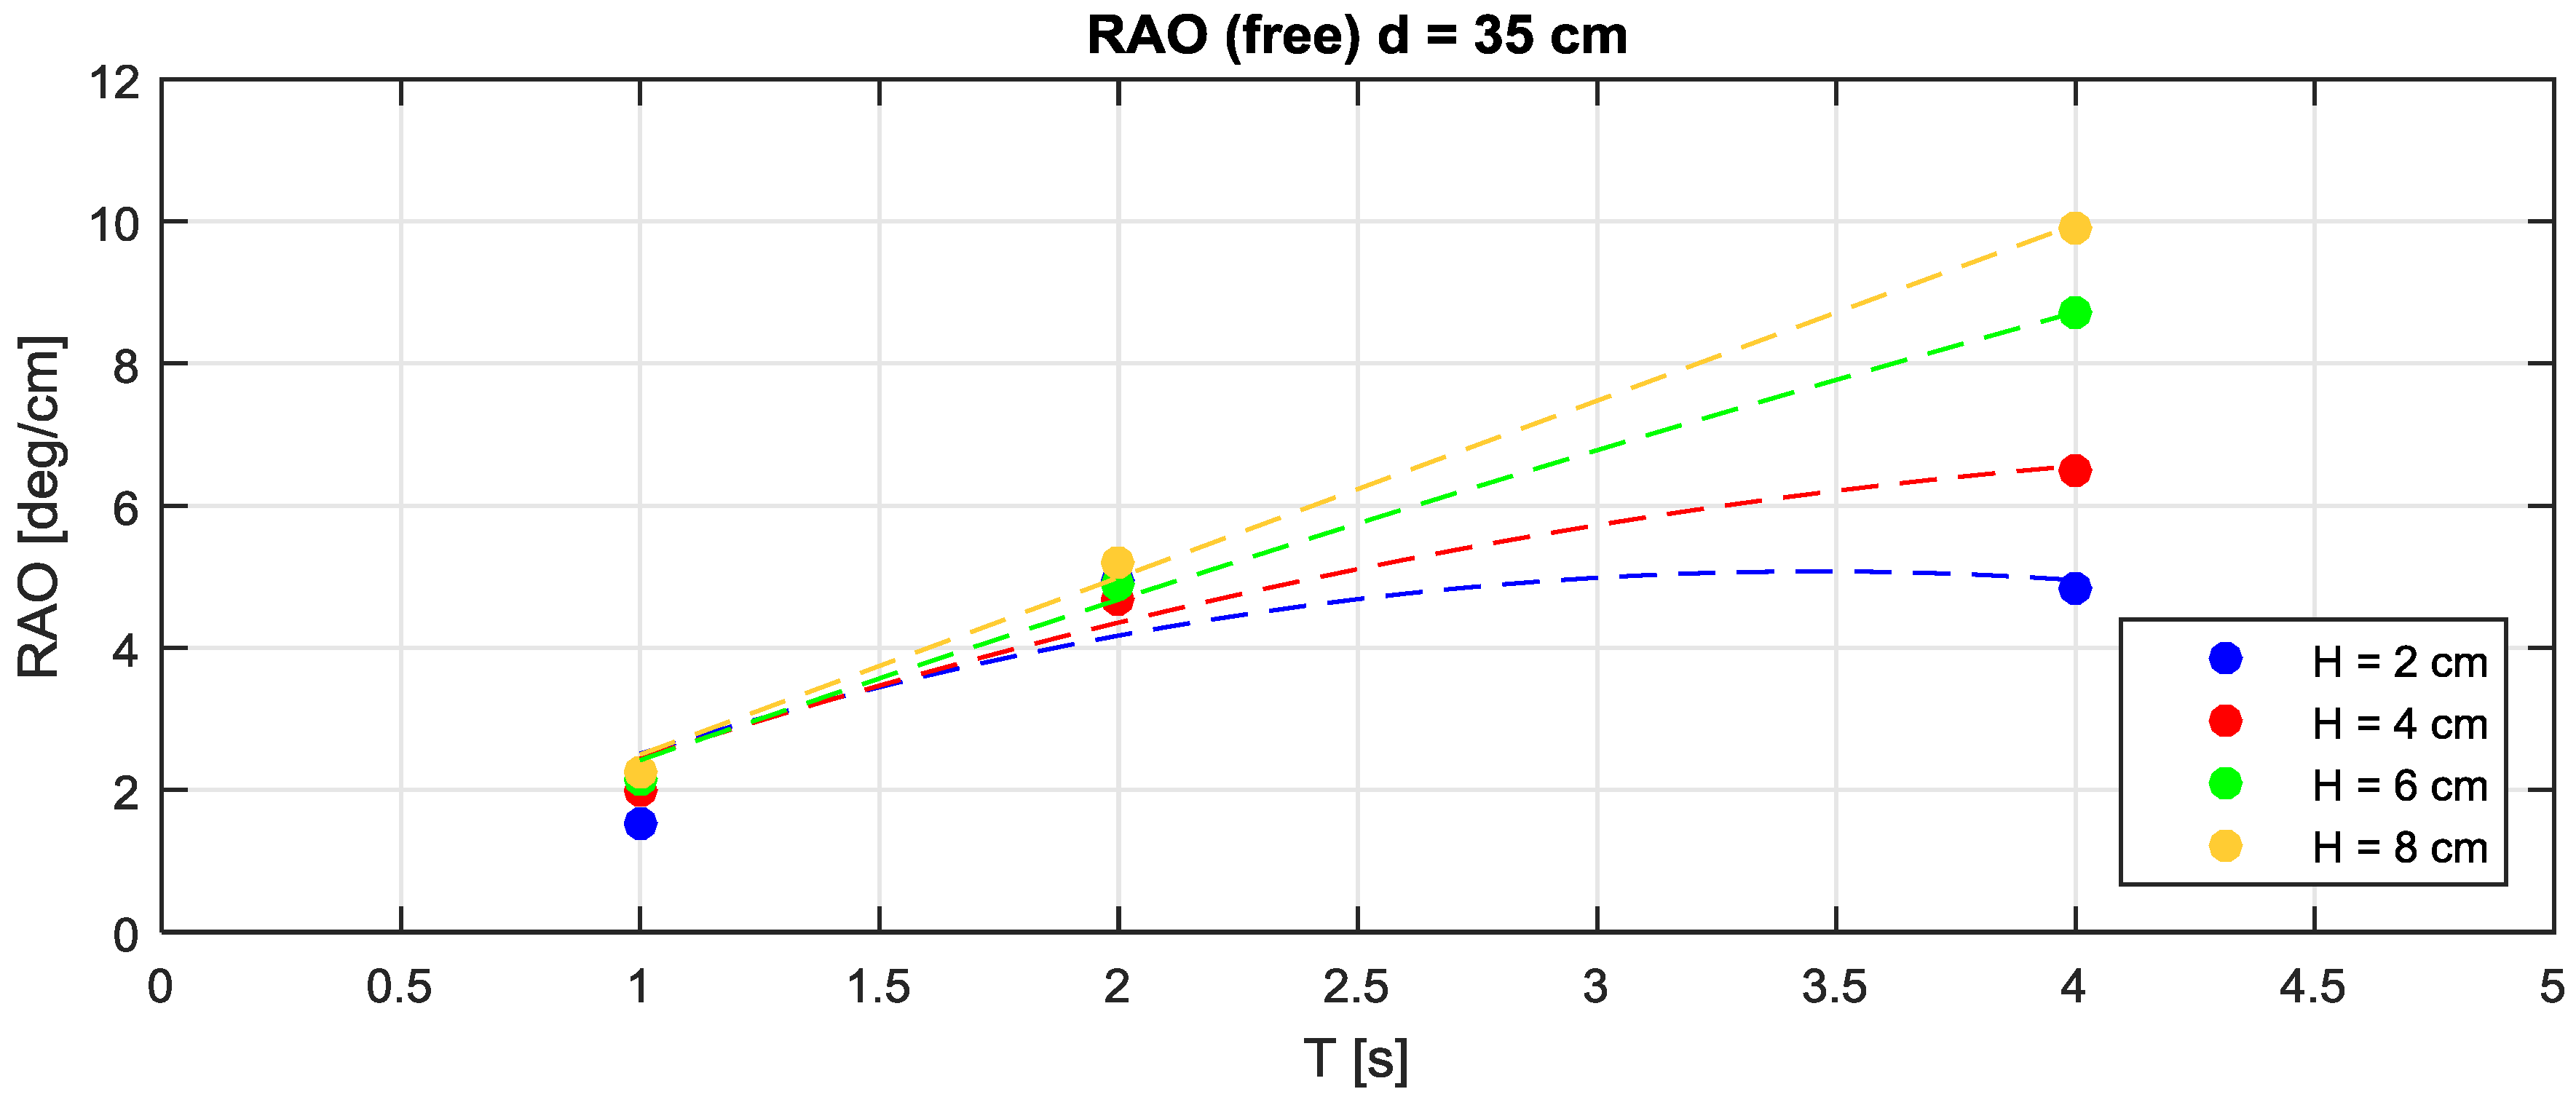
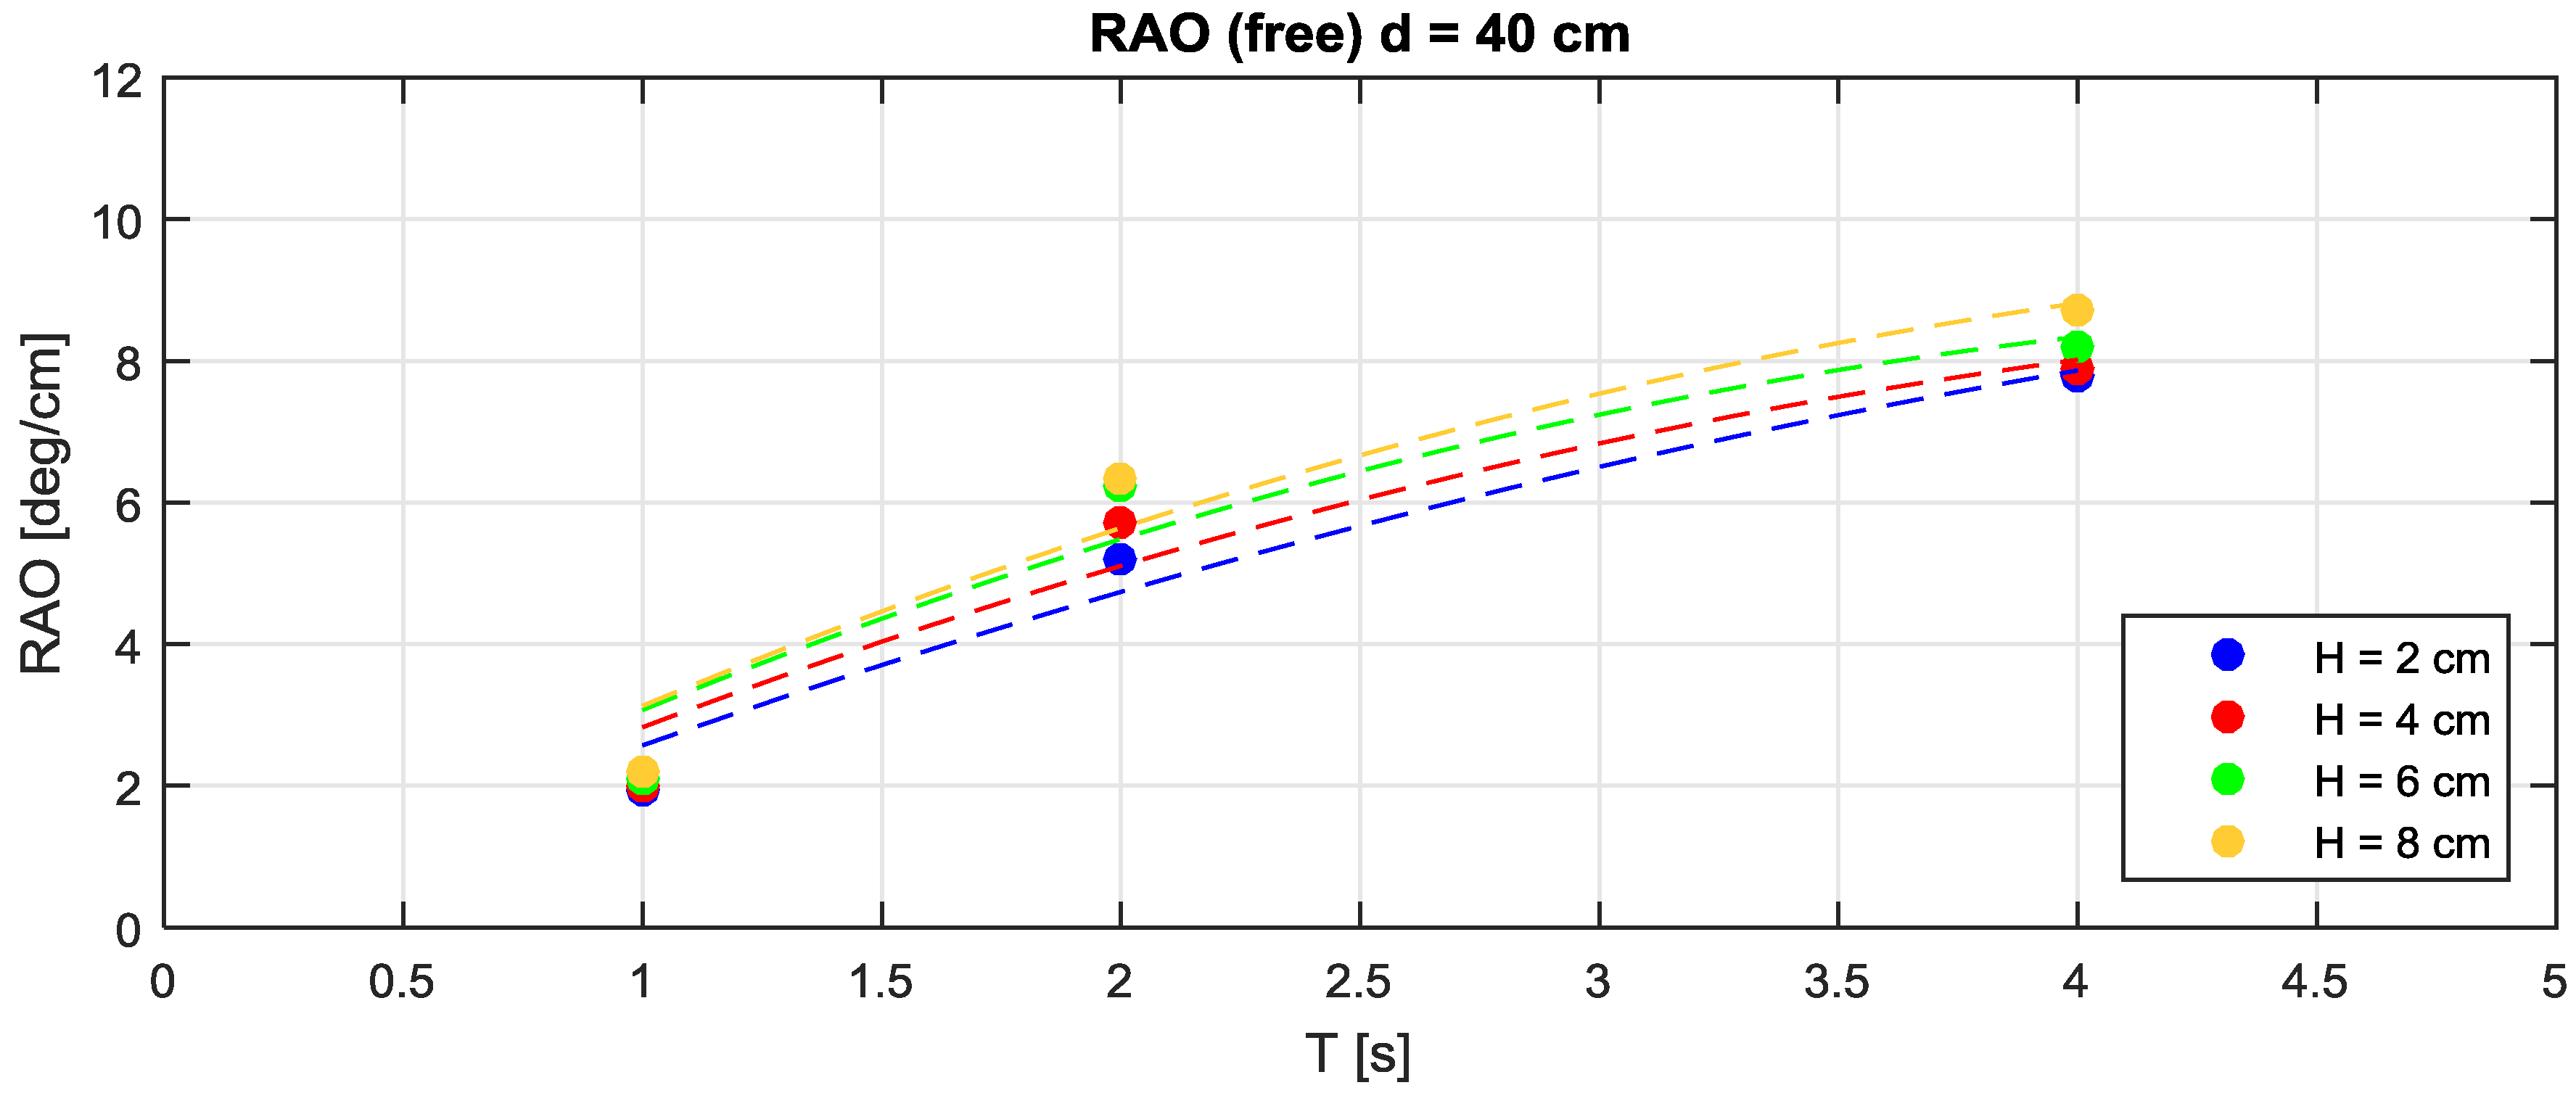
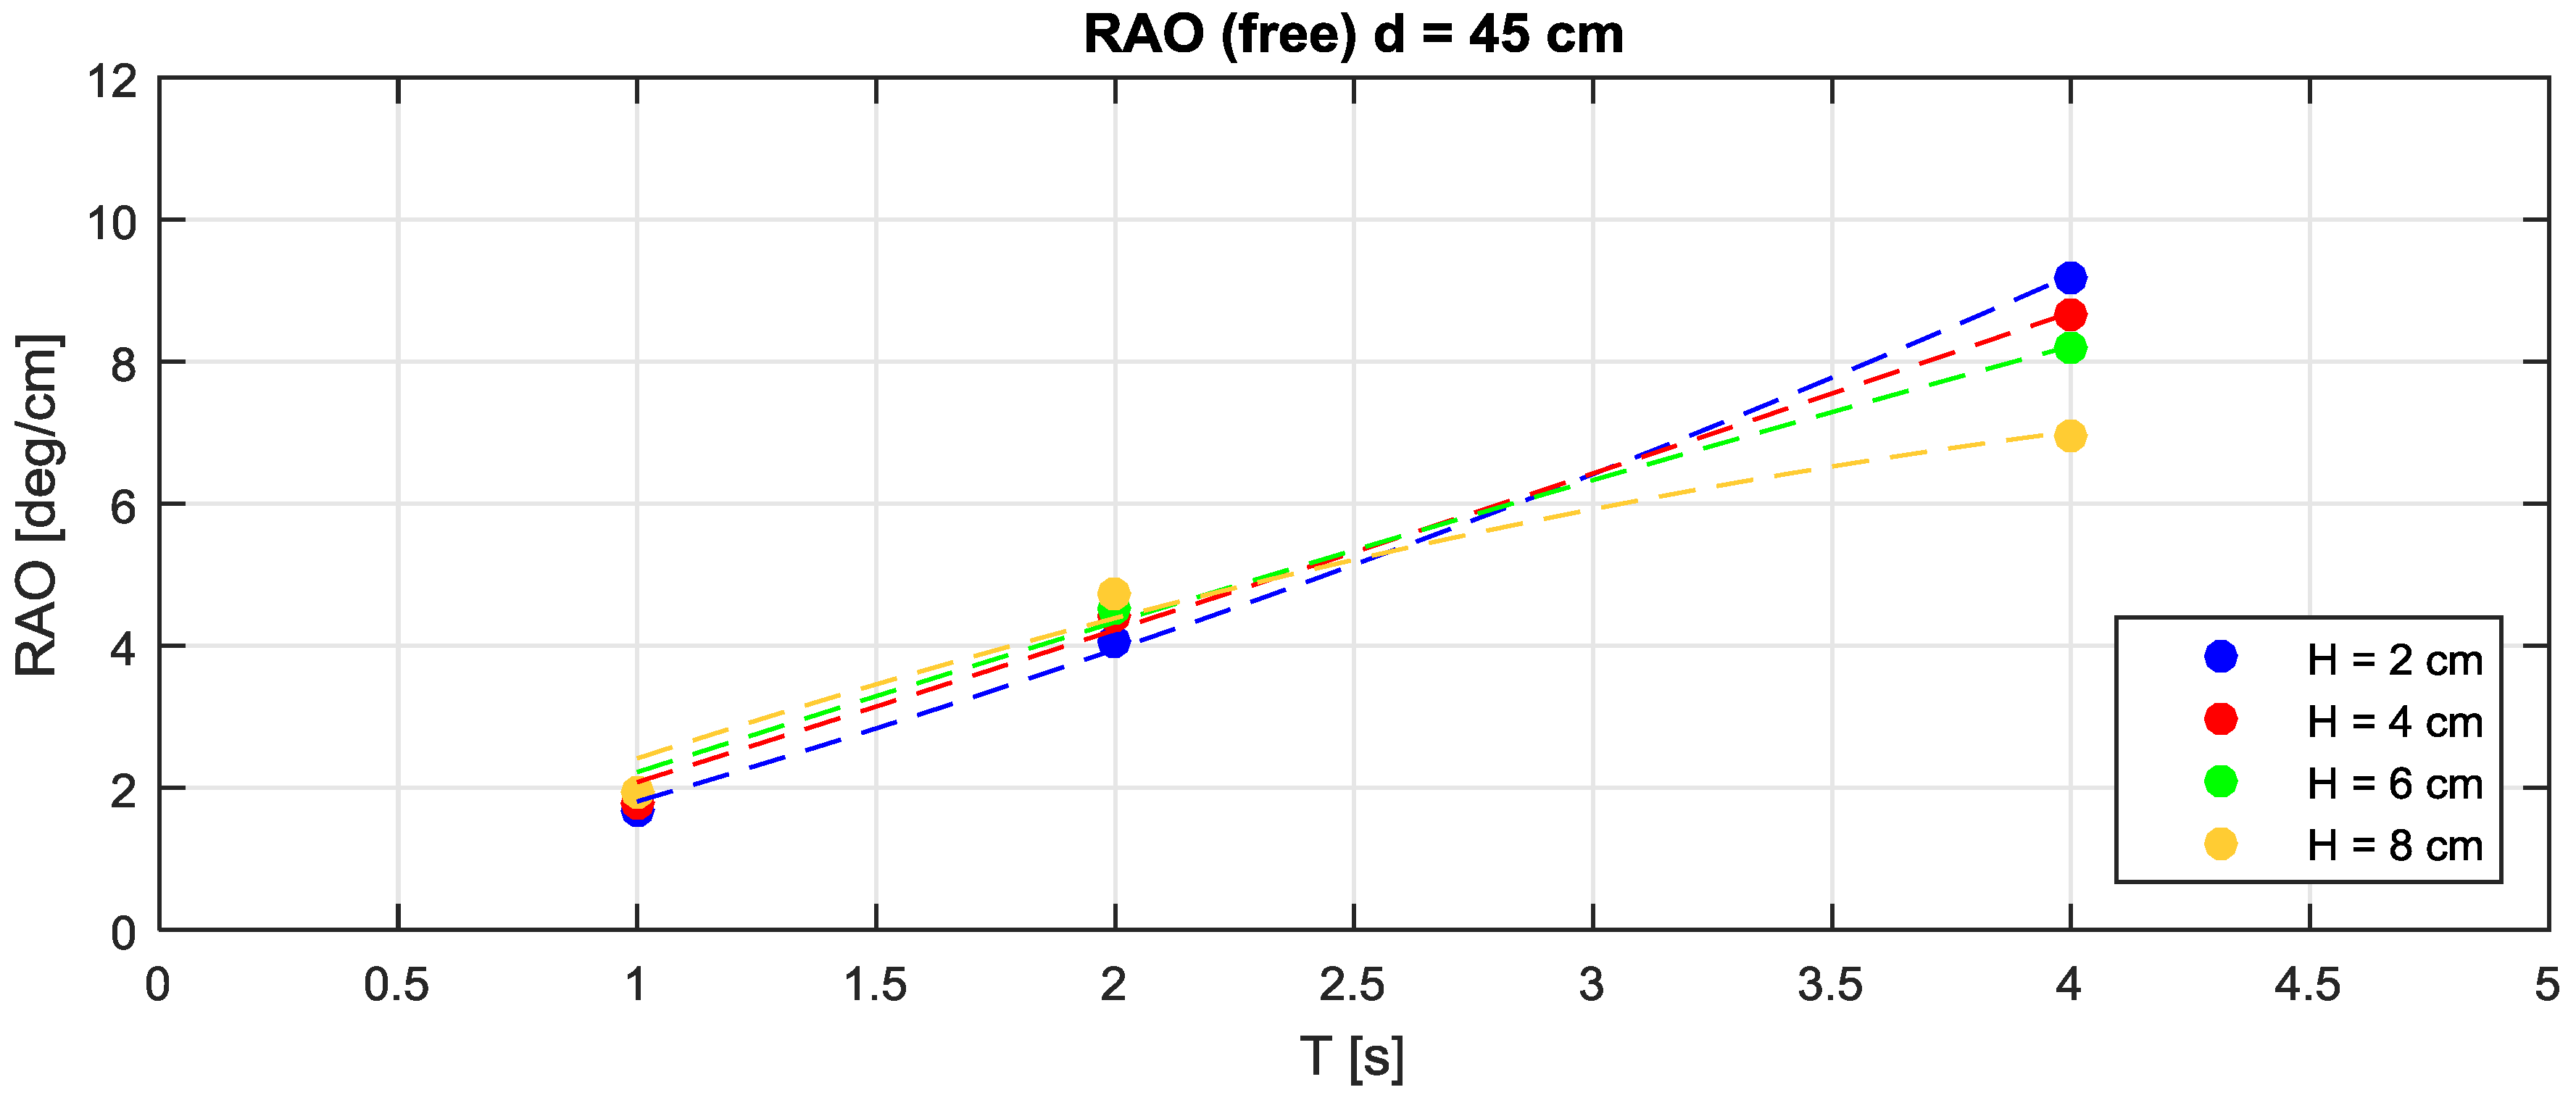
Figure 5,
Figure 6 and
Figure 7 present the RAO for the different water depths, function of the period T and the target wave height H.
In all cases, the RAO grows almost proportionally with the tested wave periods (as a consequence of the horizontal stretching of the wave orbits with T ranging from 1–4 s).
For T = 1 and 2 s, the RAO behavior and, consequently, the oscillation angle, is similar for the three water depths (d = 0.35, 0.40, 0.45 m). In particular, for T = 1 s (i.e., 3 s at prototype scale) the device oscillations is approximately 2°/cm, independent from H and d. For instance, for H = 8 cm, the oscillations are 2°/cm × 8 cm = 16°, and there is one oscillation every second. For T= 2 s, the RAO is approximately 6°/cm.
For T = 4 s, the RAO depends significantly both on water depth and on wave height: (a) for H = 2 and 4 cm, the oscillation increases with increasing water depths; (b) for H = 6 cm the oscillation is constant for the three tested water depths; (c) for H = 8 cm, the oscillation decreases with water depth.
To explain this behavior, a number of factors should be considered. The torque applied by the wave depends on the wave frequency, the wave orbital shape, the oscillation range (i.e., the obliquities spanned by the device during its motion), the nonlinear shape of the wave (higher crests and longer troughs) and, the abrupt non-linear effect due to possible submergence of the device during its movement, so that high and small waves induce qualitatively different responses. The device oscillation range depends on water depth since the initial equilibrium position of the floater changes for the three cases. For d = 0.35 m, 0.40 m and 0.45 m, the initial rest angle (with respect to the horizontal) is approximately 35°, 50° and 60°.
When the device is restrained by the PTO, the device movements are significantly reduced and the RAO is obviously much smaller.
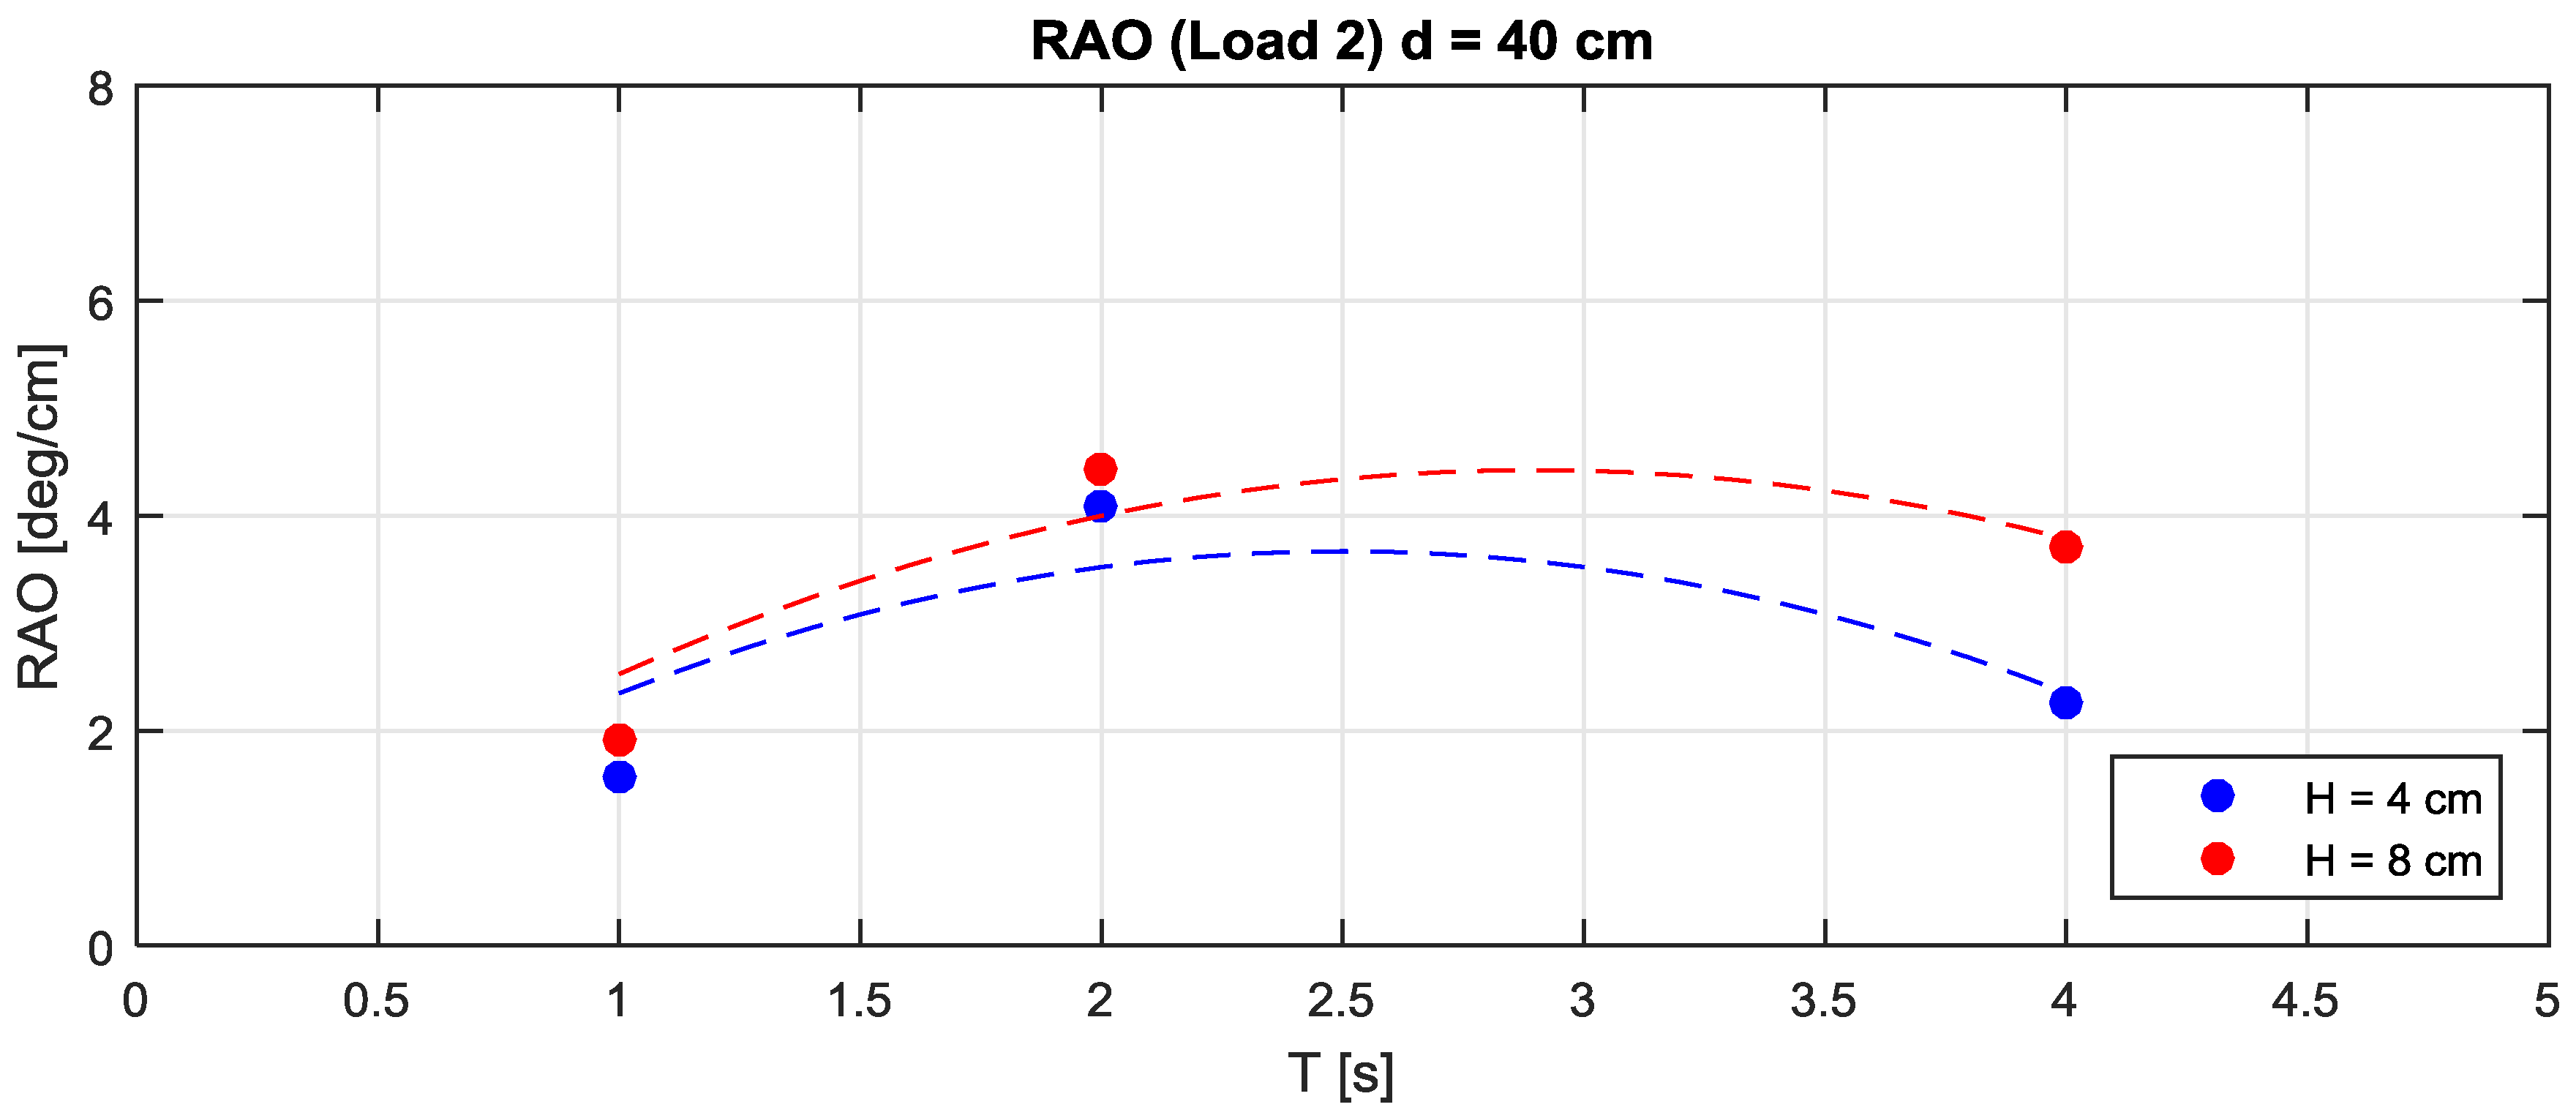
Figure 8 shows the RAO for the case with L2 = 4.1 Nm, that was found to give a slightly larger power for all wave periods.
Figure 8 shows that the RAO measured in correspondence to H = 8 cm was consistently larger than the case H = 4 cm.
4.2. Measured Efficiency
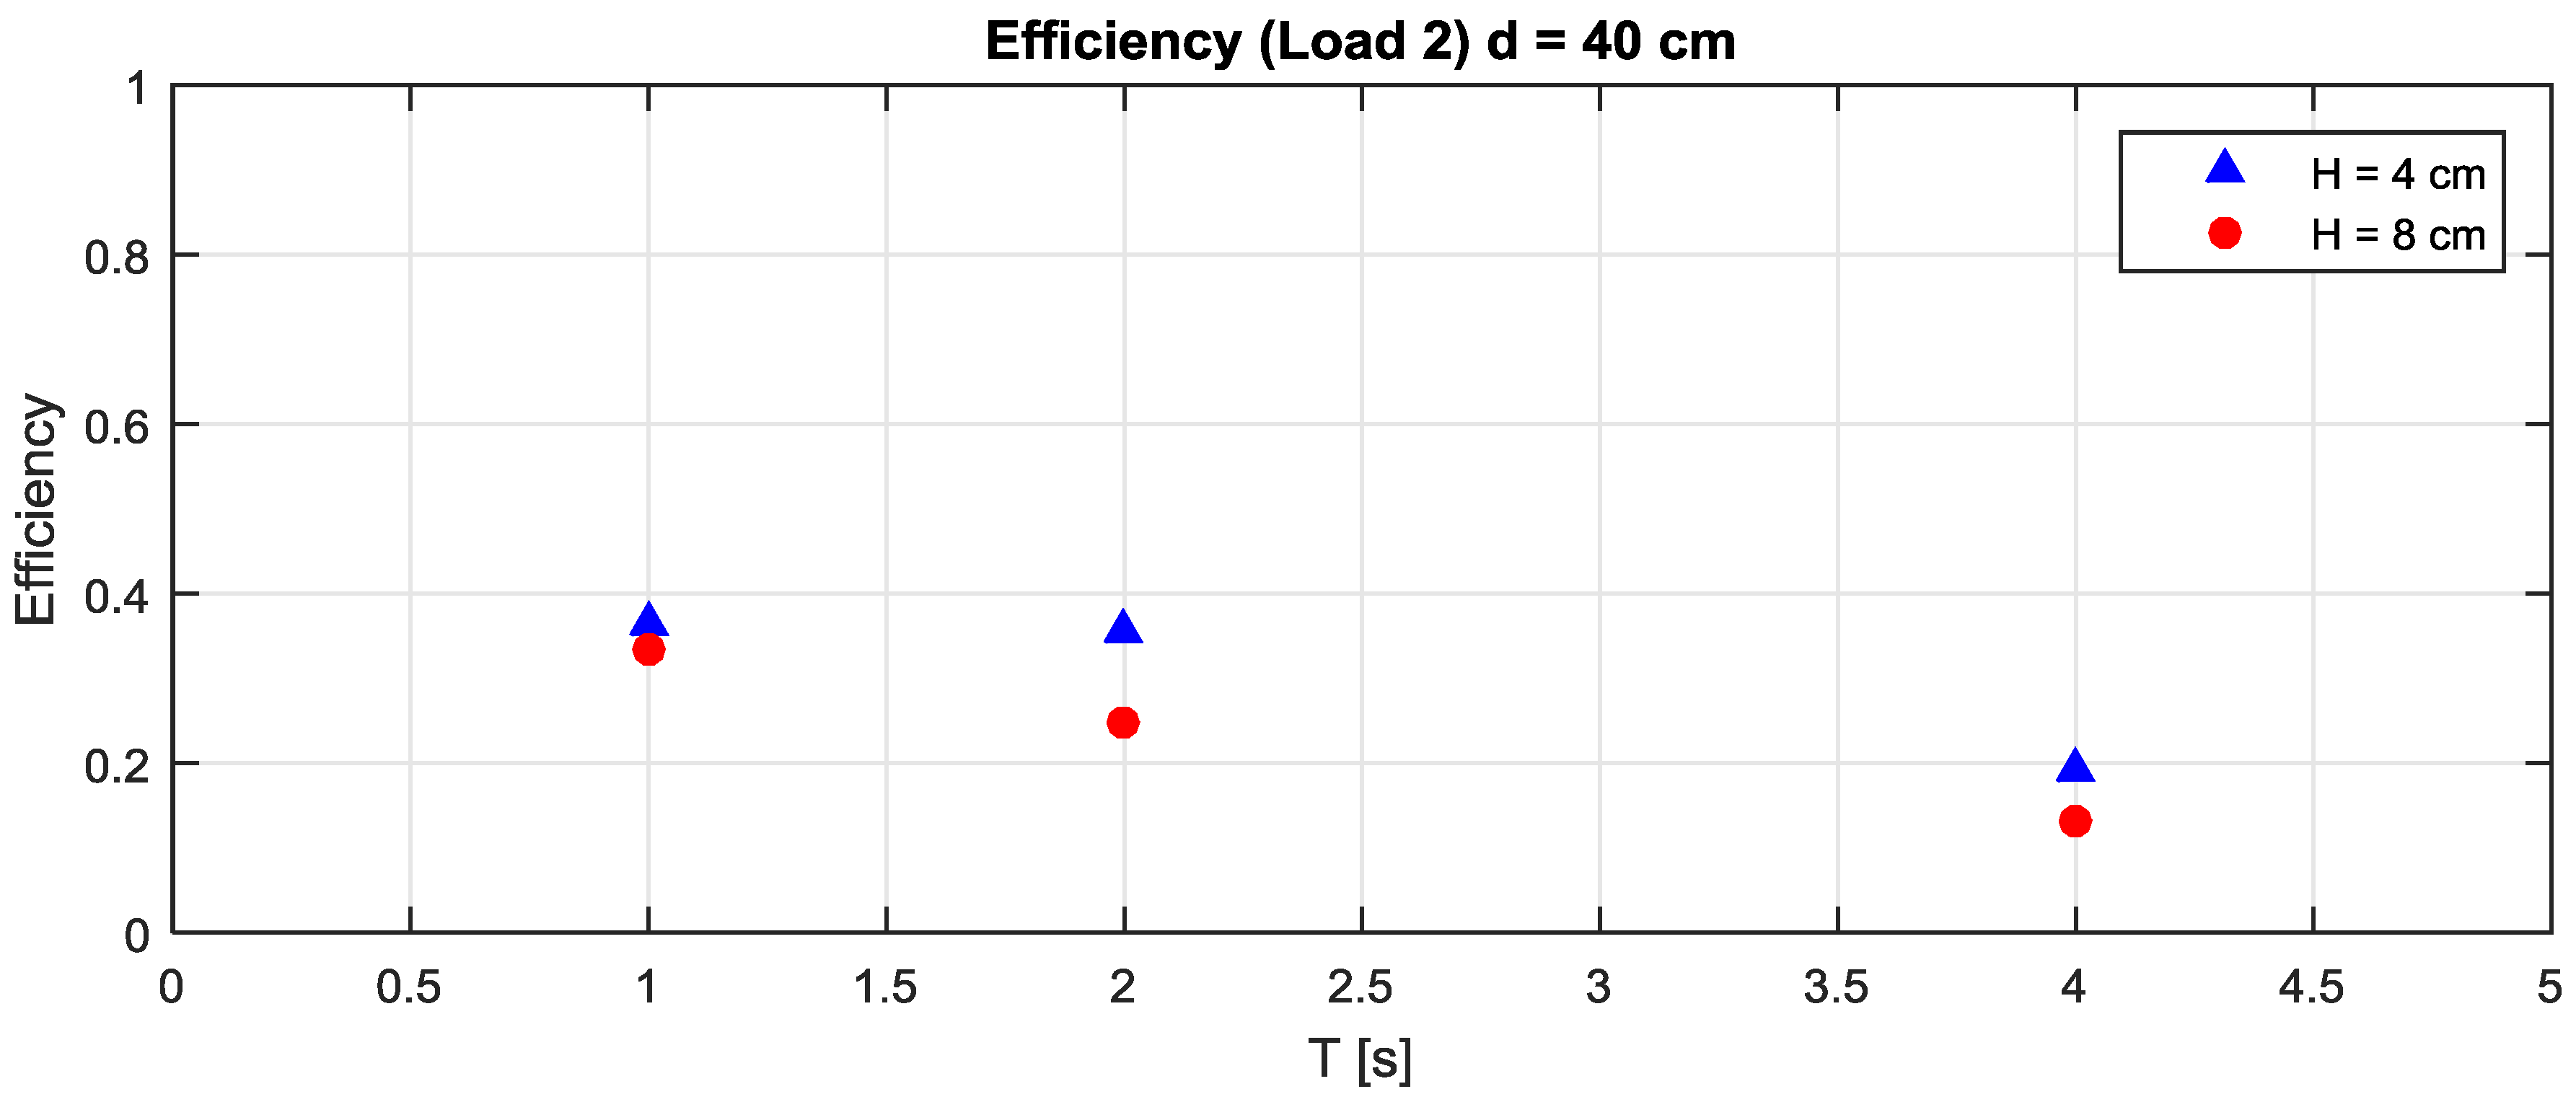
The efficiency is obtained as the ratio between the converted energy Ec and the incident wave energy, Ei = ρgH2i/8.
The incident wave energy flux is proportional to the group celerity and therefore, quantitatively, the highest power production is achieved for longer waves. However, in relative terms, the device efficiency decreases with the wave period, having an opposite behavior of the RAO achieved without load. In fact, larger RAOs do not correspond to a more effective transfer mechanism from wave to mechanical energy, and in fact the largest oscillations are achieved in stationary conditions, when the wave energy transfer mechanism is low. The RAO is rather affected by the wave kinematic.
Figure 9 shows the efficiency measured in the wave flume. The higher efficiency is approximately 35%, measured for T = 1 s. The case H = 8 cm is more relevant, being associated to a larger power output.
4.3. Wave Attenuation
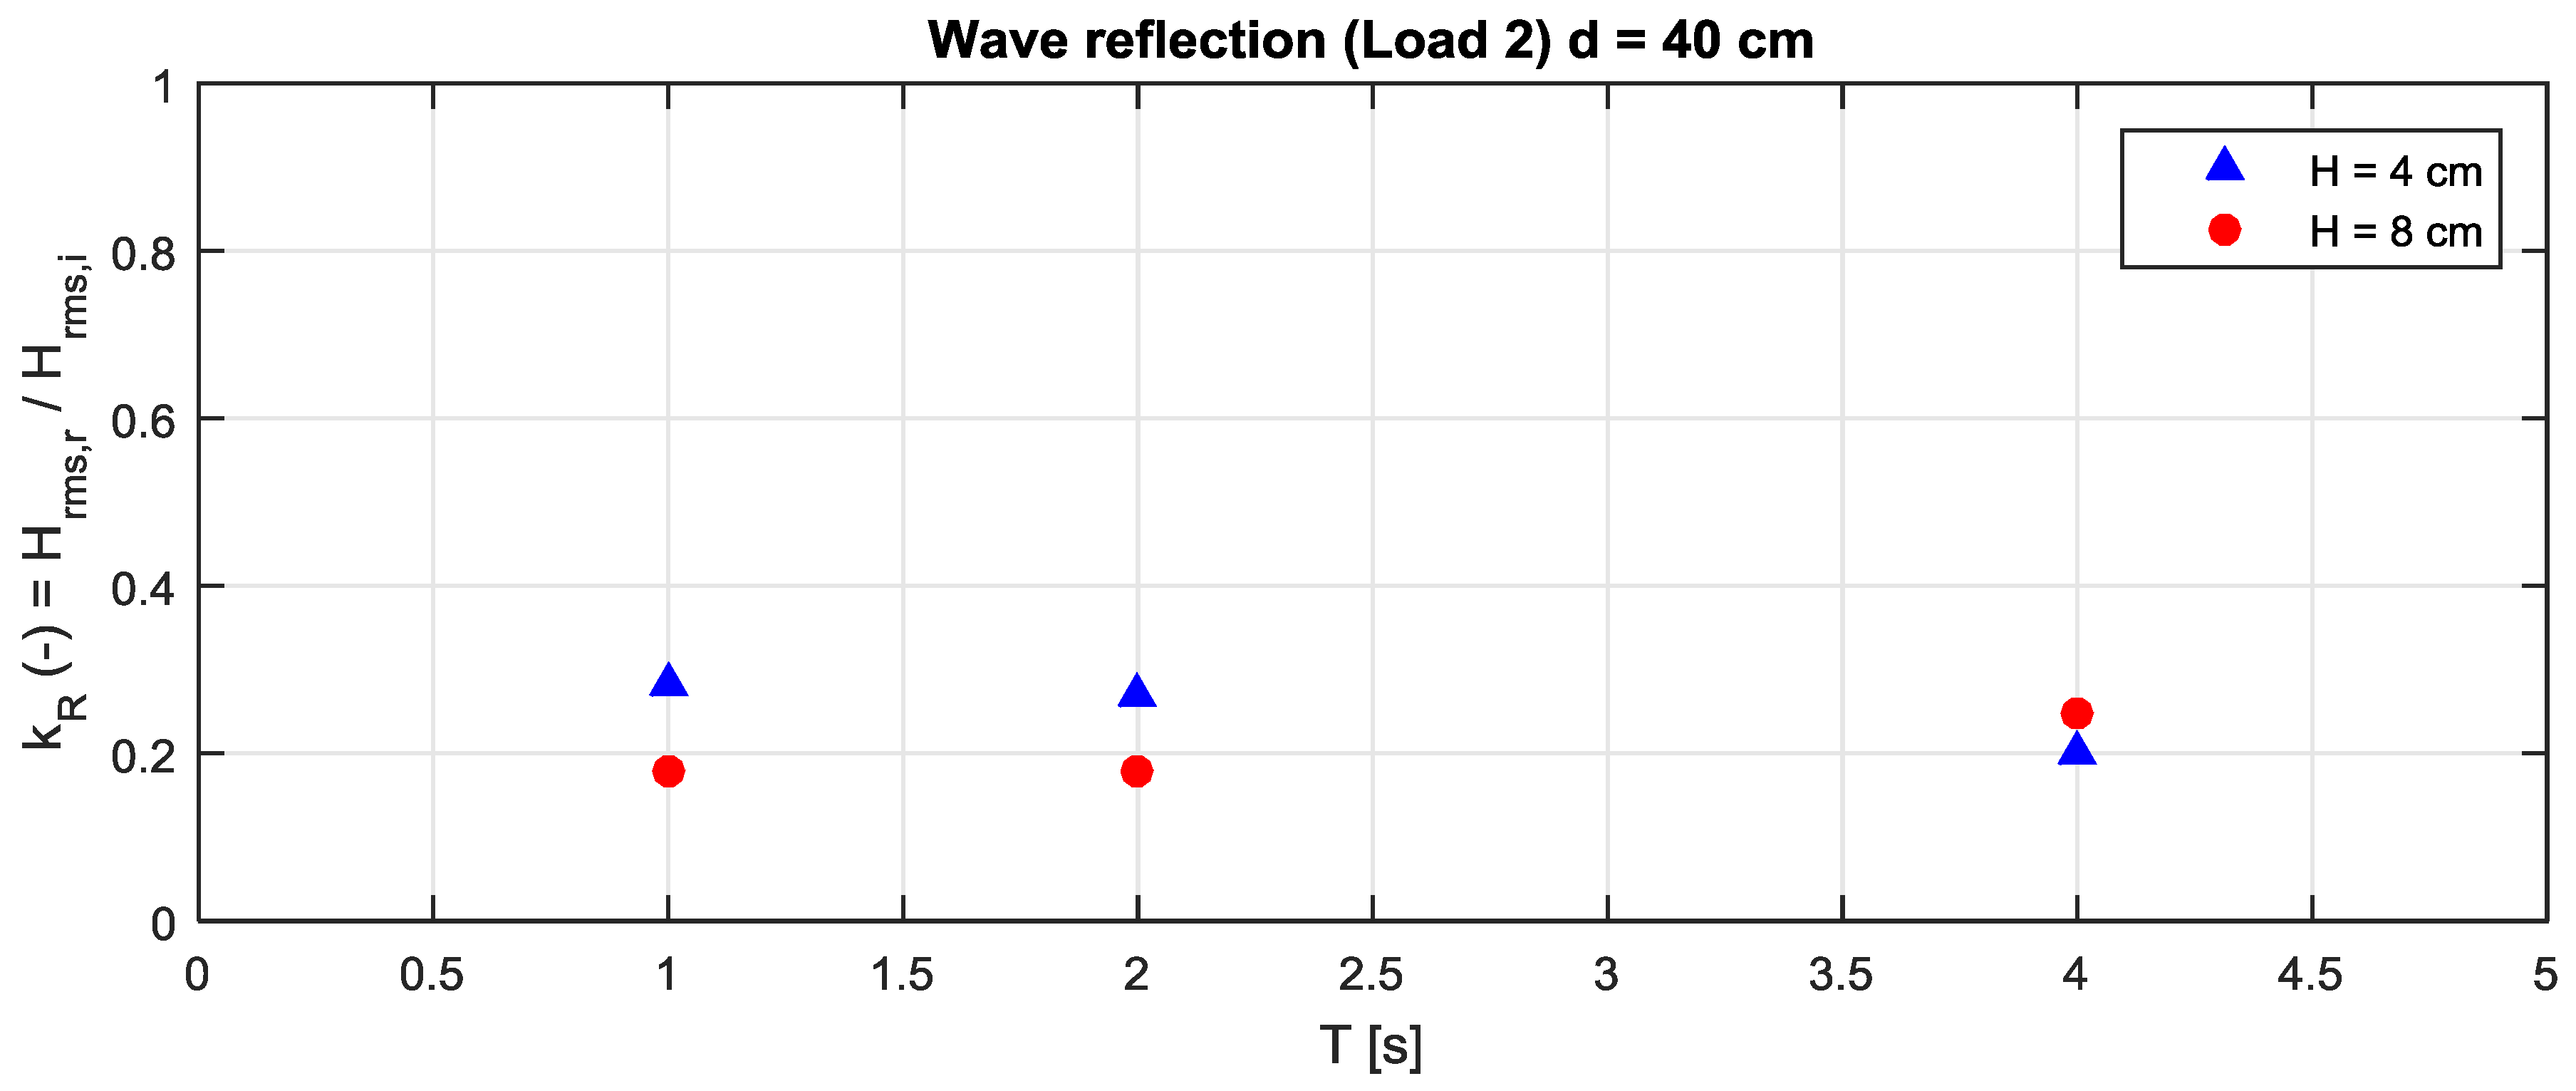
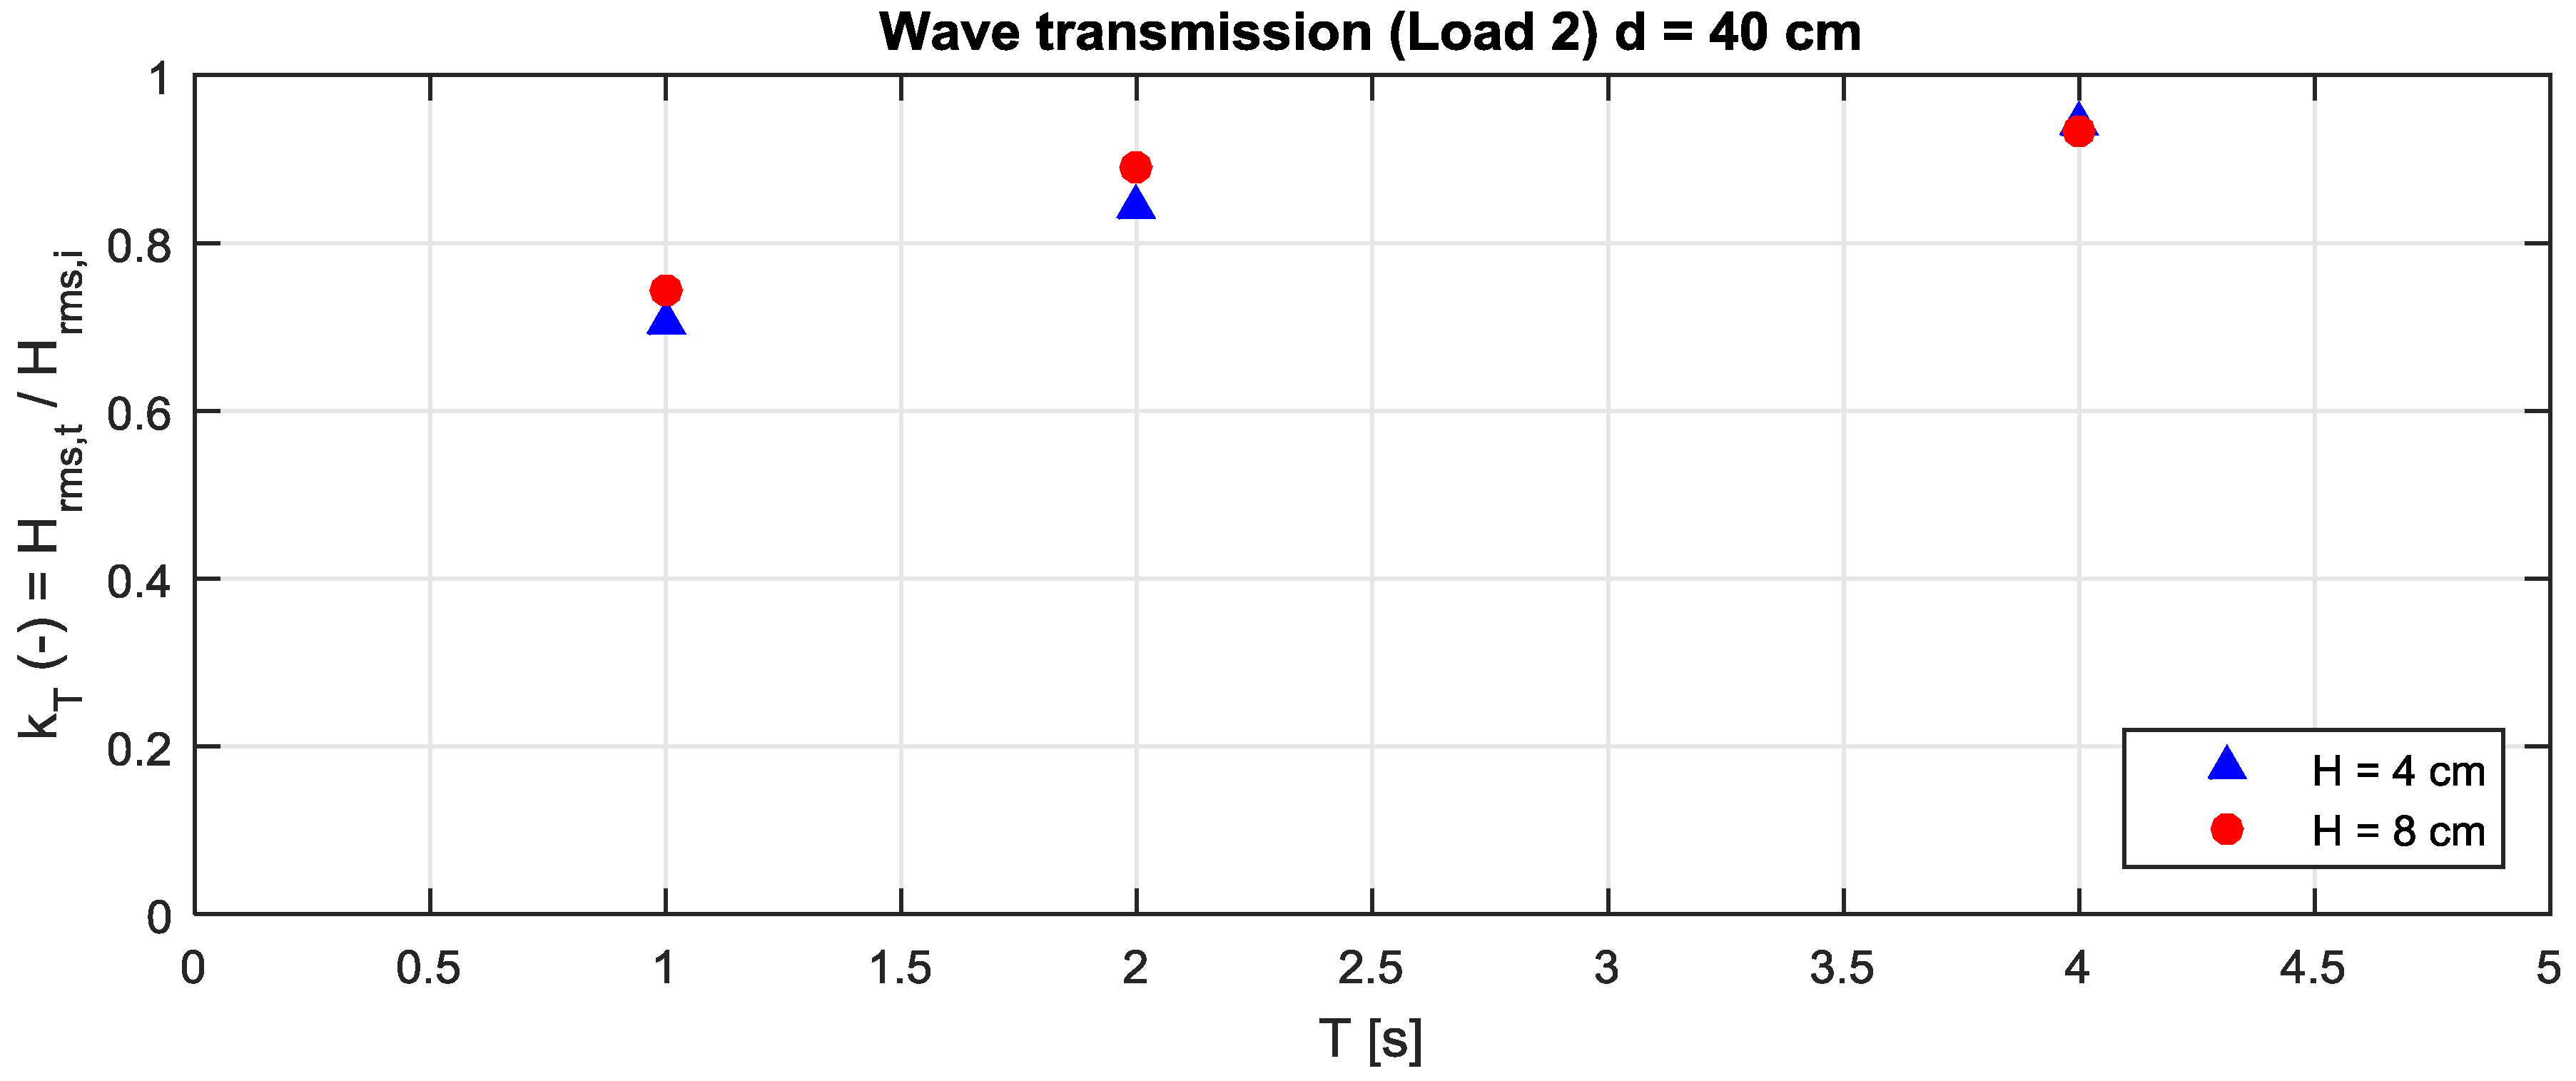
The wave reflection and transmission are certainly affected by the device movements and hence, as seen in the previous chapters, by the PTO load.
Figure 10 and
Figure 11 show, for the case with optimal PTO load, the reflection coefficients defined as the ratio between reflected and incident wave height, and the transmission coefficient defined as the ratio between transmitted and incident wave height. As expected, the transmission coefficient increases for long periods. It is in fact easy to understand that the device cannot limit the transmission of slow oscillations (long period).
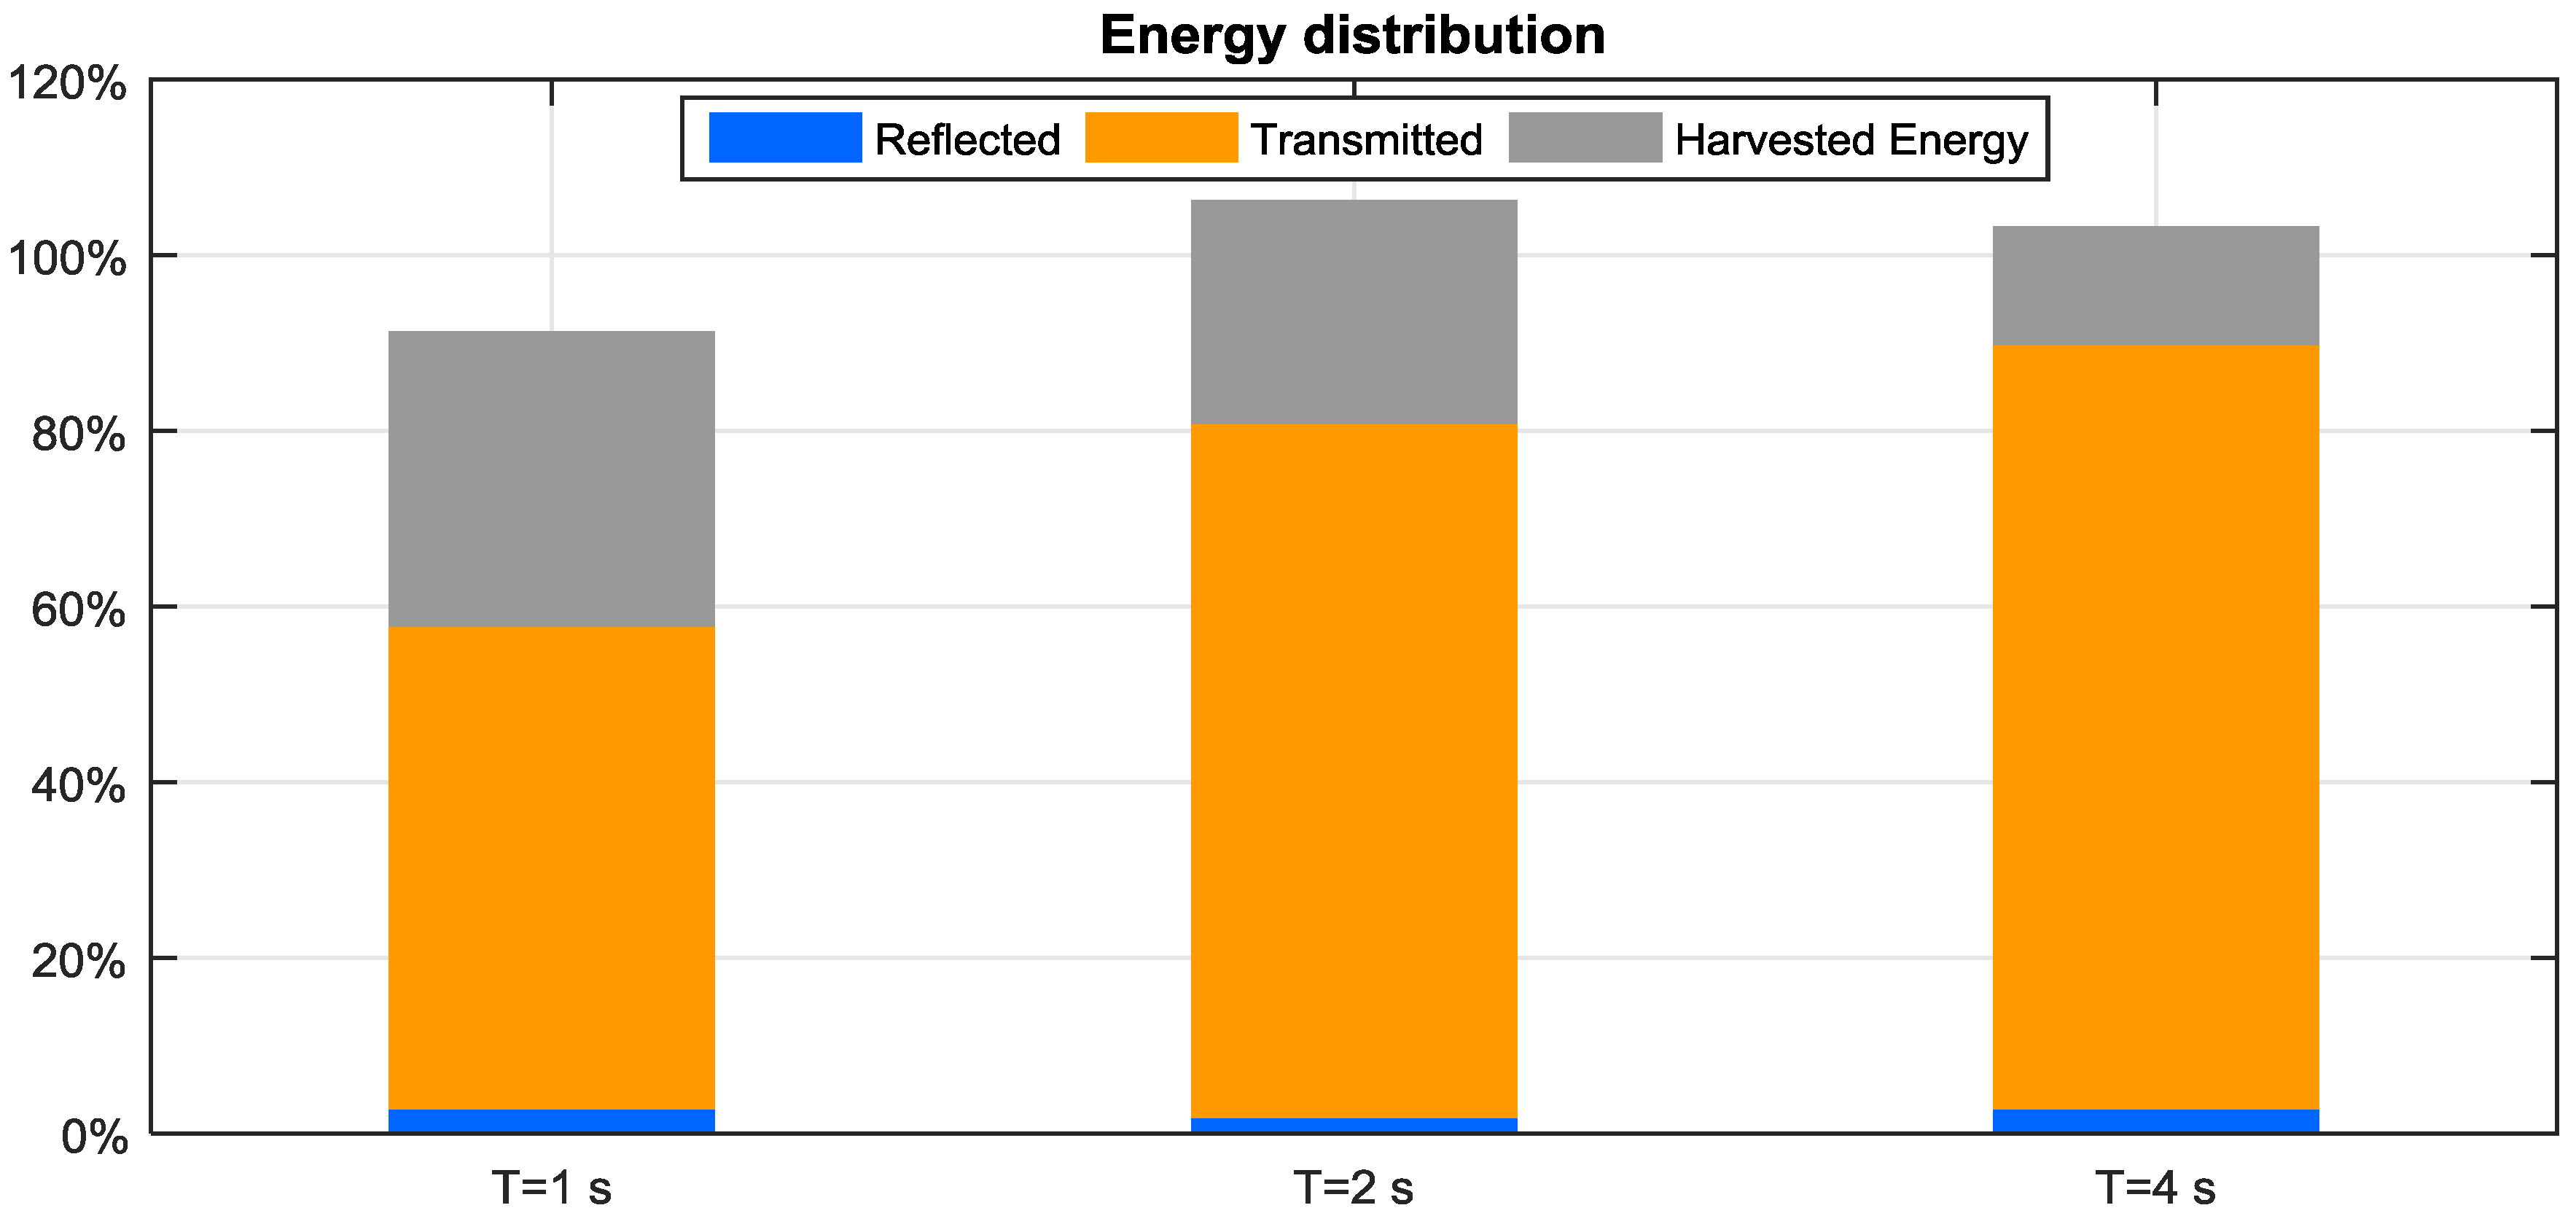
4.4. Energy Balance
The obtained results (
kR,
kT and
η) are checked by means of an energy balance condition. Energy flux conservation requires that, once the stationary conditions are reached, the incident energy flux is given by the sum of reflected, transmitted, dissipated and converted ones. For horizontal bed, the energy flows with constant group celerity, and since the channel width is also constant, the equation can be written as balance of energies:
The wave energy is proportional to the square of the wave height. If such proportionality factor is ρg/8, Equation (2) becomes:
Let’s define the efficiency
η as the ratio between converted and incident wave energy, and
ε as the sum of the measurement errors and the ratio between the energy dissipated by the device movements and the incident wave energy. Dividing all terms in Equation (3) by the incident wave energy we find:
Figure 12 shows this balance, accounting for the first 3 terms in the RHS of Equation (4). It shows how the incident energy is distributed into reflected, transmitted and harvested energy, among the different tested wave periods.
The sum of the three terms is expected to be always lower than 1 (i.e., 100%), since the dissipations in water are usually not small (in absence of moment errors, ε > 0). However, even assuming ε = 0, for T > 2 s, the sum is larger than 100%, and this can only be ascribed to measurement errors. However, the error is not significant (slightly above 5%) and the measured quantities may be considered sufficiently accurate.
5. Conclusions
The dynamics and the efficiency of a new WEC named EP4 were tested in the wave flume of Padova University. Tests were performed in scale 1:10 with respect to a possible application in front of a low-lying sandy coast, at 4 m water depths, where the installation could benefit by its double purpose of harvesting the wave energy and protecting the shore.
The EP4 efficiency was obtained with a novel control system characterized by a PTO load delayed with respect to the device movements.
The device appears to resonate at a very high period (19 s at prototype scale), and it is suggested that the design is modified to reduce the added mass associated to its movements, so that the natural periods are close to the main wave periods, to utilize the motion resonance effect and therefore to achieve even better performance under short waves.
The peculiar PTO used to restrain the device motion resulted very efficient and easy to build. The resistive force, simulating the generator, was designed to be zero when the flap changes direction, in order to allow the WEC to gain some kinetic energy. Rotations were accurately measured by a HD video camera, and automatically post-processed to obtain the rotational amplitude in time. Incident and reflected waves were measured by an array of 4 wave gauges, and transmission by a 5th gauge.
The device efficiency was found to be 35% for periods of 1 s (3 s at full scale) and a little less for longer periods, characterized by a higher energy content. Since only a single value of PTO delay was tested, an optimized control strategy may lead to larger efficiency also for long waves.
Irregular wave conditions, naturally associated with a lower performance, will probably be tested through additional experiments. In this case, the PTO will be equipped with a flywheel to smooth the irregularities of the wave field. To force the rotation of the shaft along the same direction, a gear and clutch system can be used: during the motion inversion, before the flywheel is engaged, the application of the resistive load would be delayed in similitude to the tested conditions.
The performance in terms of coastal protection followed the expectations: The measured wave transmission coefficient was respectively 75% and 90% for waves with period of 1 and 2 s (3 to 6 s at full scale).
Author Contributions
Conceptualization, L.M., M.V., P.R., C.F.; Methodology, L.M., M.V., P.R., C.F.; Investigation, L.M., M.V., P.R., C.F.; Writing and Editing, L.M., M.V., P.R., C.F.; Supervision, L.M., M.V., P.R., C.F.
Funding
This research received no external funding.
Acknowledgments
We thank Dario Bernardi, inventor of the EP4, for sharing the information on his device. This paper is a deep revision of the note presented at SDEWES 2018 Conference, code SDEWES2018.00422, with title “EXPERIMENTAL INVESTIGATION ON THE DYNAMICS OF A FLOATING WEC WITH PTO PHASE CONTR” and selected for resubmission at Energies.
Conflicts of Interest
The authors declare no conflict of interest.
References
- Barstow, S.; Mørk, G.; Lønseth, L.; Mathisen, J.P. WorldWaves wave energy resource assessments from the deep ocean to the coast. J. Energy Power Eng. 2011, 5, 730–742. [Google Scholar]
- Magagna, D.; Monfardini, R.; Uihlein, A. JRC Ocean Energy Status Report 2016 Edition; Technology, Market and Economic Aspects of Ocean Energy in Europe; Publications Office of the European Union: Luxembourg, 2016. [Google Scholar]
- Vicinanza, D.; Cappietti, L.; Ferrante, V.; Contestabile, P. Estimation of the wave energy in the Italian offshore. J. Coast. Res. 2011, 64, 613–617. [Google Scholar]
- Martinelli, L.; Pezzutto, P.; Ruol, P. Experimentally based model to size the geometry of a new OWC device, with reference to the Mediterranean Sea wave environment. Energies 2013, 6, 4696–4720. [Google Scholar] [CrossRef]
- Boccotti, P. Comparison between a U-OWC and a conventional OWC. Ocean Eng. 2007, 34, 799–805. [Google Scholar] [CrossRef]
- Parmeggiani, S.; Kofoed, J.P.; Friis-Madsen, E. Experimental study related to the mooring design for the 1.5 MW Wave Dragon WEC demonstrator at DanWEC. Energies 2013, 6, 1863–1886. [Google Scholar] [CrossRef]
- Castro-Santos, L.; Silva, D.; Bento, A.; Salvação, N.; Guedes Soares, C. Economic Feasibility of Wave Energy Farms in Portugal. Energies 2018, 11, 3149. [Google Scholar] [CrossRef]
- Liberti, L.; Carillo, A.; Sannino, G. Wave energy resource assessment in the Mediterranean, the Italian perspective. Renew. Energy 2013, 50, 938–949. [Google Scholar] [CrossRef]
- Arena, F.; Barbaro, G. The Natural Ocean Engineering Laboratory, NOEL, in Reggio Calabria, Italy: A Commentary and Announcement. J. Coast. Res. 2013, 29, vii–x. [Google Scholar] [CrossRef]
- Bracco, G.; Cagninei, A.; Giorcelli, E.; Mattiazzo, G.; Poggi, D.; Raffero, M. Experimental validation of the ISWEC wave to PTO model. Ocean Eng. 2016, 120, 40–51. [Google Scholar] [CrossRef]
- Contestabile, P.; Di Lauro, E.; Buccino, M.; Vicinanza, D. Economic assessment of Overtopping BReakwater for Energy Conversion (OBREC): A case study in Western Australia. Sustainability 2016, 9, 51. [Google Scholar] [CrossRef]
- Martinelli, L.; Ruol, P.; Favaretto, C. Hybrid structure combining a wave energy converter and a floating breakwater. In Proceedings of the 26th International Ocean and Polar Engineering Conference, Rhodes, Greece, 26 June–2 July 2016; International Society of Offshore and Polar Engineers: Houston, TX, USA, 2016. [Google Scholar]
- Franzitta, V.; Catrini, P.; Curto, D. Wave energy assessment along Sicilian coastline, based on DEIM point absorber. Energies 2017, 10, 376. [Google Scholar] [CrossRef]
- Negri, M.; Malavasi, S. Wave Energy Harnessing in Shallow Water through Oscillating Bodies. Energies 2018, 11, 2730. [Google Scholar] [CrossRef]
- Mendoza, E.; Silva, R.; Zanuttigh, B.; Angelelli, E.; Andersen, T.L.; Martinelli, L.; Nørgaard, J.; Ruol, P. Beach response to wave energy converter farms acting as coastal defence. Coast. Eng. 2014, 87, 97–111. [Google Scholar] [CrossRef]
- Pecher, A.; Kofoed, J.; Espedal, J.; Hagberg, S. Results of an experimental study of the Langlee wave energy converter. In Proceedings of the Twentieth International Offshore and Polar Engineering Conference, Beijing, China, 20–25 June 2010; Volume 1, pp. 877–885. [Google Scholar]
- Falnes, J. Principles for Capture of Energy from Ocean Waves. Phase Control and Optimum Oscillation; Department of Physics, NTNU: Trondheim, Norway, 1997. [Google Scholar]
- Falnes, J. Optimum control of oscillation of wave-energy converters. Int. J. Offshore Polar Eng. 2002, 12, 147–155. [Google Scholar]
- Beatty, S.; Ferri, F.; Bocking, B.; Kofoed, J.P.; Buckham, B. Power take-off simulation for scale model testing of wave energy converters. Energies 2017, 10, 973. [Google Scholar] [CrossRef]
- Flocard, F.; Finnigan, T.D. Experimental investigation of power capture from pitching point absorbers. In Proceedings of the Eight European Wave and Tidal Energy Conference, Upsala, Sweden, 7–10 September 2009. [Google Scholar]
- Peretta, S.; Ruol, P.; Martinelli, L.; Tetu, A.; Kofoed, J.P. Effect of a negative stiffness mechanism on the performance of the Weptos rotors. In Proceedings of the VI International Conference on Computational Methods in Marine Engineering (MARINE 2015), Rome, Italy, 15–17 June 2015; pp. 58–72. [Google Scholar]
- Têtu, A.; Ferri, F.; Kramer, M.; Todalshaug, J. Physical and Mathematical Modeling of a Wave Energy Converter Equipped with a Negative Spring Mechanism for Phase Control. Energies 2018, 11, 2362. [Google Scholar] [CrossRef]
- Martinelli, L.; Zanuttigh, B.; Kofoed, J.P. Selection of design power of wave energy converters based on wave basin experiments. Renew. Energy 2011, 36, 3124–3132. [Google Scholar] [CrossRef]
- Martinelli, L.; Zanuttigh, B. Effects of Mooring Compliancy on the Mooring Forces, Power Production, and Dynamics of a Floating Wave Activated Body Energy Converter. Energies 2018, 11, 3535. [Google Scholar] [CrossRef]
- Zelt, J.A.; Skjelbreia, J. Estimating incident and reflected wave fields using an arbitrary number of wave gauges. In Proceedings of the 23rd International Conference on Coastal Engineering (ICCE), Venice, Italy, 4–9 October 1992; ASCE: Reston, VA, USA, 1992; Volume 1, pp. 777–789. [Google Scholar]
© 2019 by the authors. Licensee MDPI, Basel, Switzerland. This article is an open access article distributed under the terms and conditions of the Creative Commons Attribution (CC BY) license (http://creativecommons.org/licenses/by/4.0/).


