1. Introduction
One of the biggest challenges while designing automotive traction batteries is the durability of the battery system and its components [
1,
2]. The lifespan of the lithium-ion cell is expressed in terms of a charge cycle. According to William et al. [
3], the end life of a battery in electric vehicle (EV) applications can be defined as when the battery capacity reduces to 80% of its initial capacity. Previous studies have shown that the lifespan of batteries is between 5–15 years [
4,
5,
6,
7,
8,
9,
10]. The life of the battery depends on the cell material, operating conditions, and environmental conditions. The battery system is exposed to fluctuating environmental conditions [
11] in vehicle applications. To ensure the safe operation of lithium-ion cells, and to prolong their lifespan, hybrid and electric vehicle battery systems are equipped with cooling systems. Using a liquid or an evaporative cooling system can result in the condensation of water inside the battery system. Condensation occurs if the temperature of the cooling plate is below the dew point. It can damage the electrical components, cause corrosion inside the system, reduce the insulation resistance, as well as it may accelerate the aging of the cells [
12]. These effects will shorten the life of the battery system, especially of electrical devices and metallic parts [
12].
If the surface temperature of a component is below the dew point, water will condense [
13,
14]. Pressure compensation elements (PCE) are usually integrated into the battery housing to compensate for the pressure difference between the interior and exterior of the battery system. The pressure differences are caused by fluctuation of temperature and pressure. During the operation in severe environmental conditions such as in Asia, there exists a risk that the ambient humidity enters through the PCE and increases the amount of vapor in the housing, leading to the higher possibility of system failure. Moreover, the risk of condensation is higher if liquid cooling is implemented in the battery system [
13].
To optimize the life span as well for the robust design of battery systems, knowledge of the amount of water condensation is crucial. The knowledge of the external factors (e.g., operational conditions, amount and design of PCEs, causes and influences of water condensation) can lead to the better design of longer lasting battery systems.
2. Materials and Methods
To simulate the environmental conditions and to identify if vapor in the housing of the battery condenses during the usage of the battery system, experiments were carried out using a physical simulated battery system (PSBS). This simulator covers the attributes of the battery system which affect the condensation phenomenon inside the housing. This PSBS mimics three battery system designs: (1) a sealed battery system, (2) an open system and (3) a battery system equipped with a pressure compensation element (PCE).
The most important environmental quantities that affect the condensation inside the battery housing and performance of the battery system are the air temperature, humidity, and ambient pressure. Therefore, the equipment installed within the simulator was set up to measure the internal air pressure, relative humidity, temperature, and ambient pressure. The battery housing was additionally monitored with the help of a dew sensor and a camera to determine when condensation appears. Using the recorded data, the absolute humidity of air within the housing was calculated (refer to Equation (1)). It was assumed that the amount of condensation was equivalent to the reduction of absolute humidity of air in the housing. The experiments were carried out with two test profiles: (a) normal operation and (b) abnormal operation. Normal operation means simulating the actual operation of the battery and cooling system. The abnormal operation is considered as the worst case scenario of the faulty battery system.
2.1. Design of the Physical Simulator
The PSBS was designed as a scaled model to mimic the thermal behavior of a real traction battery system of hybrid or electric vehicles. Instead of real lithium-ion cells, simulated cells were used to ensure safe operation. The PSBS mimics the following factors and parameters of battery systems:
Thermal simulation of lithium-ion pouch cells with a capacity of 20 Ah, similar to the cells of an EV;
Equivalent heat capacity and heat conductivity as real lithium-ion cells;
Active cooling with liquid coolant by means of a cold plate in the bottom of the housing;
Cells in direct contact with the cold plate;
Housing classified as waterproof with leak rate below 1 Pa∙dm
3/s (leak rate according to DIN EN1330-8 [
15]);
A free volume ratio of about 20%.
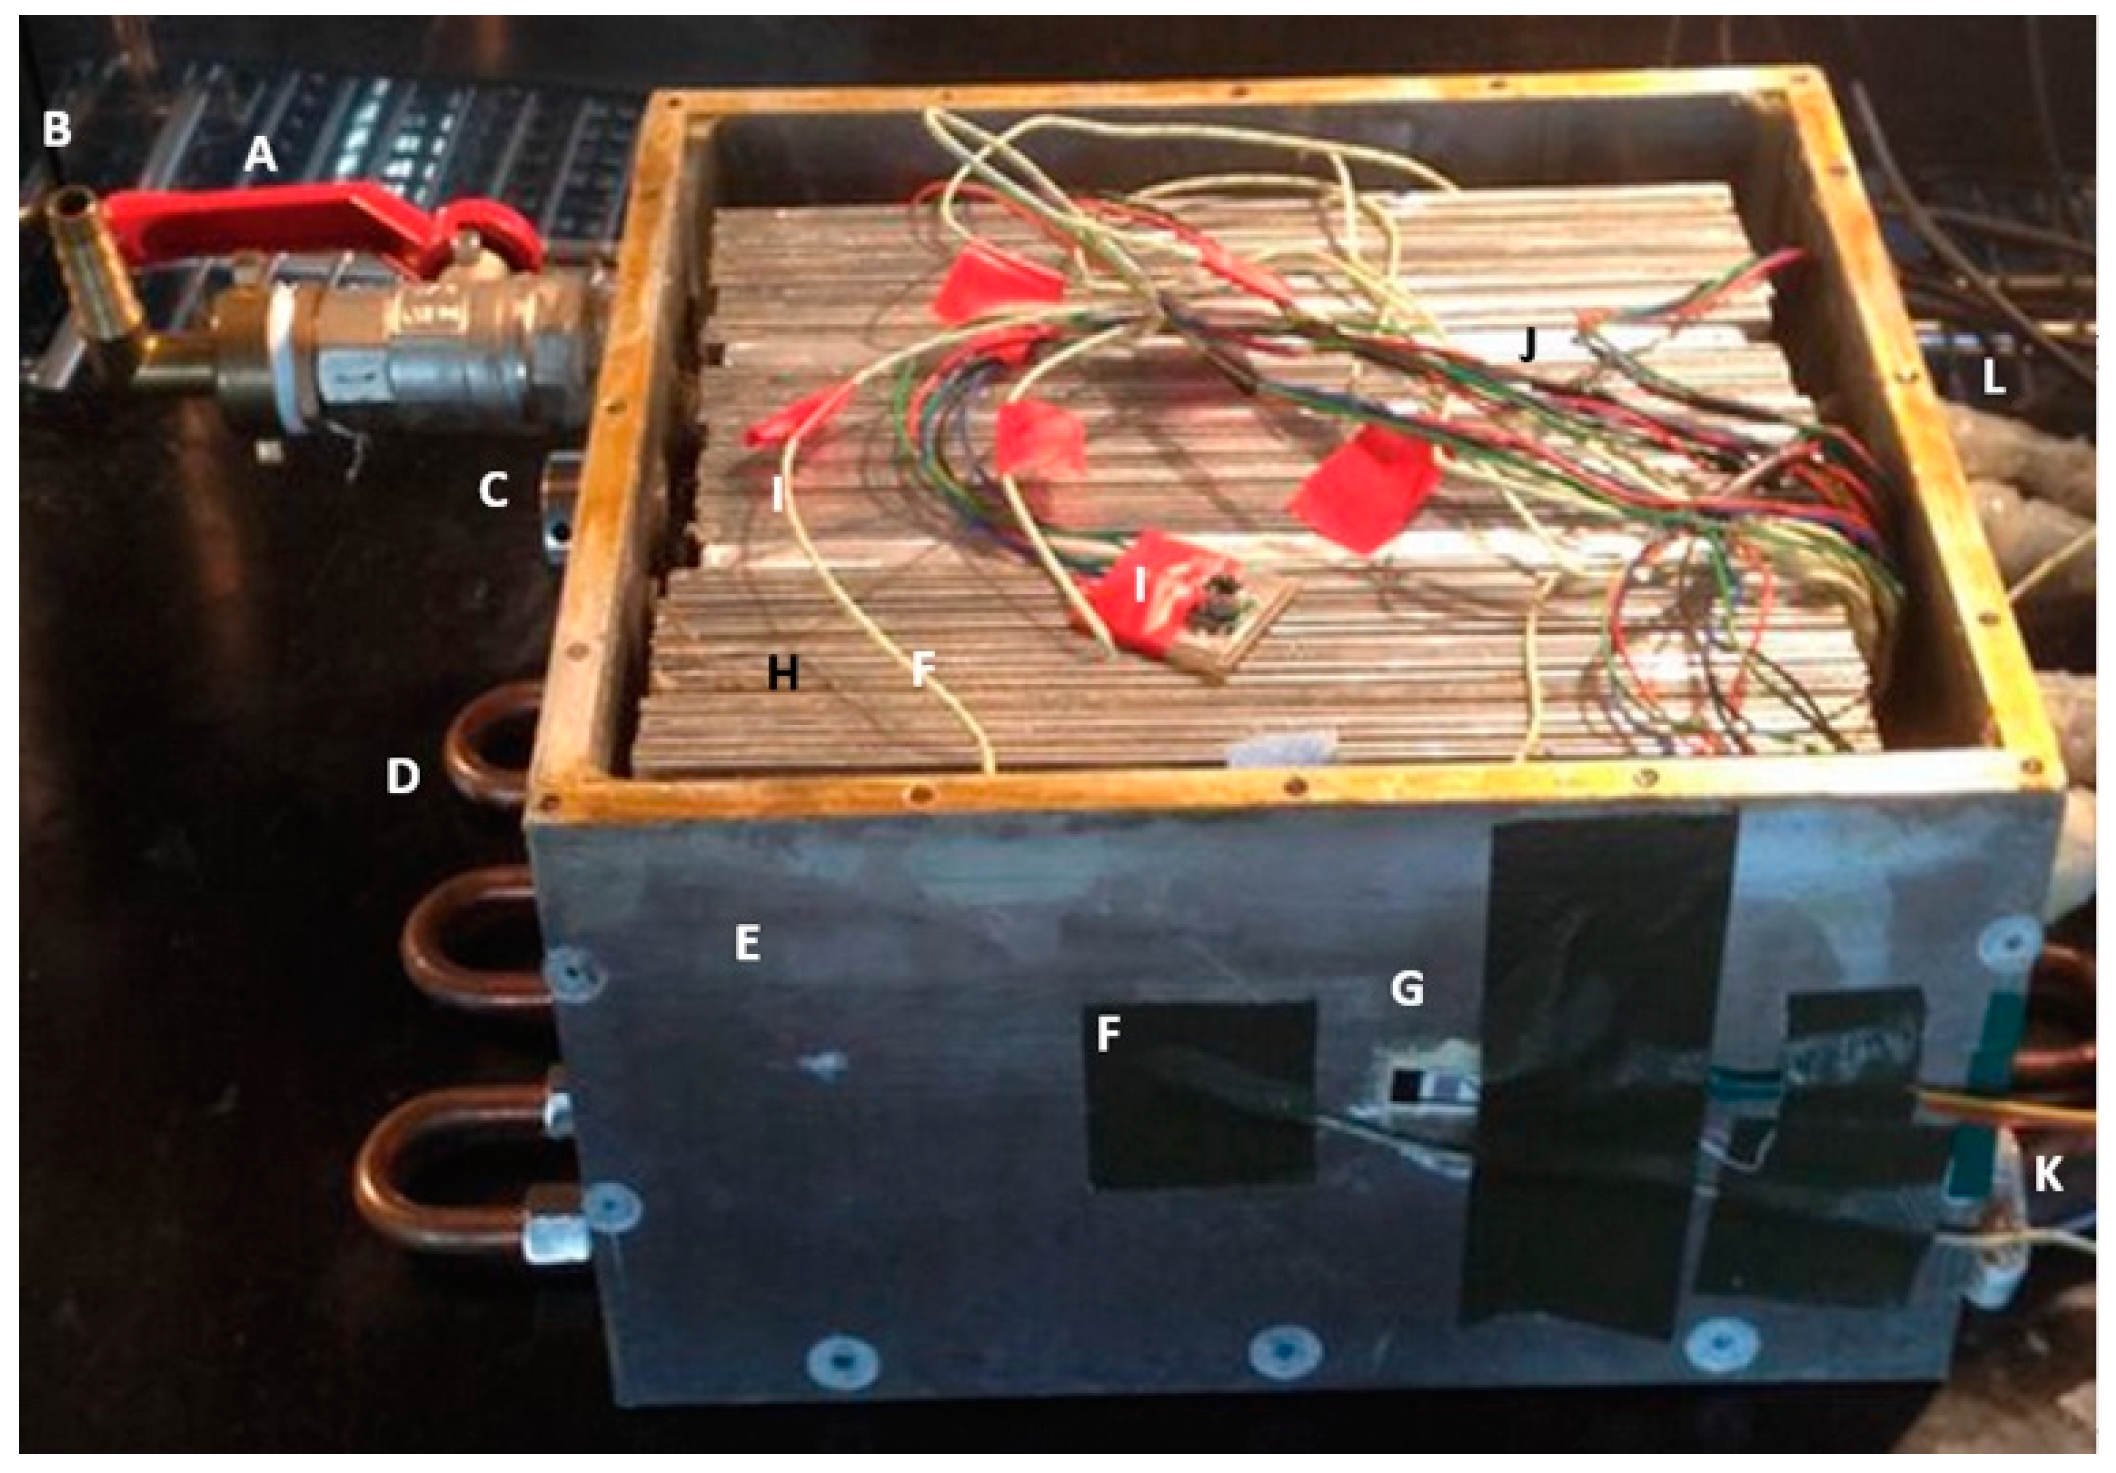
Housing: The housing of dimension of 236.0 mm × 216.0 mm × 166.0 mm (length × width × height) having an accuracy of ±0.5 mm was constructed out of four 8.0 mm aluminum 7020 (AlZn4.5Mg1) plates. The thickness of the aluminum plate was selected according to the insulation requirement of the housing and the availability of the material. To avoid bending caused by pressure changes, a thick stainless-steel plate (1.4301 type, 20.0 mm ± 0.5 mm) was used as a top plate. The 18.0 mm ± 0.5 mm thick base plate made up of stainless steel, manufactured by Austerlitz electronic GmbH (Nuremberg, Germany) had served as a cold plate. Six copper tubes of 10.5 mm ± 0.5 mm diameter were incorporated in the cold plate providing the path to the cooling liquid. The cooling liquid was prepared by using a mixture of water and 50 vol. % Glysantin G30 (BASF SE, Ludwigshafen, Germany). The temperature of the coolant was controlled by CC-405 refrigeration bath circulator (Peter Huber Kältemaschinenbau AG, Offenburg, Germany). According to the datasheet, the bath circulator was capable of controlling the temperature of the coolant in the range of −40–200 °C with temperature stability of 0.02 K at −10 °C [
16]. It had a heating capacity of 1.5 kW and a cooling capacity of 0.7 kW in the range of 0–100 °C [
16]. The simulated cells were placed on a cold plate for direct contact cooling to allow the efficient heat transfer between the cells and coolant. The top of the housing was enclosed by the stainless steel plate with a rubber seal and held fixed with four C-clamps.
The battery system designed with PCE, had the breather drain castellated locknut type M20 PCE (Klippon BDX by Weidmueller GmbH, Detmold, Germany) [
17] mounted on the right plate of the housing with the help of an O-ring seal. In the case of the sealed system, a bolt of diameter M20 was used instead of the PCE to close the housing. A ball valve was additionally attached to enable simulating an open system. On the open end of the valve, a nozzle with an inner diameter of 7 mm ± 0.5 mm, outside diameter 9 mm ± 0.5 mm and a length 107 mm ± 0.5 mm was attached. The complete experimental setup is represented in
Figure 1.
Cell mimic: Using mimicked cells provides a high degree of freedom in generating heat profiles without the need for safety precautions. In addition, there was no influence of any cell aging effects. The main goal of designing such cell mimic was to simulate the thermal behavior of a real lithium-ion cell.
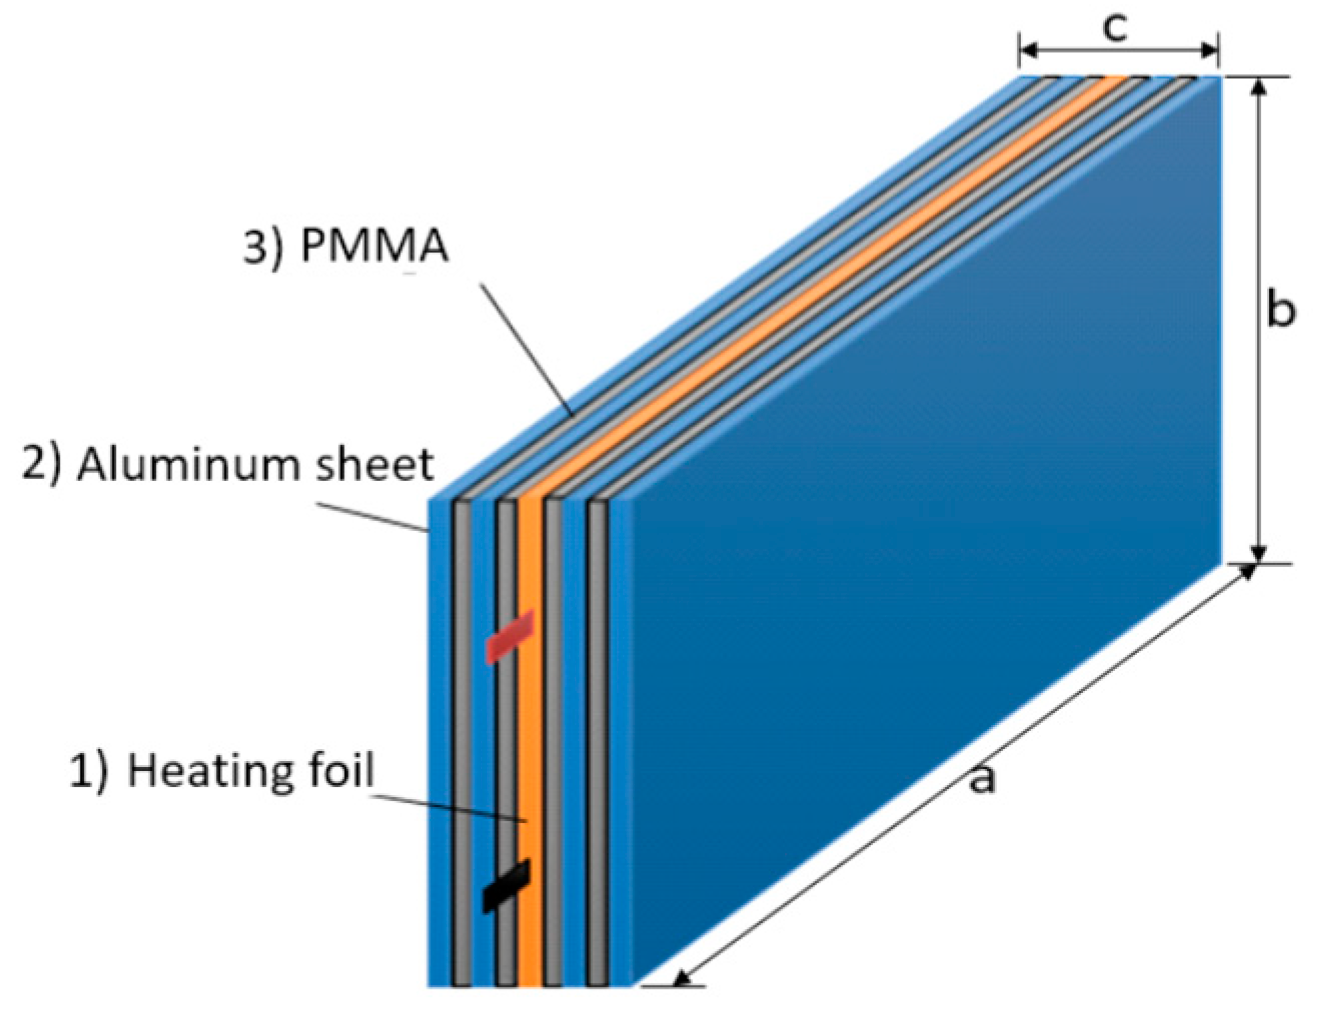
In real battery systems, heat is generated in all the cells. To avoid significant temperature gradients in the PSBS, which would affect the condensation of vapor on the surfaces, resistive heating foils were used to emulate power losses in all of the mimicked cells (see
Figure 2). This allows uniform, constant and reproducible heat generation without adhering to real thermal and voltage limits of a cell.
To simulate, a pouch or a prismatic cell design was selected as these types are widely used in hybrid and electric vehicle battery systems like A3 etron (AUDI AG, Ingolstadt, Germany) [
18], Volt 2016 (Chevrolet, Detroit, MI, USA) [
19], and Leaf (Nissan, Yokohama, Japan) [
20]. The specific heat capacity and heat generation should be equivalent to real lithium-ion cells. According to the literature [
21,
22,
23,
24], lithium-ion pouch cells have a specific heat capacity of about 1 kJ/(kg∙K). Hence, a composite was made by alternate stacking of four aluminum EN-AW 1050 (Al 99.5%) sheets with specific heat capacity 0.897 kJ/(kg∙K) [
25] and four polymethyl methacrylate 99532GT (Evonik Performance Materials GmbH, Darmstadt, Germany) sheets (PMMA sheets) with specific heat capacity 1.47 kJ/(kg∙K) [
26] and gluing them together with Pattex PCL6C (Henkel AG, Düsseldorf, Germany). Both aluminum and polymethyl methacrylate (PMMA) sheets were of the thickness of 1.00 mm ± 0.05 mm. In the middle of the stack, a heating film made by Thermo Technologies GmbH (Rohrbach, Germany) was embedded (
Figure 2). At a nominal voltage of 24 V, this film dissipates 20 W ± 2 W [
27]. With an overall weight of 311.2 g, this setup has a heat capacity of 0.334 kJ/K, if the heat capacity of the heating film and adhesive are neglected. The specific heat capacity of 1.07 kJ/(kg∙K) was achieved for the mimicked cells. The 17 simulated cells of dimension as per
Table 1 were connected in parallel in the battery system and were supplied with electric energy by the HCS3302 power supply (Manson Engineering Industrial Ltd., wai Chung, Hong Kong).
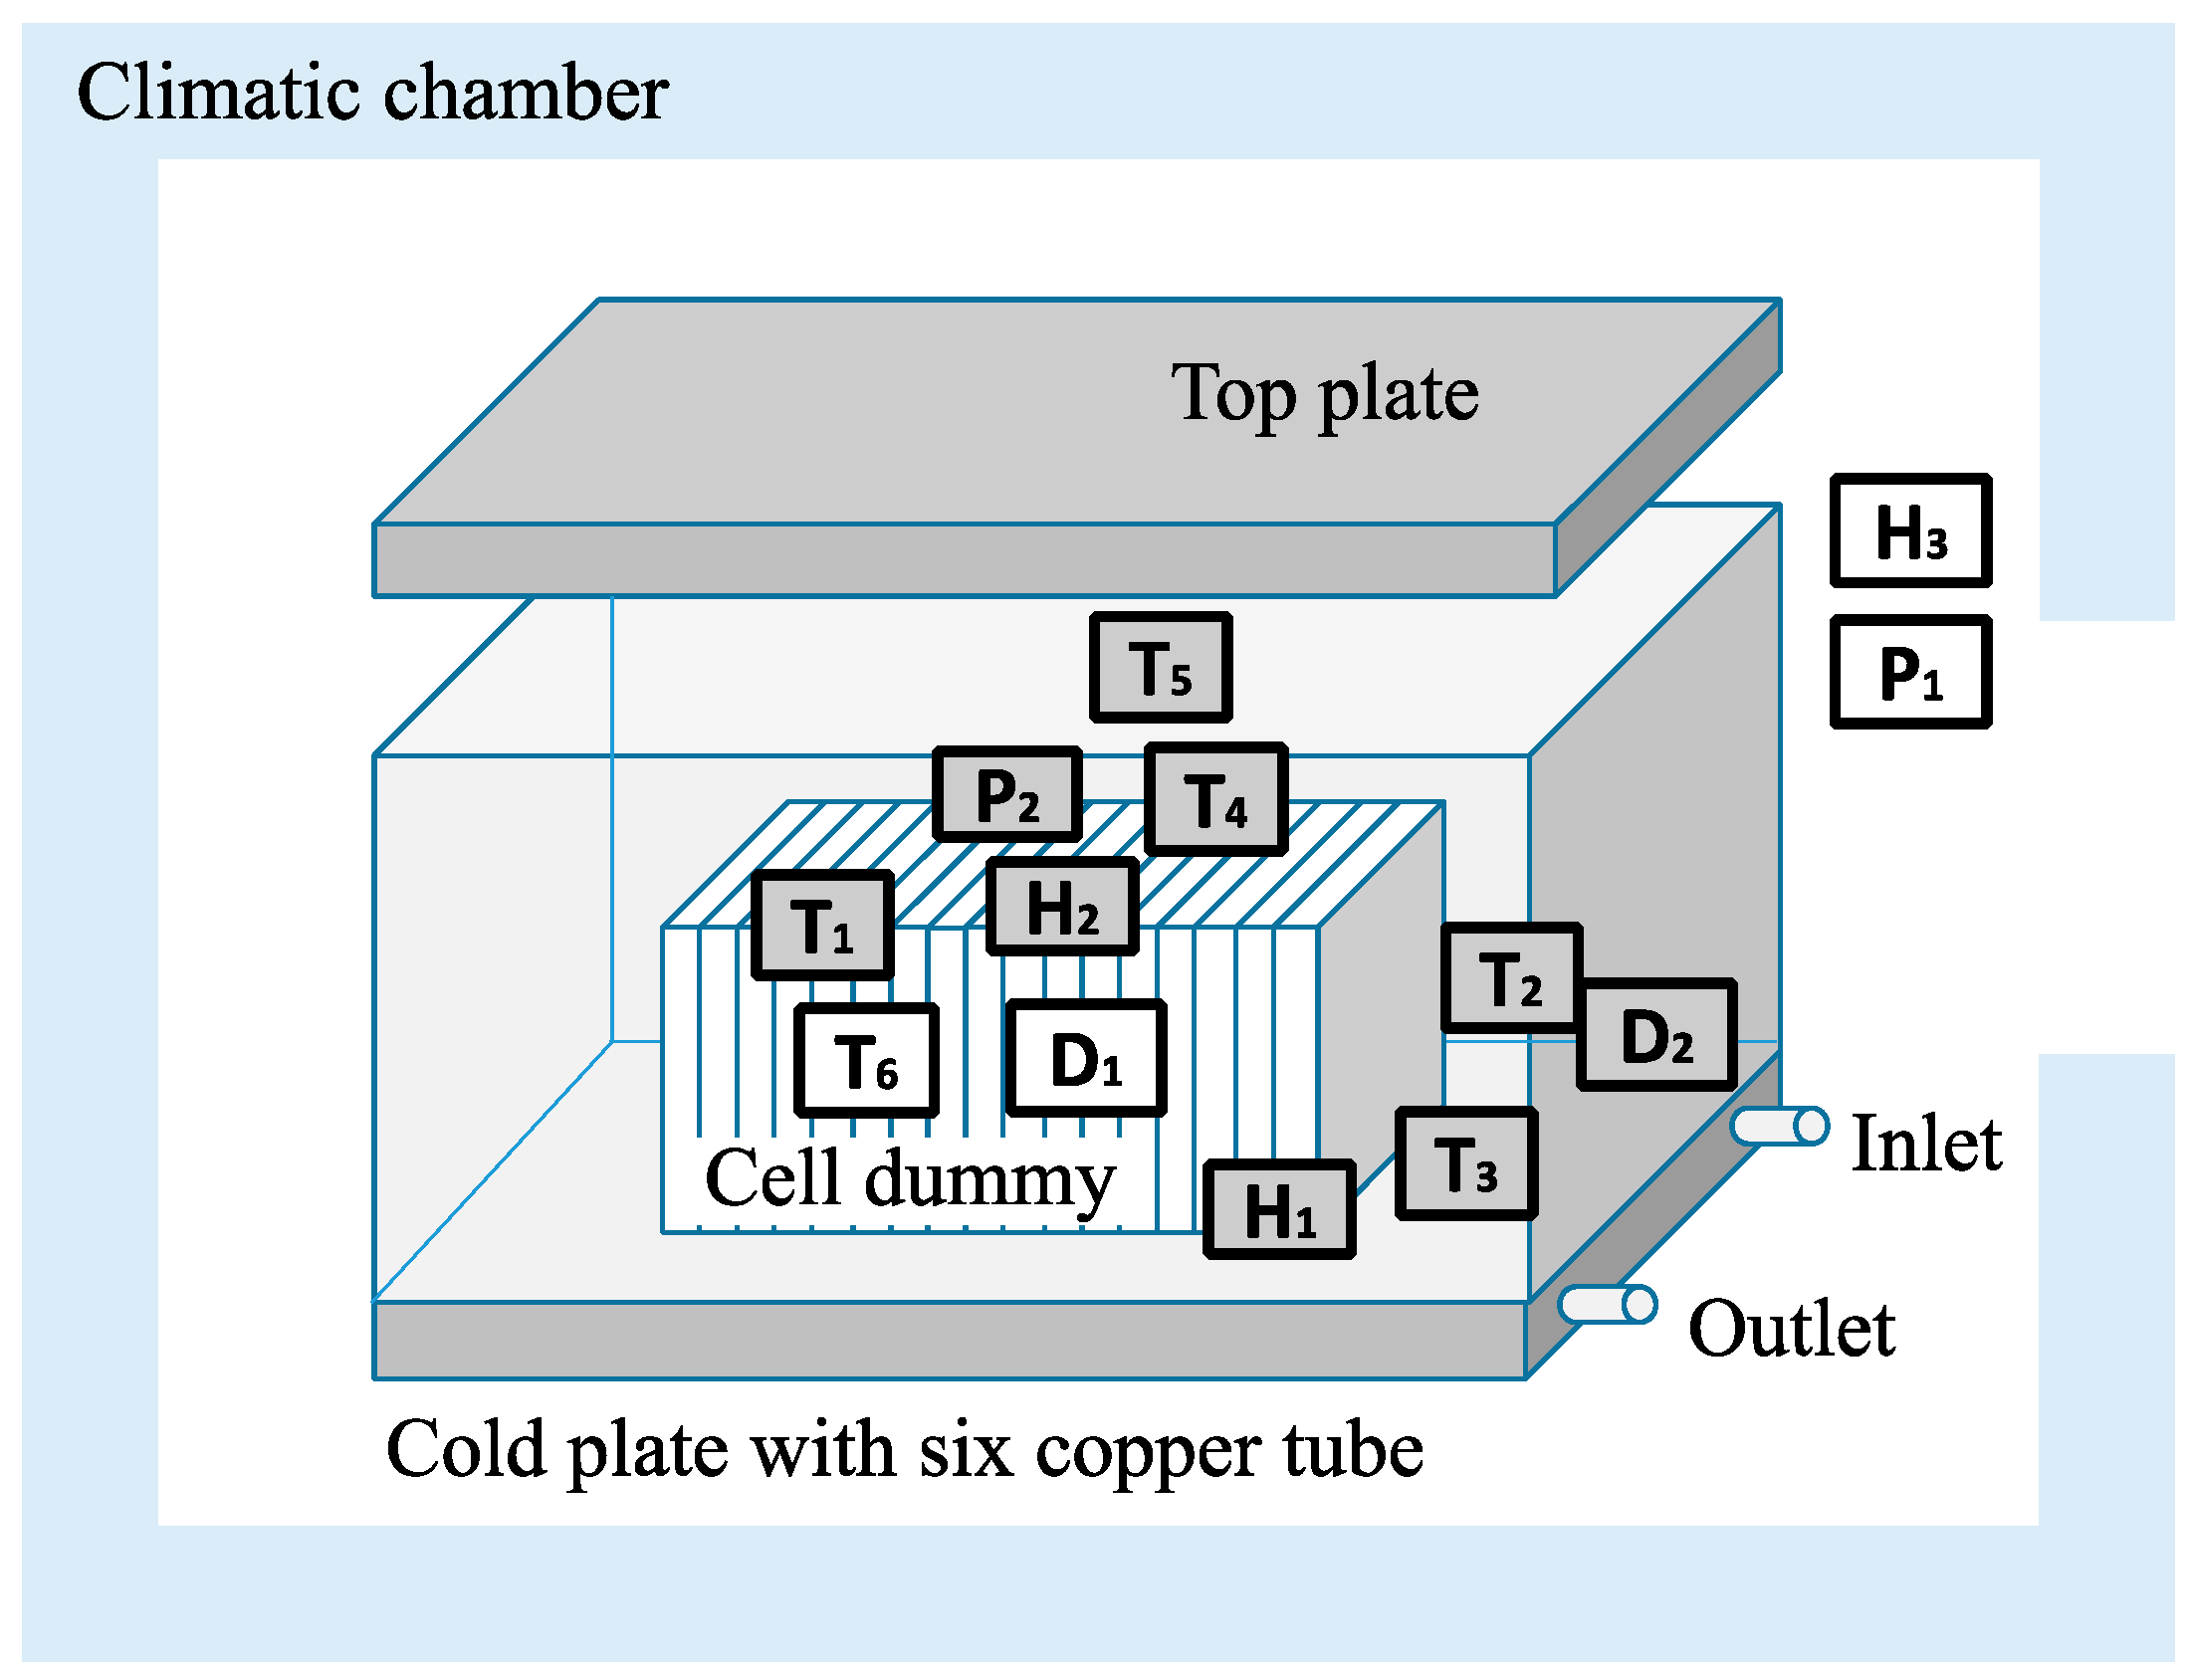
2.2. Experimental Setup
The experimental setup and the position of sensors are shown in
Figure 3 and
Figure 4. The PSBS was tested in the ATT TCC 4025 climatic chamber (made by Angelantoni Test Technologies Srl, Massa Martana, Italy). It has an operating temperature range of −40.0–180.0 °C with an accuracy of 0.3 °C. The relative humidity (RH) range of the climatic chamber is 10–98% with an accuracy of ±3% in the temperature range of 5–95 °C [
28].
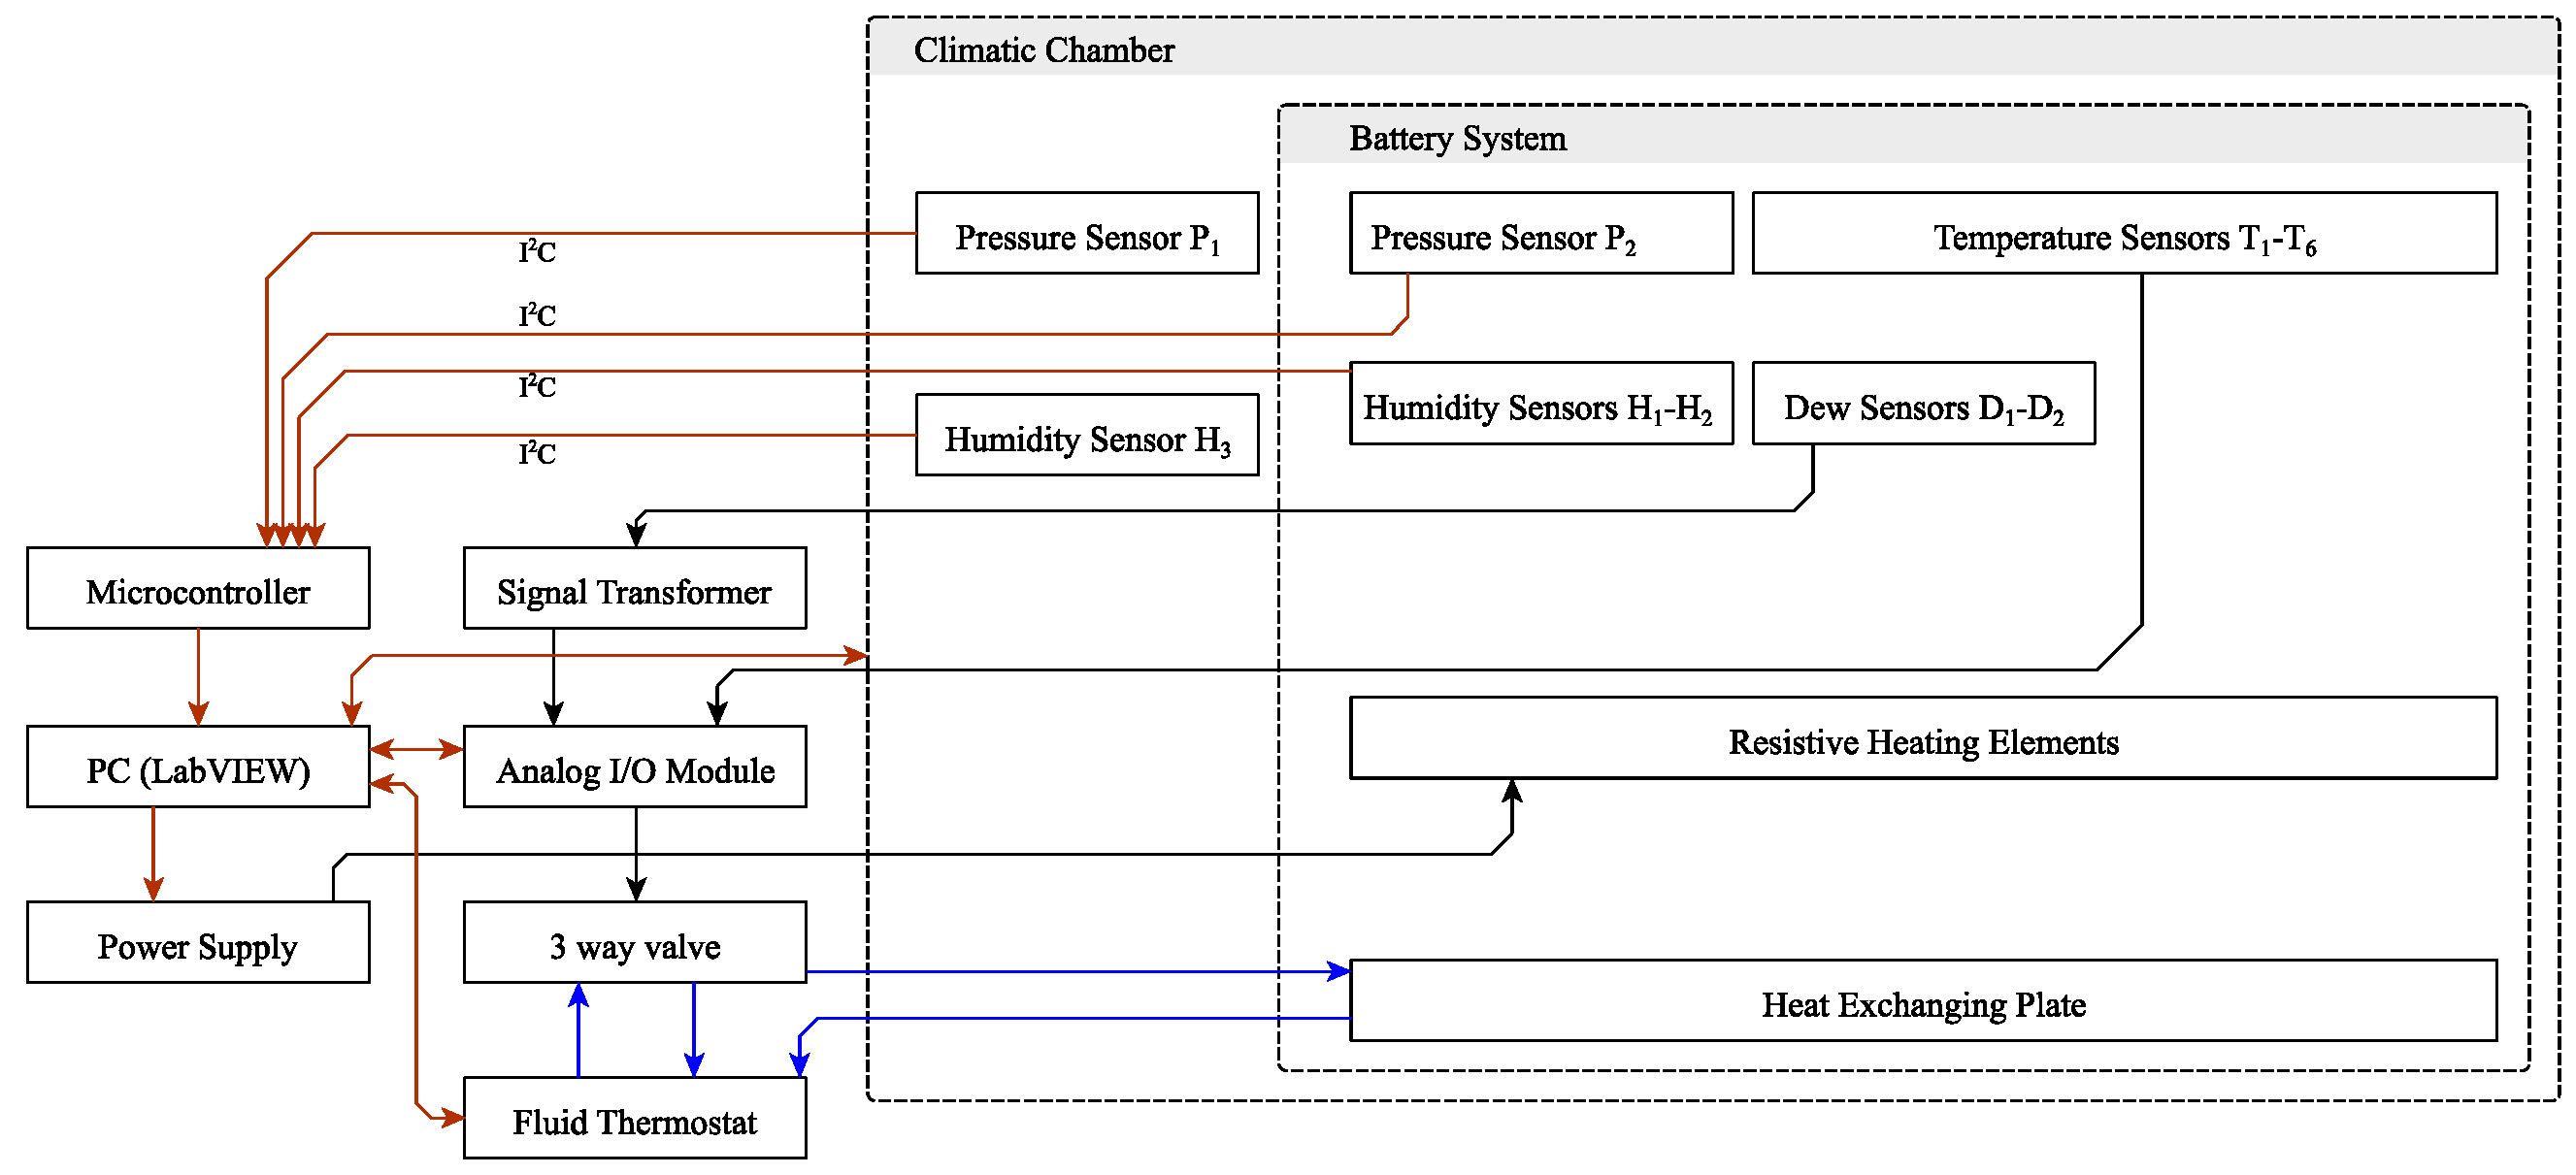
The following sensors were installed in the PSBS and the climatic chamber for measuring the data such as temperature, humidity, condensation and pressure (
Figure 3):
The USB-4718 module (Advantech Co., Ltd., Taipei, Taiwan) was used for the data acquisition and controlling a ball valve:
The valve, thermostat, sensors, and power supply to drive the heating films were controlled through a LabVIEW program. The connection between the sensors and equipment is shown below in
Figure 4. The program’s control cycle, as well as the measurement and data recording cycle, were synchronized to a 3.58 s time interval. The recording of values was based on the computer’s real-time clock, which was synchronized to international standards all the time. Thus, all time data and durations in the present research can, therefore, be interpreted as accurate to this interval.
2.3. Quantification of the Condensed Water
The quantity of the condensed water in the battery housing was determined by the change in absolute humidity of the air inside the housing. Absolute humidity (H) is the mass of water vapor present in a certain volume of air and is usually expressed as the grams of moisture/water vapor per cubic meter of air (g/m3). It was assumed that, with the sealed housing, the amount of water vapor inside the housing remains constant. If water vapor condenses, the absolute humidity of the air would be reduced, because a portion of the water vapor in the air condenses onto the surfaces and with the evaporation of the condensed water, the absolute humidity inside the housing increases.
The absolute humidity of the air is dependent upon the vapor pressure
(measured in hPa) and temperature θ (in °C) [
14,
32] and the pressure and temperature θ are interrelated. With the assumption of ideal gas behavior, H was calculated by Equation (1) [
33],
where C = 2.167 g
K/J [
33].
The vapor pressure
was calculated by Equation (2) using the measured relative humidity and the saturation vapor pressure
,
Saturation vapor pressure was determined using the empirical Magnus equation (Equation (3)) [
34],
where
The dew point
is the temperature at which the air is saturated with water vapor, and the partial vapor pressure is equal to the saturation vapor pressure. Cooling below the dew point temperature leads to the condensation of vapor to dew/water droplets. Vapor pressure at dew point temperature was calculated using Equations (4) and (5).
where B = ln (
) +
.
2.4. Test Profiles Used to Investigate Condensation in Harsh Environmental Conditions
2.4.1. Test Profile 1 (Normal Operation)
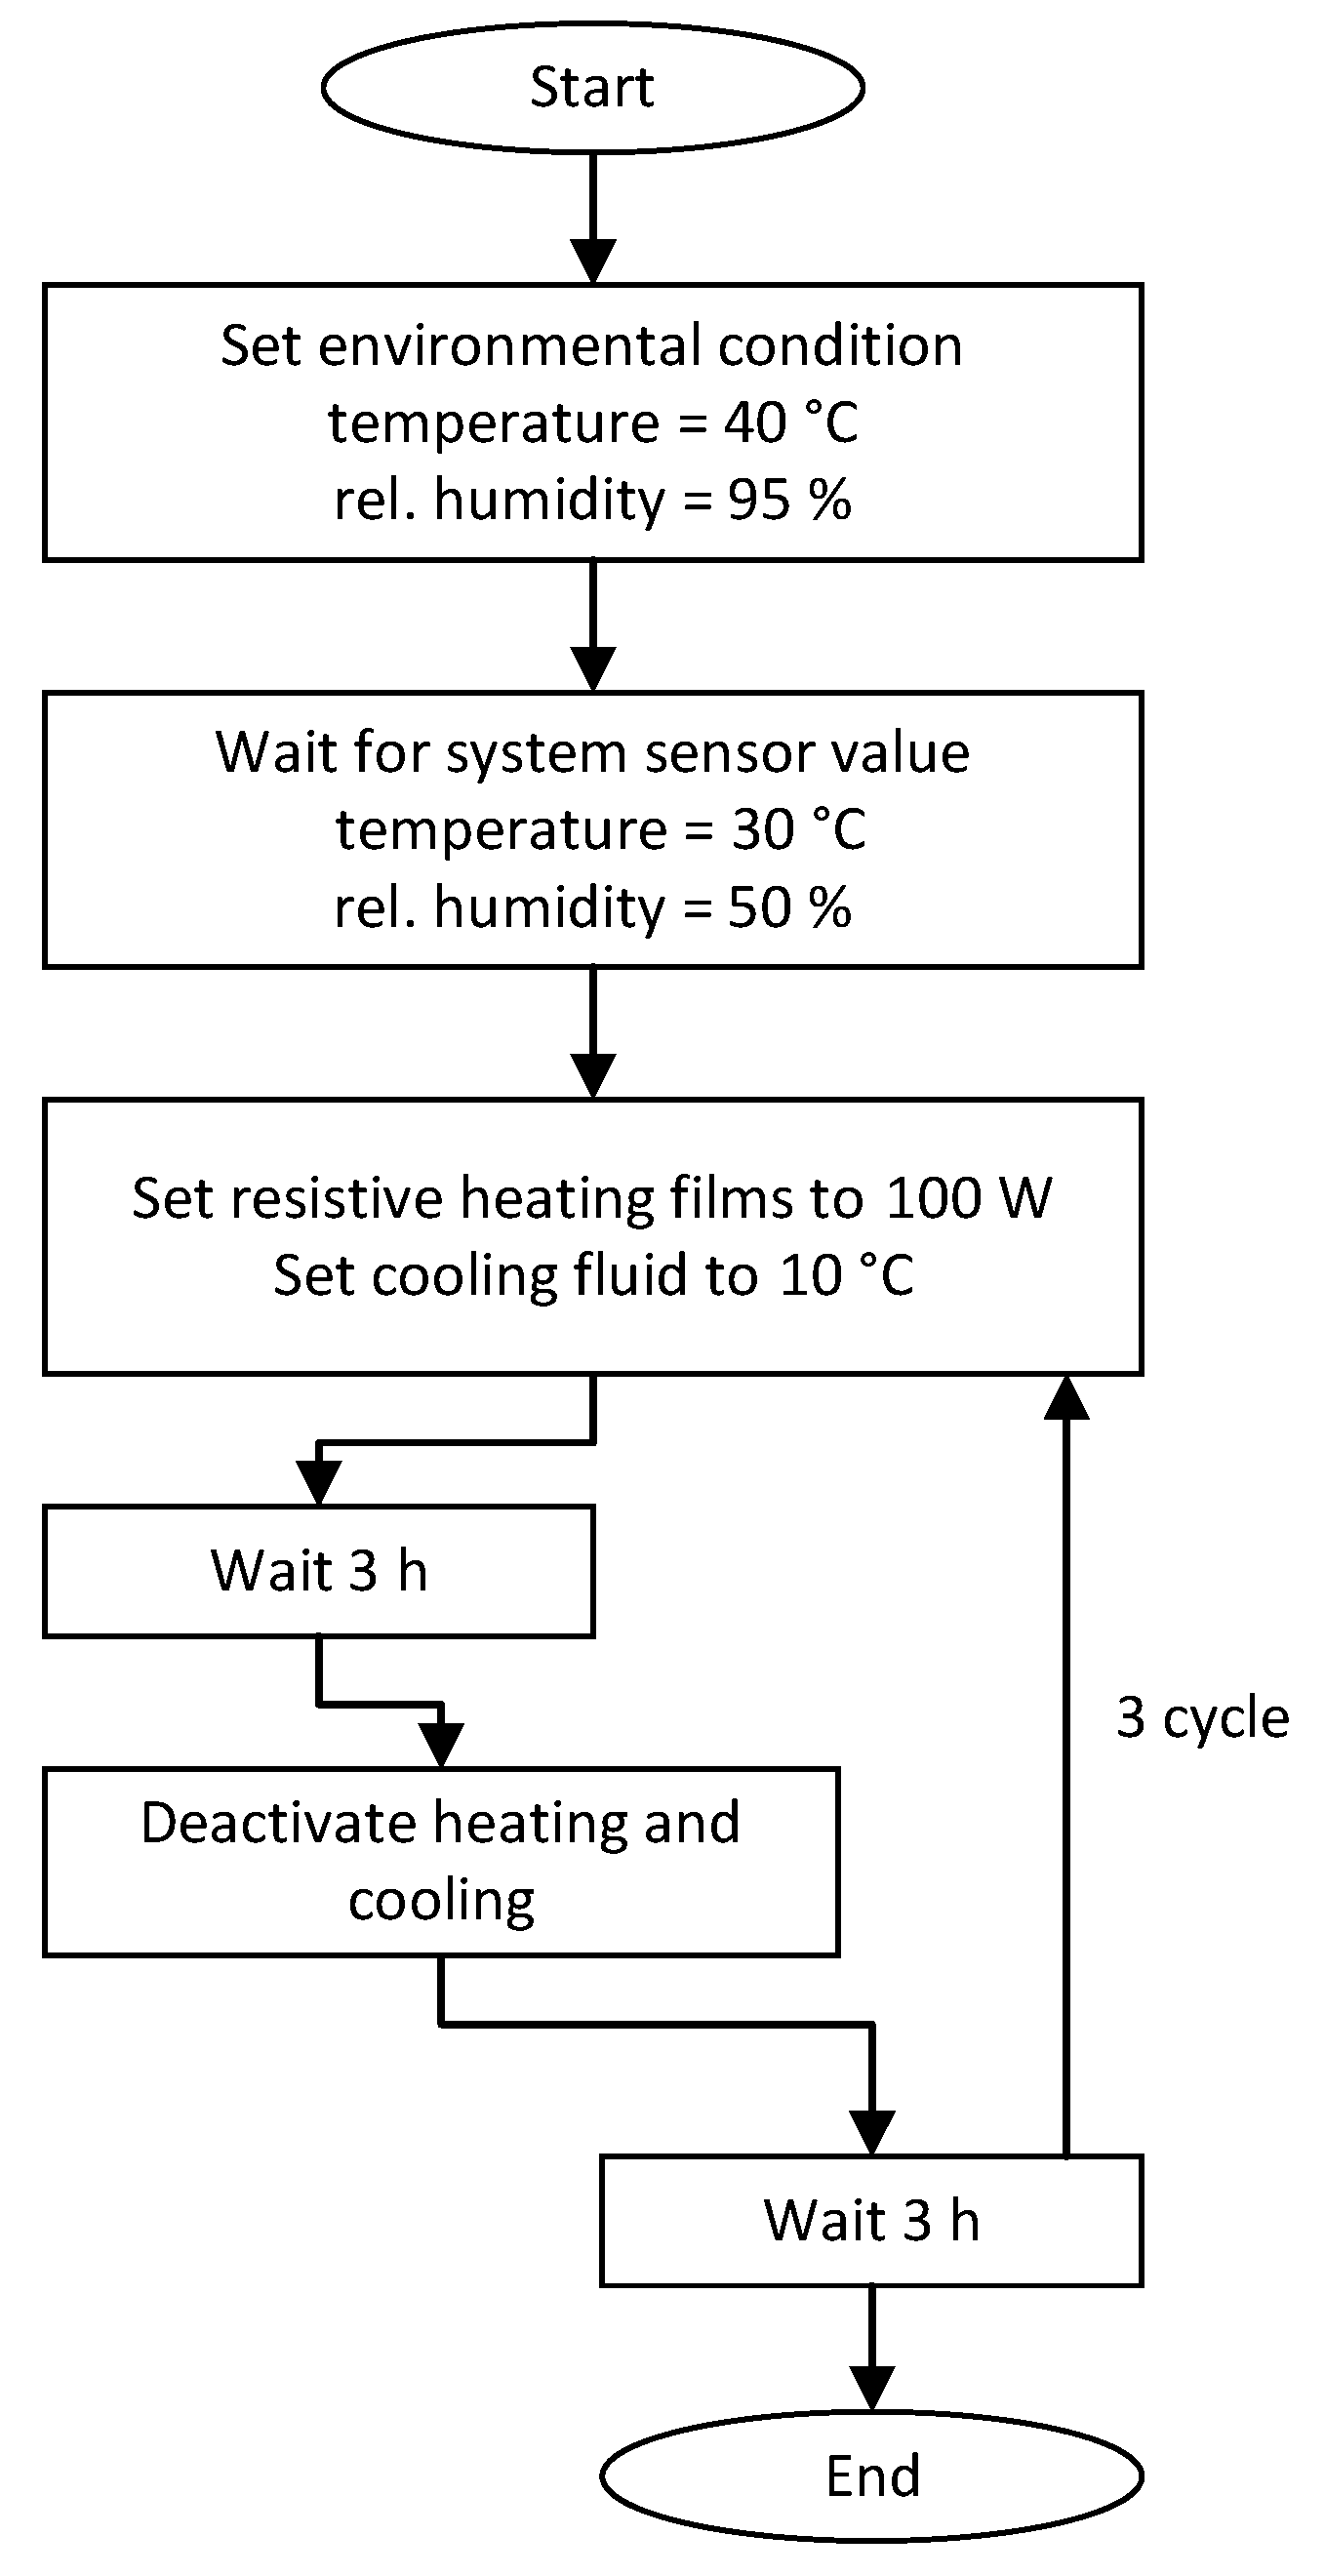
The test was performed to study the behavior of the battery system and to understand the process of condensation in the housing for the normal operation of the battery during field application. Battery operation and the cooling of the battery system was simulated for this experiment. An experiment replicated the actual normal operation of the battery and cooling of the battery system. The flow diagram of this experiment is shown in
Figure 5. Initially, the climatic chamber temperature and relative humidity were adjusted to 40 °C and 95% respectively, simulating hot and humid ambient conditions. In order to ensure the similar initial condition of the battery system for all the experiments, a temperature of 30 °C and relative humidity of 50% for the battery system was used as an initial condition. Once it was met, the heating films inside the simulated cells were switched on, radiating 100 W of heat (equivalent to a 3 C current), which is considered as a worst case in HEV/BEV (e.g., fast DC charging for 20 min for 500 V battery system). Simultaneously, the cooling system was pumping cooling liquid with 0.7 × 10
3 hPa pressure at a temperature of 10 °C with a rate of 25 dm
3/min through the battery. This was carried out for 3 h (h) followed by the 3 h rest period where the heating films and cooling system were turned off. After the rest phase, again heating and cooling of the battery system were turned on and the whole cycle was repeated three times resulting in a total experiment duration of 18 h.
2.4.2. Test Profile 2 (Abnormal Operation)
To investigate the condensation in harsh environmental conditions under an improperly working cooling system, an experiment was conducted simulating the following conditions: Phase (a) fully functional battery system without cooling (simulating a defective cooling system), followed by phase (b) where the cooling system was configured incorrectly and a temperature of the cooling fluid was set to −10 °C ± 0.02 °C. The profile was designed to reproduce the worst case scenario of a faulty battery cooling system. Phase (a) is an example of charging the battery without activating the cooling system. In phase (b), pre-tempered fluid at temperature −10.00 °C ± 0.02 °C was circulated through the cooling plate to reach the maximum cooling speed. This temperature was selected because it is possible that the battery system gets exposed to such lower temperature in daily life usage (e.g., during parking) and as per the United States Department of Energy the vehicle test at cold temperature shall be carried out at −7 °C [
35]. It was expected that the temperature drop would lead to a noticeable pressure change in the system and a large amount of condensation in the housing.
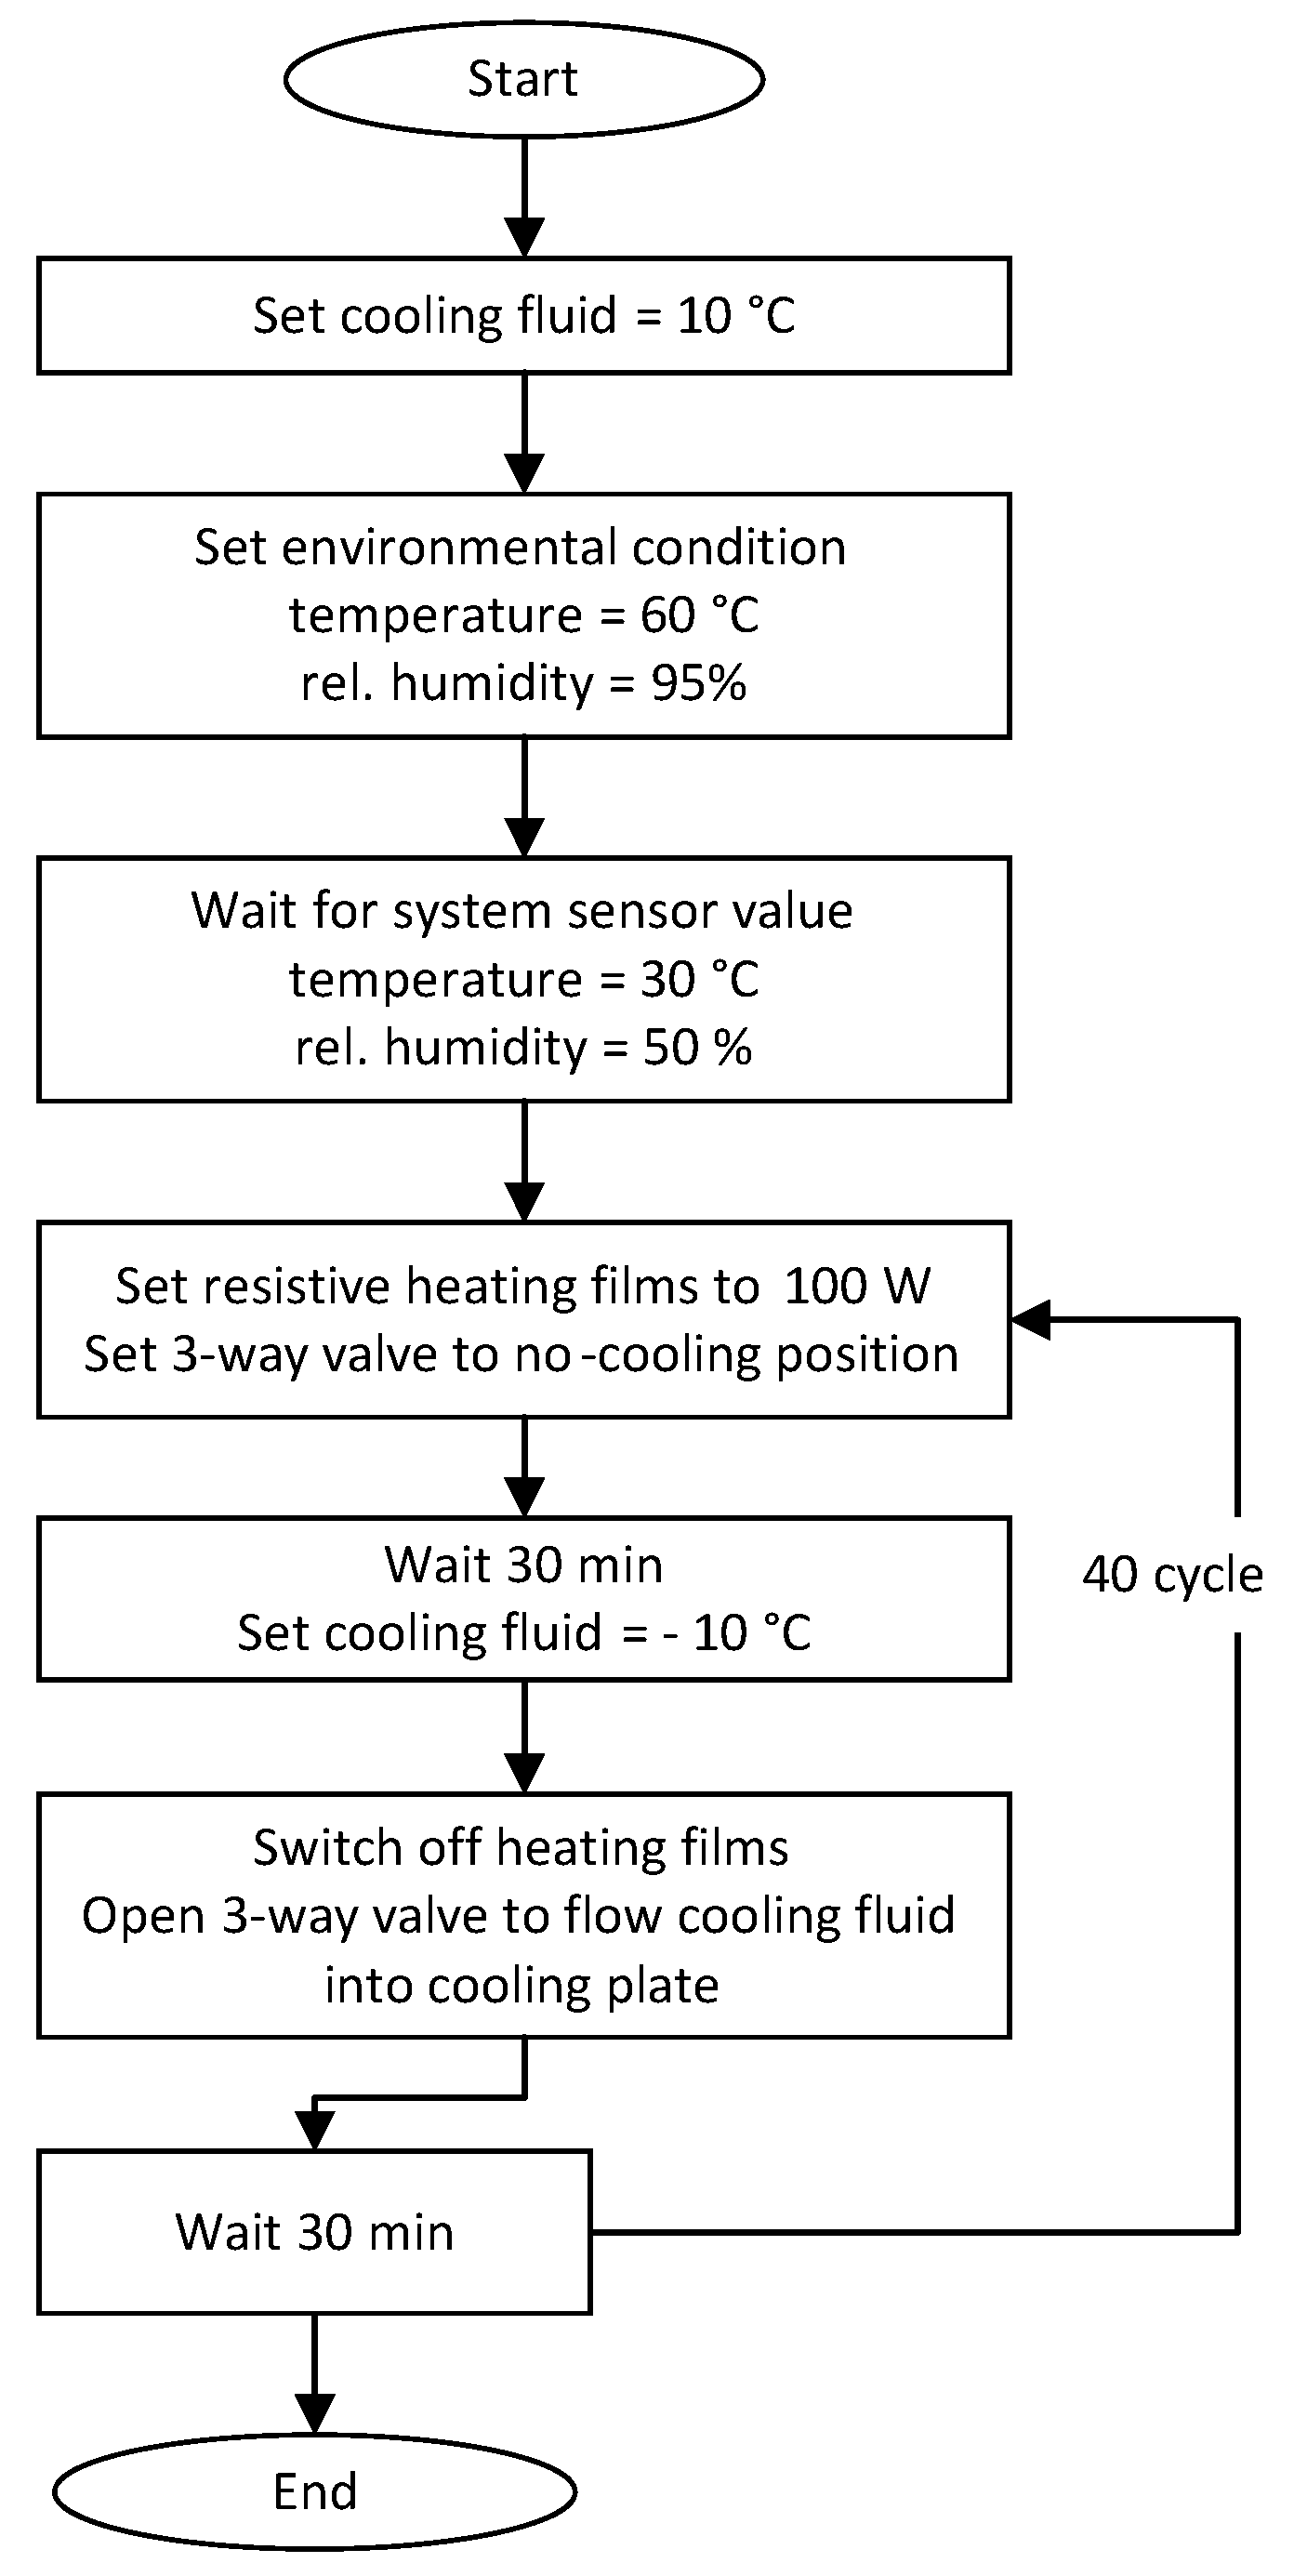
The experiment was conducted as shown in
Figure 6. For pre-conditioning of the climatic chamber, the temperature and the relative humidity were set to 60 °C and 95% respectively. When the temperature and relative humidity of the battery system reached 30 °C and 50%, the 3-way valve was closed to prevent the pre-tempered coolant from entering the cold plate. The maximum opening and closing time of the valve was 4 s. Then the heating films of the mimicked cells were switched on for 30 min radiating 100 W heat. Entering the phase (b), heating was turned off and the valve was opened to allow precooled fluid to flow through the cold plate for 30 min. Afterwards, the valve was closed and the mimicked cells were heated again. The entire test took 40 h with 40 cycles repetition.
3. Results
Both the test profiles, the normal operation, and abnormal operation were carried out with all three housing design variants to understand the process of condensation and its effect:
The parameters that were analyzed are:
Pressure inside the battery housing (Pin),
Pressure outside the battery housing—Climatic chamber pressure (Pout),
Absolute humidity on the cold plate at the input in the housing (H1),
Absolute humidity at the simulated cells (H2),
Condensation detected (C)/No condensation detected (N.C).
3.1. Design Variant 1: Sealed Battery System
3.1.1. Test Profile 1 (Normal Operation Profile with Sealed System)
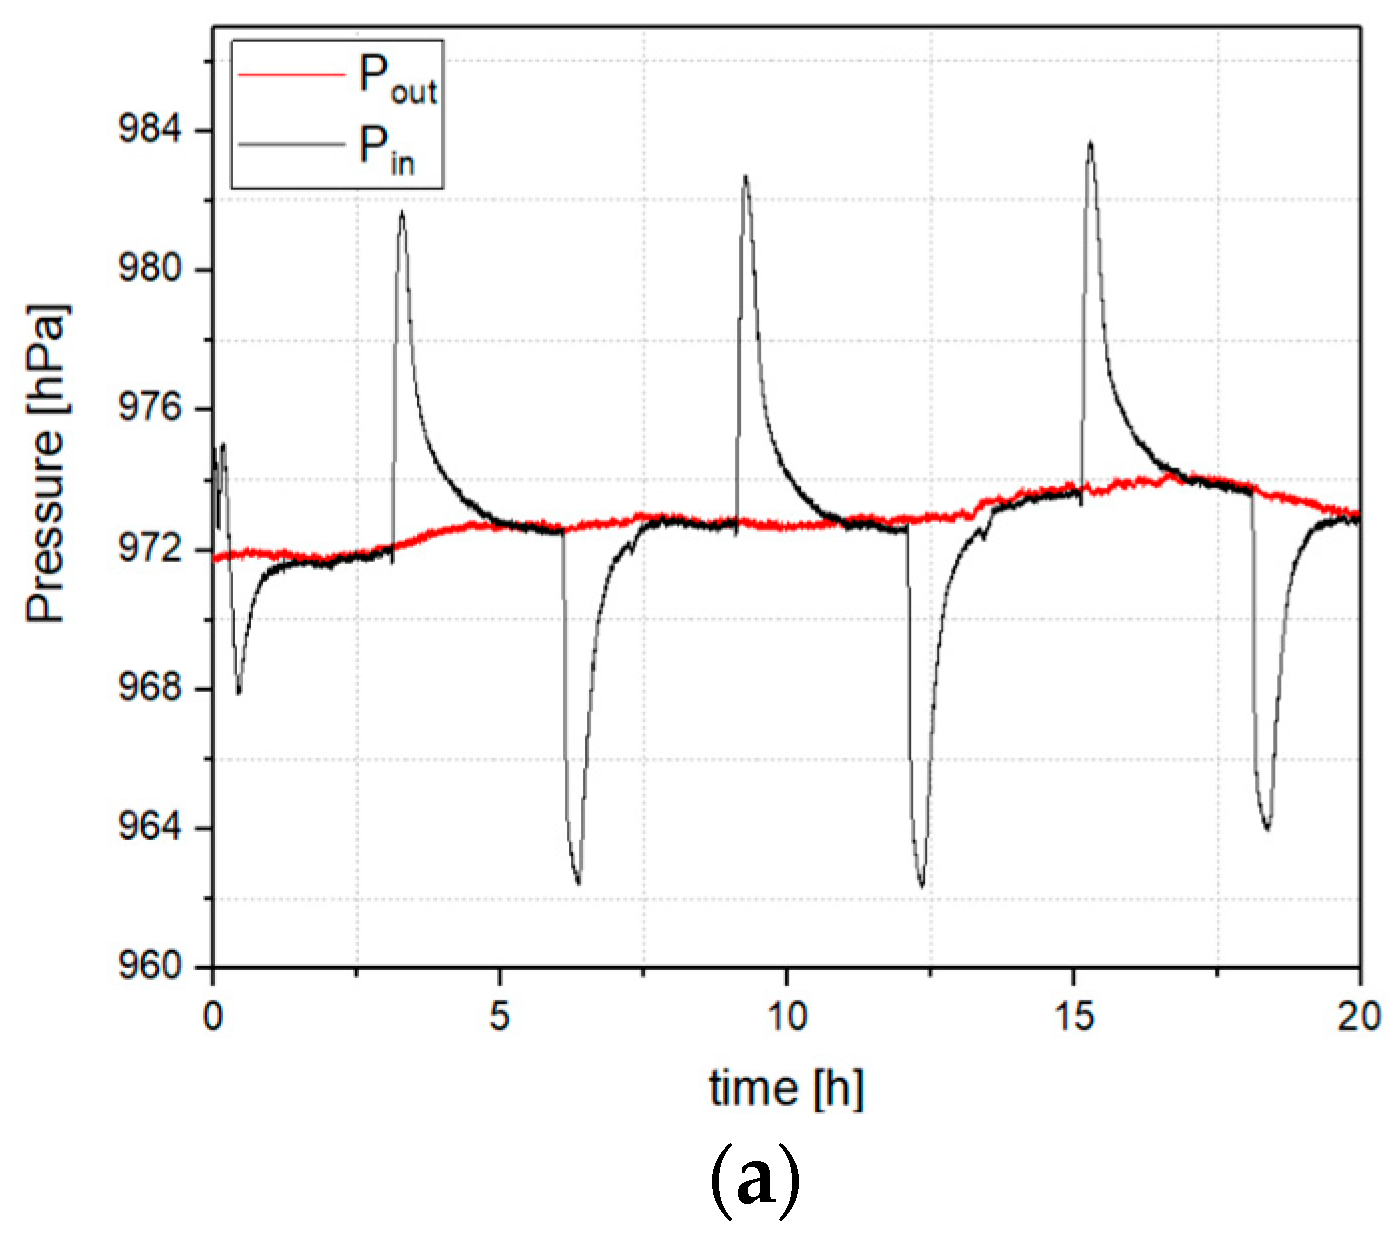
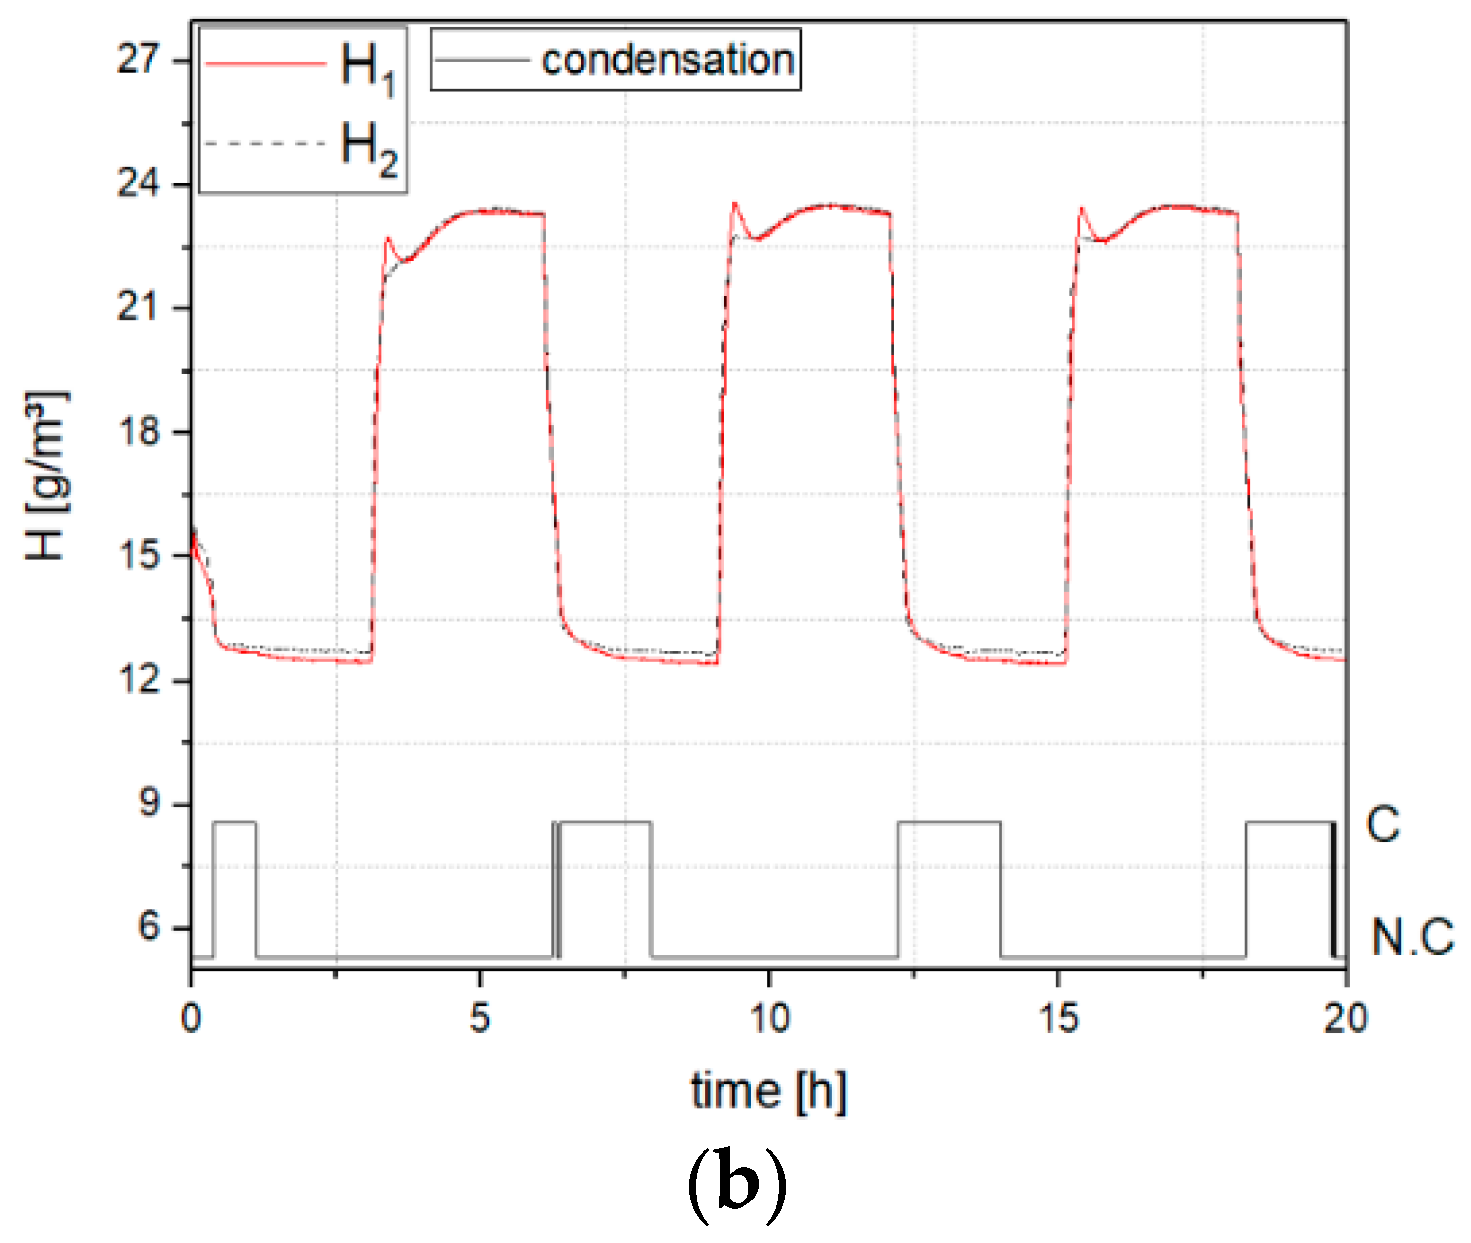
Figure 7 represents the pressure and the calculated absolute humidity of the air present in the battery housing as a function of time for the sealed system. The following outcomes were observed:
The pressure difference between inside and outside of the battery system was 3 hPa at the starting of the first cycle and increased to 10 hPa in the subsequent cycles.
At the starting of the test, both the heating films and fluid cooling were activated simultaneously and the drop in absolute humidity of air was observed. It reduced from 15.0 g/m3 ± 0.8 g/m3 to 12.4 g/m3 ± 0.6 g/m3.
Condensation was observed on the cold plate due to change in temperature and pressure. In the case of the first cycle, condensation was detected for 43 min, and in the subsequent cycles for 102 min and 106 min.
Evaporation of the condensed vapor (water) was observed when the simulated cells were heated using the heating films of the cells. The cycle of condensation and evaporation was noticed multiple times in the entire process.
The maximum absolute humidity of the air for all the cycles during the entire test was always within 23 g/m3 ± 1 g/m3, indicating that the system was sealed properly.
The difference between the maximum and minimum value of absolute humidity at the end of the last cycle was 10 g/m3 ± 2 g/m3. Hence, based on these value of absolute humidity, the amount of condensation within the battery system having 1.5 × 10⁻³ m3 ± 4% of the free volume was calculated, which resulted in 16 mg ± 3 mg.
3.1.2. Test Profile 2 (Abnormal Operation Profile with Sealed System)
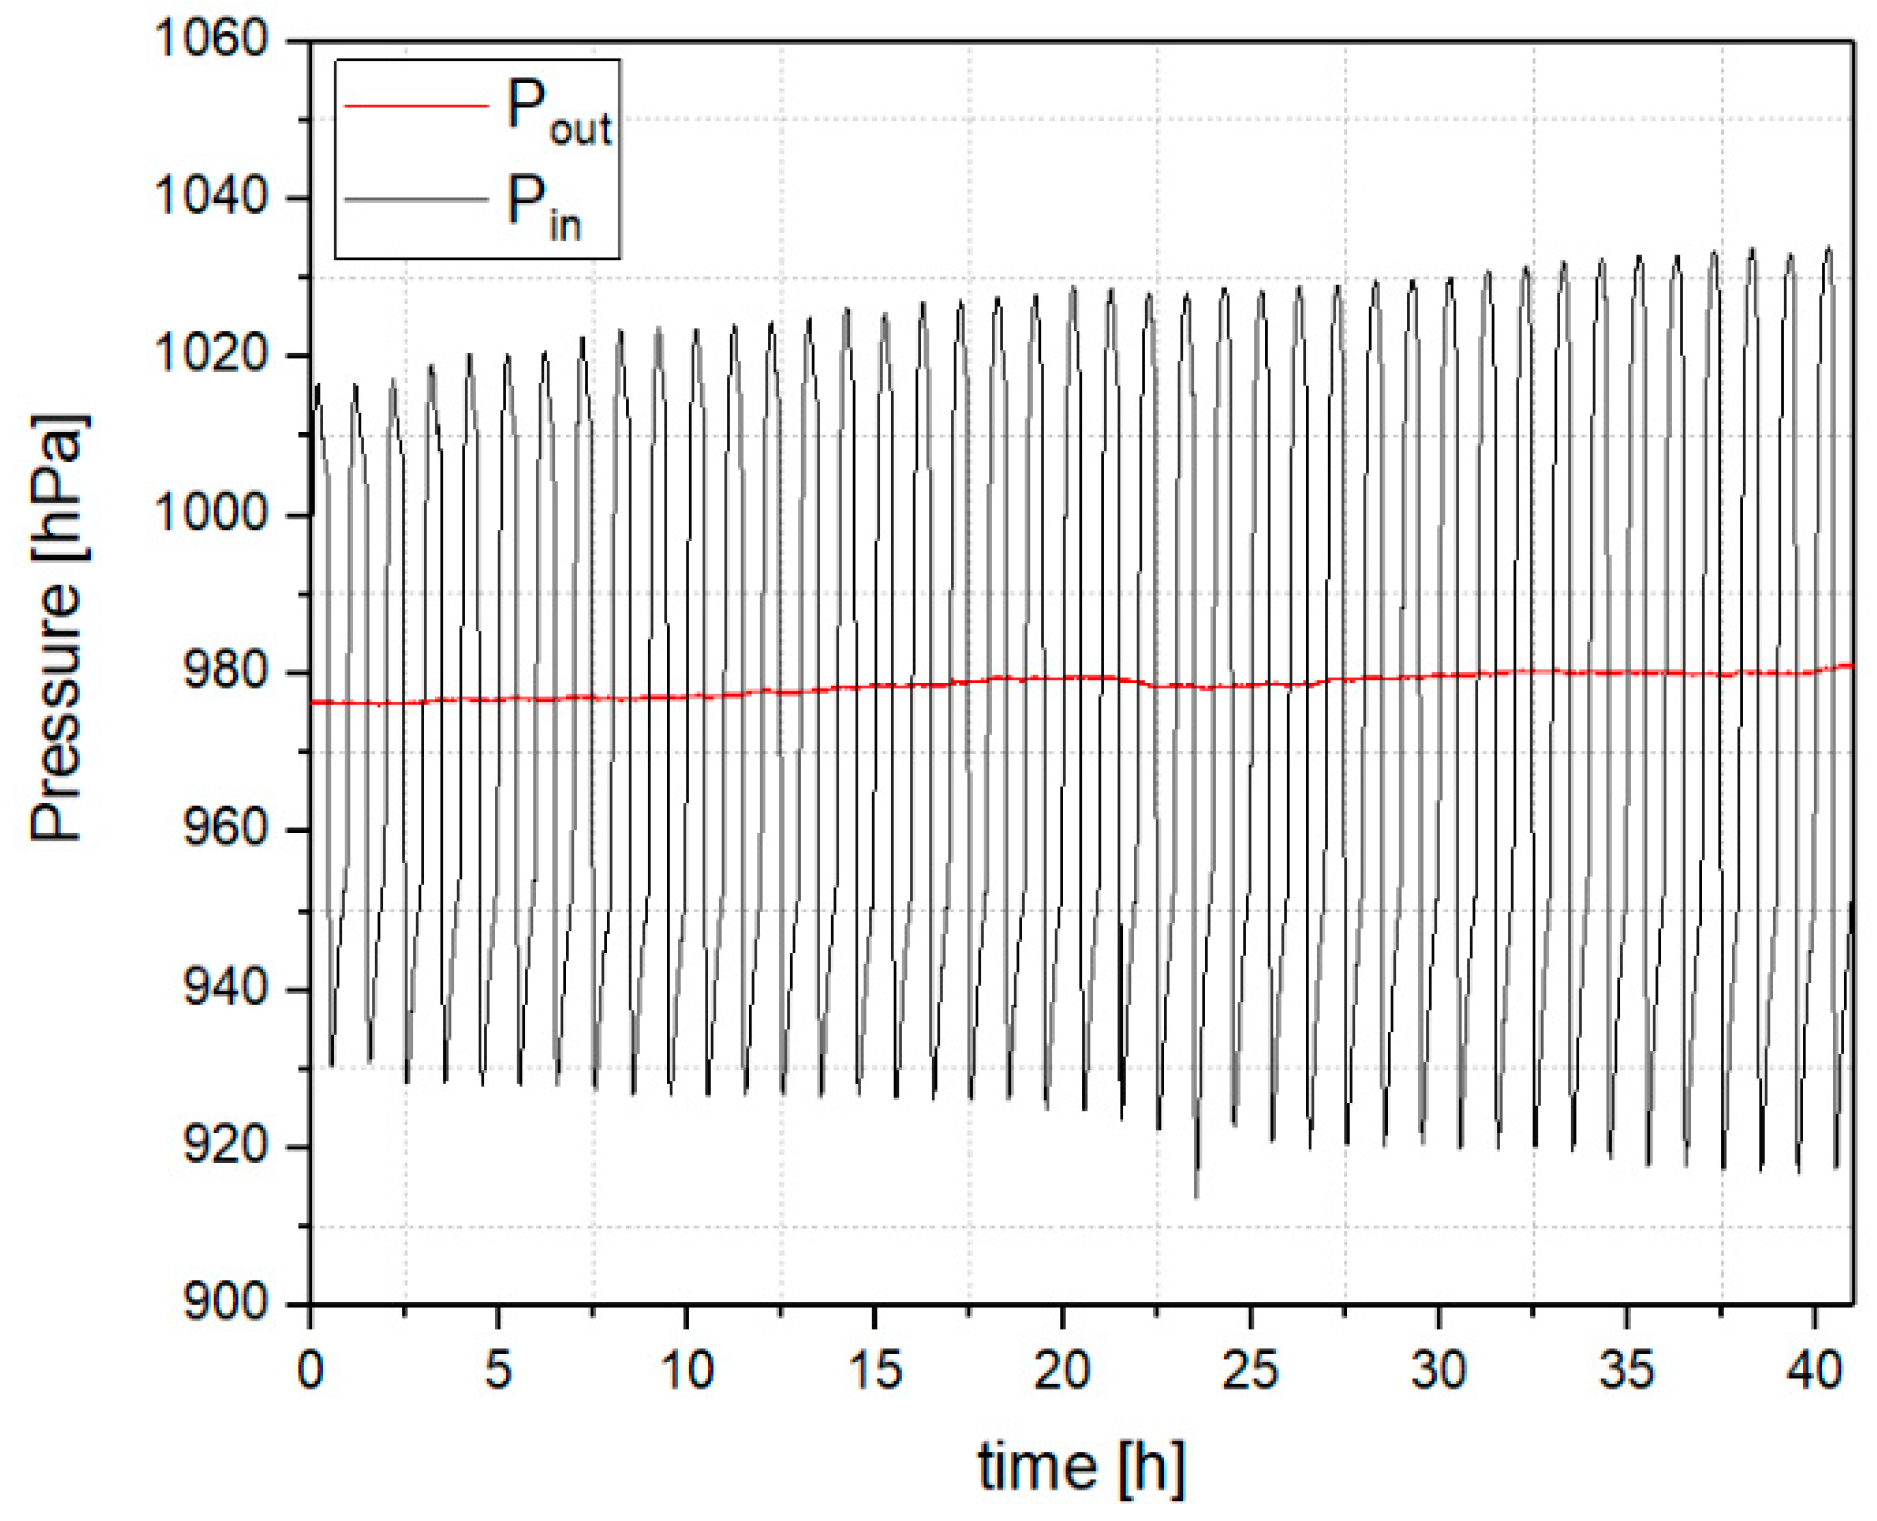
The test with abnormal operation profile was carried out and the pressure difference between the housing and the chamber was recorded (
Figure 8). When the heating films were active, the pressure inside the battery housing (P
in) increased from the initial value of 980.0 hPa ± 1.5 hPa to 1016.0 hPa ± 1.5 hPa during the first cycle and a subsequent increase in pressure was noticed throughout the test, reaching till 1034.0 hPa ± 1.5 hPa in the last cycle. As the heating was turned off and the coolant (−10 °C) flowed into the cold plate, the overall temperature of the system was decreased and hence, the P
in initially decreased to 930.0 hPa ± 1.5 hPa (max) during the starting cycles of the test. A subsequent decrease of this value was noticed throughout the test until 917.0 hPa ± 1.5 hPa in the last cycle).
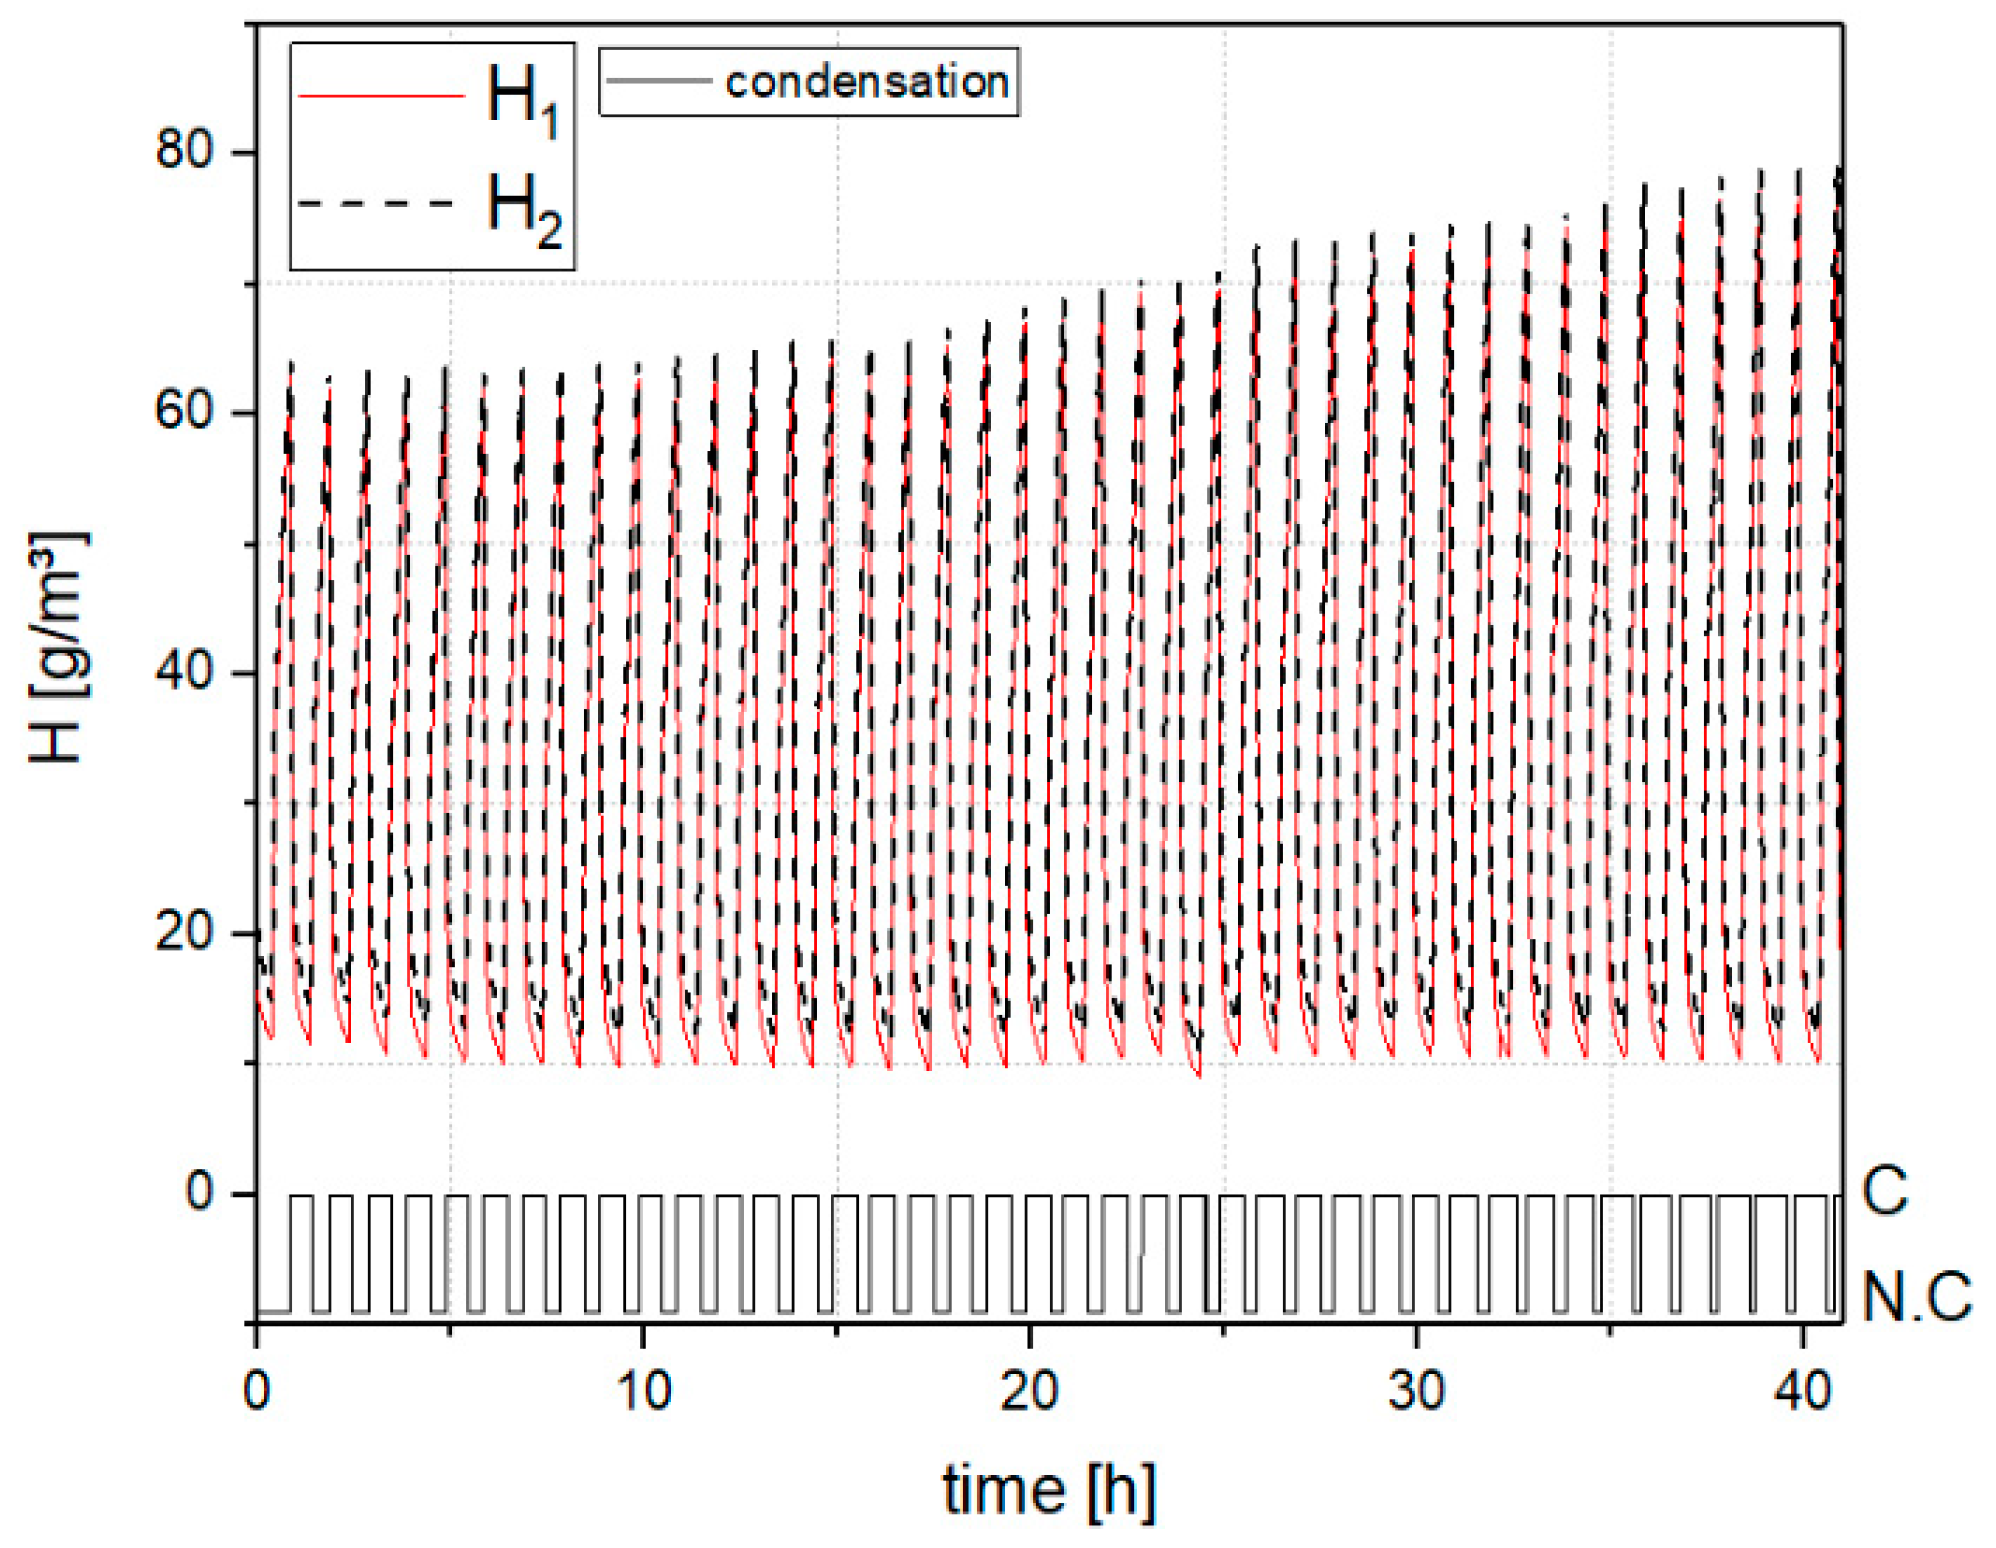
Caused by the heating of the mimicked cells, the condensed water was evaporated and the absolute humidity in the air inside the housing increased. The peak absolute humidity tended to increase in the further cycles. Due to the large temperature difference between the heated cells and the cooling fluid at −10.00 °C ± 0.02 °C, the water vapor in the housing condensed on the surface of the cold plate. It had been noticed that the maximum peak of the absolute humidity had kept on increasing during the entire test. For the first cycle, absolute humidity had reached till 63 g/m
3 ± 3 g/m
3 while for the last cycle the value was 77 g/m
3 ± 4 g/m
3 (
Figure 9). This indicates that the system had partly lost its seal and was leaking. Thus, the water vapor exchange was observed. As it was not completely open, pressure differences were noticed. From the recorded parameters, the condensation of 98 mg ± 10 mg was calculated in the last cycle.
3.2. Design Variant 2: Open Battery System
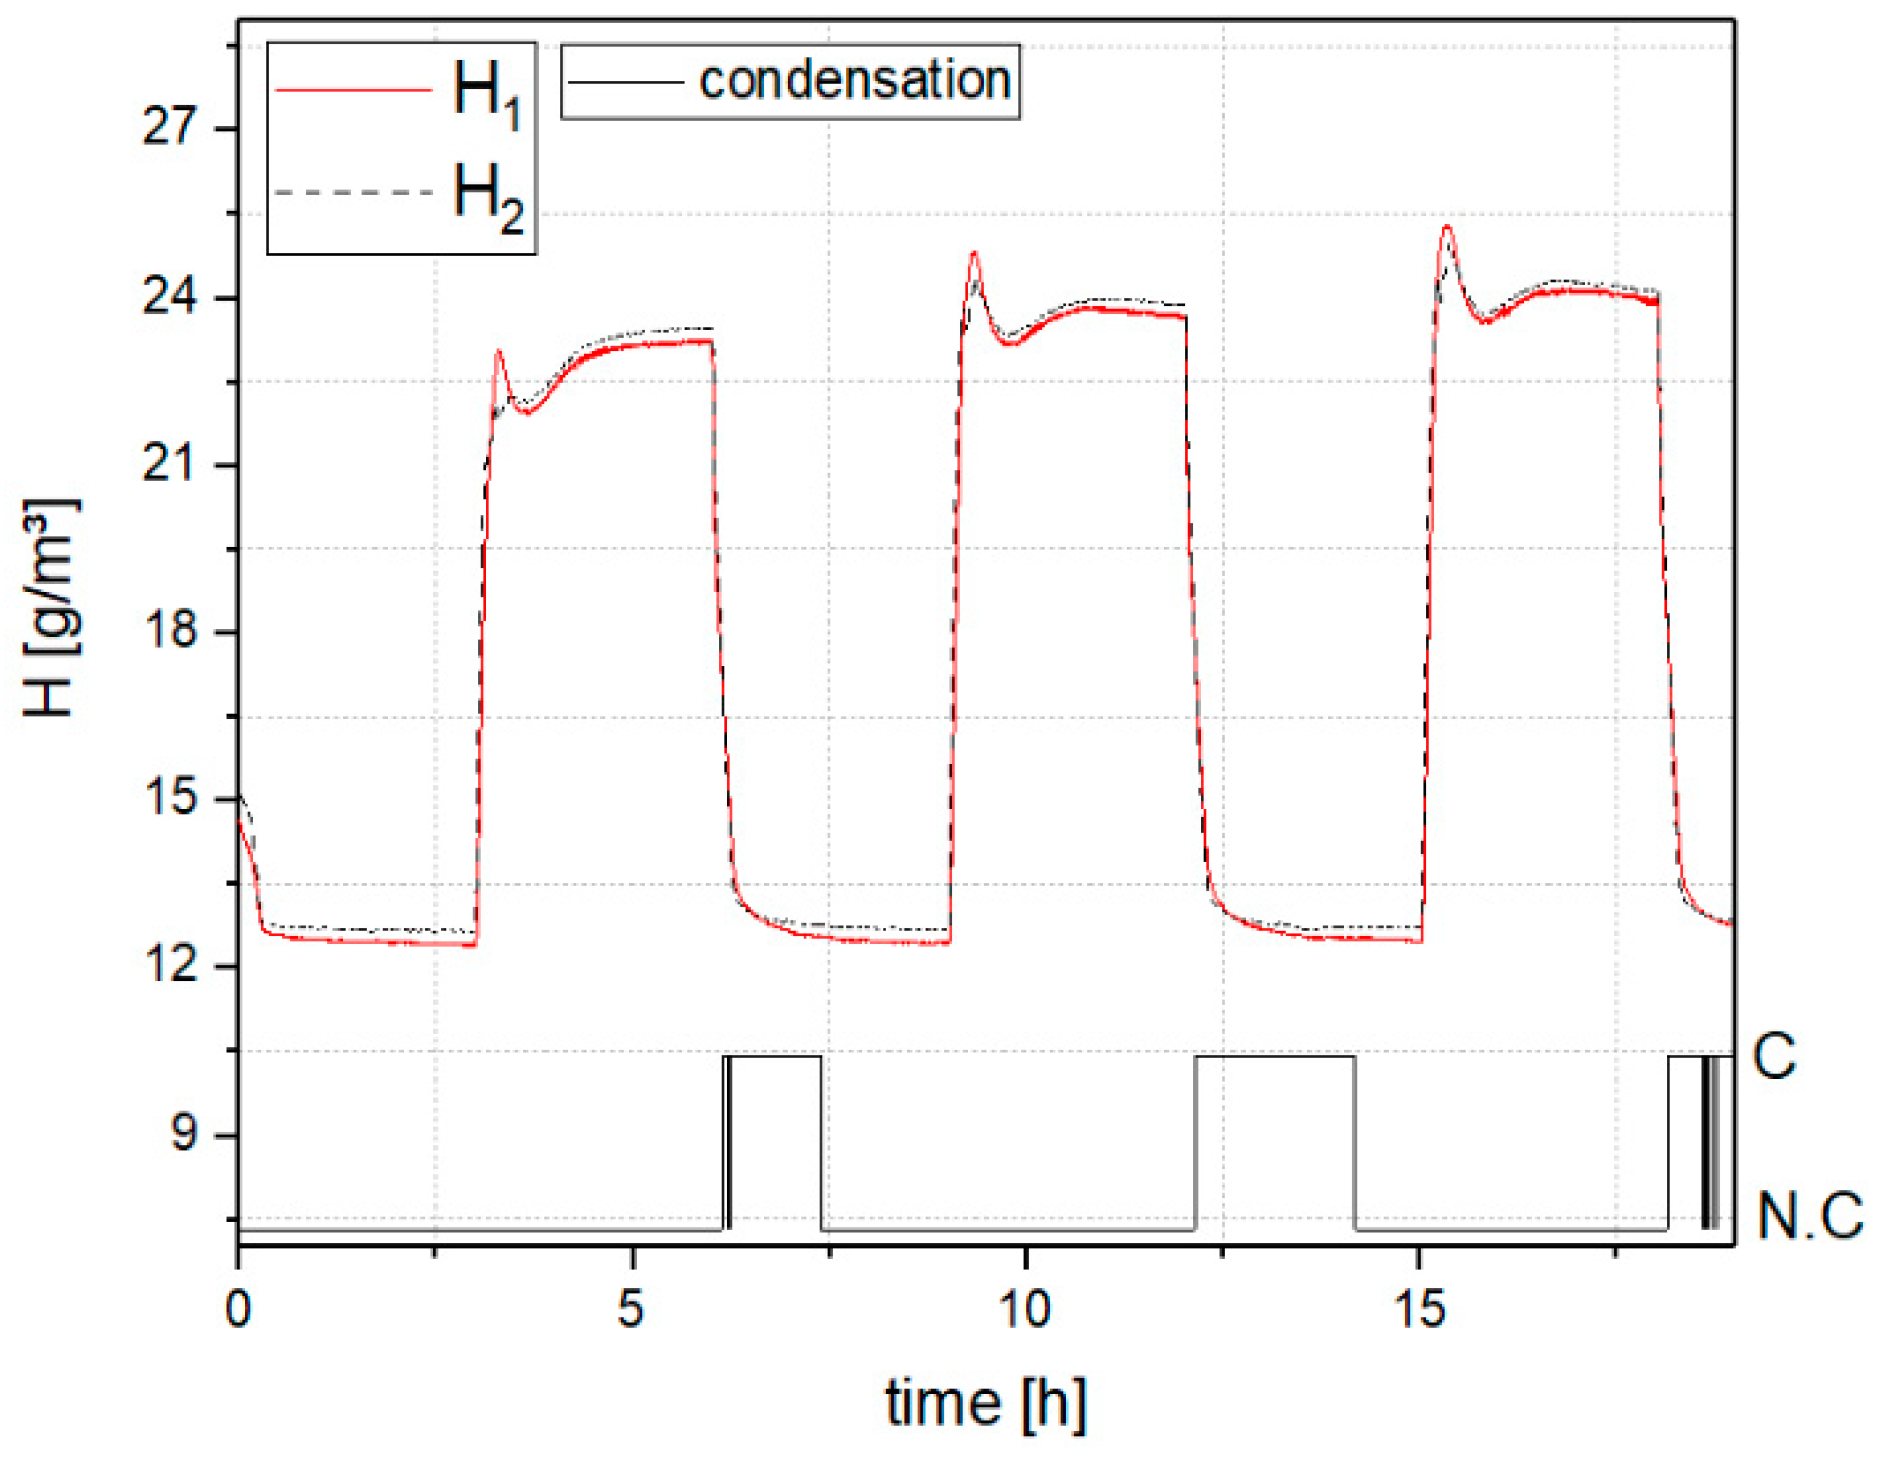
3.2.1. Test Profile 1 (Normal Operation Profile with Open System)
Condensation was observed on the cold plate during the operation of the heating films and the cooling system simulating the normal application of the battery system. The maximum and minimum absolute humidity of the air inside the battery housing was 29 g/m
3 ± 1 g/m
3 and 13 g/m
3 ± 1 g/m
3 respectively (
Figure 10). The minimum condensation within the open system was 26 mg ± 4 mg.
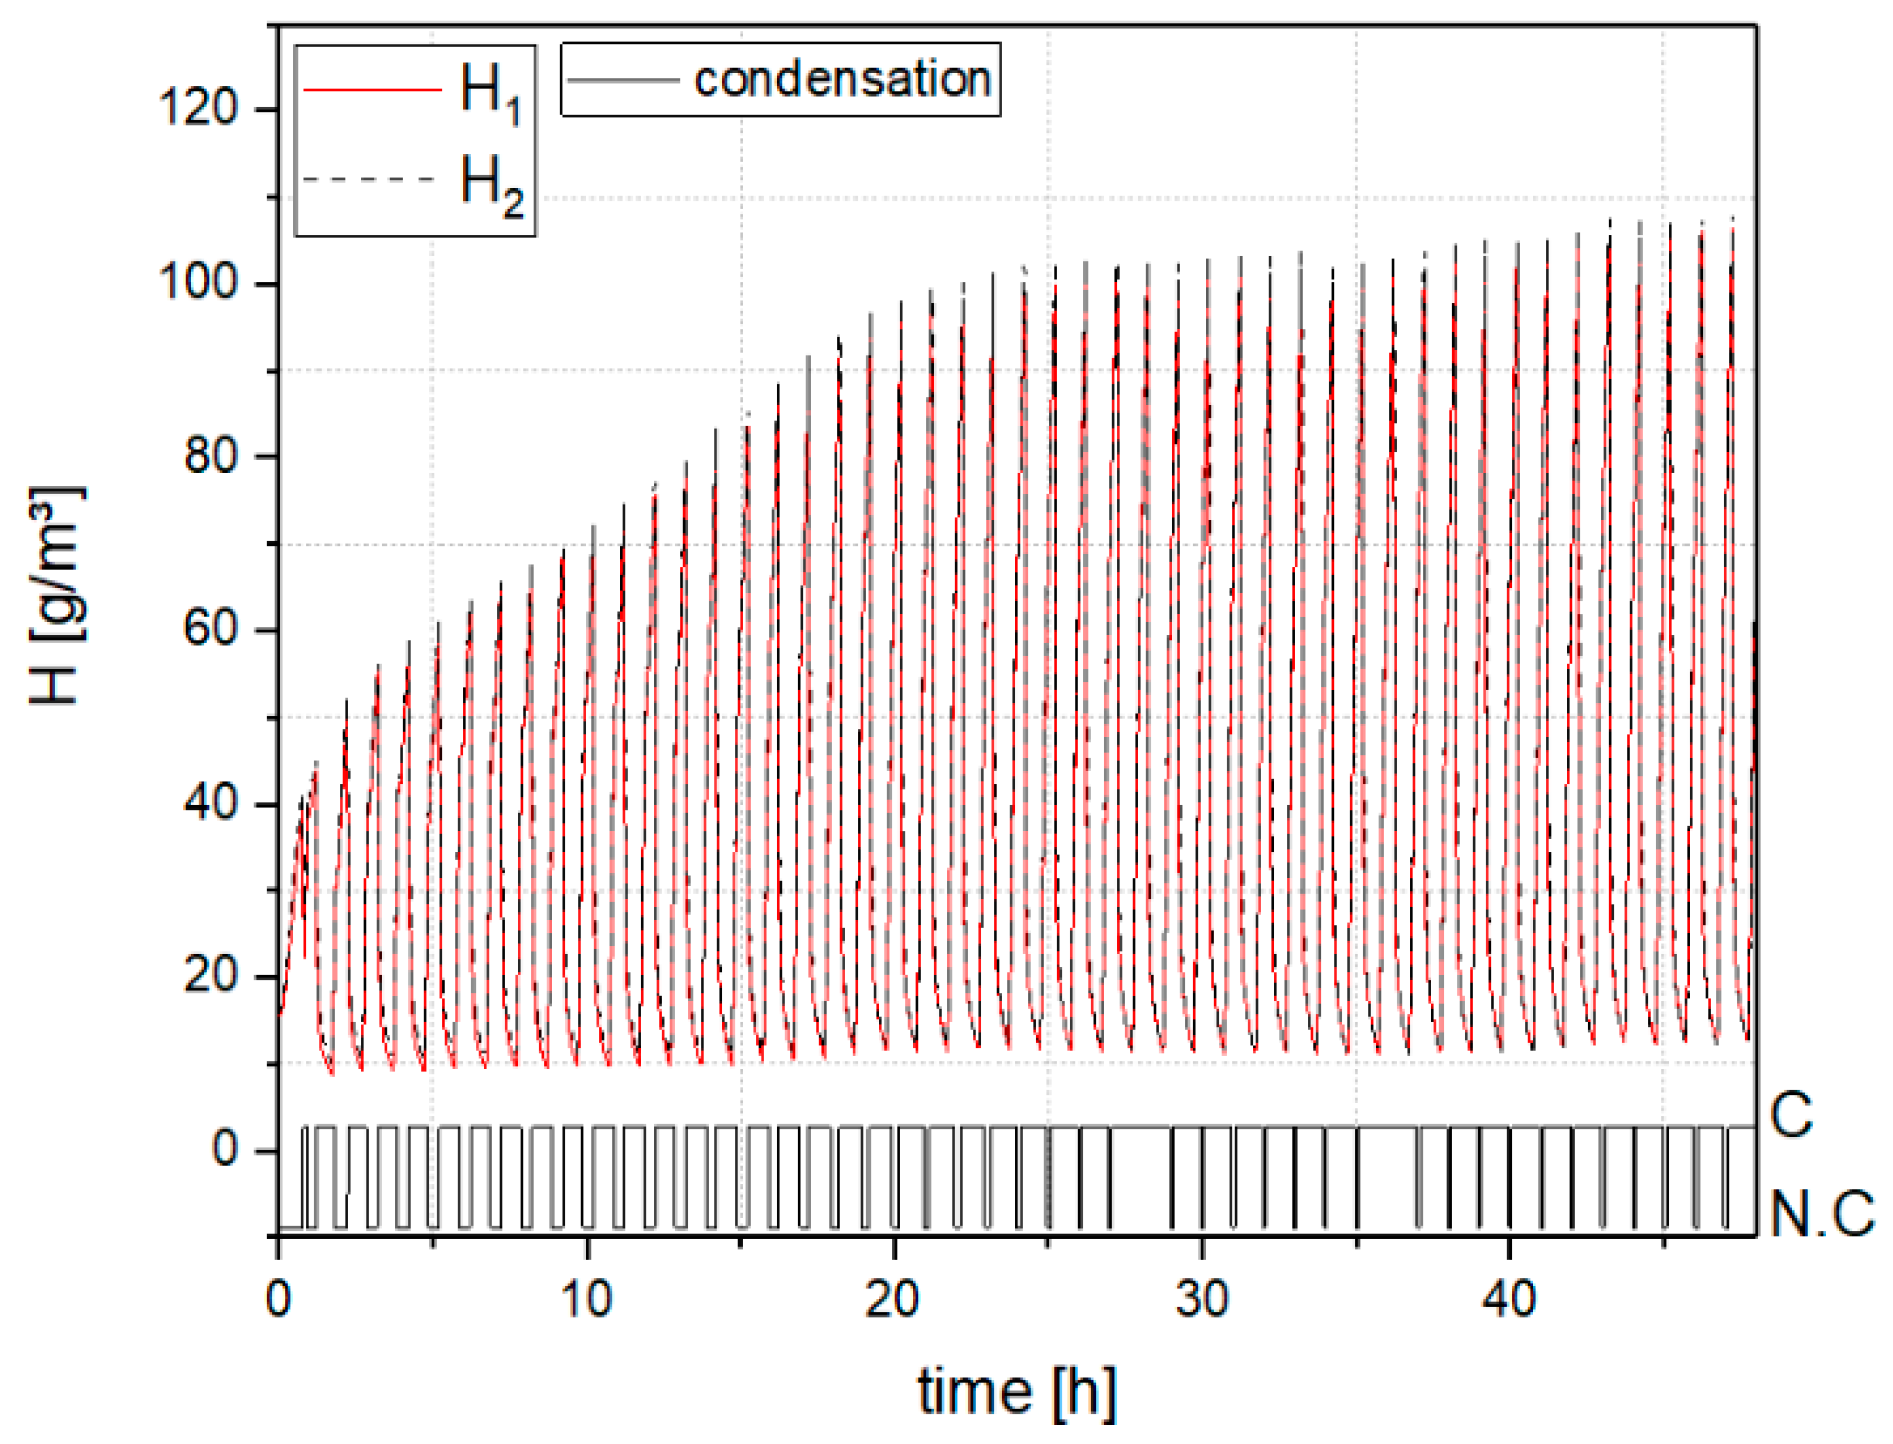
3.2.2. Test Profile 2 (Abnormal Operation Profile with Open System)
During the test on the open battery system with an abnormal operation profile, no pressure difference between the inside and the outside of the housing was detected. The maximum absolute humidity increased rapidly until 97 g/m
3 ± 4 g/m
3 measured at the 20th h. After that, the maximum absolute humidity in the housing was constant in further cycles (
Figure 11). Furthermore, no evaporation was observed during the heating phase. The maximum absolute humidity in the last cycle was 107 g/m
3 ± 4 g/m
3 and the amount of condensation was minimum 140 mg ± 10 mg.
The condensation duration on the cold plate per cycle increased in accordance with the number of cycles. This can be explained by moisture entering from the outside into the battery through the opened valve.
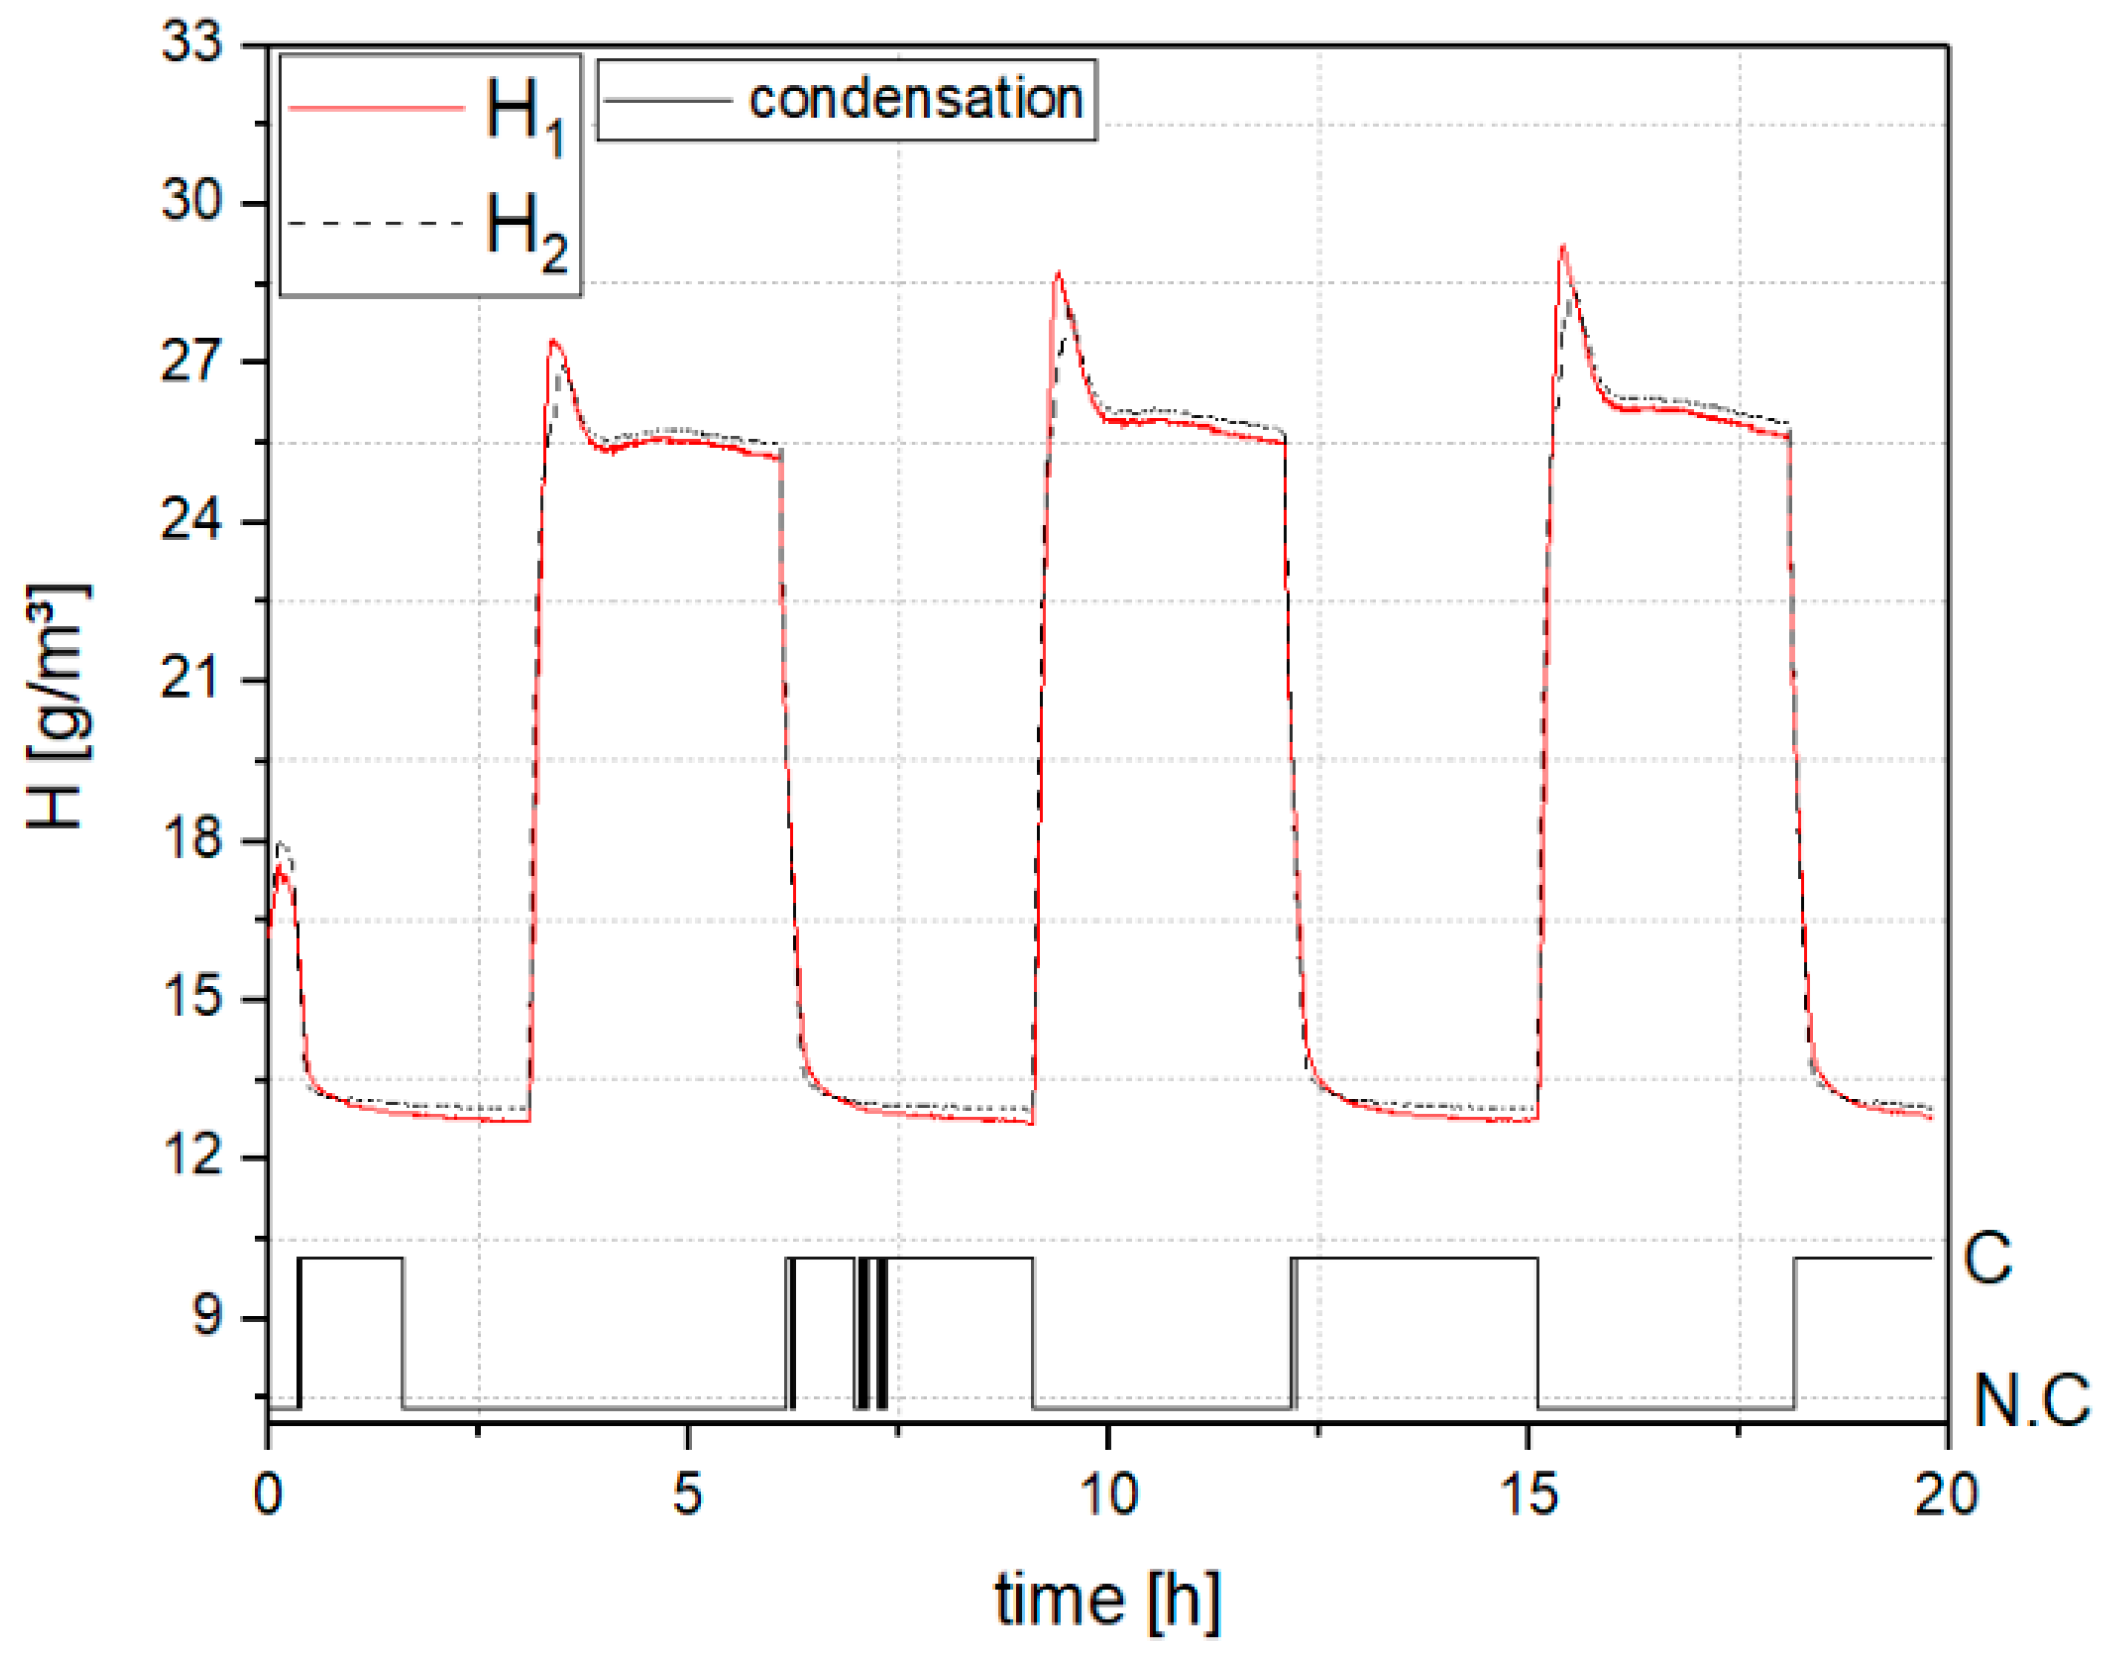
3.3. Design Variant 3: Battery System Equipped with A Pressure Compensation Element (PCE)
3.3.1. Test Profile 1 (Normal Operation Profile with PCE)
For the battery system equipped with PCE, no pressure difference between inside and outside of housing was observed, as the PCE compensated the pressure difference at all the times. In the first cycle, when the cells were heated and coolant was flowing, no condensation was detected even though the absolute humidity in the housing dropped from 14.6 g/m
3 ± 0.8 g/m
3 to 12.3 g/m
3 ± 0.6 g/m
3 (
Figure 12). The maximum humidity level of the third cycle was 25 g/m
3 ± 1 g/m
3 which was almost similar to the first cycle, indicating that virtually no moisture was entering the battery.
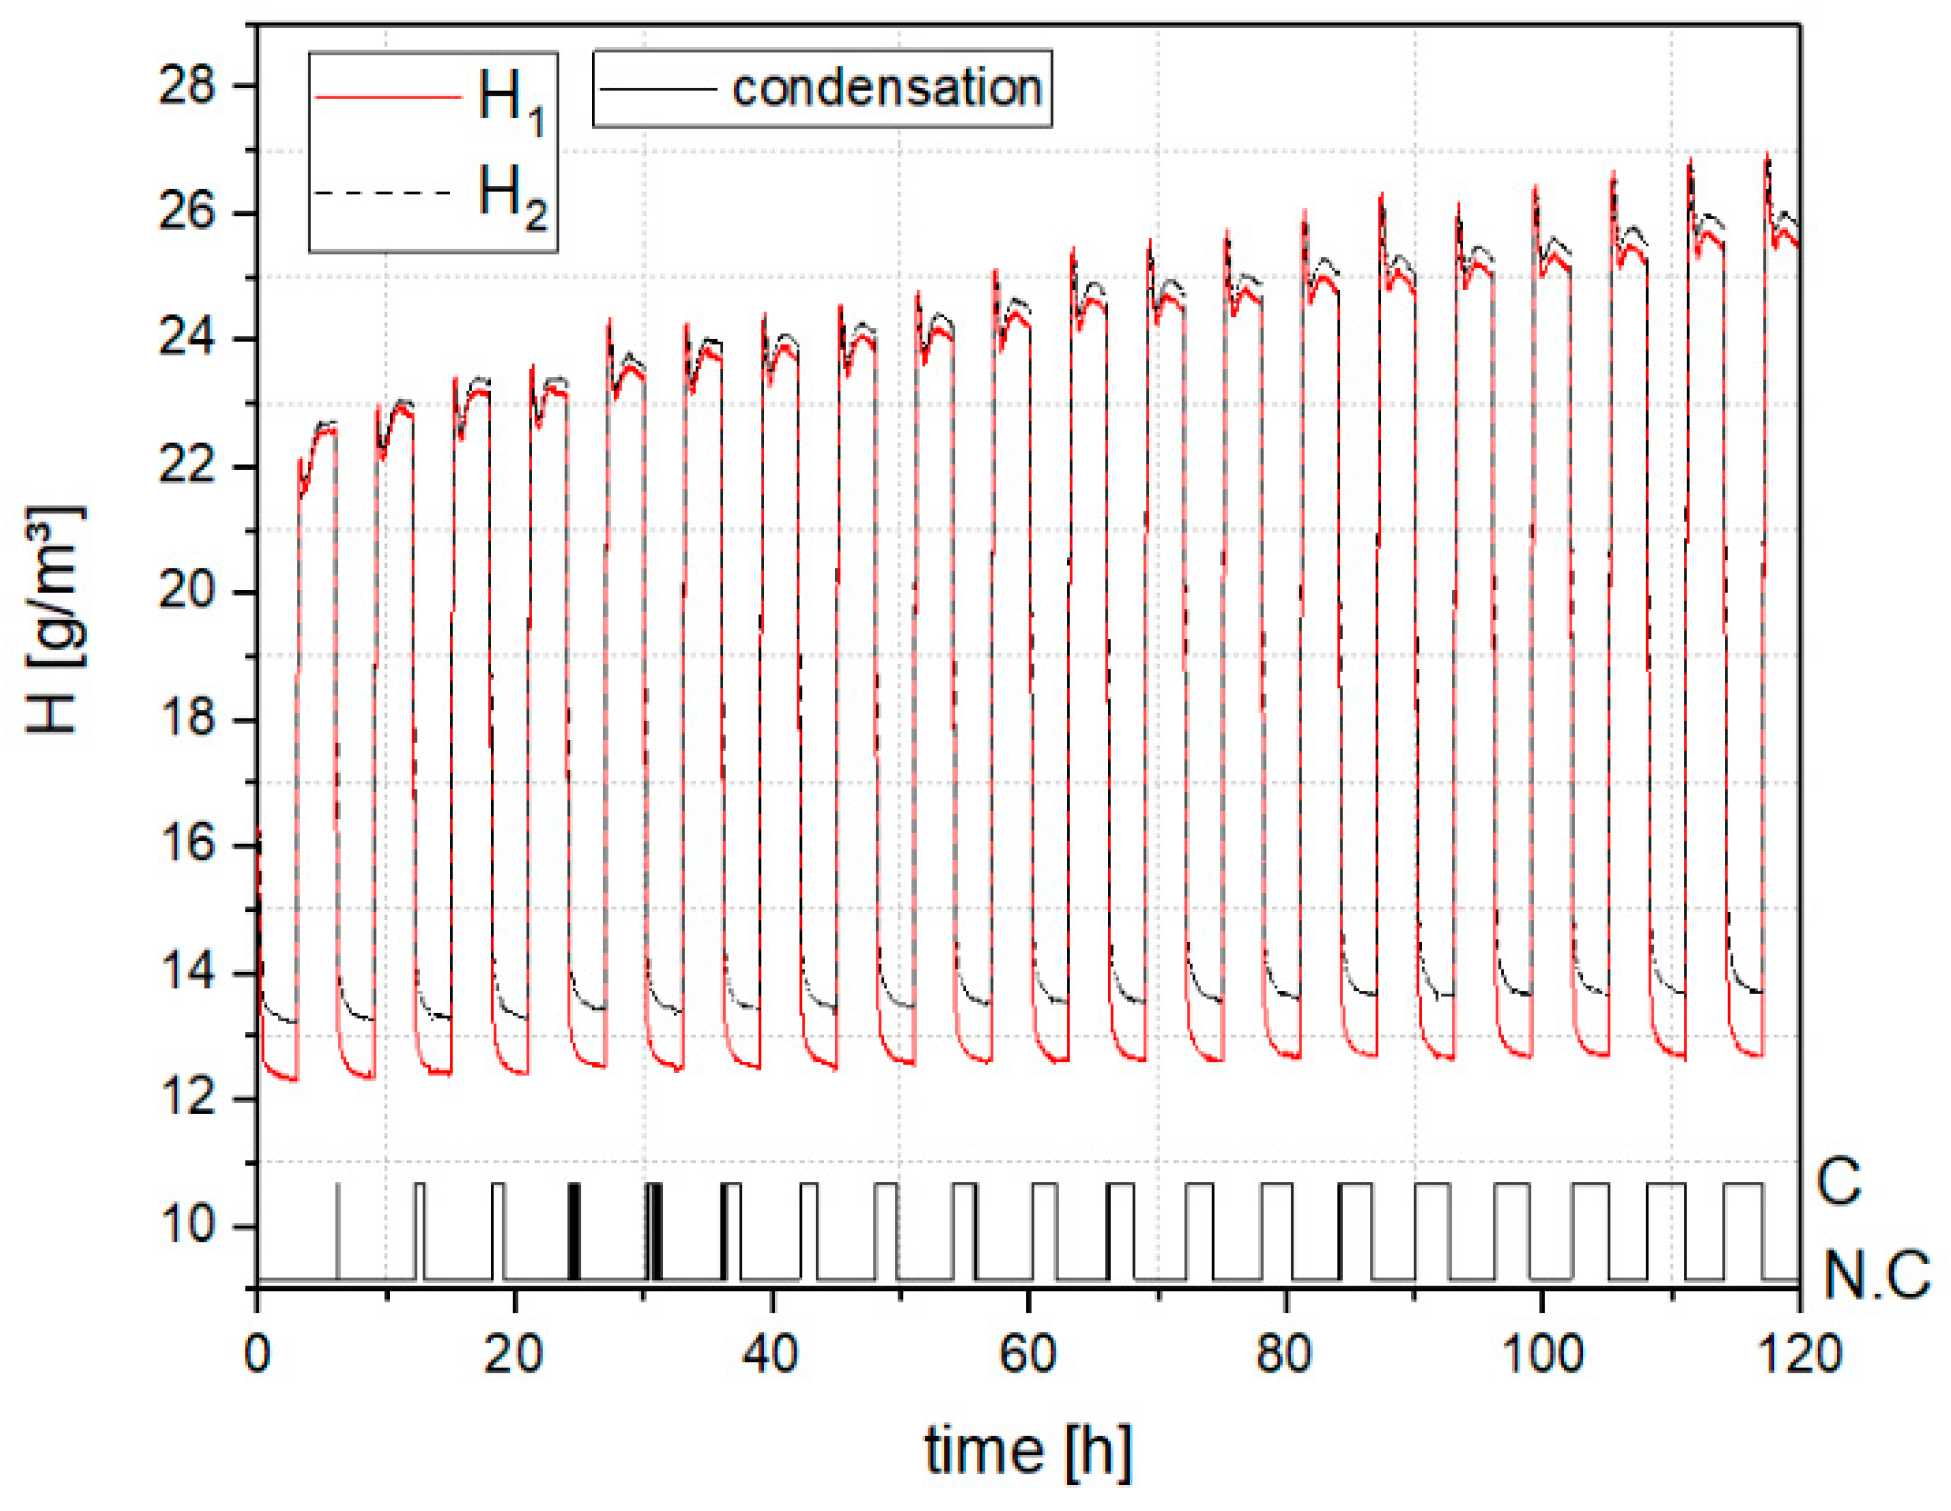
While continuing the measurement for 120 h with identical conditions, the absolute humidity increased to 27 g/m
3 ± 1 g/m
3. The condensation duration on the cold plate increased in accordance with the number of cycles (
Figure 13). The condensation during the shorter test was minimum 19 mg ± 3 mg and increased to minimum 21 mg ± 4 mg for the 120 h test. It implies that during the tests, moisture had entered the battery system.
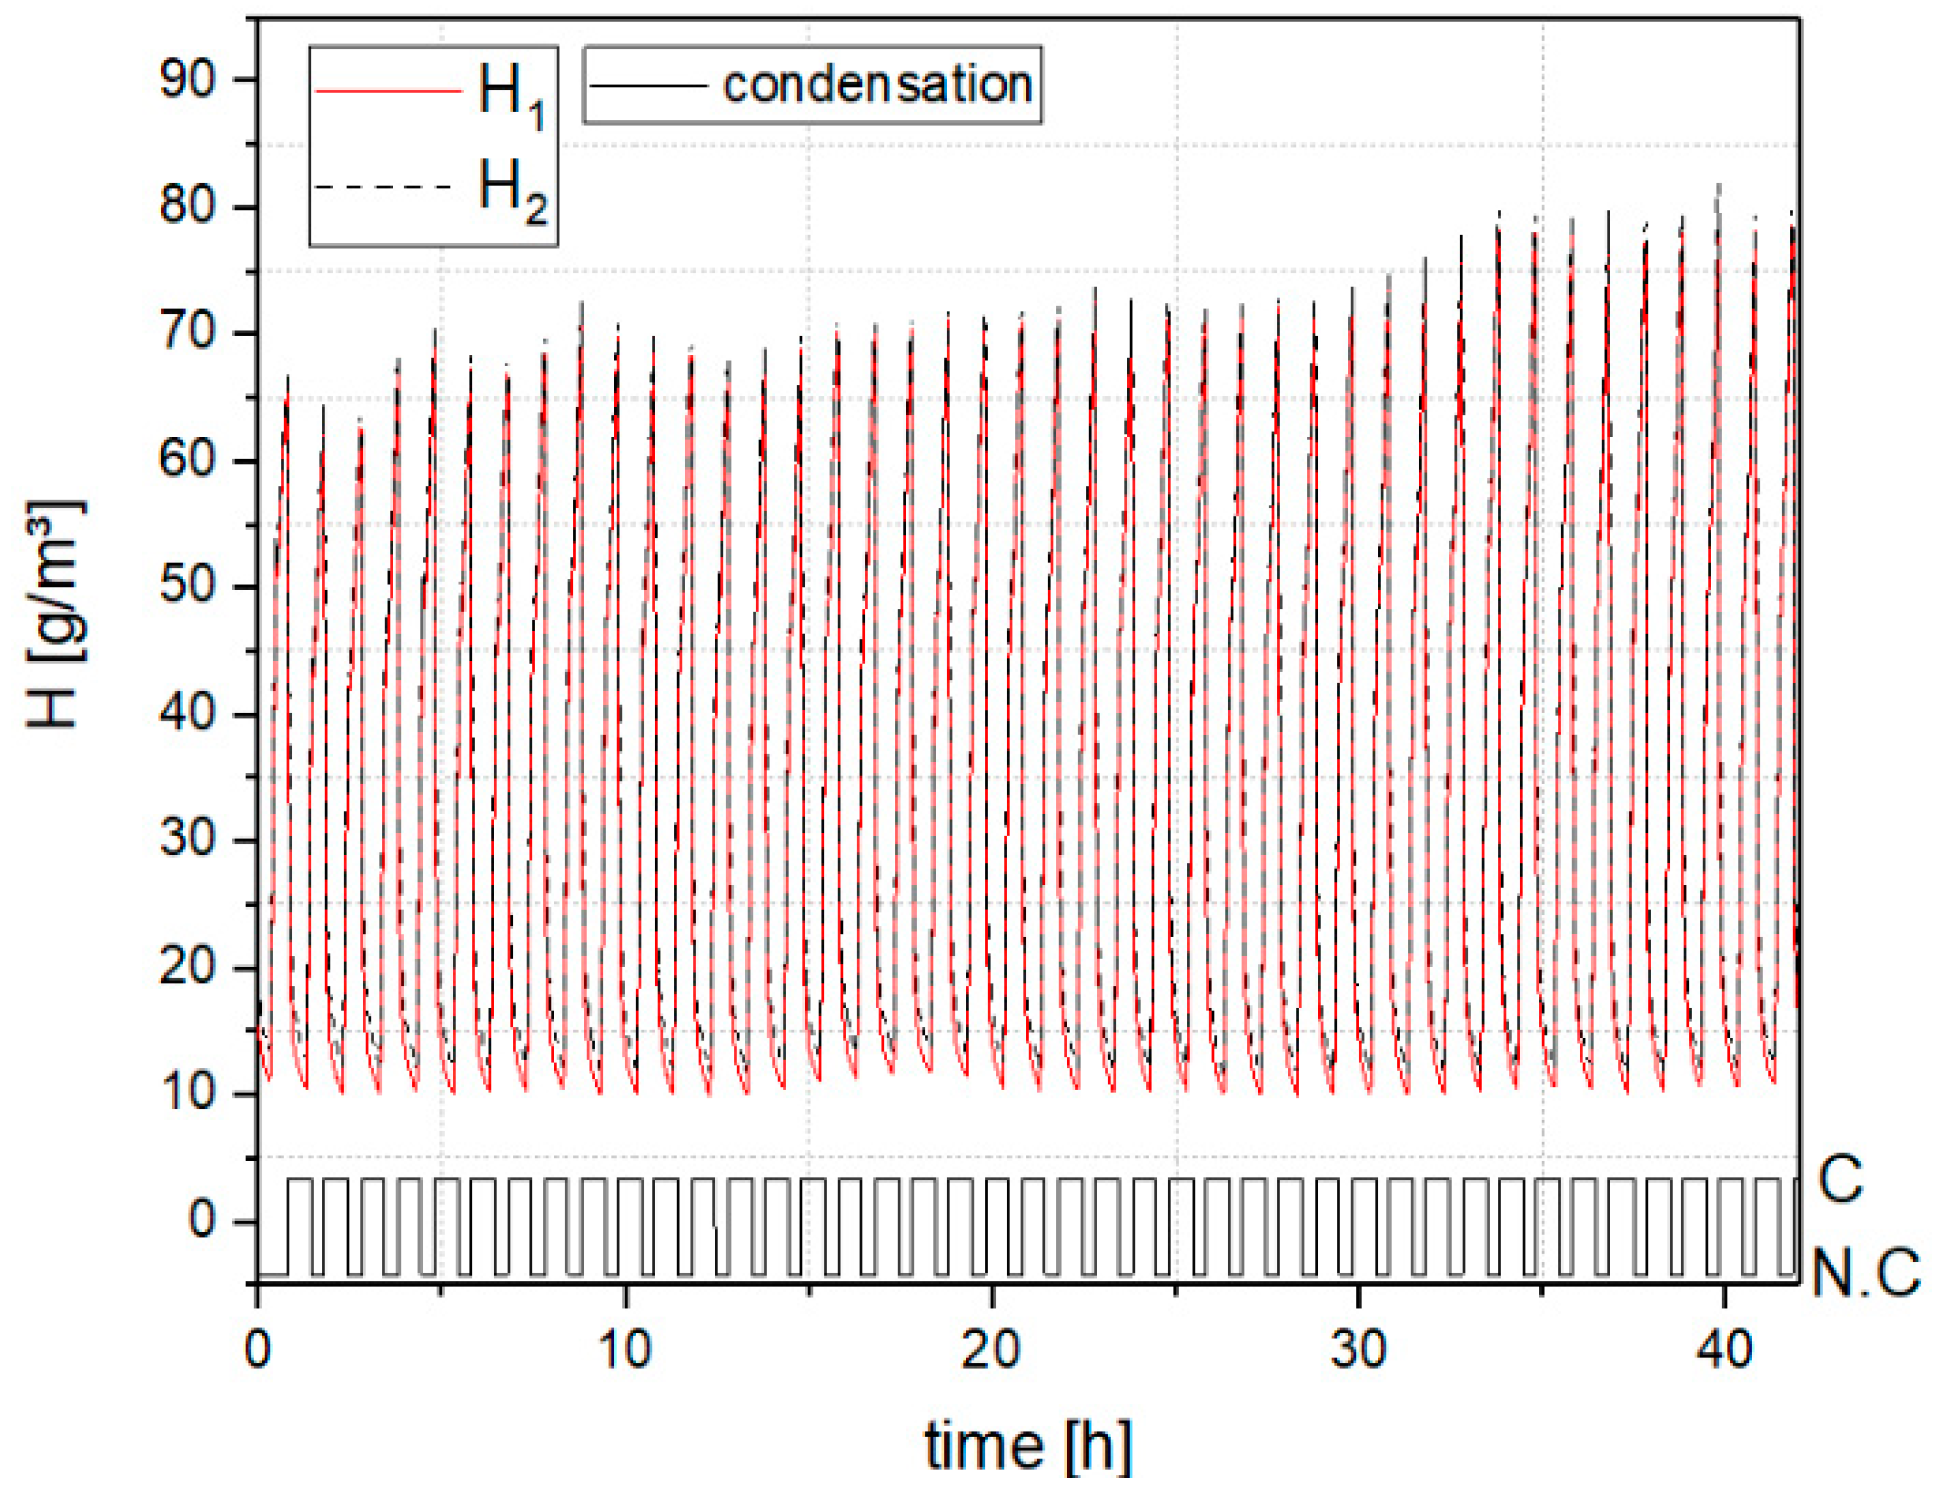
3.3.2. Test Profile 2 (Abnormal Operation Profile with PCE)
Condensation was detected on the cold plate over the entire cooling process. The maximum absolute humidity increased from 66 g/m
3 ± 3 g/m
3 in the first cycle to 83 g/m
3 ± 4 g/m
3 in the last cycle (
Figure 14). The amount of condensation was minimum 100 mg ± 10 mg in the last cycle, calculated from minimal and maximal relative humidity.
While the battery system was cooled with −10.00 °C ± 0.02 °C fluid, the condensation was detected on the cold plate by the dew sensors all the time. Once the heating films of the cells were active, no condensation was observed and the maximum absolute humidity increased slightly during measurement.
4. Conclusions
Three reasons for the condensation of water inside a battery housing were identified. Not all of them lead to long-term accumulation of humidity in the housing.
Firstly, water vapor already present in the air inside the battery before starting the test will condense on the surface of cold parts while cooling down. This effect is reversible and will not lead to further accumulation of water inside the housing while operating the battery.
Secondly, water, in the form of humidity (water vapor present in the air) is passing into the housing of the battery. This can be explained by air being sucked in through the openings of the housing when the internal pressure decreases (e.g., caused by temperature decrease). Approximately the same amount of water will leave the housing when the temperature (and pressure) increases again. Large temperature differences, e.g., caused by the low temperature of the cooling liquid at high current loads of the battery, lead to greater pressure changes.
A constant value of maximum absolute humidity was observed for the sealed battery system with test profile 1. This indicates impermeability of the PSBS housing for the other designs. PCEs are specially made to allow a balanced pressure inside and outside of the sealed housing while blocking liquids, dust, and bigger particles. Thus, they negligibly influence the penetration of vapor inside the housing. The used PCE successfully compensated the internal pressure for all tests (see
Figure 12 and
Figure 13).
Thirdly, there are gradient based drifts of water (e.g., diffusion caused by partial pressure gradients and convection caused by temperature gradients), even when pressure is equal inside and outside of the housing. The direction of diffusion (inside to outside or vice versa) is governed by the gradient of the partial pressure. When the vapor condenses on the cold plate, the amount of water vapor reduces in the air and hence, the partial pressure of water vapor reduces locally. To stabilize the difference of partial pressure between inside and outside of the battery, moisture enters the housing. The size/resistance of all openings of the housing resists and controls the flow of moisture. Thus, the usage of a PCE limits the gradient based drift in both the directions (inside to outside or vice versa) which controls the amount of condensation within the housing.
Tests for all the three design variants were conducted using two different profiles. When the test was conducted with the normal operation profile, condensation was observed on the cold plate for all the designs during the cooling process. Under the assumption that the amount of condensation within the housing corresponds to the reduction of absolute humidity, the maximum condensation for the sealed system was 16 mg ± 3 mg, for the battery system with PCE it was minimum 19 mg ± 3 mg rising till 21 mg ± 4 mg for 120 h test and for the open system, condensation was minimum 26 mg ± 4 mg. No significant difference in the amount of condensation was found between the sealed system and the system equipped with a PCE. Therefore it can be assumed that the PCE limits diffusion. In the case of an open system, diffusion was the major cause of water vapor transport into the system. By comparing the results of the open system with the system with PCE, it can also be assumed that the PCE considerably reduces moisture transport into the system.
As expected, with test profile 2, which was the worst-case scenario (faulty battery cooling system, charging without cooling followed by maximum cooling speed), generally more moisture was observed inside the battery. In all the cases, higher condensation was observed and more humidity entered the housing in comparison to normal operation. With the sealed system, the maximum absolute humidity increased linearly which indicates air, and therefore water entering from outside. The maximum amount of condensed water was 98 mg ± 10 mg for the sealed system and minimum 100 mg ± 10 mg for the system equipped with a PCE. Hence, both the sealed system and the system with PCE were behaving similarly. In the case of an open system, the maximum condensed water was at least 140 mg ± 10 mg. In comparison to the sealed system and to the system with PCE, more humidity was transported into the battery in case of the open system and hence, higher condensation was detected. It was also observed, that the PCE was able to compensate internal pressure fluctuations caused by the higher temperature variation with the worst-case profile. As a result of these two observations, it is validated that water vapor is being transported by gradient driven diffusion into the battery. These results also justify that a PCE reduced the water vapor diffusion into the system.
While equipped in the vehicle and in the field life, the pressure difference in the system may not only be caused by the cooling system but also, by a change in the height of the vehicle. This may lead to a bigger influence on the humidity penetration inside the battery. The use of a PCE is recommended, to avoid differential pressures on the system and it is possible to protect the components against harmful substances like dirt and dust. The usage of an open housing to compensate the pressure differences is a bad alternative to a system with PCE, as it was found that the amount of condensed water for the abnormal operation inside the open system was 40% more compared to a system with PCE in the worst case scenario. Hence, using the battery system with PCE is one of the best alternatives to reduce the condensation inside the battery as well as to maintain similar pressure in and out of the battery system.
Further investigation is required to study the long-time effects regarding the flow rate and effective diffusion barrier of the PCE membrane for field applications. To avoid condensation of vapor in the system, the cooling plate surface temperature should be kept above the dew point. To achieve a robust battery system design, the optimal temperature of the coolant should be selected to prevent damage from condensation. Also, algorithms in the battery management system might be implemented to detect, reduce and avoid condensation. This might be achieved by heating up the battery above the dew point for short periods. A drainage system to handle the liquid might be the other option, but the drawback of an open system must be kept in mind.

 ,
, 


