1. Introduction
Wireless power transfer is a classic engineering field currently gaining increasing attention. One reason is the wide variety of applications. It ranges from consumer products like electric tooth brushes and charging of mobile phones to high end medical applications [
1,
2,
3,
4,
5] like cochlear implants [
6], wireless endoscopic capsules [
7,
8], and cardiac pacemakers [
9]. Recently, some effort has been put into the development of contactless charging systems for electric vehicles. The authors of [
10] presented a loosely coupled transformer system for charging an electric vehicle with up to 4 kW power. They used a full-bridge inverter on the primary side and realized zero-voltage switching (ZVS). Ville at al. give the perspective up to a charging power of 200 kW for a similar system [
11]. The advantages of ZVS have also been proven for a high frequency single phase inverter [
12]. Another transformerless ZVS full-bridge inverter was shown to be more efficient compared to commercial H6 inverters [
13].
The class-D amplifier is the most popular topology in wireless power applications. In principle, the class-E amplifier is superior in terms of efficiency and was originally published by Sokal [
14]. The reason for its efficiency is that it allows not only ZVS but also zero-derivative switching (ZDS) [
15]. This fact further reduces switching losses. In a few areas the class-E amplifier is applied already. High frequency application reaches into the megahertz and microwave range [
16,
17], while most applications are found in the intermediate frequency electromagnetic field (IF-EMF) range. Highly efficient class-E power amplifiers are typically used in cochlear implants [
6]. Its application for a Bone Conduction Implant has been published by Taghavi et al. [
18]. Wang et al. use a class-E amplifier for wirelessly powering a retinal prosthesis [
19]. Recently, suggestions for the use of class-E amplifiers in high power applications like the charging of electric vehicles have also been published [
20].
We have already published the principle idea behind internal illumination by Wireless Light Emitters (WLE) and presented preliminary results for the application in photobioreactors [
21] as well as photocatalytical reactors [
22]. We have also reported on promising results for algae cultivation by WLE before [
21,
23] and compared our system other developments [
24]. In this paper, we discuss the use of a class-E amplifier for efficiently powering internally illuminated photobioreactors. We present methods for designing and optimizing the amplifier with respect to the boundary conditions given by a desired photobioreactor (PBR) setup. We discuss the source of losses and methods for their minimization.
The paper is structured as follows. In
Section 2, the internal illumination is motivated and our test systems are described. We explain why the class-E amplifier is especially suitable to power a loosely coupled system in
Section 3 and present a SPICE model for the simulation of an arbitrary number of receivers or WLEs.
Section 4 explains how the network elements are chosen appropriately. Simulation as well as measurement results are presented in
Section 5. Those results are discussed in
Section 6. Conclusions are drawn in
Section 7 and possible improvements are motivated.
2. Internal Illumination of Photobioreactors
The dominant growth affecting parameter for photoautotrophic microalgae cultures is light, which is absorbed by the microalgae and drives photosynthesis. This absorption leads to an exponential attenuation of the light intensity for increasing culture depths and cell densities according to Lambert-Beer’s law of extinction. This fact limits the photobioreactors to small diameter systems and hinders the development of industrial relevant scale ups. An overview on the light requirements in microalgal photobioreactors is, for example, given by Carvalho et al. [
25].
The idea of internally illuminated photobioreactors has come up in the 1990s and various systems have been developed since. Recently, the interest in these systems has been on the rise again, due to the increased production of and research on high-value products and recombinant proteins from microalgae and plant cell cultures. While promising results in lab-scale have been achieved, the potential of photoautotrophic or mixotrophic production of these compounds is limited due to the lack of scalable photobioreactors, which could be overcome by internally illuminated systems.
2.1. Earlier Approaches
An elaborate review on recent approaches is given in [
24]. Here, we only want to provide a short overview. Internally illuminated PBRs (IIPBR) can in principle be divided into two major categories: reactors which transport the light into the inside by light guides and reactors actually containing internal light sources. The reactors of the first type are characterized by some sort of light-collecting device outside the reactor and a light guide to transport the light to a radiator within the culture volume. Those kinds of IIPBRs can further be subdivided by the nature of the light-distributing device. It can either consist of optical fibers, optical plates or some other kind of structure. The second class is characterized by actually having a light source inside the reactor. There are different ways to classify these kinds of IIPBRs, for example by the type of light source being used (e.g., fluorescent lamps, metal halide lamps or LEDs). A further classification discriminates between static, built-in light sources and dynamic, mobile light sources. The latter is the most promising approach and has been the motivation for the development of WLEs.
2.2. Internal Illumination via WLEs
2.2.1. Construction of the WLE
The circuit of the WLE is a parallel connection of a receiving coil, a capacitor and a LED. The LED is a warm white Cree
® CLM3A in a PLCC2 package with an operating point
= 3.2 V,
= 20 mA. The peak forward current is
= 100 mA. Its color temperature is 3200 K and the typ. luminous flux is 3.9 lm. The coils are SMD SDR0403-100ML power inductors from Bourns
®. The inductance is
= 10 µH and the series resistance is
= 0.18 Ω. The value of the capacitance is
= 82 nF. This results in an eigenfrequency
depending on whether to take the series resistance into account. For the undamped circuit we get
= 176 kHz. The small series resistance has practically no influence on the resonance frequency, but has to be taken into account when dealing with loss aspects. The circuit has been encapsulated into an ethylene propylene diene monomer sphere, see
Figure 1.
The typical density of WLE distribution in our reactors is 125 WLEs per liter which results in an average pickup power density of 10 W/L. In an earlier publication, we have already presented measurements that show that for diameters larger than 5 cm, internal illumination is far more homogeneous than external illumination [
21].
2.2.2. Reactor and Driving Coils
Our demonstrator setup consists of an airlift reactor fabricated from glass. Its diameter is 300 mm and its height is 350 mm. In operation the reactor contains a maximum of 3000 WLEs, see
Figure 2c. The reactor is equipped with four driving coils consisting of 30 windings each.
The four coils are connected in parallel which gives a total inductance of
= 338 µH. Due to the relatively high frequency, Litz wire has to be used to reduce the skin effect. The penetration depth
due to the skin effect can be calculated by
where
is the electric conductivity and µ is the permeability of the medium. For copper wire, which has an electric conductivity of
= 56 MS/m, the penetration depth is 160 µm. Therefore, we use RUPALIT V155 consisting of 80 strands with a diameter of 100 µm each.
It must also be mentioned that eddy currents in saline water also have to be taken into account for larger diameters of the reactor. A medium which contains 3 g/L NaCl, as used for cultivating the green alga
Chlamydomonas reinhardtii, leads to an electric conductivity of the medium of
= 0.5 S/m. This results in a penetration depth of 1.69 m according to Equation (
2). It is even more important to look at the eddy current losses. According to Fiorillo [
26], the eddy current loss density
p in W/m
3 for sinusoidal fields can be calculated by
For the given geometry and medium, this results in a loss density
= 1690 W/m
3 and a total loss of 50.7 W in the 30 L volume reactor (
Figure 2c) with an assumed magnetic flux density
= 1 mT and a radius
= 150 mm.
3. The Principle of Loose Coupling with Multiple Receivers
A problem when dealing with multiple receivers occurs from the fact that the orientations of sending and receiving coils are not necessarily in parallel. There are several ways to solve this issue. The direction of the magnetic field vector could be rotated in space for example by using several sending coils [
27]. In addition, a set of three receiving coils is possible, a solution which consumes additional space in the receiver [
7]. We solved the problem by setting the center of mass in the lower part of the WLE, so that it is oriented automatically in the air lift.
3.1. Simulations on Topology Issues
In literature there is some discussion going on about the topology of primary and secondary circuit. Topology in this context refers to serial or parallel connection of the resonant elements. The authors of [
28] claim that serial connection on the secondary side is superior to parallel connection. We want to show in the following that this depends on the magnitude of the impedances of the used network elements. Kuipers et al. [
29] use a serial receiving circuit to drive a UV-LED from Nichia, type NSPU510CS. The allowed forward current is in the range of 20 to 80 mA at a typical voltage of 3.3 V. They use a
= 10 mH receiving inductance with a quality factor of 90 at their working frequency 45 kHz and parasitic series resistance of
= 1.26 Ω and a 1 nF capacitor. The sending inductance is
= 1.4 mH and the coupling factor is
= 0.02. The circuit for the described setup is depicted in
Figure 3.
A simple simulation reveals that the circuit in this form will not work as the resistance of the LED in reverse direction is too high.
There are two possibilities to improve the circuit. Firstly, a much larger capacitance can be chosen which will result in a non-resonant circuit. Due to the very large inductance of
= 10 mH, a peak current of 15 mA can be reached for an arbitrary capacitance value of 1 mF. In order to utilize the resonant properties with the original 1 nF capacitance, a series circuit as depicted in
Figure 4 has to be chosen for the right hand side. In this case, the simulation leads to a similar peak current of 16 mA. A further increase of the peak current can be achieved if the impedances of the inductance and the capacitance are decreased. A pairing of
= 1 mH and
= 10 nF will increase the peak current to over 50 mA.
It can be concluded that a parallel resonant circuit has to be chosen for the receiving side and that the impedances of L and C significantly influence the peak current.
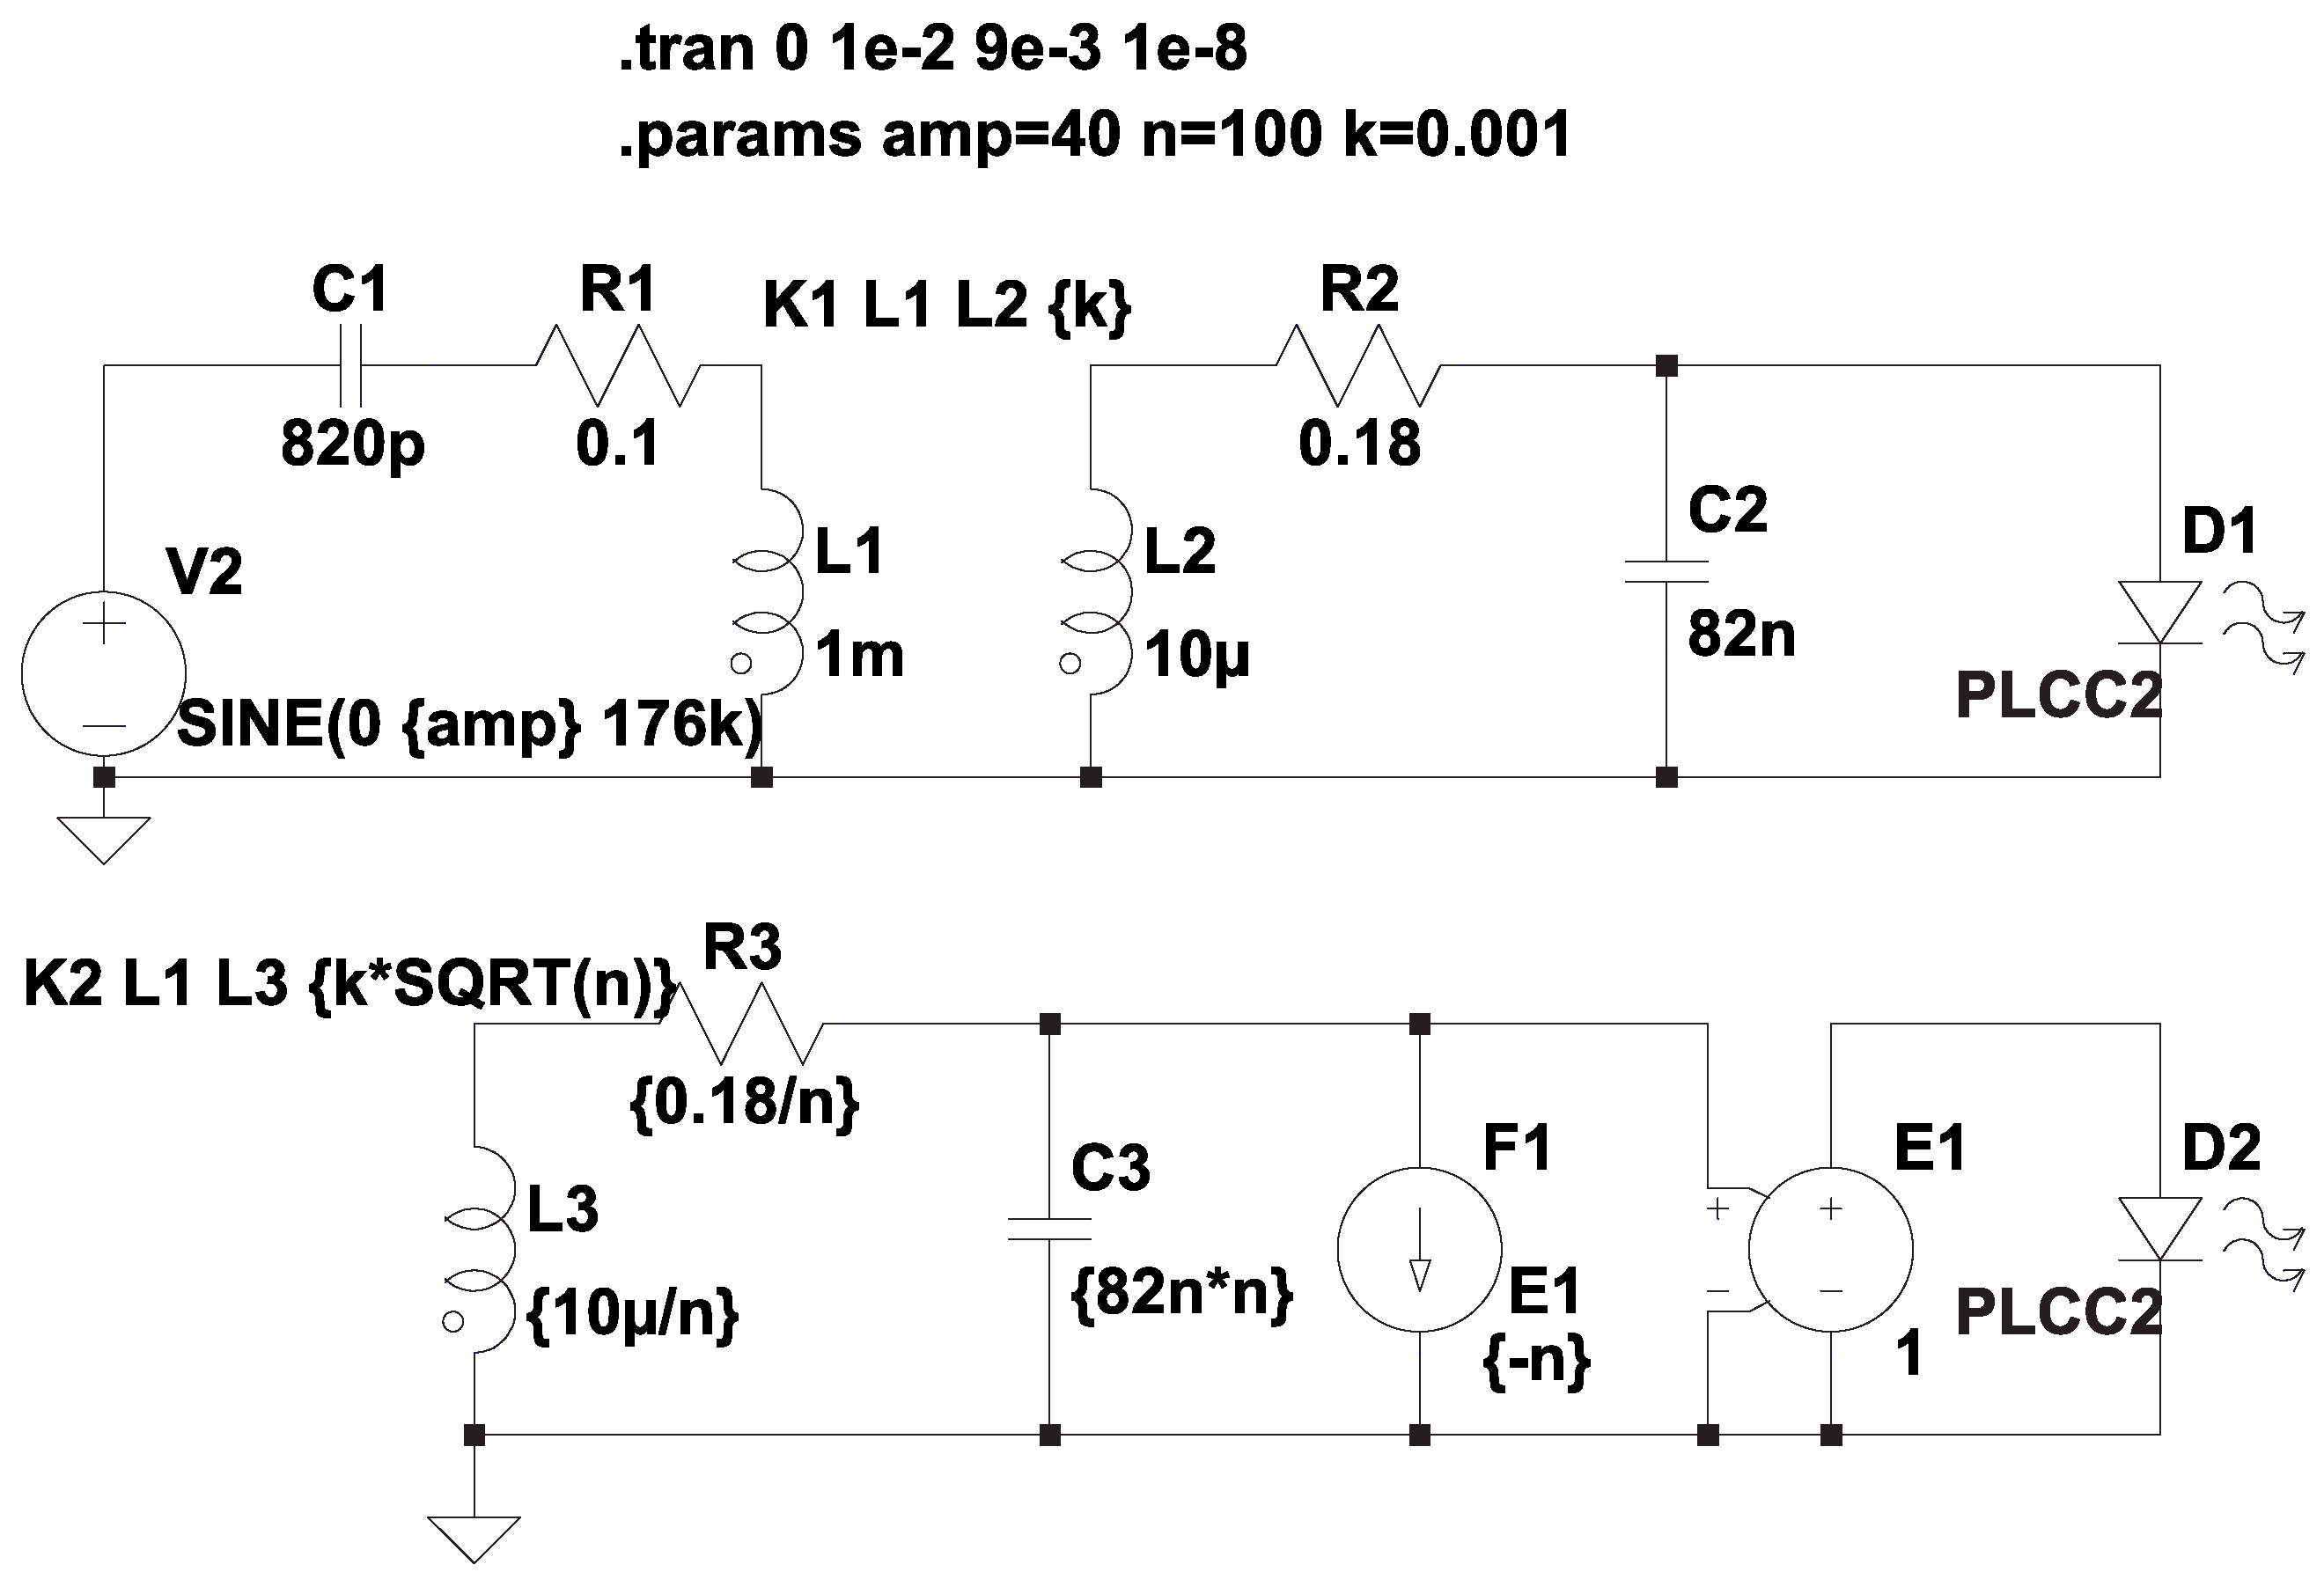
3.2. Simulations on Multiple Receivers
As we have up to 3000 receivers, the simulation of single receivers is not possible. Therefore, we want to find equivalent circuits for the receivers. Without loss of generality, we can draw all receivers to the same ground. Since the receivers are identical, we can assume the upper potential to be the same and we get a parallel connection of all receiver elements. The only restriction is that the coupling factor has to be equal for all receivers. This fact certainly does not model reality perfectly, but the coupling factor for a single receiver is hardly possible to determine anyways.
The equivalent network is given in
Figure 4. The parameter
n stands for the number of WLEs. The LEDs are models with part NSSW008CT-P1 from the LTSpice library, whose parameters are very similar to the characteristics in the Cree
® CLM3A datasheet.
The equivalent network elements are derived as follows. Let us assume a transformer with one primary inductance
(sending coil) and
n secondary inductances
(the WLEs). The secondary inductances do not couple among each other, but each has the mutual inductance
M with the primary side. This transformer can then be described by
where
and
are voltages and
and
are the currents on the primary and secondary side, respectively. If we draw all receivers to the same ground and if we can further assume that the upper potentials are equal, as motivated above, we can substitute the
n right-hand sides by an equivalent inductance
, which is flown through by the equivalent current
and which incorporates the mutual inductance
with the left-hand side. This equivalent transformer is described by the equations
By comparing Equations (
4) and (
5), one can express the equivalent network elements and values by the original ones
The coupling factor between the sending coil and each receiver is defined by
Using the equivalent elements from Equations (
6), the equivalent coupling factor can be written as
Furthermore, the parasitic series resistances of all receiver coils
are virtually put in parallel, so are the receivers’ capacitances
C. This results in equivalent elements
The fact that
n LEDs have to be put in parallel is modeled by the current controlled current source
, see
Figure 4, which multiplies the LED current by
n. The negative sign follows the current counting direction of the voltage source
. With this method, multiple WLEs can be taken into account simply by setting the parameter n in the SPICE parameter set.
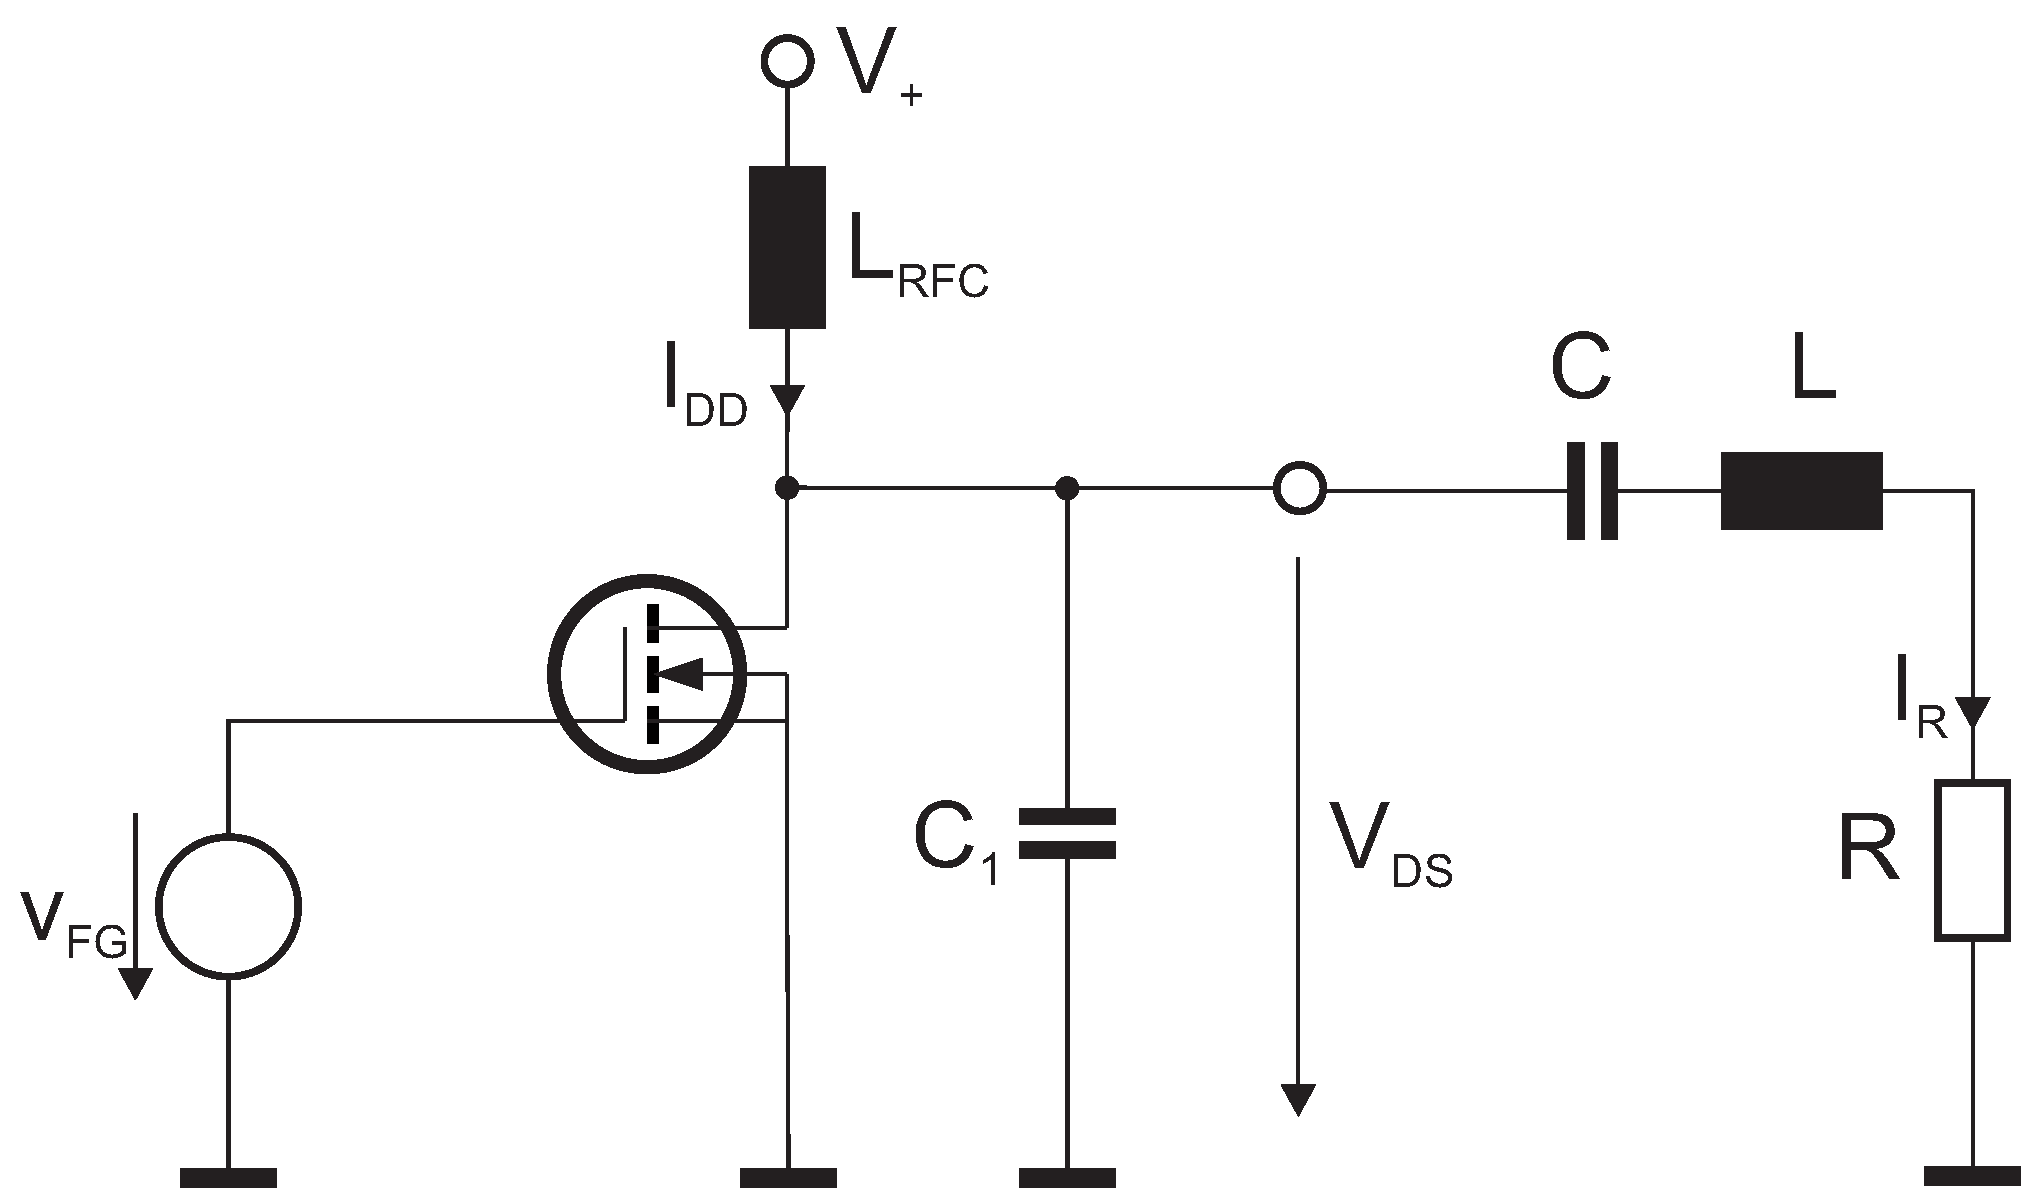
4. Tuning the Class-E Amplifier
The basic circuit for a class-E amplifier is given in
Figure 5. In the following, the equations for tuning the amplifier’s network elements are only briefly given, as the method and derivation of the equations have been described elsewhere [
30]. A duty cycle of 50% shall be fixed. The frequency
f, inductance of transmitting coil
L and required power
in the load are given.
The load
R models and replaces the total active load in
Figure 4. It has to be calculated from the active power pick up into
and is only valid for a specified working point, as is the following calculation. Therefore, the amplifier has to be tuned for a given working point. The angular frequency is
. The switch is opened at
and closed at
. The switching angle
describes the phase of output current
with respect to
. An optimal switching angle, which assures ZVS and ZDS, was found to be
With help of the optimal switching angle, the shunt capacitance
can already be determined
The capacitance
C can be calculated with the following equations, which have been derived in [
31]:
with
and
Furthermore, the amplitude of the output current
can be calculated
Another important parameter is the quality factor
which has to be high enough to assure sinusoidal current
. As a rule of thumb it can be stated that
Q shall be at least larger than five. For our reactors, we measured
(see Equations (
20) and (
21)), which makes the class-E amplifier especially suitable here.
In order to determine the requirements for the power source, the necessary source current
and voltage
are calculated by
Finally, the choke inductance
can be dimensioned to gain DC current
containing low ripple according to [
32]
where
denotes the allowed relative ripple.
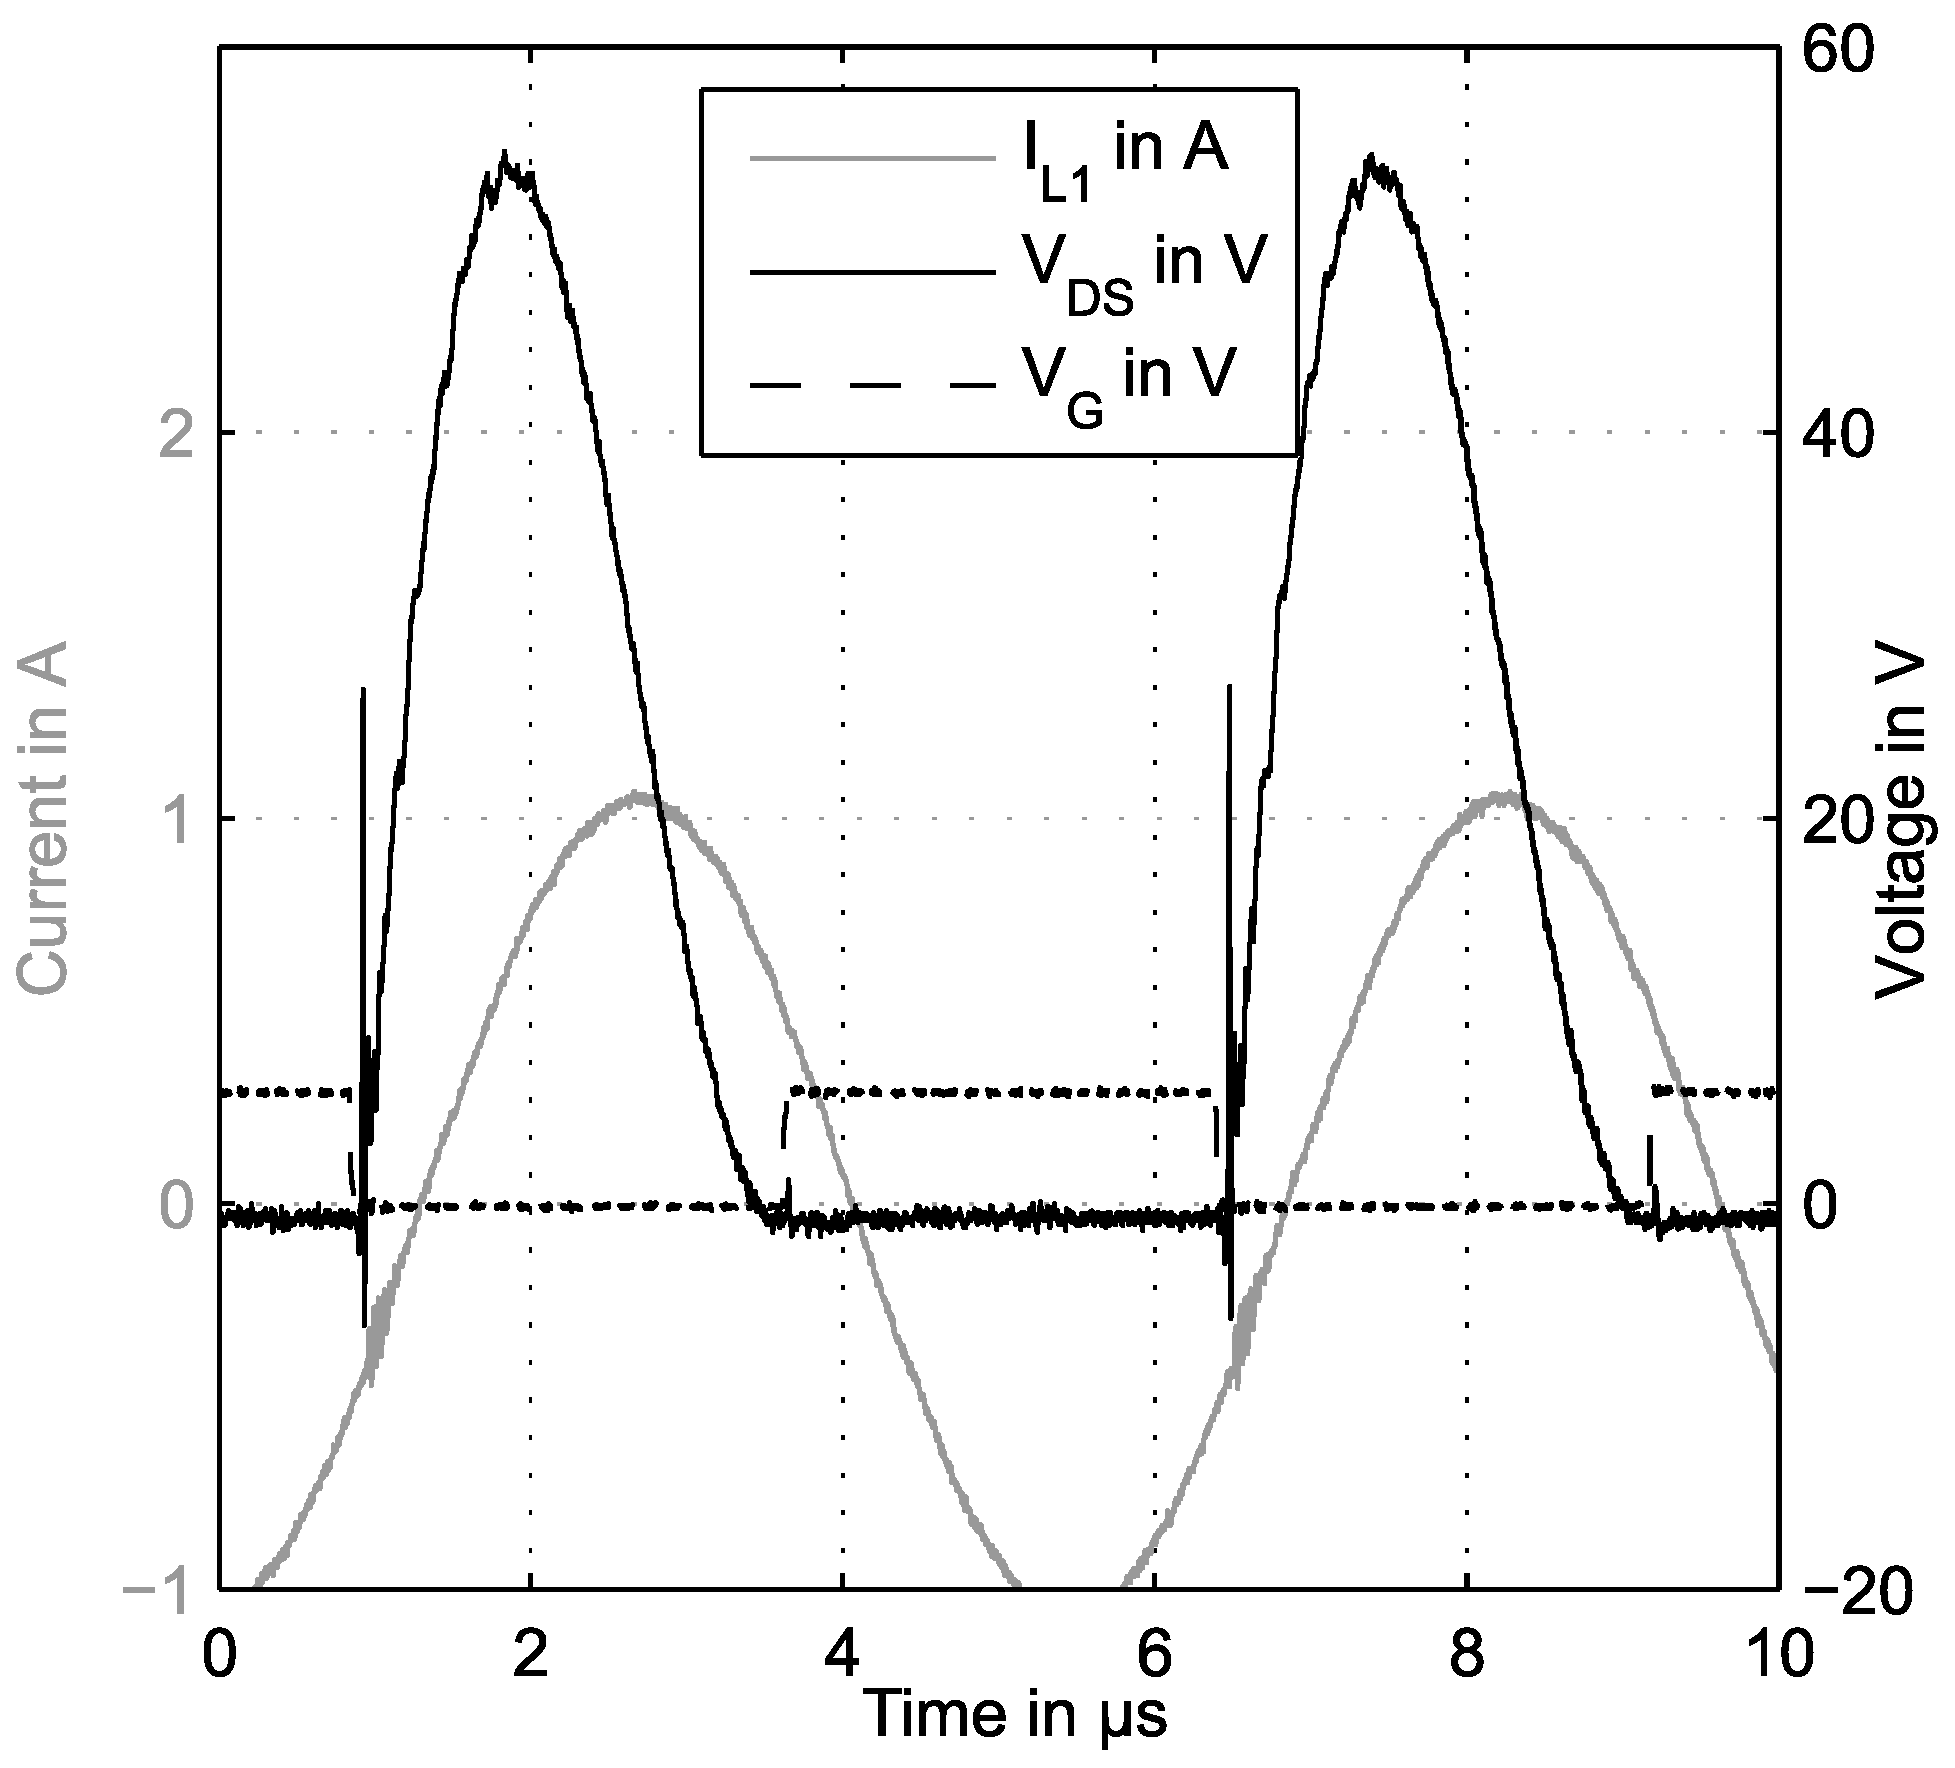
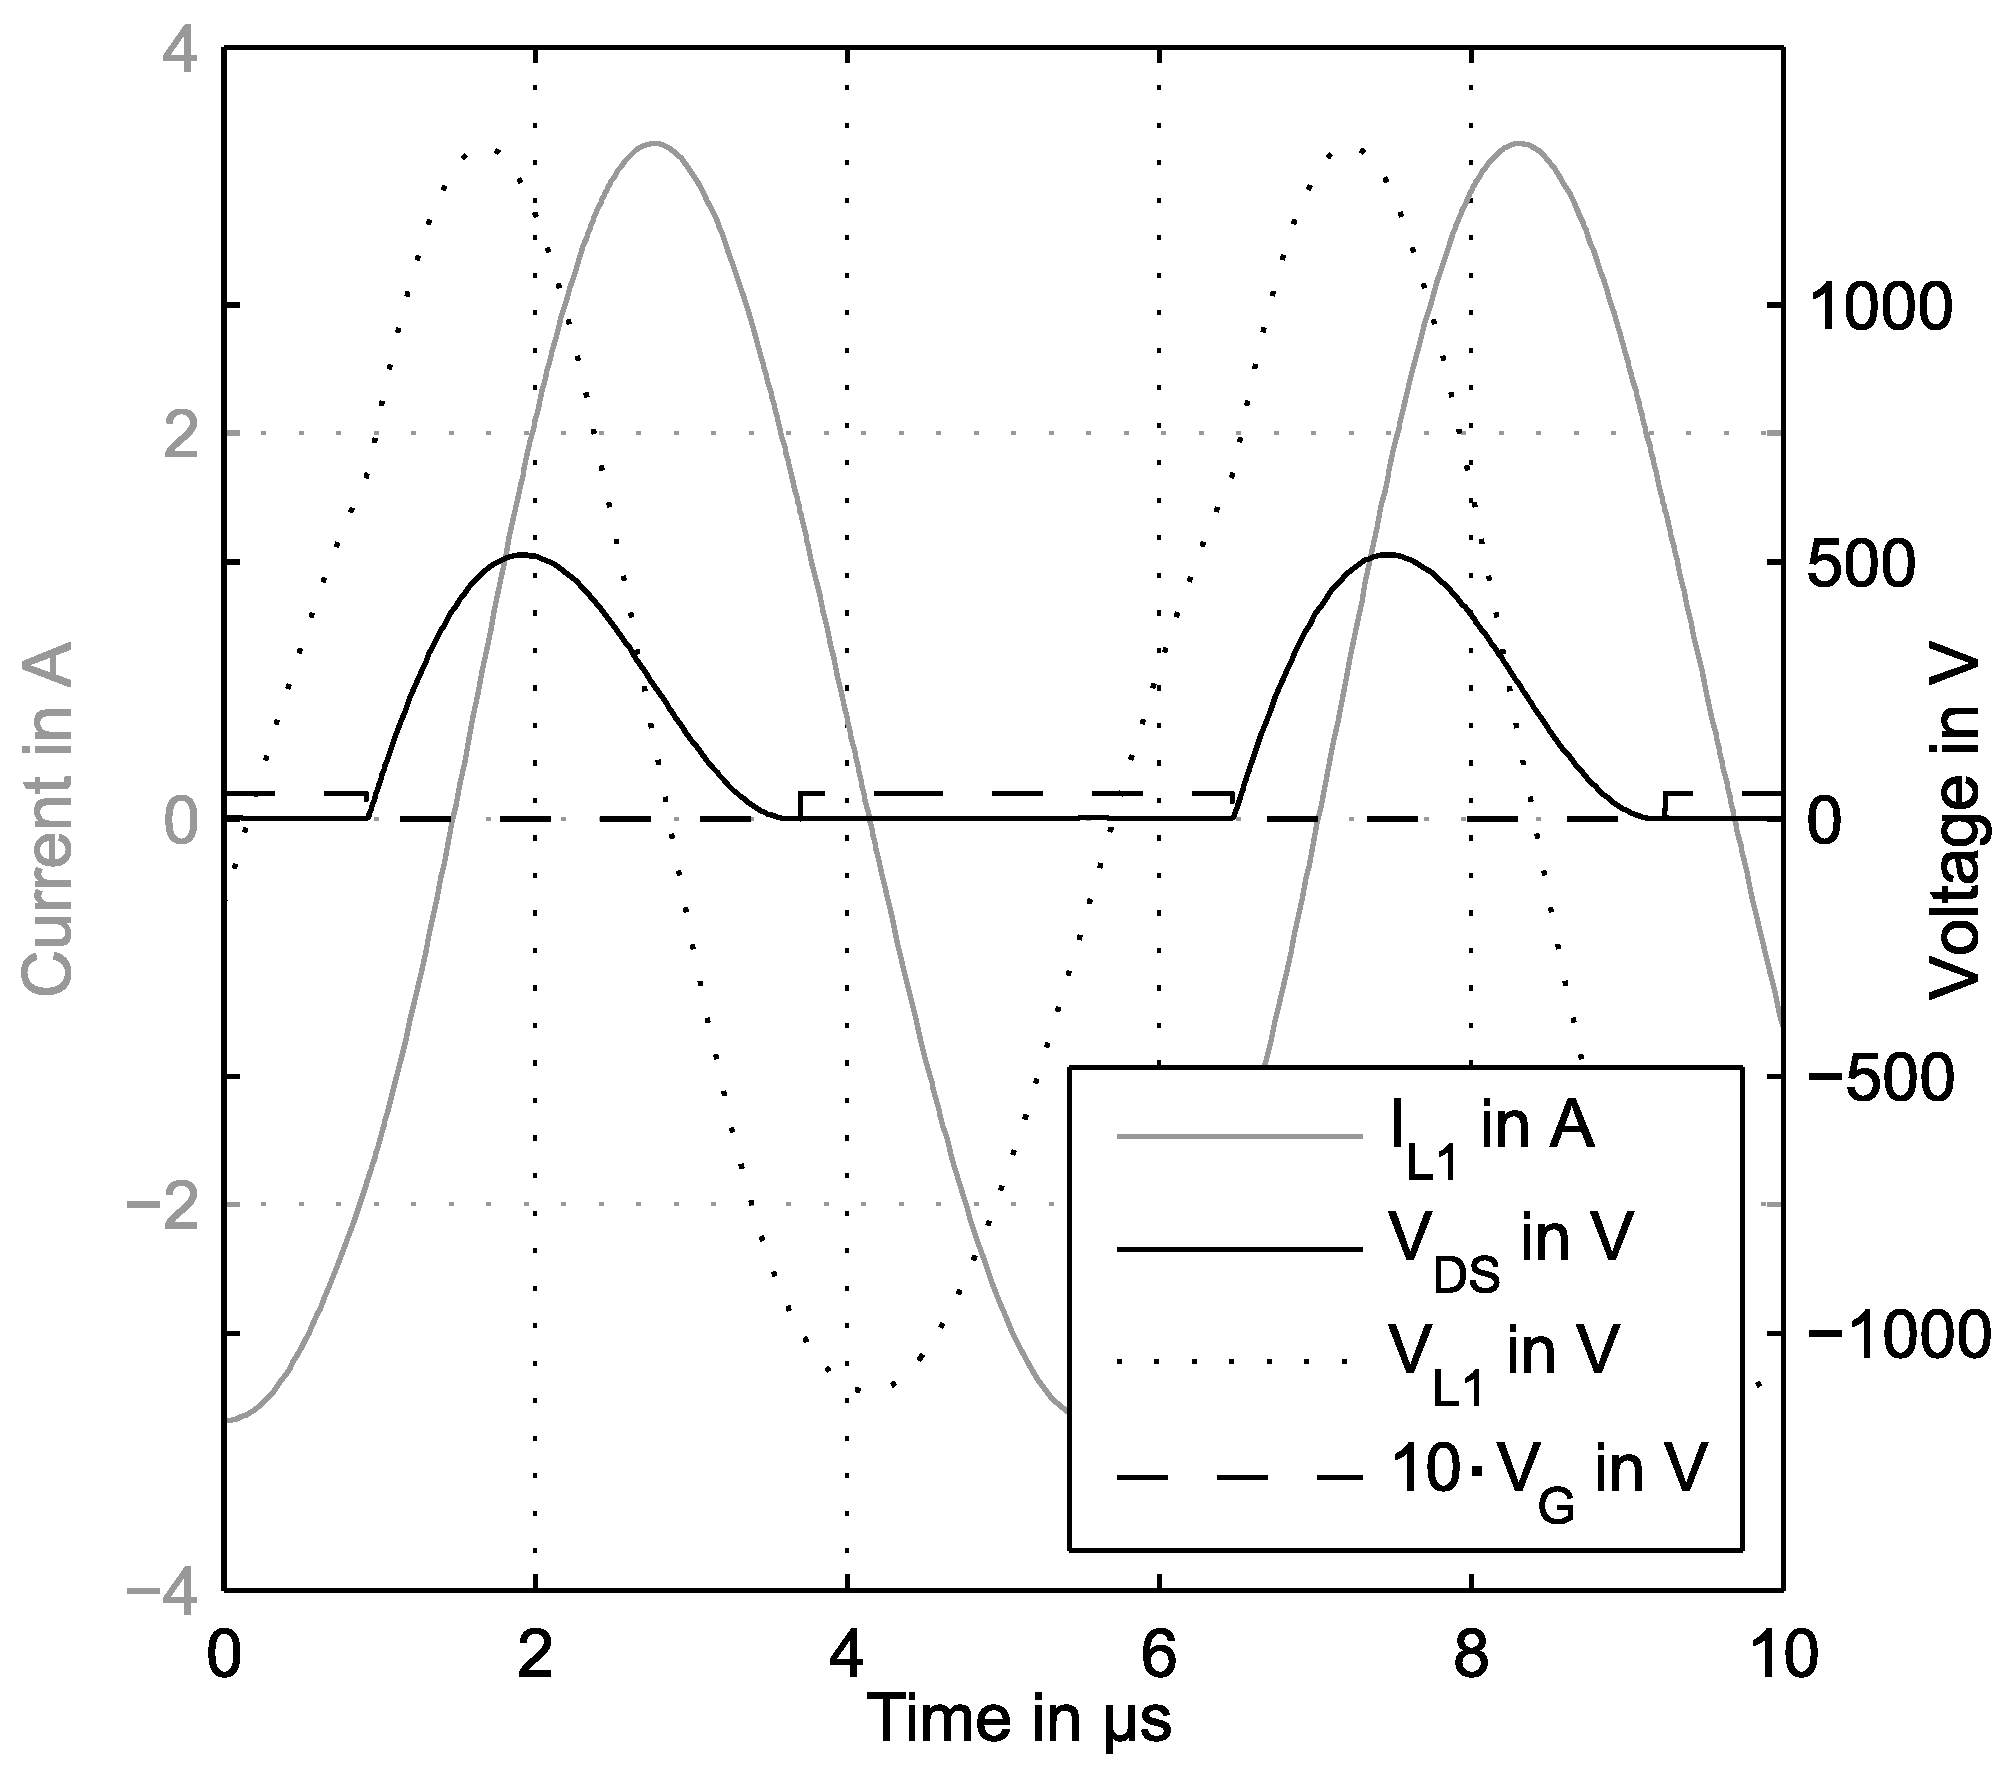
In order to demonstrate the concept, we have constructed two amplifiers with different maximum power . Amplifier #1 is based on the Transistor IRFB4019 from International Rectifier and allows a maximum drain-source voltage of 150 V. We reached a maximum power of 55 W. The amplifier #2 works with a IPW60R045 transistor from Infineon. The maximum drain-source voltage is 600 V and the on-resistance is extremely low at 45 mΩ. With amplifier #2 a maximum power of 300 W was reached.
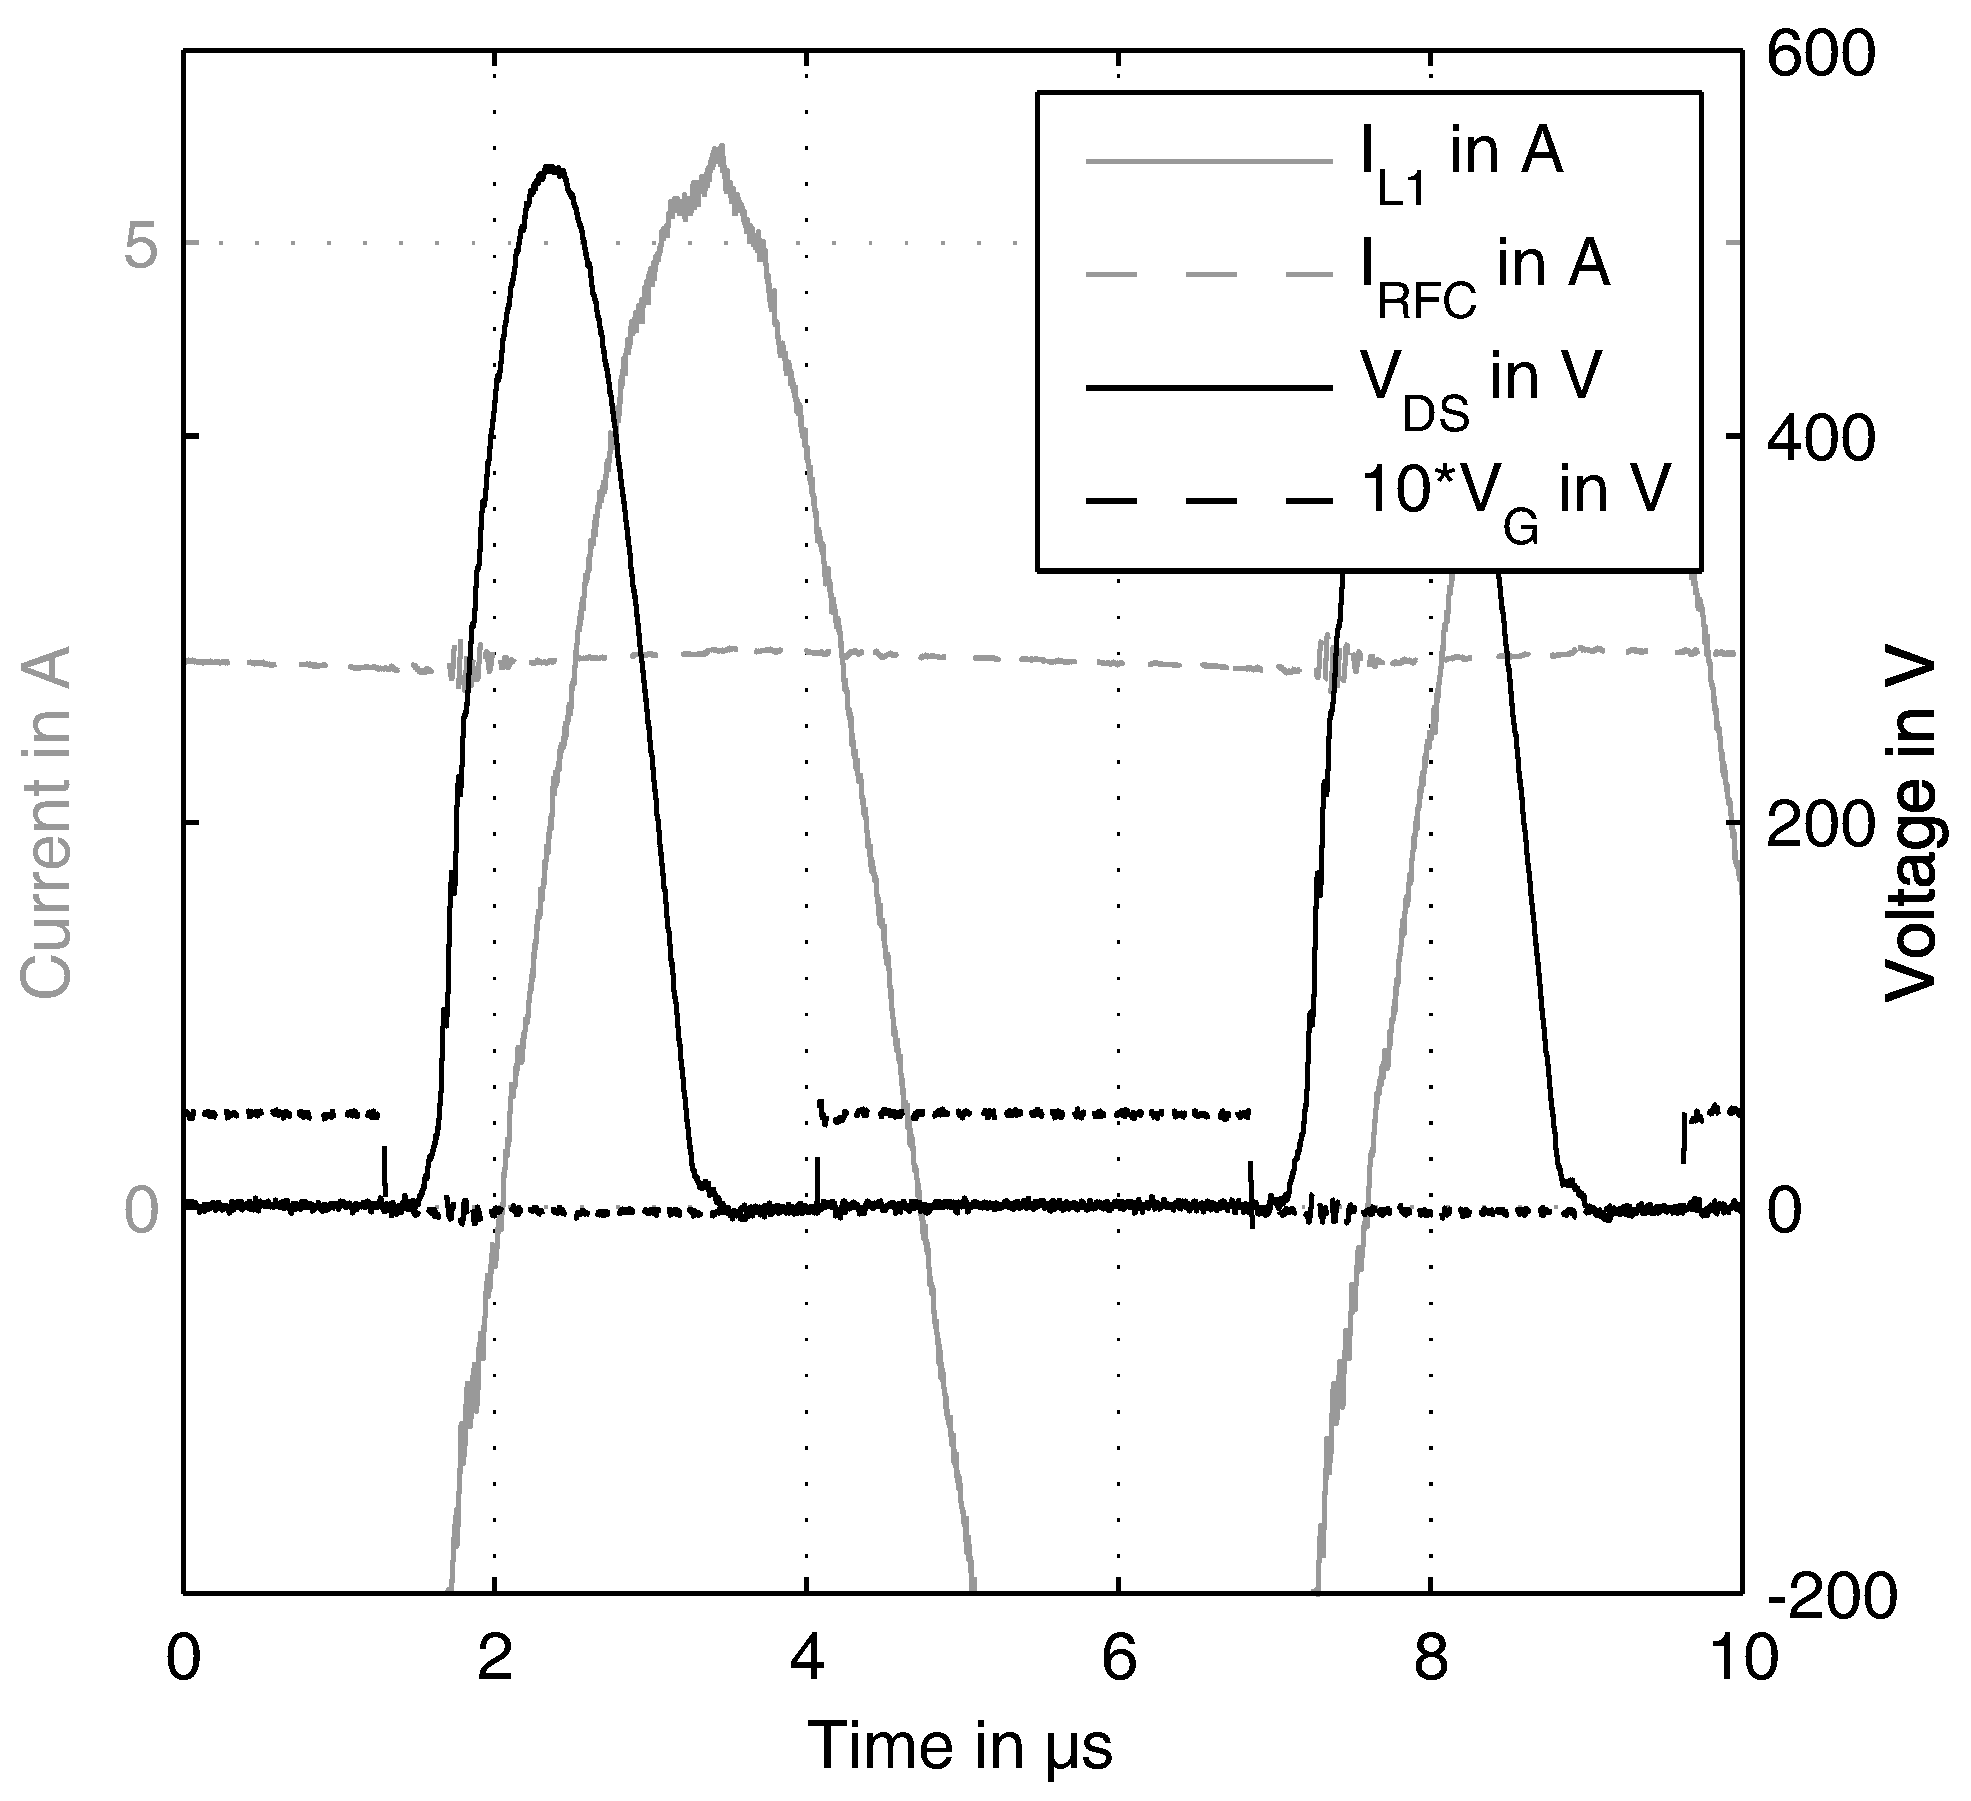
Figure 6 shows the simulation results for amplifier #1. The figure shows the important time signals. Especially the drain source voltage
is important to judge the tuning of the amplifier. The arrows indicate in which way the signal is influenced by increasing capacitances
C and
. The values for the tuned amplifier are
= 790.2 pF and
= 11.5 nF. For an intentionally mistuned example, the values have been changed to
= 785 pF and
= 10 nF.
6. Discussion
In order to judge the quality of the system, two values are calculated. Firstly, in order to characterize the amplifier itself, a pure electrical measure is taken, namely the efficiencies of the electric transformations. Secondly, the efficiency of the biomaterial production is determined by comparing our internally illuminated reactor to external illumination.
The measured power at plug socket (
), current source output (
), and driving coil input (
) are compared in
Table 1. The efficiency is calculated for the current source
and for the class-E amplifier alone
using the relations
Finally, the total efficiency is given. The maximum efficiency of the current source is in accordance to the manufacturer’s specifications.
The class-E amplifier has a maximum efficiency of 84.2%, which sums up to a total maximum efficiency of 76.7% for an active power value of = 255 W at the reactor coils.
This means that a good efficiency can be realized despite the fact that the system is very loosely coupled, which lies in its nature. Only a higher density of WLEs, i.e., number of WLEs per volume, would increase the coupling, but the WLE density and the desirable light intensity for algae is limited. As stated in [
24], higher light intensity leads to photoinhibition and, therefore, reduces bio-efficiency. The strength of the coupling can be quantified by calculating the power factor for the series connection of
R and
L in the simplified circuit in
Figure 5. With the active power
= 255 W and the current RMS value
= 3.75 A (
Figure 12), the equivalent resistance
is found to be 18.2 Ω. The coil impedance is calculated by
and found to by 382 Ω. Therefore, the power factor
is as low as 0.048.
A comparison of the bio-efficiency of internal and external illumination is given in
Figure 13. It shows bio dry weight
vs. cultivation time for two internally and three externally illuminated cultures. The bio dry weight is determined by washing and filtering part of the culture. The expended electric power has been kept constant for both illumination types in order to guarantee comparability. For the smallest reactor diameter 50 mm, the external illumination gives slightly better results. The reason is that the Lambert-Beer damping is not yet significant at such small diameter and that we have some electrical losses regarding the wireless power transfer. At a diameter of 150 mm, the internal illumination is already superior. Even for the 300 mm diameter reactor, the growth rate stays constant using internal illumination. This proves that the system is suitable for scale-up. An experiment in the 300 mm reactor with external illumination has been omitted, because the expected growth rate would be very small.
Another topic that has to be taken into account is the impact of intermediate frequency electromagnetic fields (IF-EMF) on organisms [
33]. It is also important to note that if our bioreactor is operated unshielded, the stray field is within health and safety limitations [
34]. Nevertheless, magnetic shielding might be a future issue [
35]. The influence of static fields on algae and other microorganisms has already been studied [
36,
37]. The influence of IF-EMF on algae growth is less understood, but there are no hints of any negative impact [
38].
A comparison of our amplifier-reactor combination with other systems is hardly possible, as it is difficult to find similar problems in literature (very loose coupling, numerous receivers). The authors of [
11], for example, report about efficiencies of their electric vehicle charging system including a class-E amplifier of up to 88.4%. However, they also proved that small variations of parameters like air gap or vehicle position have great influence on efficiency.
7. Conclusions
This paper discusses a novel concept for the internal illumination of photobioreactors. The novel internal illumination concept showed cultivation results for microalgae C. reinhardtii that clearly prove it to be superior to classical external illumination. By comparing bio dry weights of externally and internally illuminated reactor, the suitability of our system for scale-up could be proved. It could further be shown that the class-E amplifier concept suits well for a system with such a high degree of reactive power. In spite of the high amount of reactive power, large efficiency could be reached.
The aim of the novel internal illumination concept is to utilize standard reactor types as photobioreactors. Therefore, the field coil optimization method will have to be extended. Even reactors containing electrically conductive materials are an option. Consequently, further tasks which have to be investigated are field coils for different reactor geometries, and the use of ferrites for shielding. The position of shielding material can also be incorporated into the optimization process. Another challenge is the design and construction of 3D coils for the generation of rotating field vectors.


