Article

Improved Perturb and Observation Method Based on Support Vector Regression

School of Optical and Electronic Information, Huazhong University of Science and Technology, 1037 Luoyu Road, Wuhan 430074, China
*
Author to whom correspondence should be addressed.
Energies 2019, 12(6), 1151; https://doi.org/10.3390/en12061151
Submission received: 17 January 2019 / Revised: 25 February 2019 / Accepted: 18 March 2019 / Published: 25 March 2019

Abstract

:
Solar energy is the most valuable renewable energy source due to its abundant storage and is pollution-free. The output power of photovoltaic (PV) arrays will vary with external conditions, such as irradiance and temperature fluctuations. Therefore, an increase in the energy conversion rate is inseparable from maximum power point tracking (MPPT). The existing MPPT technology cannot either balance the tracking speed and tracking accuracy, or the implementation cost is too high due to the complexity of the calculation. In this paper, a new maximum power point tracking (MPPT) method was proposed. It improves the traditional perturb and observation (P&O) method by introducing the support vector regression (SVR) algorithm. In this method, the current maximum power point voltage is predicted by the trained model and compared with the current operating voltage to predict a reasonable step size. The boost DC/ DC (Direct current-Direct current converter) convert system applying the improved method and the traditional P&O was simulated in MATLAB-Simulink, respectively. The results of the simulation show that compared with the traditional P&O method, the proposed new method both improves the convergence time and tracking accuracy.

1. Introduction

Solar energy is the most valuable renewable energy source due to its abundant storage and is pollution-free. PV technology is an essential pillar for transforming our energy systems into one based on renewable and sustainable energy sources [1]. The increase in global power generation was driven by strong expansion in renewable energy, led by wind (17%, 163 TWh) and solar (35%, 114 TWh) sources. Although wind has maintained its role as the more established sustainable energy source, solar energy has recently has much impact. PV systems have largely penetrated the global energy market. In particular, solar capacity increased by nearly 100 GW in 2017, with China increasing by over 50 GW [2]. In 2017, the global solar PV capacity was 402 GW, with the largest proportions being China’s 131.1 GW, followed by the USA’s 51.0 GW, Japan’s 49 GW, and Germany’s 42.4 GW [3]. Global solar generation increased by more than a third last year. Much of this growth continues to be underpinned by policy support. However, it has been aided by continuing falls in solar costs, with auction bids of less than 5 cents/KWh—which would have been unthinkable for most projects even just a few years ago—now almost common place. However, photovoltaic power generation still faces the problem of low energy conversion rates. The output power of photovoltaic (PV) arrays vary with external conditions, such as irradiance and temperature fluctuations. Therefore, an increase in the energy conversion rate is inseparable from maximum power point tracking (MPPT).
At present, much research has focused on improving the tracking performance of MPPT. Among them, the perturb and observation (P&O) method is widely used and studied due to its simple implementation and low sensor requirements [4]. The efficiency of increment conductance (INC) is roughly the same as that of the P&O [5]. However, the common disadvantage of P&O and INC is that both the tracking speed and tracking accuracy cannot be achieved at the same time with a fixed step size. Fuzzy logic control (FLC) can use inaccurate inputs without an accurate mathematical model [6], but its effectiveness depends very much on the selection of the correct error calculation and the proposed rule base [7,8], which means that the implementation cost is large. In recent years, swarm-based randomness algorithms, such as the gray wolf optimization algorithm (GWO) and artificial fish swarm algorithm (AFSA), have also been proposed [9,10]. Although techniques developed based on randomness can guarantee successful tracking of the global maximum power point (MPP) under partial shading conditions, they require a large number of iterations to locate the maximum power point, which greatly increases computational complexity and requires more memory. The main challenges of all swarm-based technologies are the search space selection, swarm size, initial conditions, and control parameters. The choice of control parameters is related to the specific problem and affects the computational behavior of the optimization algorithm [11]. Furthermore, neural networks and artificial neural networks (ANNs) based on artificial intelligence methods have been developed for tracking under minimal oscillations near MPP [12]. ANNs can provide accurate MPPT at a faster rate of convergence [13,14]. Nevertheless, the parameters of ANNs need to be tested and recorded over the years, and along with strong data dependencies, high computational complexity, and long computational time, the high implementation cost of ANN has followed [15]. Furthermore, many large inverter manufacturers currently have some efficient solutions in the MPPT control scheme. For example, the dynamic peak manager applied to Fronius Symo is a new MPP tracking algorithm that dynamically adapts its behavior when searching for the optimal operating point. Its special feature is that the dynamic peak manager automatically checks the entire characteristic curve on a regular basis and finds the global maximum power point (GMPP), even in partial shade. Additionally, the MPP adaptation efficiency of the Fronius Symo series is greater than 99.9% [16].
As the performance requirements of MPPT have increased, improvements based on traditional methods have also emerged. Many of these are improvements based on the P&O method. Some studies focus on the problem of convergence speed when climatic conditions change rapidly. For example, Rana Ahmed et al. used state flow as a control tool to improve the P&O method, and the state of the system changes according to the authenticity of the defined conditions. Similar to fuzzy logic control, this method requires the utilization of a truth table to specify the relationship between the input/output and the state of a finite state, which is highly dependent on the truth table [17]. There are also some efforts to reduce the oscillation near the MPP by developing a variable step size [18]. Based on this idea, Al-Amoudi et al. proposed a method of adjusting the step size according to the open-circuit voltage: Setting the initial step size to 10% of the open-circuit voltage, and then halved one by one until the step size reaches 0.5% of the open-circuit voltage [19]. Obviously, this adjustment of the step size relies heavily on a fixed open circuit voltage, which makes it prone to misjudgment when the external illumination changes rapidly.
Support vector regression (SVR) is a type of support vector machine (SVM) algorithm, which was first proposed by Vapnik et al., belonging to supervised learning algorithms [20,21]. SVR can be used to solve regression problems. One of the most significant advantages of SVR is the ability to achieve a good estimate of statistical laws based on a small number of statistical samples. Compared with FLC and ANNs, SVR has a shorter learning time, lower data dependence, and easier implementation.
The work of this article will focus on the improvement of traditional P&O. The SVR algorithm was applied to quickly and accurately predict the step size of the perturbation, improving the tracking performance of MPPT with limited computational complexity.
The main contents of the article are as follows: In Section 2, an 8S4P (four parallel paths, consisting of eight series connected cells) PV array circuit is designed, and an SVR model is trained and tested through the training and testing data set obtained by simulating the PV array, then, the modified P&O MPPT algorithm, including its principles and simulation module, is introduced in this section. In Section 3, the simulation results about the tracking performance of the fixed and modified P&O MPPT method are presented. Finally, Section 4 provides a discussion about the simulation results in Section 3.

2. Materials and Methods

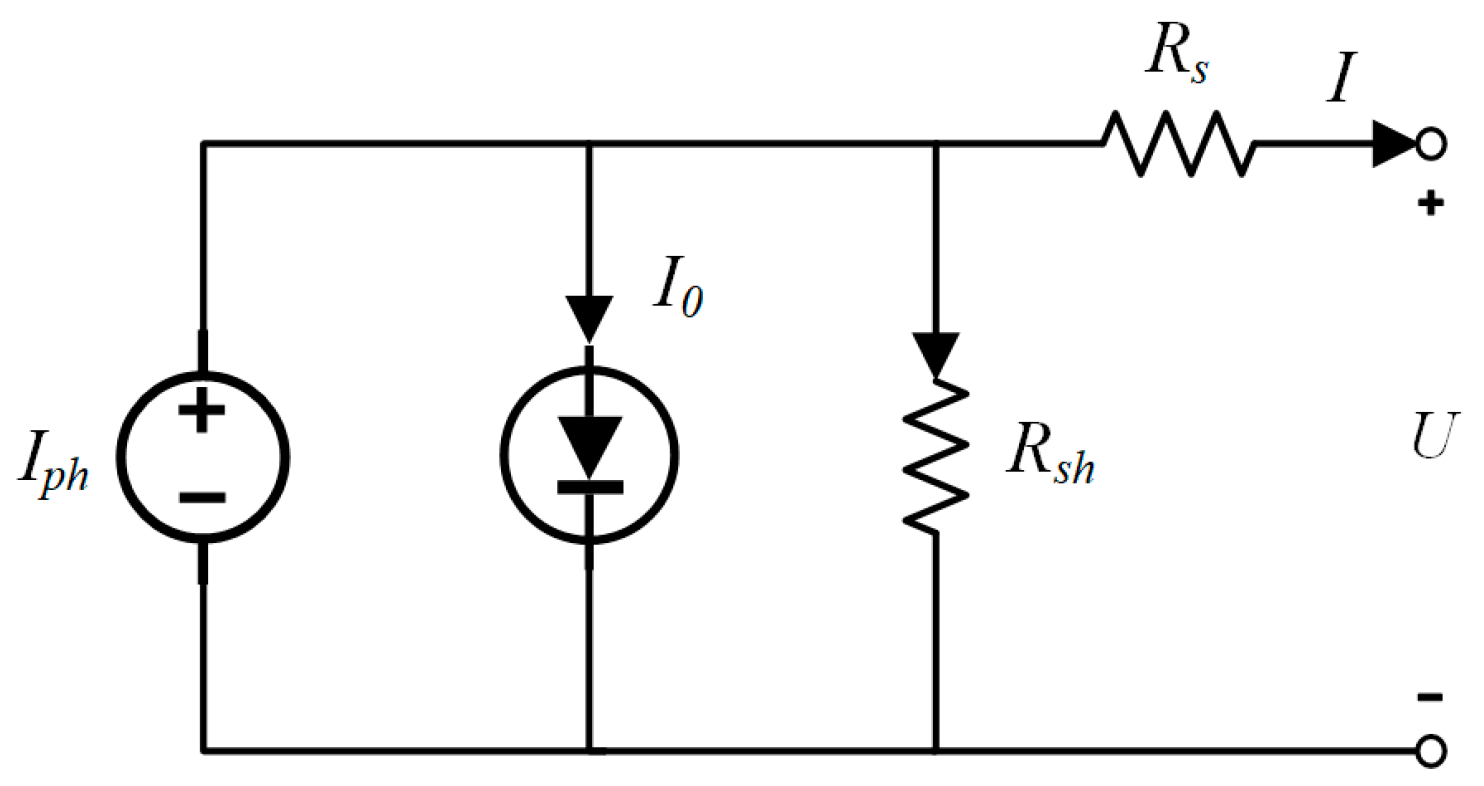
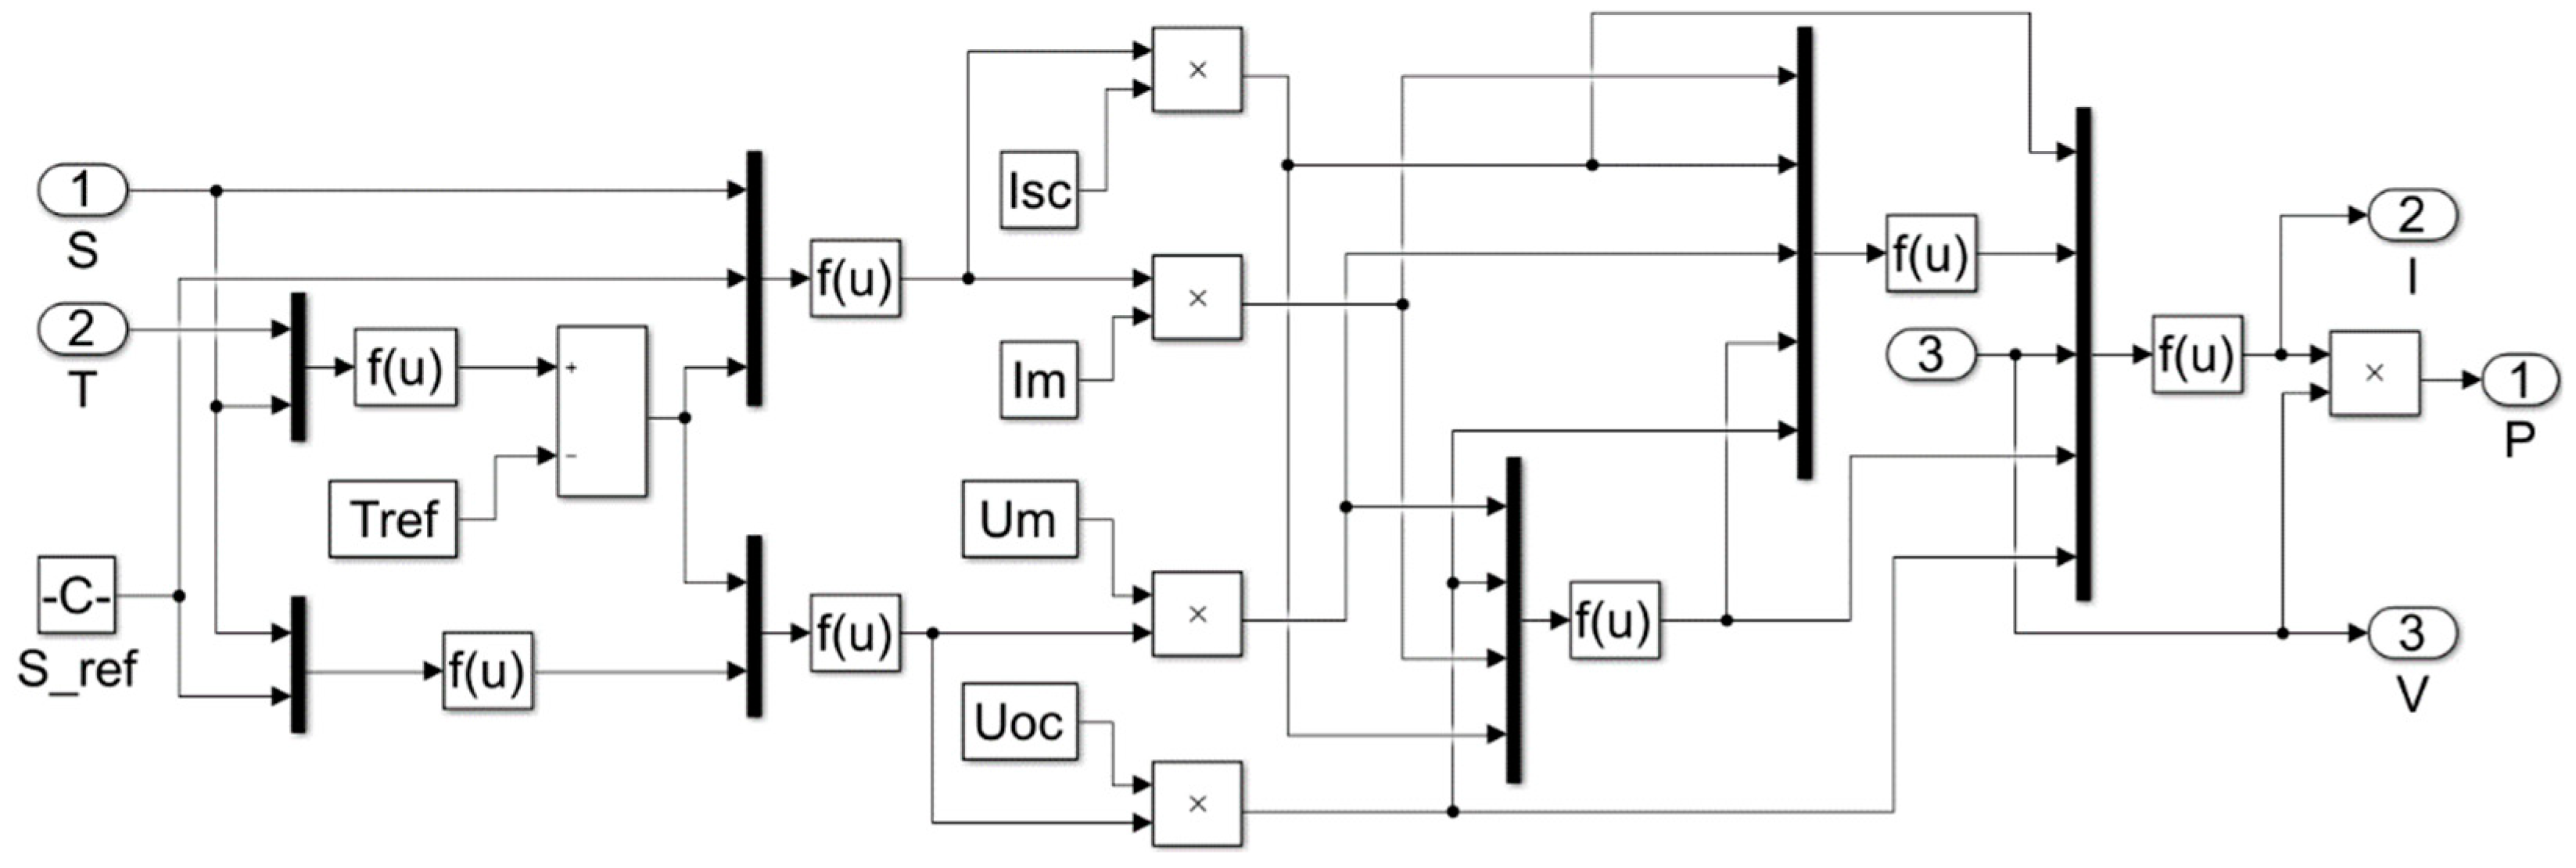
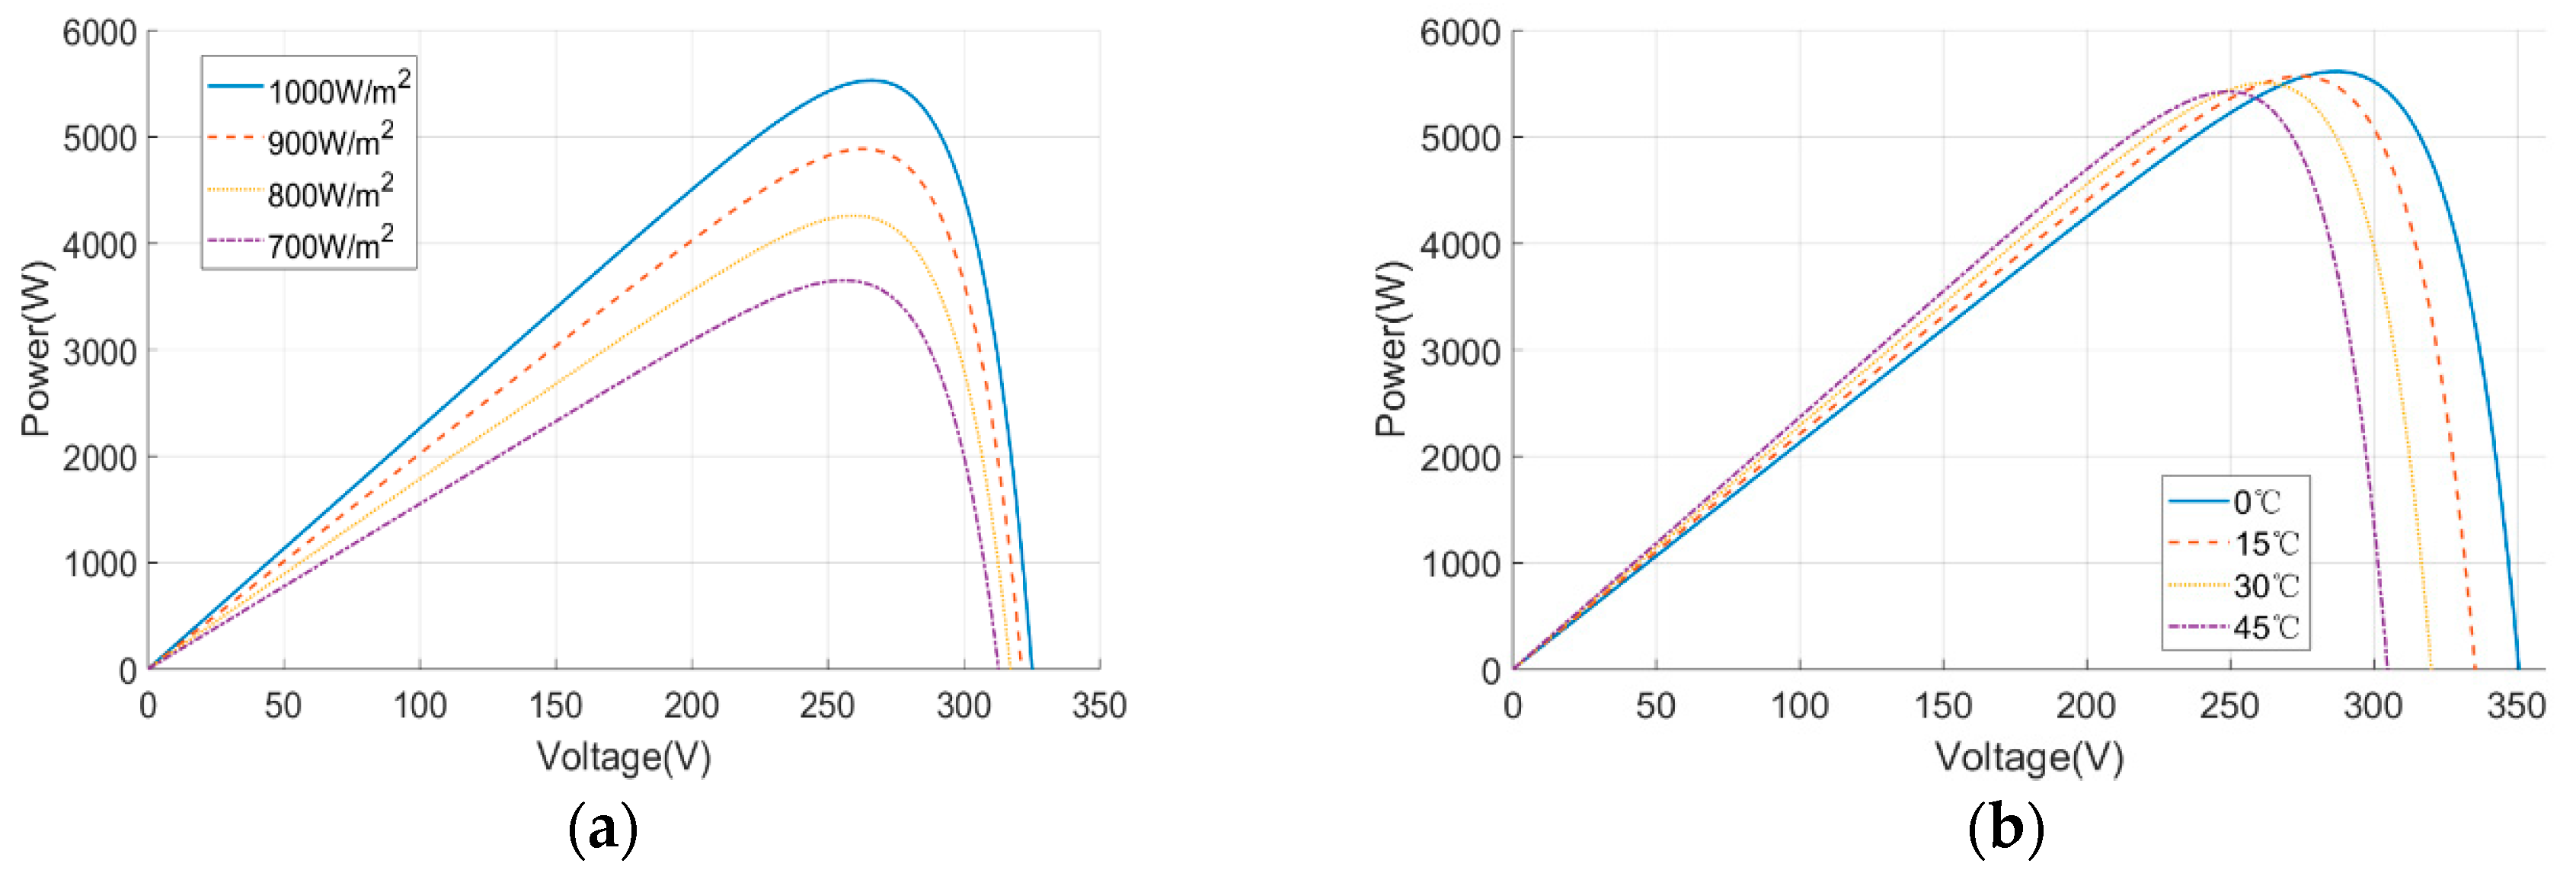
2.1. PV Array Modeling

A PV array is a combination of a series of PV cells. The simplest equivalent circuit of a PV cell is shown in Figure 1. The equivalent circuit includes a photocurrent, I p h , and a diode [22]. The diode indicates the nonlinear relationship between the voltage and current of the PV cell. In addition, to simulate the internal loss of the battery, a series resistance, R s , and a shunt resistance, R s h , are added in the circuit [23,24].
According to Figure 1, the characteristic equation describing the PV cell can be obtained:
I = I p h I 0 [ exp ( q ( U + I R S ) A k T ) 1 ] U + I R s R s h
where, I p h is photocurrent, which is related to the irradiance intensity, S , and temperatures, T :
I p h = ( S S r e f ) [ I p h , r e f + C T ( T T r e f ) ]
In addition, I 0 is the reverse saturation current of the diode; A is the diode ideality factor usually between 1 and 2, indicating the electron carrying capacity of the p-n junction; k is the Boltzmann constant, 1.38 × 10⁻²³ J/K; T is the PV cell temperature in Celsius; q is an electron charge 1.6 × 10⁻¹⁹ C; S r e f is the reference irradiance intensity at 1000 W/m2; and T r e f is the reference PV cell temperature at 25 °C. I p h , r e f is the photocurrent under standard test conditions (STC), and C T is the temperature coefficient, here taken as 0.00255 °C−1.
Considering that the value of R s h is usually much larger than R s in practical applications, Equation (1) is simplified to:
I = I s c { 1 C 1 [ exp ( U C 2 U o c ) 1 ] }
In Equation (3):
{ C 1 = ( 1 I m I s c ) exp ( U m C 2 U o c ) C 2 = ( U m U o c 1 ) / ln ( 1 I m I s c )
where among them, I m and U m are the current and voltage corresponding to the maximum power point, U o c and I s c are the open-circuit voltage and short-circuit current of the photovoltaic cell.
An 8S4P PV array circuit mainly composed of function modules is shown in Figure 2. Thirty-two PV cells connected in four parallel paths, each path consisting of eight series connected cells. Where, I m , U m , U o c , and I s c are corrected considering that the PV array typically operates under non-standard test conditions.

2.2. Training and Testing SVR Model

After simulating the constructed PV array, nonlinear power-voltage (P-V) characteristics are obtained as shown in Figure 3.
It can be seen from Figure 3 that when the temperature is a particular value, the open-circuit voltage and short-circuit current of the output curves are different; that is, each group of the open-circuit voltage and short-circuit current have a one-to-one correspondence, and the corresponding maximum power point voltage is also unique. According to this characteristic, the current open-circuit voltage and the short-circuit current value can be obtained to judge the output characteristic curves of the PV array in the current environment, and the maximum power point voltage can be quickly found without using the irradiance and the temperature sensor, thereby determining the step size of the P&O method. Therefore, the open-circuit voltage, short-circuit current, and maximum power point voltage can constitute the training set and testing set of SVR. It is worth noting this considering that a large amount of different actual data cannot be measured in a short time. The training and testing of the model requires a large amount of data in various weather conditions. Due to the limitations of the current conditions, a sufficient amount of real data cannot be obtained. To successfully verify the proposed method, we used the data obtained from the simulation instead of the real data for the training and testing of the model. This paper will use the results of the above PV array for simulation instead of the actual measured data as the data set of the SVR. The simulation was done in a series of realistic irradiance and temperature conditions.
It is worth mentioning that the training and test data are obtained under uniform irradiation. The peak power is uniform under uniform irradiation, which helps the modified P&O MPPT method to track the maximum power point based on the current voltage values and current values. The multiple peak powers will occur under non-uniform irradiation. The MPPT method used in this paper is still a P&O method, although it realizes the intelligent prediction of the step size. Therefore, it will be lost in one of the peak power points and fail to guarantee successful tracking of the global MPP, resulting in a significant reduction of both the generated power and the PV energy production system reliability [25,26]. Therefore, the simulation to verify the tracking performance of the SVR method is also performed under uniform irradiation.
The LIBSVM package developed by the team of Lin Chih-Jen is used to train and test SVR model. The package combines the algorithms of the SVM-light and SMO, and optimizes the shrinking mechanism to make it not only simple, easy to use, fast, and efficient, but also provides many default parameters [27]. The training parameters are set as shown in Table 1.
In the training process, the simulated training data set is taken as the input. After grid search and cross-validation, the SVR model with the highest accuracy is obtained. Then, the obtained model is tested with the test data set. An attribute matrix consisting of the open-circuit voltage and short-circuit current is used as an input to the model. The predicted value of the output is compared with the actual value of the test set to obtain an error rate for validating the performance of the model. The testing results show that the prediction error rate of the model is below 0.1%, indicating that the model fits well.

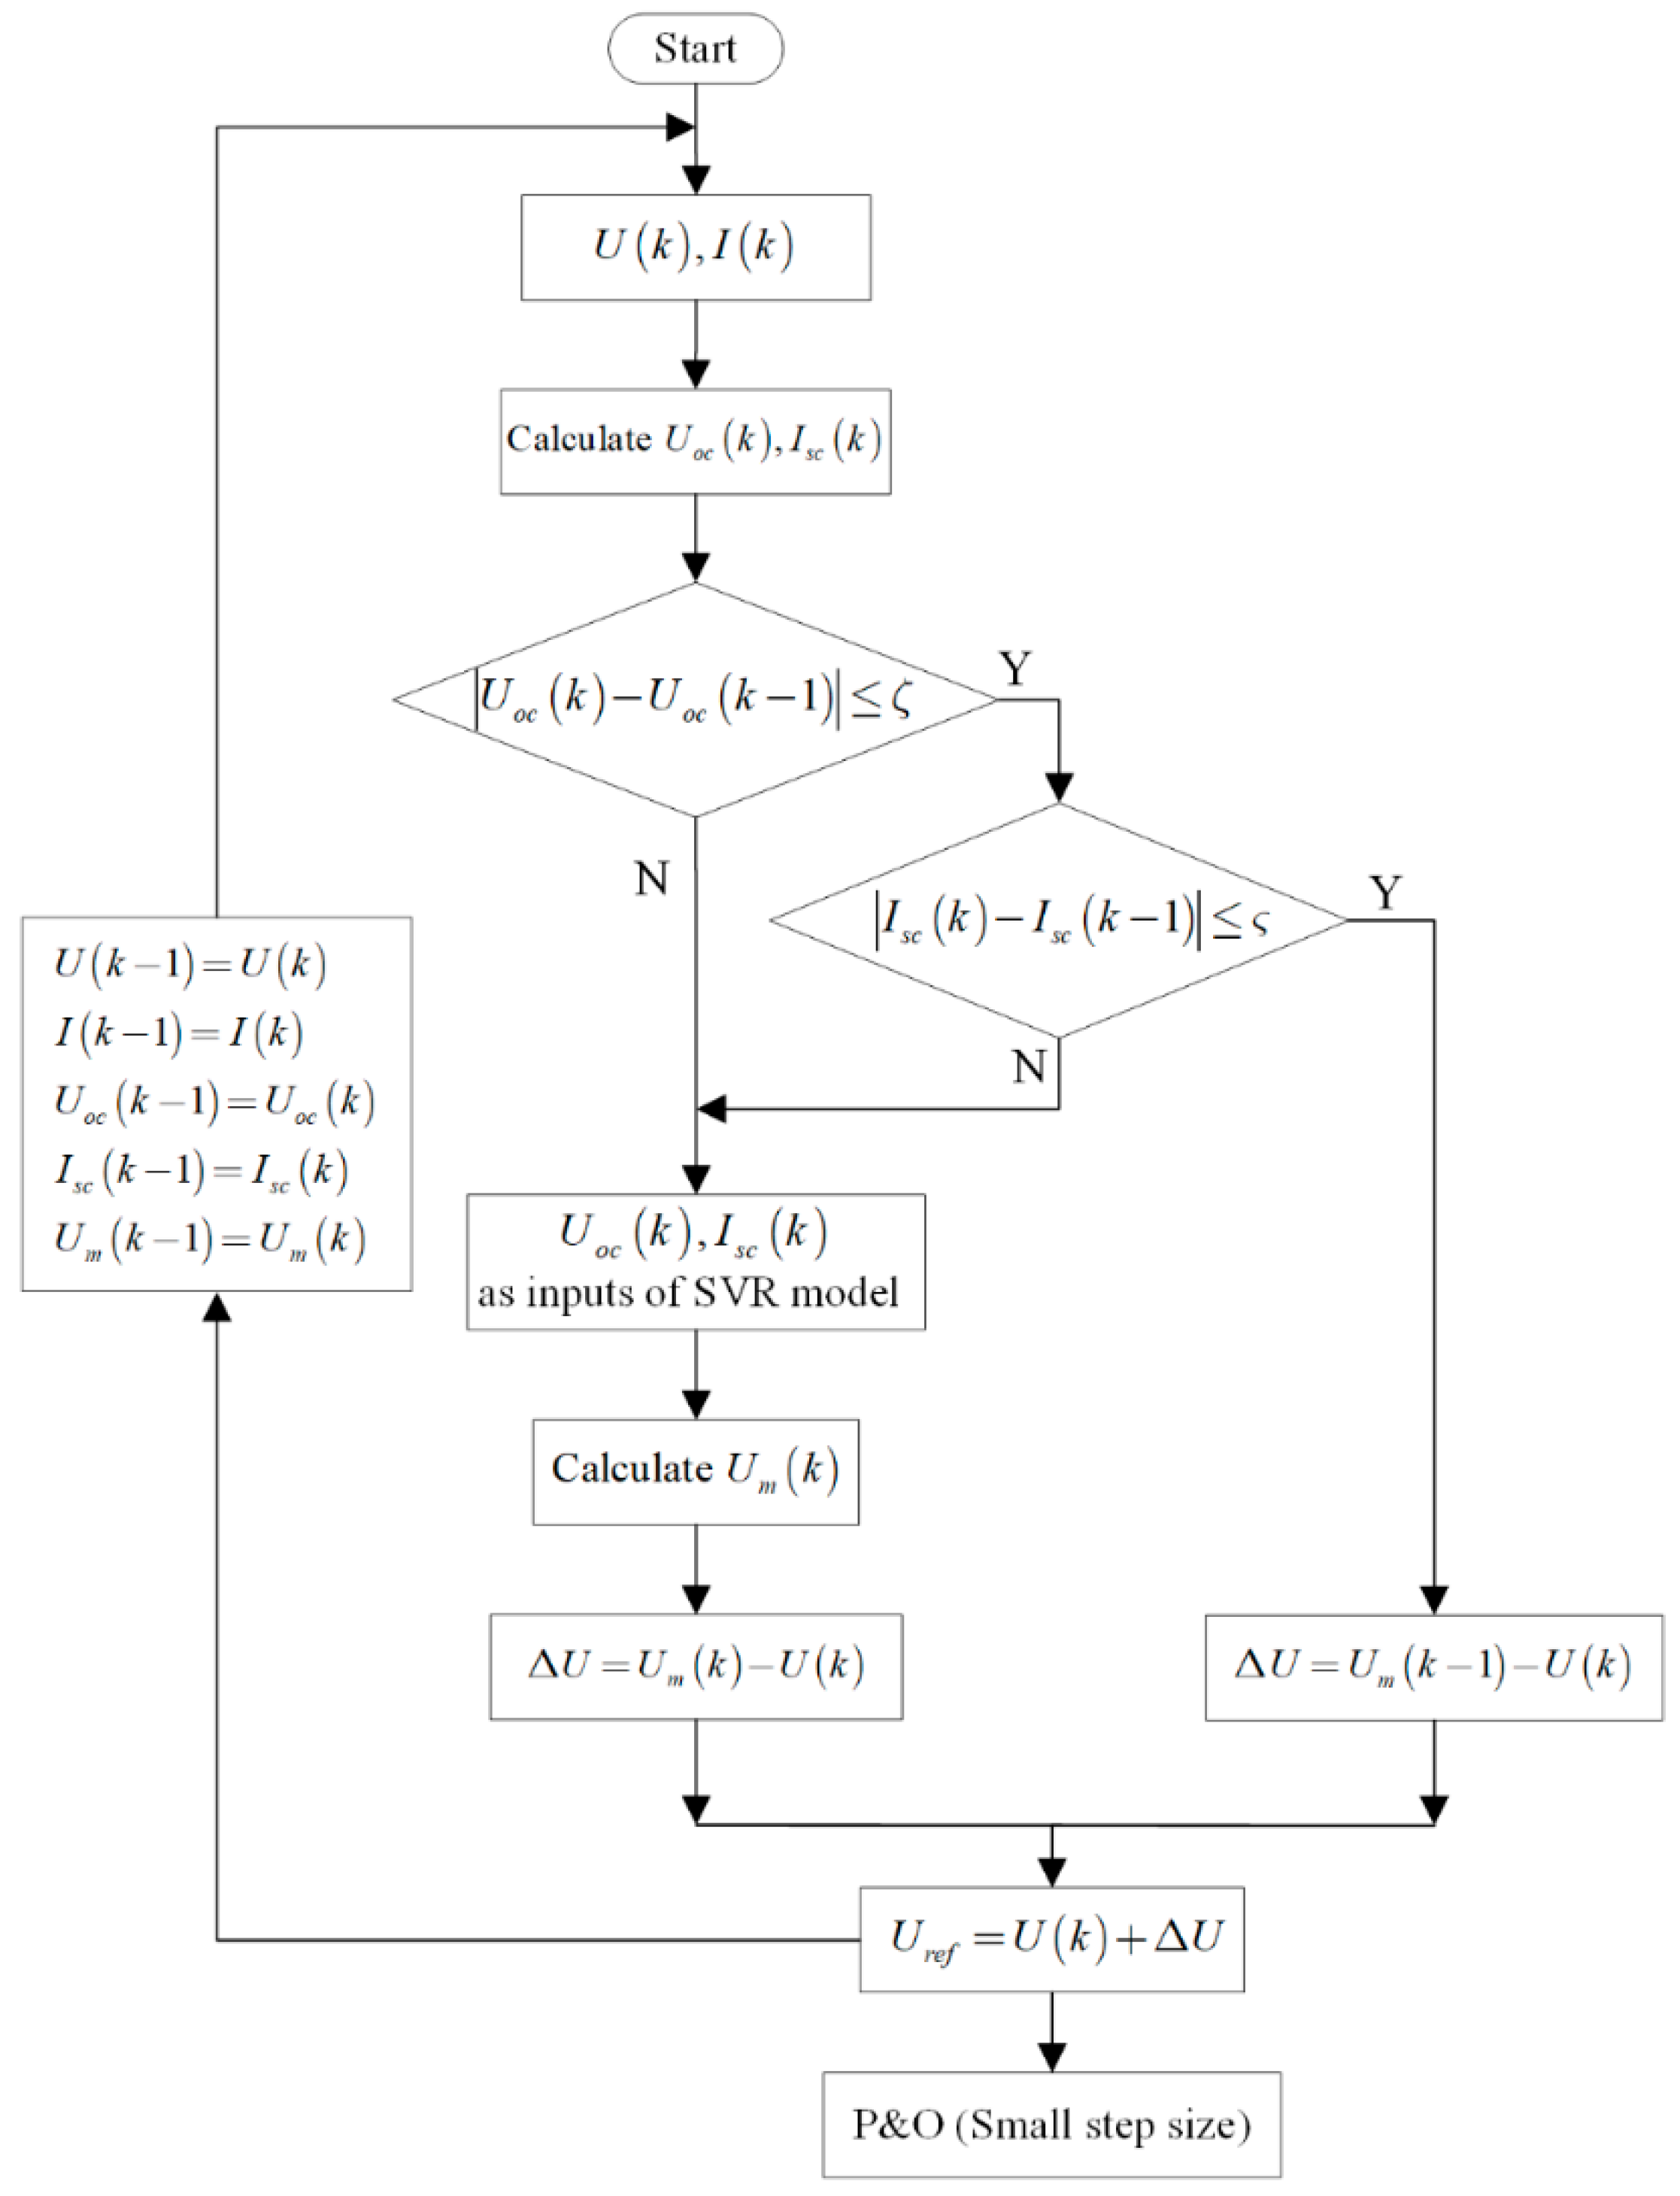
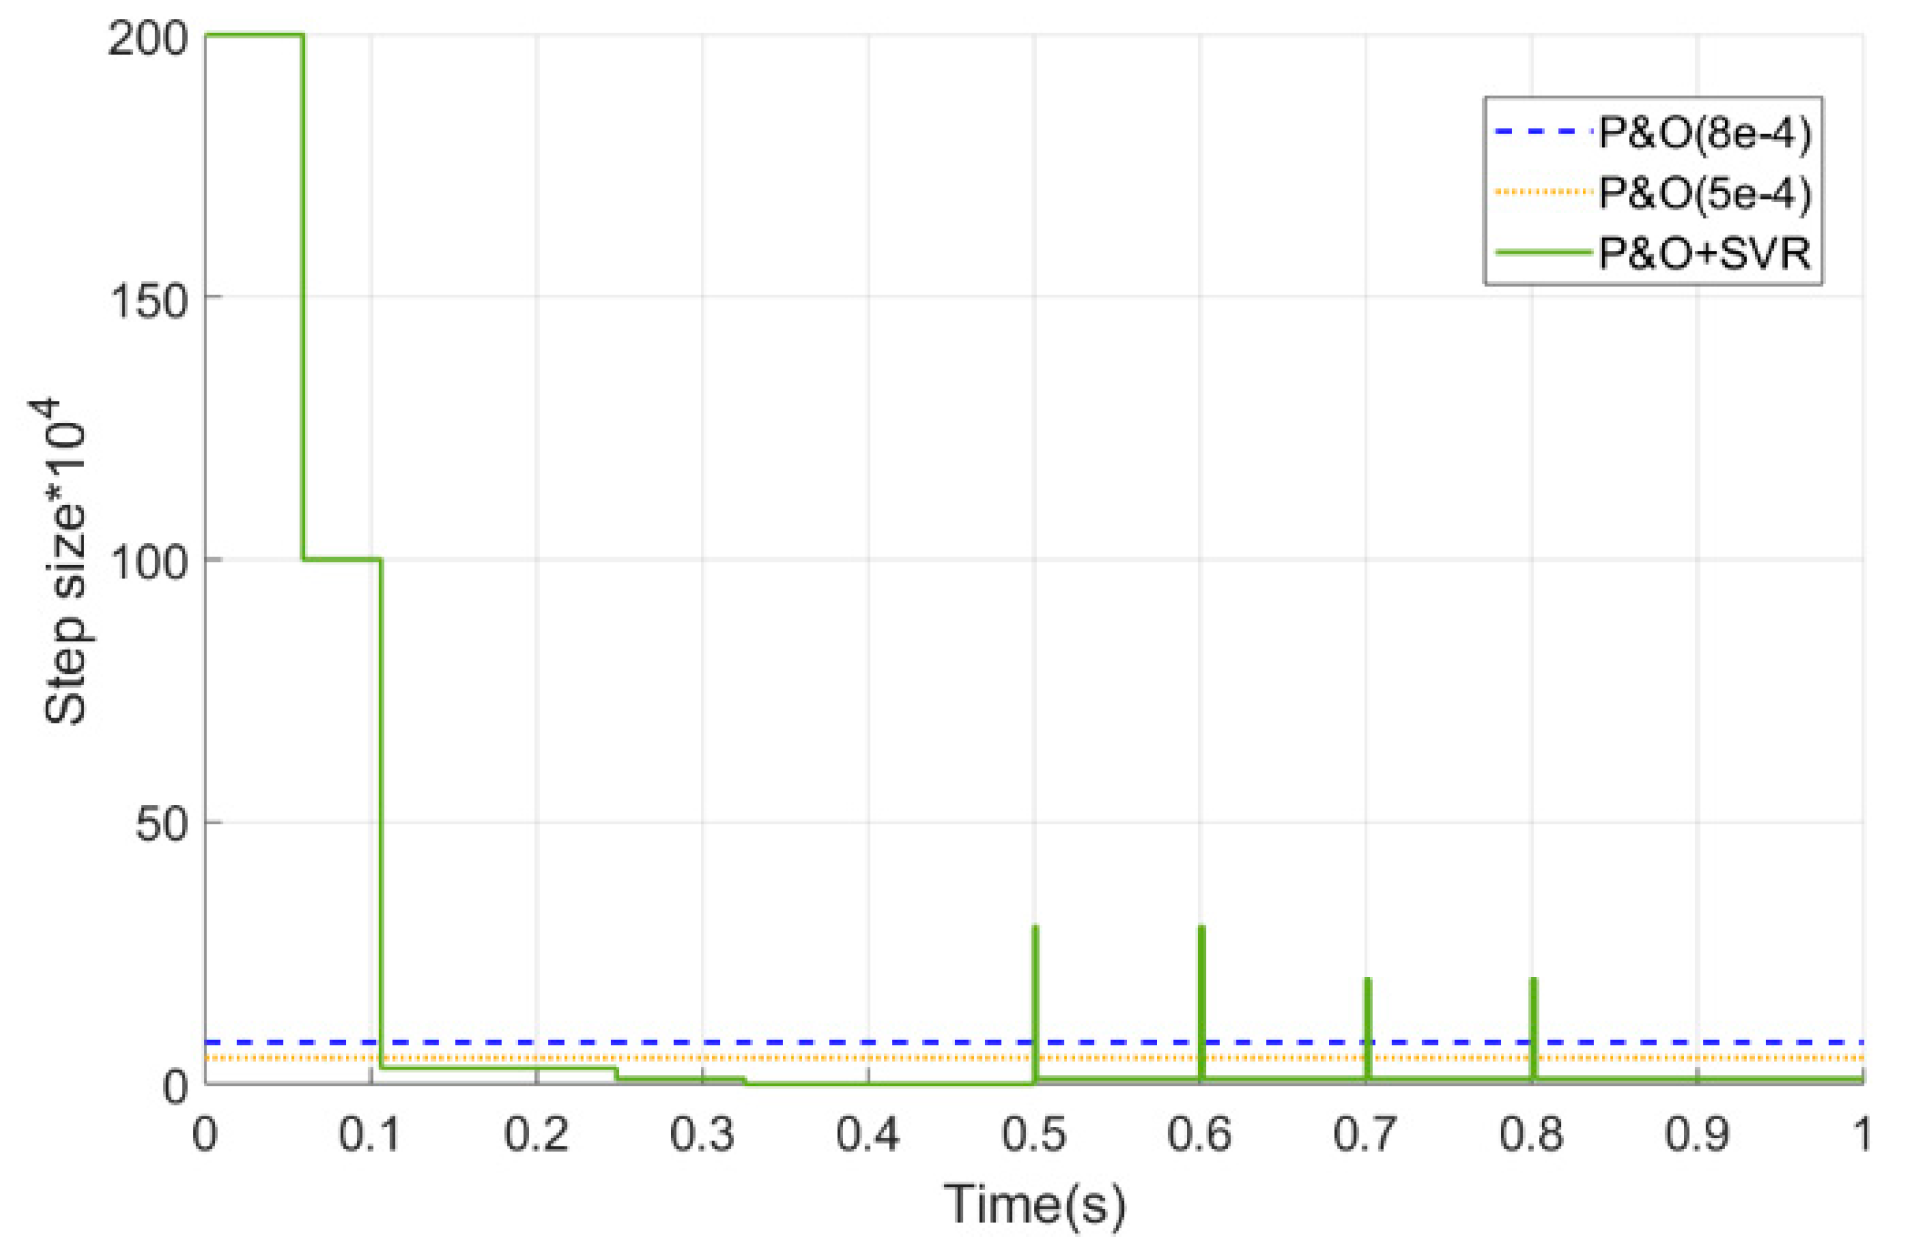
2.3. Control Strategy of Improved Algorithm

The objective of this paper is to use SVR to improve the P&O algorithm applied to track the MPP for a PV system under varying dynamic conditions as shown in Figure 4. The control strategy of the MPPT method combined with the SVR can be divided into three steps. In the first step, the current working voltage and current are obtained by sampling, and the corresponding open-circuit voltage and short-circuit current are calculated to determine the current output characteristic curve. In the next step, the obtained open-circuit voltage and short-circuit current are taken as the input of the SVR model, and the output is the voltage corresponding to the estimated maximum power point, thereby calculating the corresponding optimal step size. The operations of these two steps need to be repeated until the step size is less than a minimum number set in advance. In the last step, the tracking of the maximum power point is continued using the P&O method with a fixed step. It is worth noting that the step size here is a very small value, which makes the oscillation very small.

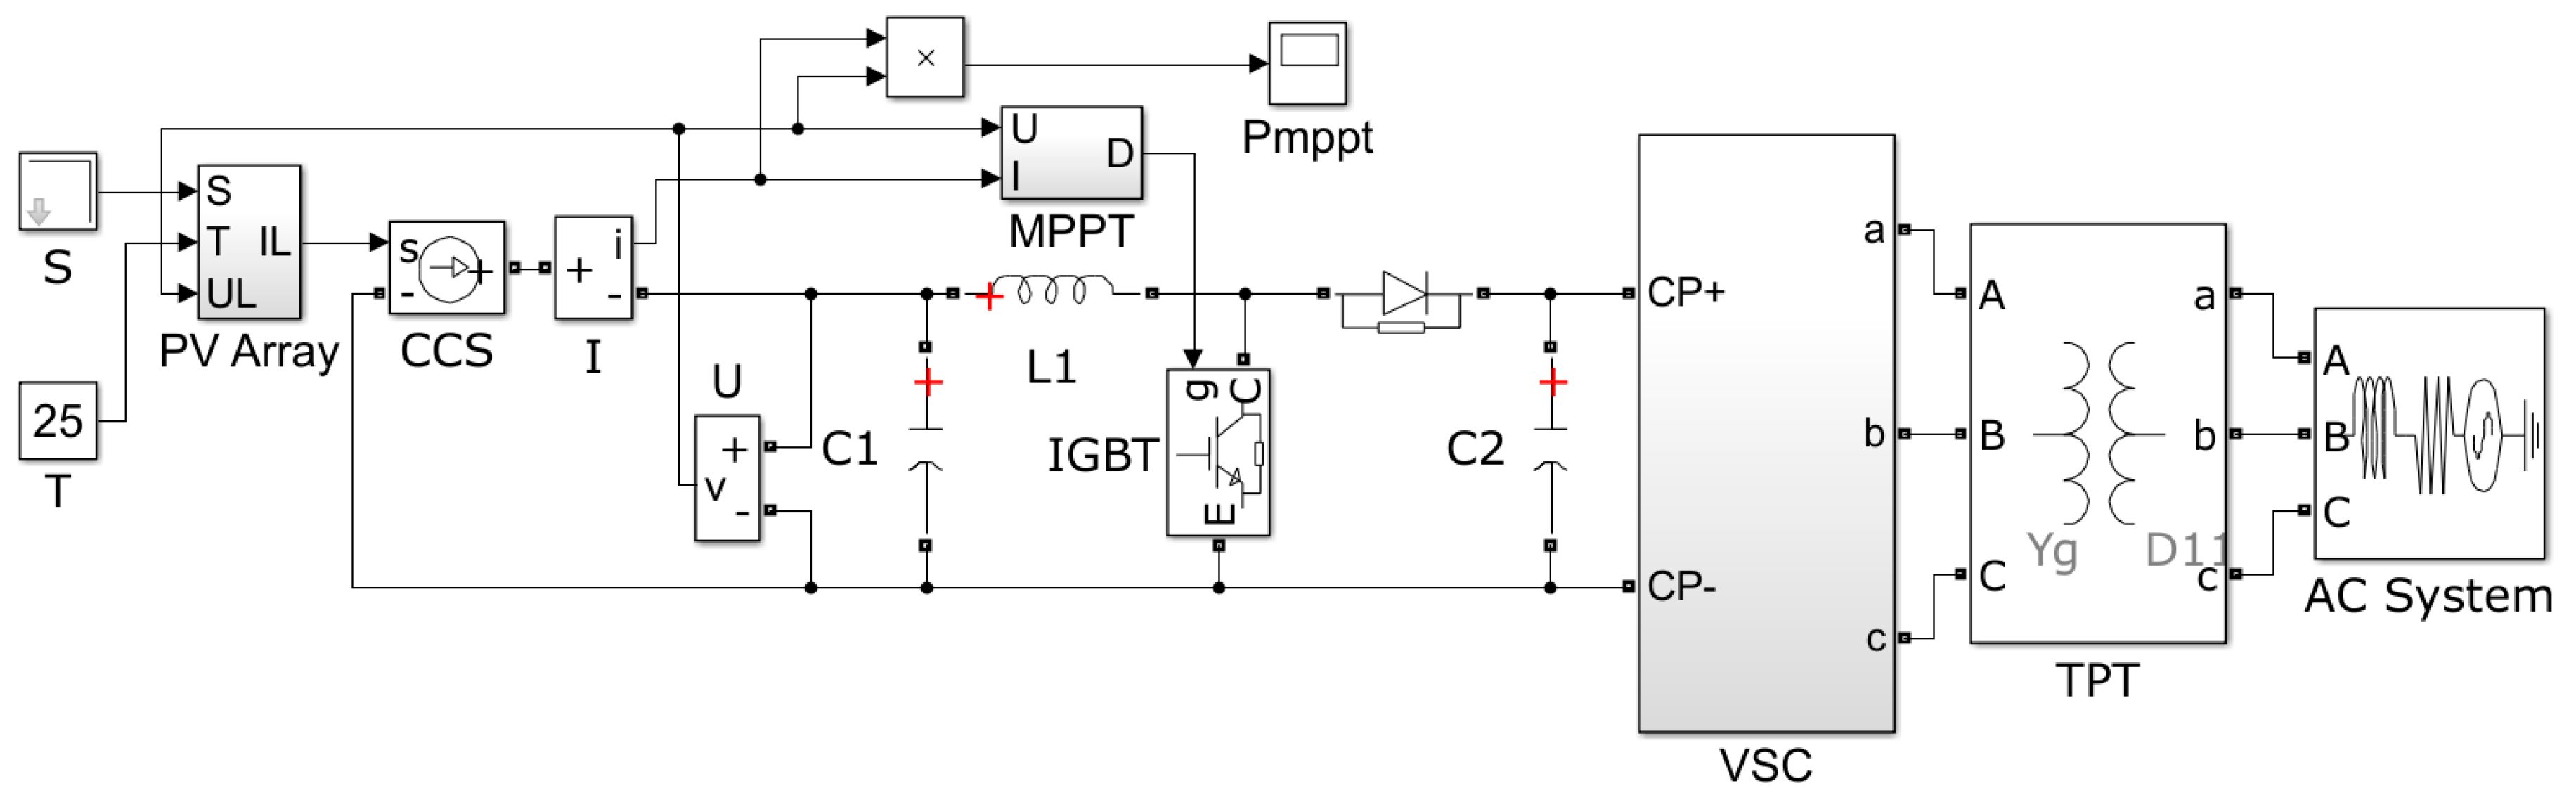
2.4. Model Simulation

The trained SVR model named “predict” is packaged into the S-function module. The improved P&O MPPT method is shown in Figure 5. Because the output voltage and current are stored in the working area as variables, the predict module has no input signal from the Simulink module, but from a saved variable, as shown in Figure 5. This process is done by the oscilloscopes, Uout and Iout.
To verify the performance of the proposed modified P&O MPPT algorithm, a MATLAB-Simulink model of the PV system is used as shown in Figure 6. In this simulation, the MPPT module takes the sampling voltage and current as inputs, controlling the output signal duty cycle through the calculated step size. The IGBT and the capacitance and inductance are used to achieve the amplification of the output voltage. The calculations of the open-circuit voltage, short-circuit current, maximum power point voltage, and corresponding step size are done in the MPPT module. The output DC is converted into AC through the VSC (voltage source converter), and the latter is sent to the AC system through the TPT (three-phase transformer). Among them, the VSC is mainly built by a universal bridge, discrete 3-Phase phase locked loop (PLL),active power, reactive power, and PWM. These blocks and the TPT and AC system are from the Simulink libraries. In VSC, the minimum frequency is 45 Hz, the fundamental frequency is 50 Hz, and the carrier frequency of PWM reaches 6000 Hz. In addition, the nominal power and frequency of the TPT are set to 10,000 VA and 50 Hz, respectively, and the frequency of the grid modules is 50 Hz. To compare the performance of the modified P&O MPPT method with the ordinary fixed step size P&O MPPT method, the simulations are configured under exactly the same conditions.

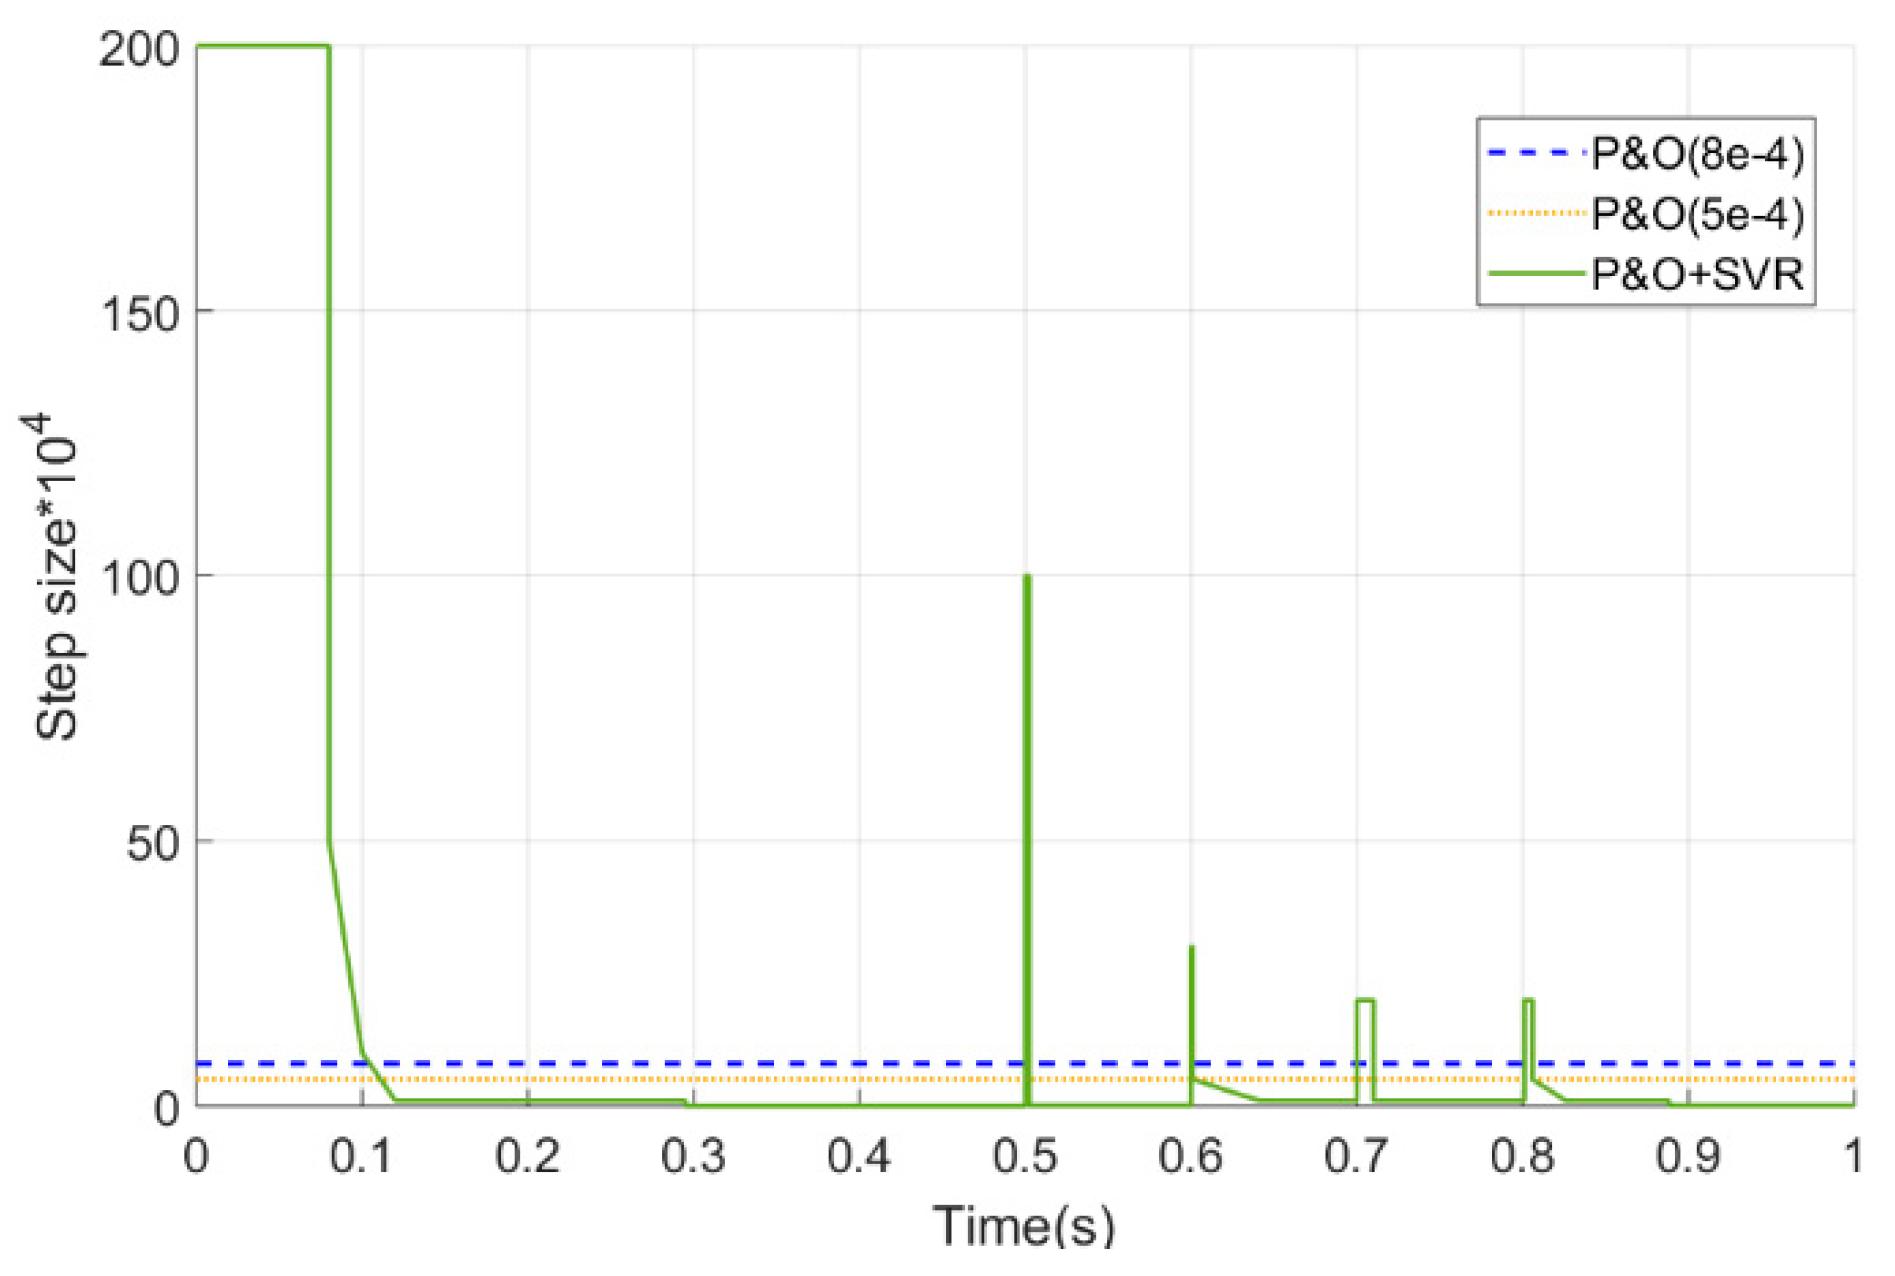
3. Results and Discussion

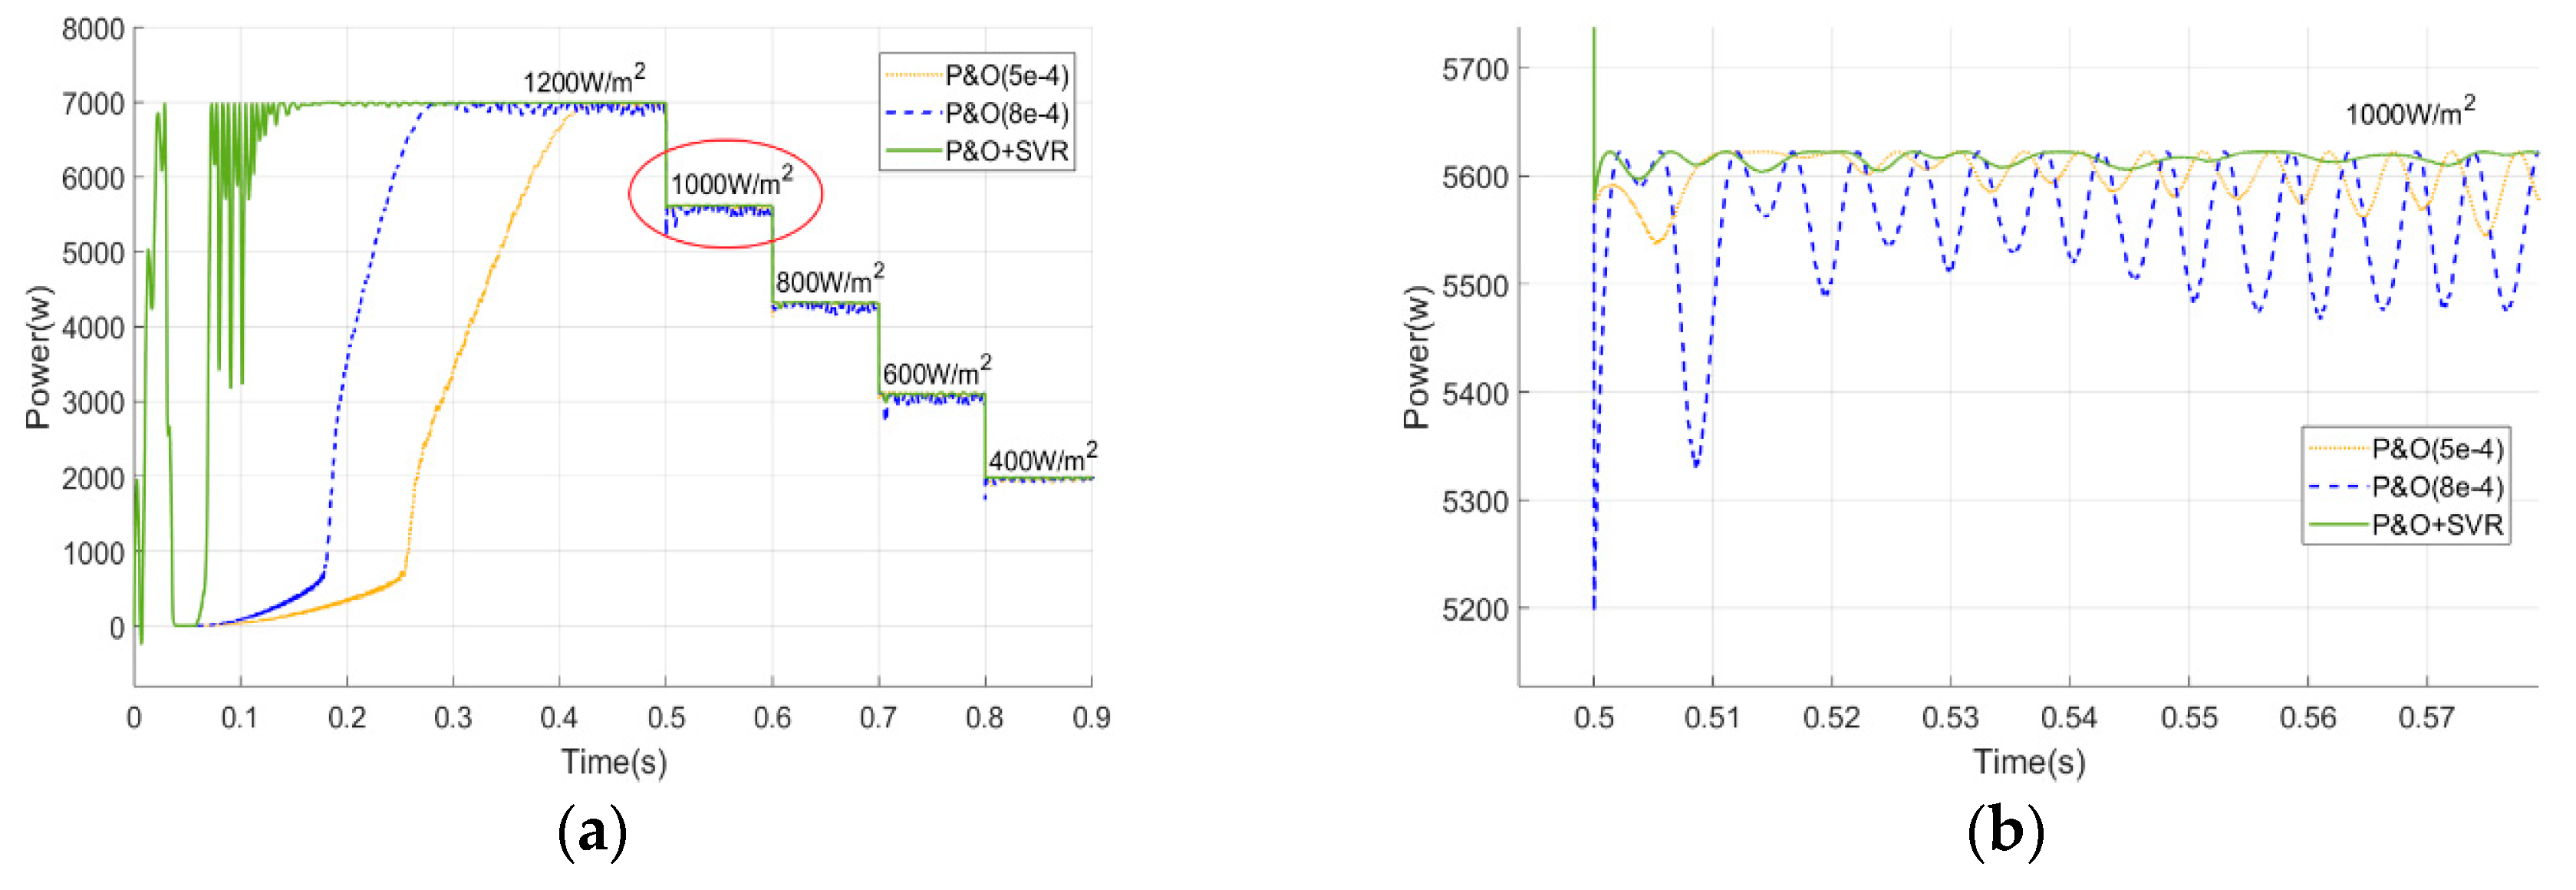
3.1. Irradiance Reduction

The simulation found that the traditional P&O method showed the best tracking performance when the step size was 8 × 10⁻⁴ and 5 × 10⁻⁴: The tracking speed is the fastest when the step size is 8 × 10⁻⁴, and the tracking accuracy is the highest when the step size is 5 × 10⁻⁴. Therefore, 8 × 10⁻⁴ and 5 × 10⁻⁴ are chosen as the fixed step size of the traditional P&O method to compare the tracking performance with the modified P&O MPPT method. The irradiance was gradually reduced from 1200 W/m2 to 400 W/m2 starting at the 0.5th second, and the temperature was a constant 25 °C. The output power curve is shown in Figure 7, where, Figure 7b is an enlarged view of a portion marked with a red ellipse in Figure 7a, P&O (5e–4) means the P&O method with a fixed step size of 5 × 10⁻⁴, P&O (8e–4) means the P&O method with a fixed step size of 8 × 10⁻⁴, and P&O + SVR means the modified P&O MPPT method with SVR. The tracking performance under both the fixed and variable P&O MPPT methods are presented in Table 2.
When the temperature is constant and the irradiance is decreased, the P&O + SVR has a shorter convergence time and a smaller oscillation amplitude. According to the data in Table 2, compared with the step size fixed at 8 × 10⁻⁴, the convergence time of the P&O + SVR is reduced by up to 91.3%; compared with the fixed step size of, the tracking accuracy of the P&O + SVR increases by 2.02 percentage points.
The step size signal curves in the simulation process are shown in Figure 8. For the modified P&O method, the initial step size is a large value, but a jump occurs very quickly, and the step size starts to become less than 5 × 10⁻⁴ after 0.1 s. Furthermore, the step size signal is suddenly increased at the 0.5th, 0.6th, 0.7th, and 0.8th s, and is immediately reduced to a very small value.

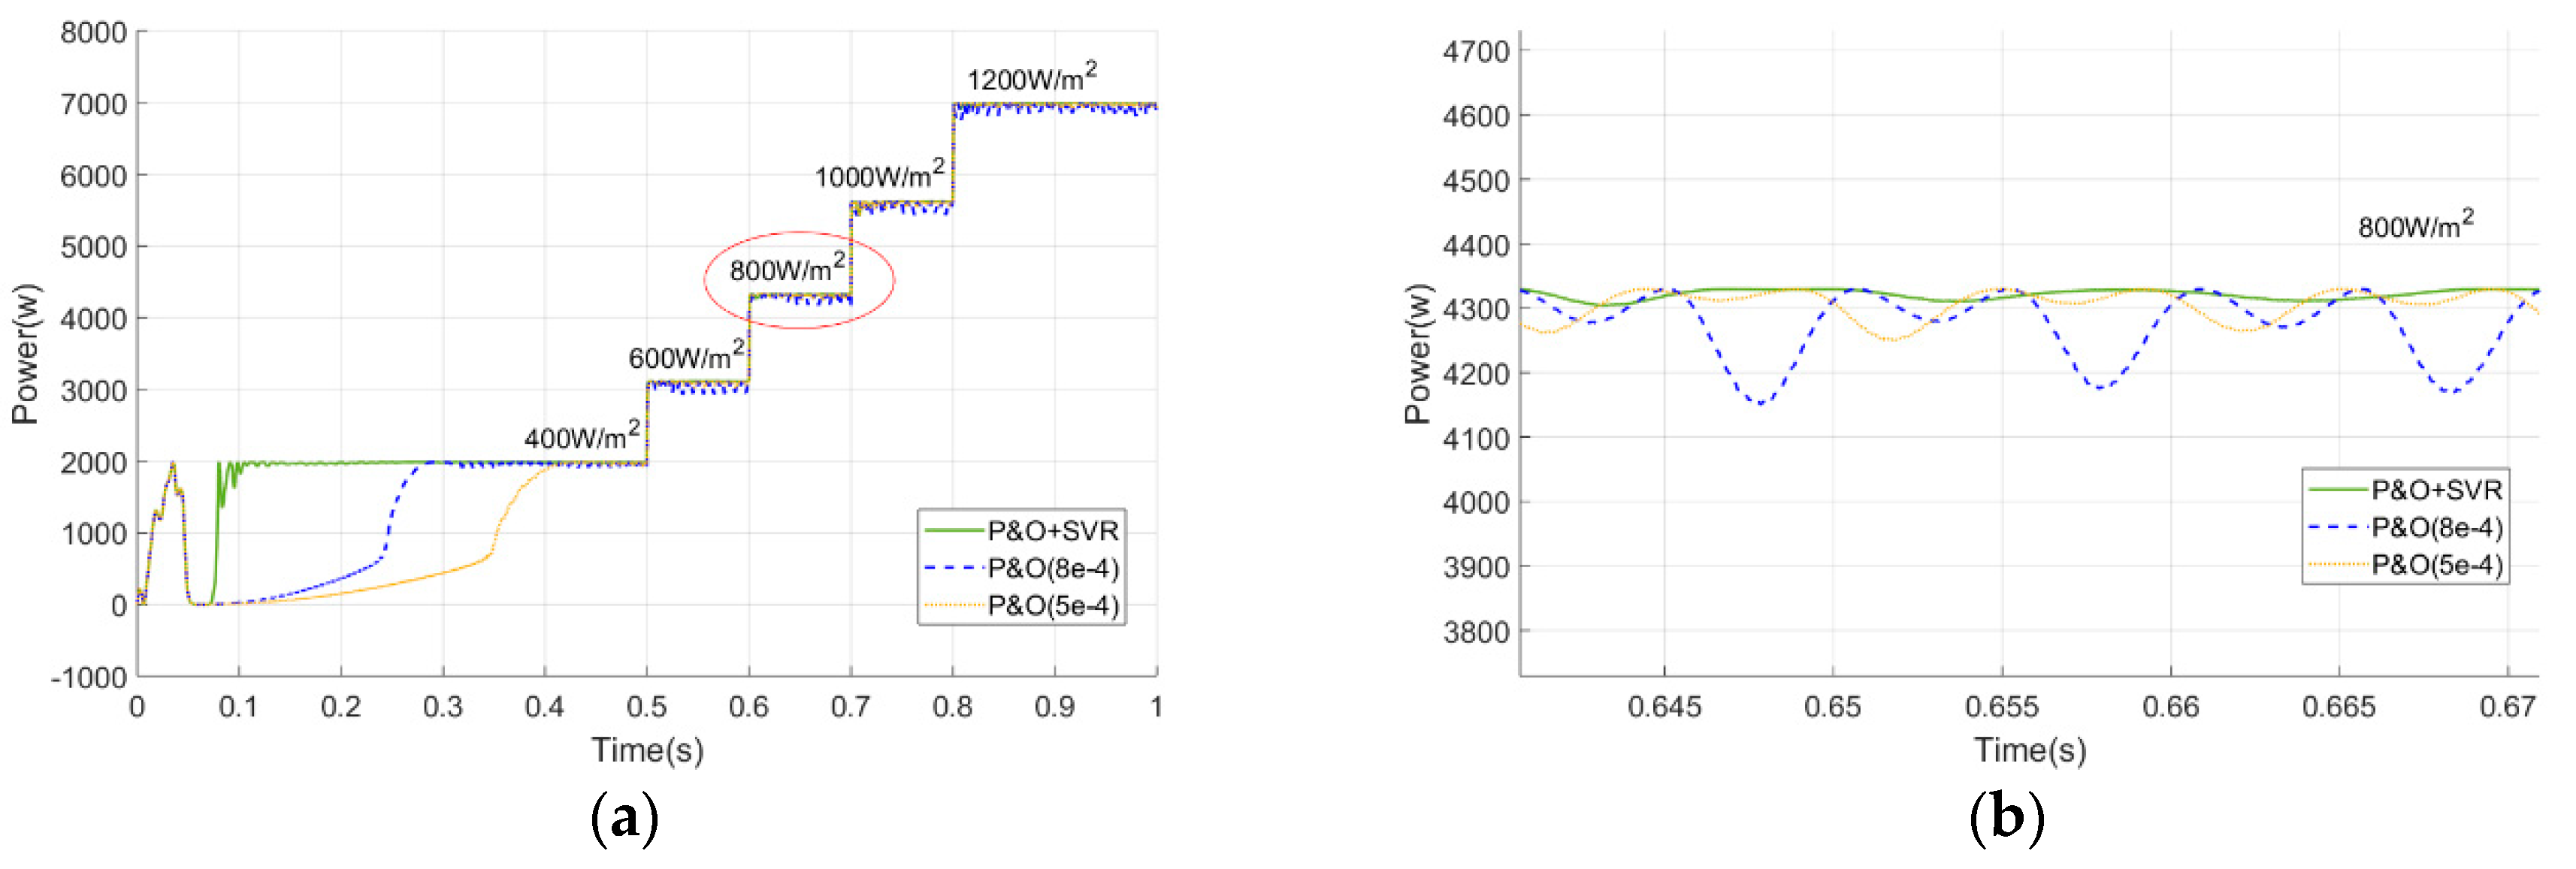
3.2. Irradiance Increase

The irradiance was gradually increased from 400 W/m2 to 1200 W/m2 starting at the 0.5th s, and the temperature was a constant 25 °C. The output power curve is shown in Figure 9, where, Figure 9b is an enlarged view of a portion marked with a red ellipse in Figure 9a, P&O (5e–4) means the P&O method with a fixed step size of 5 × 10⁻⁴, P&O (8e−4) means the P&O method with a fixed step size of 8 × 10⁻⁴, and P&O + SVR means the modified P&O MPPT method with SVR. The tracking performance under both the fixed and variable P&O MPPT methods is presented in Table 3.
When the temperature is constant and the irradiance is increased, the P&O + SVR has a shorter convergence time and a smaller oscillation amplitude. According to the data in Table 3, compared with the step size fixed at 8 × 10⁻⁴, the convergence time of P&O + SVR is reduced by up to 87.2%; compared with the fixed step size of 5 × 10⁻⁴, the tracking accuracy of P&O + SVR increases by 2.60 percentage points.
The details of the step signal change shown in Figure 10 are similar to the case when the irradiance is reduced. For the modified P&O method, the initial step size is a large value, but a jump occurs very quickly, and the step size starts to become less than 5 × 10⁻⁴ after 0.1 s. Furthermore, the step size signal is suddenly increased at the 0.5th, 0.6th, 0.7th, and 0.8th s, and is immediately reduced to a very small value. It is worth mentioning that the amplitude and duration of these peak signals appear to be within a finite range of random numbers, but there are still two characteristics of a high amplitude and short duration as a whole.

4. Conclusions

The results of the simulation show that the modified P&O MPPT method with SVR significantly improved the tracking performance: The tracking accuracy was improved while shortening the convergence time. This is attributed to the fast and accurate prediction of the disturbance step size by the SVR algorithm. It can be easily seen from the situation reflected by the step size signal curves. The step size can be adjusted in time when the irradiance changes and can be quickly reduced after reaching the steady state, which reduces energy loss and improves the efficiency of the PV generation system.
Compared with other existing methods, the modified P&O MPPT method based on support vector regression proposed in this paper has the advantages of accurate and fast judgment, short training time, low computational complexity, and low realization cost.
However, there are still some shortcomings. Due to the limitations of current conditions, the proposed algorithm cannot feedback to reality at present, and the practical application effect of this method needs further testing. In addition, all the simulations in the paper were done under uniform irradiation. For the case of non-uniform irradiation, there is still no clear and effective solution based on the method proposed in this paper. Additionally, the model proposed in this paper cannot achieve accurate prediction of the step signal under varying temperatures because of the limitation of the attribute matrix composed of an open circuit voltage and short circuit current. These issues will be addressed in future research.
Furthermore, with the rapid development of the computing performance of the chip, the MPPT algorithm may gradually be no longer limited by computational complexity. Based on this fact, a focus on improving the tracking speed and tracking accuracy of MPPT will be the direction of future research.

Author Contributions

Data curation, D.T.; Methodology, B.T. and D.T.; Software, X.K.; Supervision, S.Y.; Validation, X.K. Writing—original draft, B.T.; Writing—review & editing, S.Y.

Funding

The work is funded by the National Natural Science Foundation of China (GrantNo.51472096).

Acknowledgments

The completion of this paper has been helped by many teachers and classmates. We would like to express our gratitude to them for their help and guidance.

Conflicts of Interest

The authors declare no conflict of interest.

References

  1. Fraunhofer Institute for Solar Energy Systems (ISE). Annual Report 2016/2017; Fraunhofer Institute for Solar Energy Systems ISE: Freiburg, Germany, 2017; pp. 1–88. [Google Scholar]
  2. BP Statistical Review of World Energy 2018; BP: London, UK, 2018; pp. 1–54.
  3. REN21. Renewable Energy Policy Network for the 21st Century Renewables 2017, Global Status Report—REN21; REN21: Paris, France, 2018; 325p. [Google Scholar]
  4. Elgendy, M.A.; Zahawi, B.; Atkinson, D.J. Assessment of perturb and observe MPPT algorithm implementation techniques for PV pumping applications. IEEE Trans. Sustain. Energy 2012, 3, 21–33. [Google Scholar] [CrossRef]
  5. Safari, A.; Mekhilef, S. Incremental conductance MPPT method for PV systems. In Proceedings of the 24th Canadian Conference on IEEE, Niagara Falls, ON, Canada, 8–11 May 2011; pp. 345–347. [Google Scholar] [CrossRef]
  6. Farayola, A.M.; Hasan, A.N.; Ali, A. Implementation of modified incremental conductance and fuzzy logic MPPT techniques using MCUK converter under various environmental conditions. Appl. Sol. Energy 2017, 53, 173–184. [Google Scholar] [CrossRef]
  7. Hilloowala, R.M.; Sharaf, A.M. A rule-based fuzzy logic controller for a PWM inverter in photo-voltaic energy conversion scheme. In Proceedings of the Conference Record of the 1992 IEEE, Houston, TX, USA, 4–9 October 1992; pp. 762–769. [Google Scholar] [CrossRef]
  8. Kottas, T.L.; Boutalis, Y.S.; Karlis, A.D. New maximum power point tracker for PV arrays using fuzzy controller in close cooperation with fuzzy cognitive networks. IEEE Trans. Energy Convers. 2006, 21, 793–803. [Google Scholar] [CrossRef]
  9. Mohanty, S.; Subudhi, B.; Ray, P.K. A Grey Wolf-Assisted Perturb & Observe MPPT Algorithm for a PV System. IEEE Trans. Energy Convers. 2017, 32, 340–347. [Google Scholar] [CrossRef]
  10. Mao, M.; Duan, Q.; Duan, P.; Hu, B. Comprehensive improvement of artificial fish swarm algorithm for global MPPT in PV system under partial shading conditions. Trans. Inst. Meas. Control. 2018, 40, 2178–2199. [Google Scholar] [CrossRef]
  11. Karami, N.; Moubayed, N.; Outbib, R. General review and classification of different MPPT Techniques. Renew. Sustain. Energy Rev. 2017, 68, 1–18. [Google Scholar] [CrossRef]
  12. Telbany, M.E.; Youssef, A.; Zekry, A.A. Intelligent techniques for MPPT control in photovoltaic systems: A comprehensive review. In Proceedings of the 4th International Conference IEEE, Kota Kinabalu, Malaysia, 3–5 December 2014; pp. 17–22. [Google Scholar] [CrossRef]
  13. Kamarzaman, N.A.; Tan, C.W. A comprehensive review of maximum power point tracking algorithms for photovoltaic systems. Renew. Sustain. Energy Rev. 2014, 37, 585–598. [Google Scholar] [CrossRef]
  14. Esram, T.; Chapman, P.L. Comparison of photovoltaic array maximum power point tracking techniques. IEEE Trans. Energy Convers. 2007, 22, 439–449. [Google Scholar] [CrossRef]
  15. Hiyama, T.; Kouzuma, S.; Imakubo, T. Identification of optimal operating point of PV modules using neural network for real time maximum power tracking control. IEEE Trans. Energy Convers. 1995, 10, 360–367. [Google Scholar] [CrossRef]
  16. Fronius Symo Maximum Flexibility for the Applications of Tomorrow. Available online: https://www.fronius.com/en/photovoltaics/products/all-products/inverters/fronius-symo/fronius-symo-3-0-3-m (accessed on 25 February 2019).
  17. Ahmed, R.; Namaane, A.; M’Sirdi, N.K. Improvement in perturb and observe method using state flow approach. Energy Proc. 2013, 42, 614–623. [Google Scholar] [CrossRef]
  18. Abdelsalam, A.K.; Massoud, A.M.; Ahmed, S.; Enjeti, P.N. High-performance adaptive perturb and observe MPPT technique for photovoltaic-based microgrids. IEEE Trans. Power Electron. 2011, 26, 1010–1021. [Google Scholar] [CrossRef]
  19. Al-Amoudi, A.; Zhang, L. Optimal control of a grid-connected PV system for maximum power point tracking and unity power factor. In Proceedings of the Seventh International Conference on Power Electronics and Variable Speed Drives, London, UK, 21–23 Septembre 1998; pp. 80–85. [Google Scholar] [CrossRef]
  20. Vapnik, V. The Nature of Statistical Learning Theory, 2nd ed.; Springer Science & Business Media: New York, NY, USA, 1999; pp. 138–141. [Google Scholar]
  21. Cortes, C.; Vapnik, V. Support-vector networks. Mach. Learn. 1995, 20, 273–297. [Google Scholar] [CrossRef] [Green Version]
  22. Villalva, M.G.; Gazoli, J.R.; Ruppert Filho, E. Comprehensive approach to modeling and simulation of photovoltaic arrays. IEEE Trans. Power Electron. 2009, 24, 1198–1208. [Google Scholar] [CrossRef]
  23. Hsiao, P.W.; Chang, C.H.; Tsai, H.L. Accuracy improvement of practical PV model. In Proceedings of the SICE Annual Conference 2010, Taipei, Taiwan, 18–21 August 2010; IEEE: Taipei, Taiwan, 2010; pp. 2725–2730. [Google Scholar]
  24. Di Fazio, A.R.; Russo, M. Photovoltaic generator modelling to improve numerical robustness of EMT simulation. Electr. Power Syst. Res. 2012, 83, 136–143. [Google Scholar] [CrossRef]
  25. Ishaque, K.; Salam, Z.; Amjad, M.; Mekhilef, S. An Improved Particle Swarm Optimization (PSO)-Based MPPT for PV With Reduced Steady-State Oscillation. IEEE Trans. Power Electron. 2012, 27, 3627–3638. [Google Scholar] [CrossRef]
  26. Kadri, R.; Gaubert, J.P.; Champenois, G. An Improved Maximum Power Point Tracking for Photovoltaic Grid-Connected Inverter Based on Voltage-Oriented Control. IEEE Trans. Power Electron. 2011, 58, 66–75. [Google Scholar] [CrossRef]
  27. Chang, C.C.; Lin, C.J. LIBSVM: A library for support vector machines. ACM Trans. Intel. Syst. Technol. 2011, 2, 27. [Google Scholar] [CrossRef]
Figure 1. Equivalent circuit of a PV cell.
Energies 12 01151 g001
Figure 2. 8S4P (four parallel paths consisting of eight series connected cells) PV array circuit.
Energies 12 01151 g002
Figure 3. P-V (power-voltage) curve characteristics for four different irradiance intensities and temperatures: (a) Varying irradiance and constant temperature; (b) varying temperature and constant irradiance.
Energies 12 01151 g003
Figure 4. Flow chart of the perturb and observation (P&O) with SVR.
Energies 12 01151 g004
Figure 5. P&O MPPT (maximum power point tracking) sub-module with SVR.
Energies 12 01151 g005
Figure 6. Model of the PV generation system used in simulation.
Energies 12 01151 g006
Figure 7. Output power curve when irradiance decreases: (a) Complete output curve; (b) partial enlarged detail of (a).
Energies 12 01151 g007
Figure 8. Step size signal curve when irradiance decreases.
Energies 12 01151 g008
Figure 9. Output power curve when irradiance increases: (a) Complete output curve; (b) partial enlarged detail of (a).
Energies 12 01151 g009
Figure 10. Step size signal curve when irradiance increases.
Energies 12 01151 g010
Table 1. Training parameters of the SVR (support vector regression) model.
ParametersMeaningValue
sType of problem3 (e-SVR)
tType of kernel2 (RBF kernel)
cPenalty termexp(i) (i = 4, 5, 6, 7, 8, 9)
ggammaexp(i) (i = −2, −1, 0, 1, 2)
vn-fold cross-validation5
ploss function0.01
Table 2. Tracking performance comparison between the fixed and modified P&O MPPT method.
Irradiance (W/m2)Average Power at Steady State (W)MethodConvergence Time (s)Tracking Efficiency (%)
12006991P&O (5e–4)0.434999.16
P&O (8e–4)0.285197.67
P&O + SVR0.188799.87
10005623P&O (5e–4)0.011399.06
P&O (8e–4)0.005697.42
P&O + SVR0.001399.80
8004329P&O (5e−4)0.016998.11
P&O (8e−4)0.010396.86
P&O + SVR0.000999.45
6003116P&O (5e−4)0.008597.27
P&O (8e−4)0.003794.99
P&O + SVR0.000599.29
4001986P&O (5e−4)0.009297.89
P&O (8e−4)0.006597.38
P&O + SVR0.001399.50
Table 3. Tracking performance comparison between the fixed and modified P&O MPPT method.
Irradiance (W/m2)Average Power at Steady State (W)MethodConvergence Time (s)Tracking Efficiency (%)
4001986P&O (5e−4)0.427797.48
P&O (8e−4)0.290796.27
P&O + SVR0.080399.65
6003116P&O (5e−4)0.013297.34
P&O (8e−4)0.006194.32
P&O + SVR0.002599.94
8004329P&O (5e−4)0.008897.97
P&O (8e−4)0.005396.14
P&O + SVR0.000999.79
10005623P&O (5e−4)0.011198.65
P&O (8e−4)0.008697.12
P&O + SVR0.001199.93
12006991P&O (5e−4)0.010299.54
P&O (8e−4)0.005298.01
P&O + SVR0.001199.97

