Progress in the Implementation of the EU Energy Efficiency Directive through the Lens of the National Annual Reports


Abstract
:1. Introduction
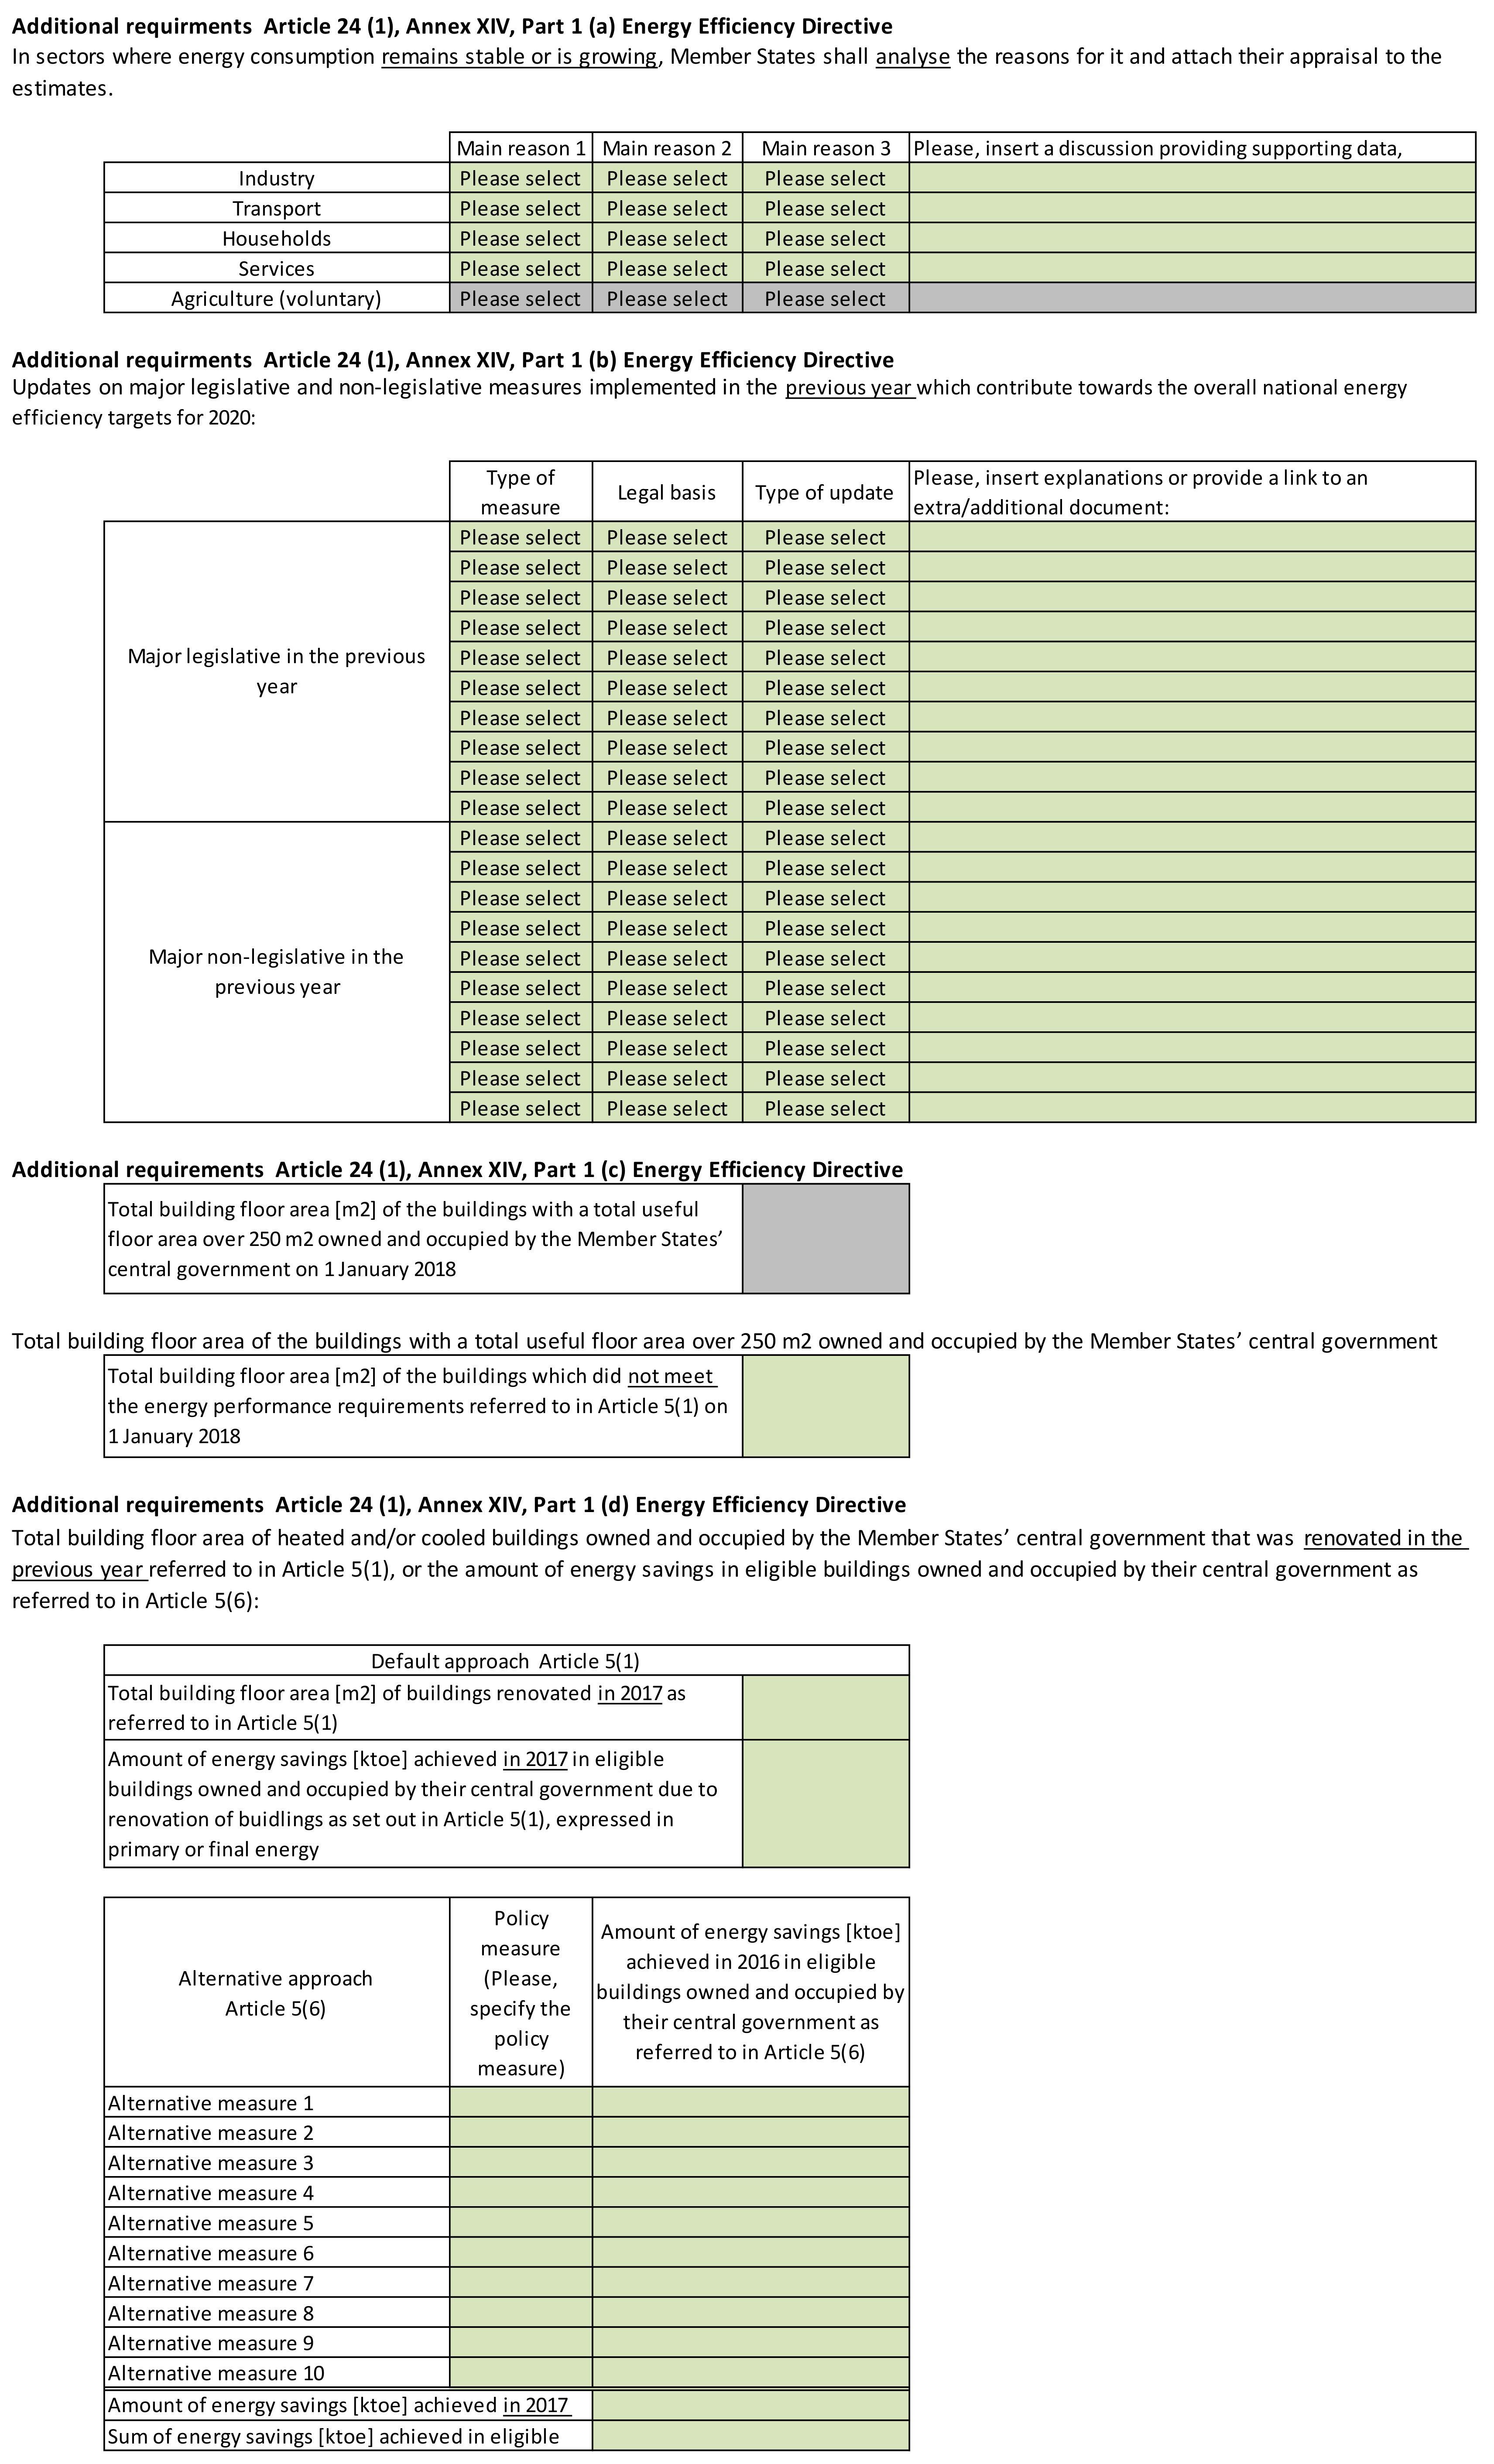
- (a)
- An estimate of various energy-related indicators for two years before (e.g., for 2016 in the Annual Reports of 2018 or AR2018), including a discussion of the reasons if stable and growing energy consumptions were observed.
- (b)
- Updates on major legislative and non-legislative measures implemented in the previous year (e.g., 2017 in the AR2018), which contribute towards the overall national energy efficiency targets for 2020.
- (c)
- The total building floor area of the buildings with a total useful floor area over 500 m2 and as of 9 July 2015 over 250 m2 owned and occupied by the Member States’ central government that, on 1 January, did not meet the minimum energy performance requirements referred to in Article 5(1).
- (d)
- The total building floor area of heated and/or cooled buildings owned and occupied by the Member States’ central government that was renovated in the previous year (e.g., 2017 in the AR2018) referred to in Article 5(1) or the amount of energy savings in eligible buildings owned and occupied by their central government as referred to in Article 5(6).
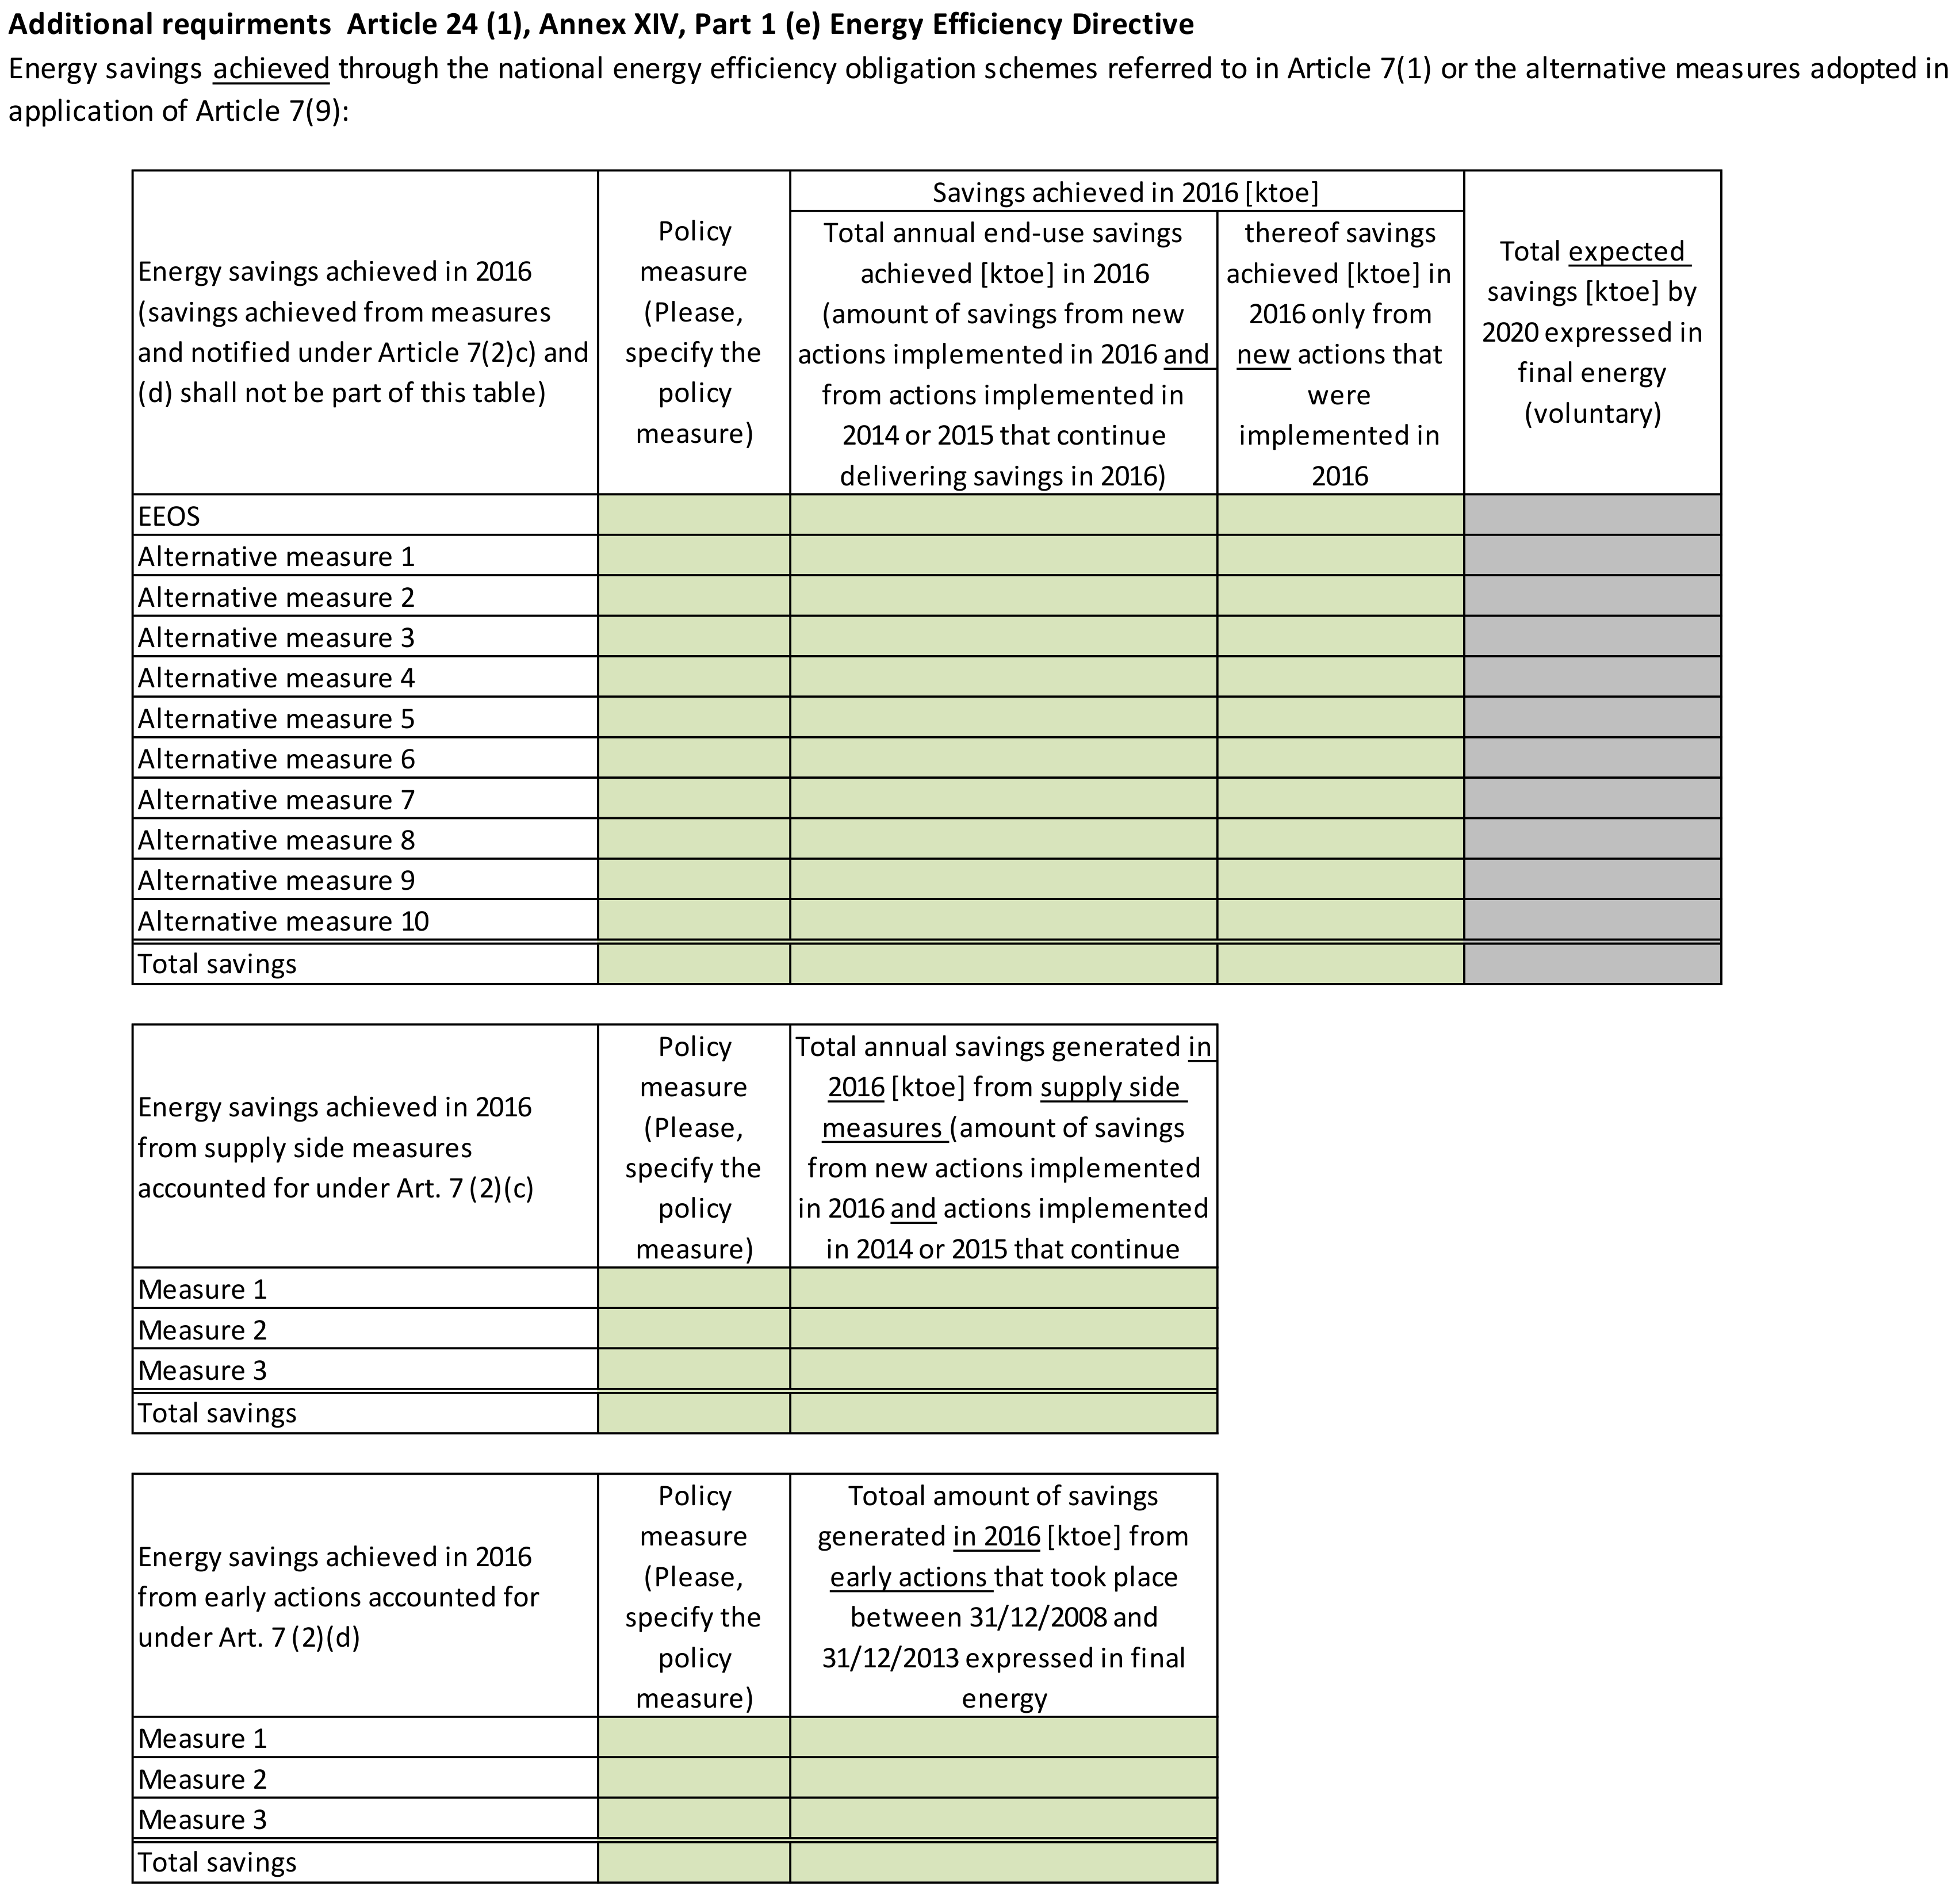
- (e)
- Energy savings achieved two year before (e.g., for 2016 in the AR2018) through the national energy efficiency obligation schemes referred to in Article 7(1) or the alternative measures adopted in application of Article 7(9).
2. Method
- The type of update, the implementing EED article and the main sector(s) affected by the new policy measures reported under point (b).
- The annual requirements and the type of energy savings (e.g., cumulated vs. yearly) achieved under Article 5 (point (d)).
- The type of annual energy savings (e.g., from new measures or from all active measures) reported to address the Article 7 obligation (point (e)).
3. Results and Discussion
3.1. Growing Energy Consumption
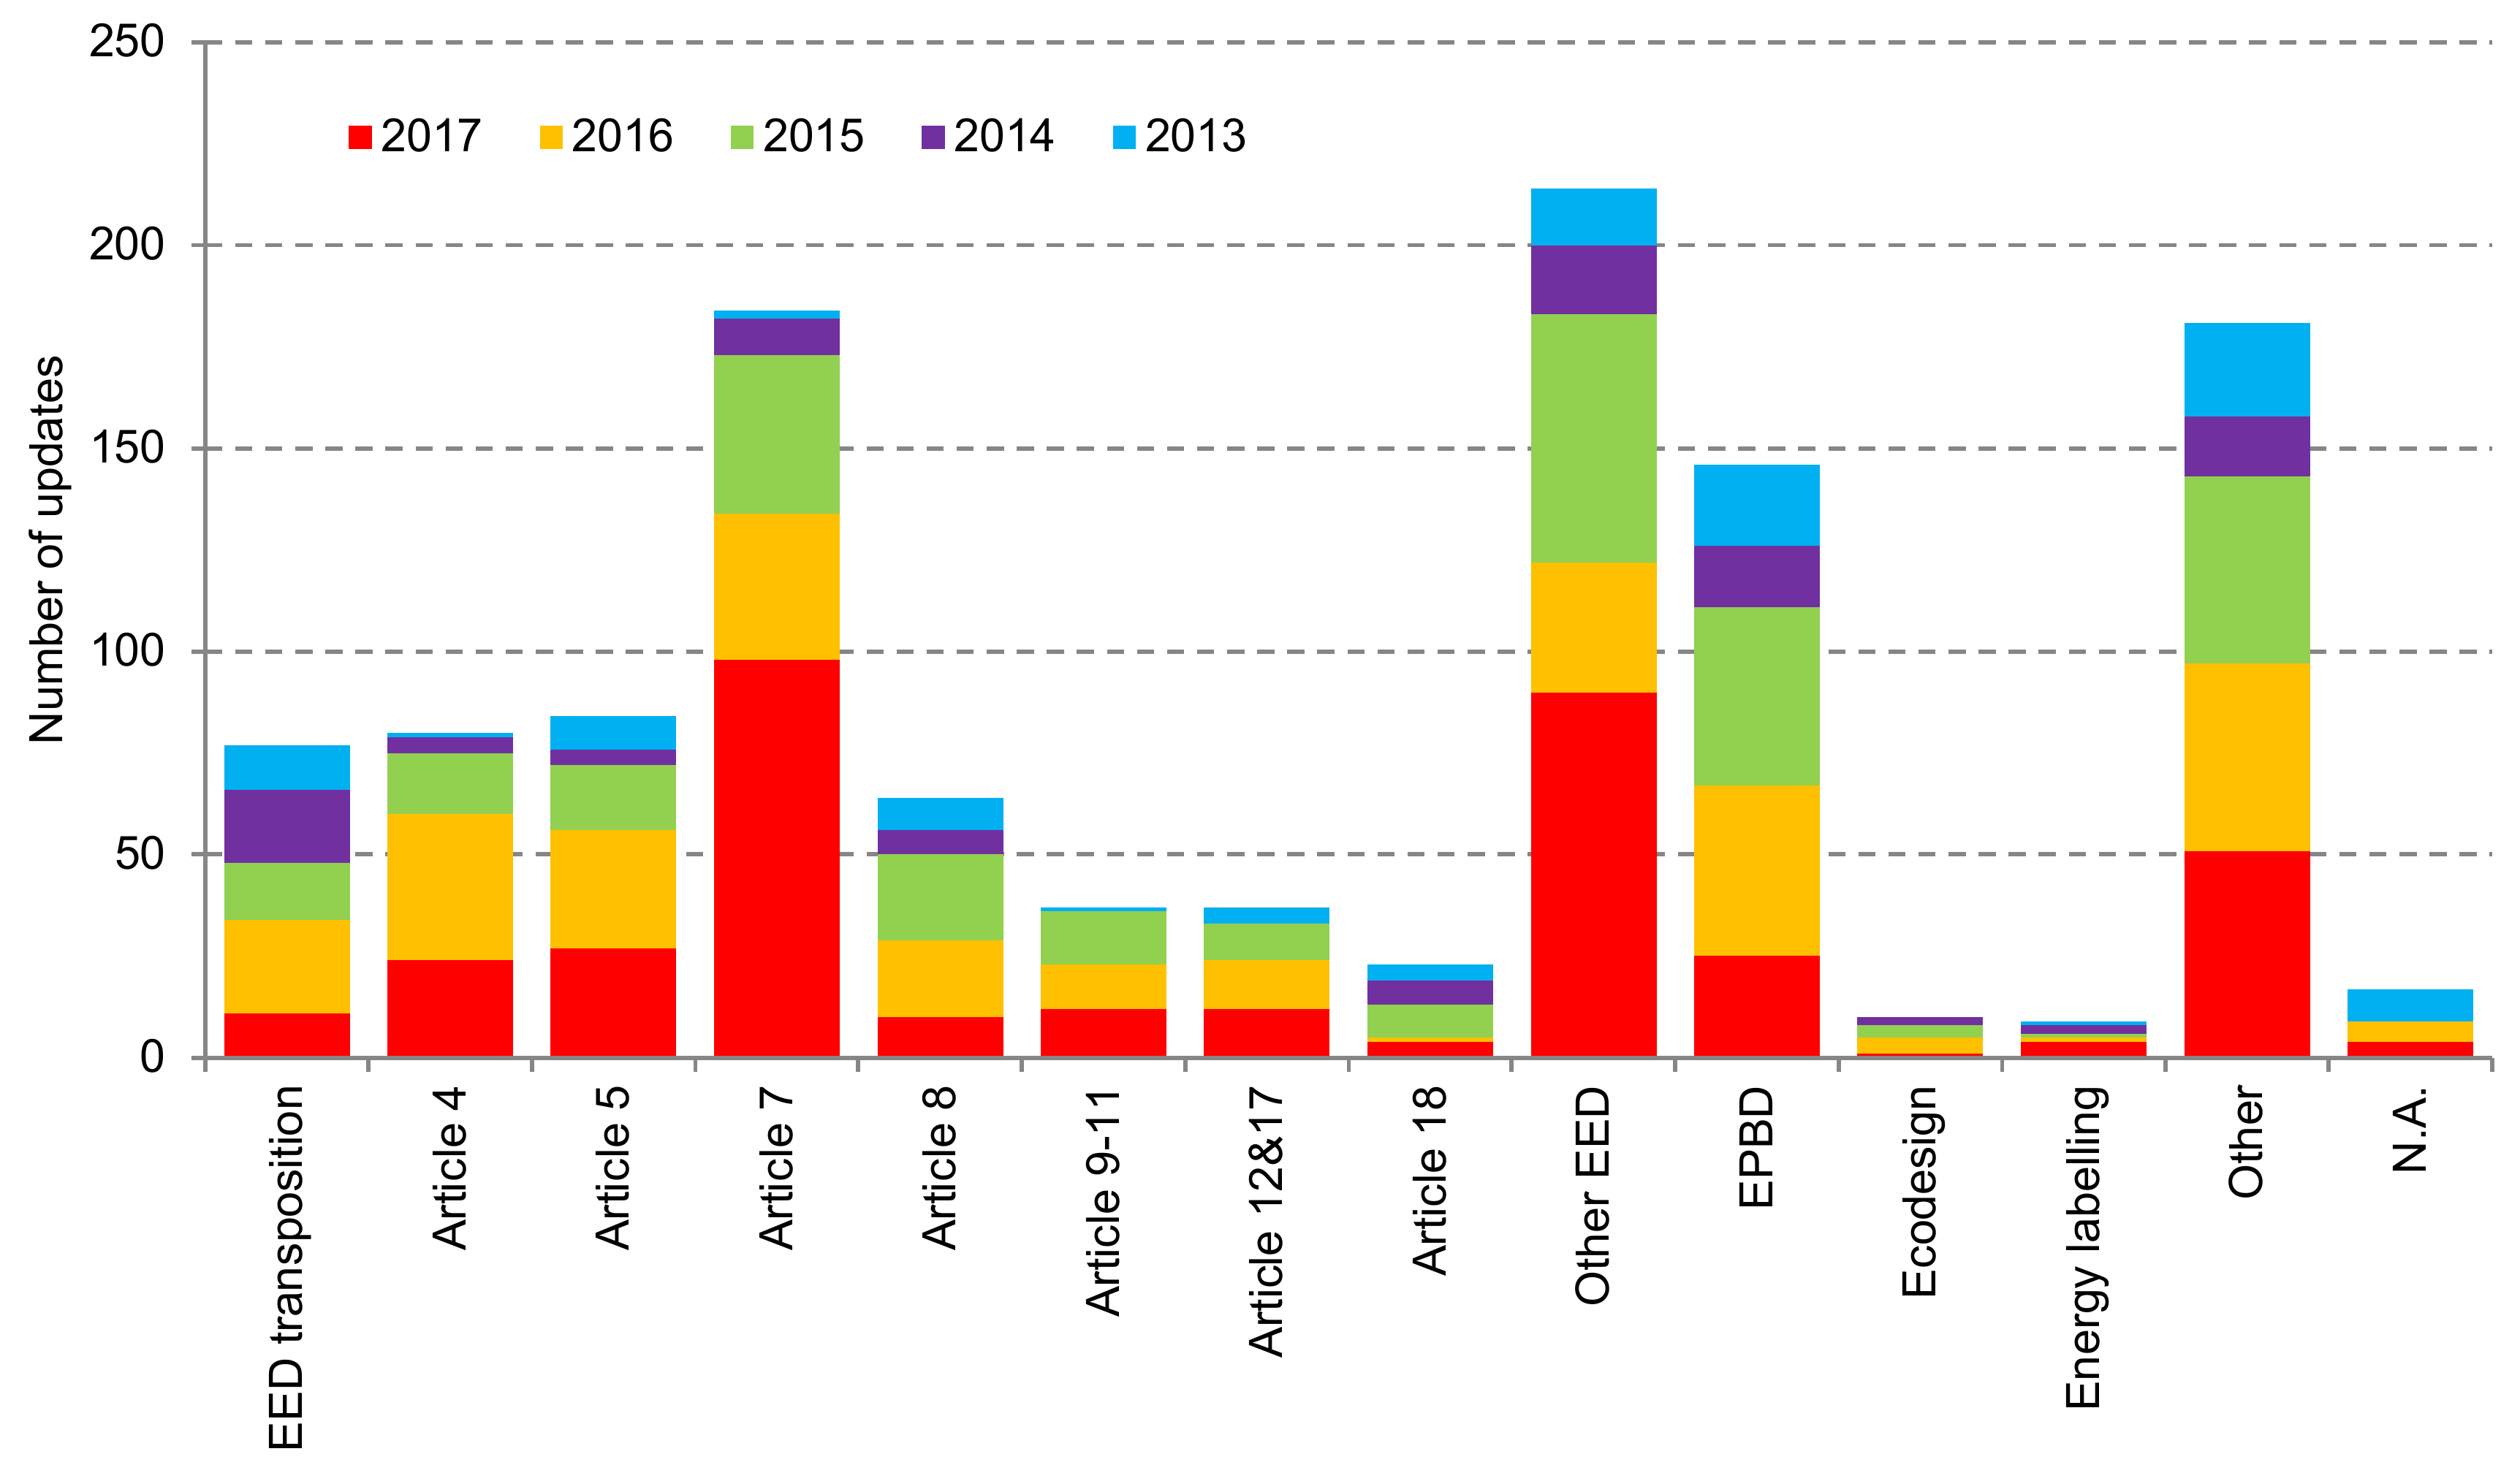
3.2. Updates on Major Legislative and Non-Legislative Measures
3.3. Progress on Article 5 Implementation
3.4 Progress on Article 7 Implementation
4. Conclusions
Author Contributions
Funding
Acknowledgments
Conflicts of Interest
Appendix A
References
- Rogelj, J.; den Elzen, M.; Höhne, N.; Fransen, T.; Fekete, H.; Winkler, H.; Schaeffer, R.; Sha, F.; Riahi, K.; Meinshausen, M. Paris Agreement climate proposals need a boost to keep warming well below 2 °C. Nature 2016, 534, 631–639. [Google Scholar] [CrossRef] [PubMed]
- Kerr, N.; Gouldson, A.; Barrett, J. The rationale for energy efficiency policy: Assessing the recognition of the multiple benefits of energy efficiency retrofit policy. Energy Policy 2017, 106, 212–221. [Google Scholar] [CrossRef]
- Ryan, L.; Campbell, N. Spreading the Net—The Multiple Benefits of Energy Efficiency Improvements; Information Paper; OECD/IEA: Paris, France, 2012. [Google Scholar]
- Heffner, G.; Campbell, N. Evaluating the Co-Benefits of Low-Income Energy-Efficiency Programmes; Results of the Dublin Workshop 27–28 January 2011; OECD/IEA: Paris, France, 2011. [Google Scholar]
- Akella, A.K.; Saini, R.P.; Sharma, M.P. Social, economical and environmental impacts of renewable energy systems. Renew. Energy 2009, 34, 390–396. [Google Scholar] [CrossRef]
- Ringel, M.; Knodt, M. The governance of the European Energy Union: Efficiency, effectiveness and acceptance of the Winter Package 2016. Energy Policy 2018, 112, 209–220. [Google Scholar] [CrossRef]
- Nejat, P.; Jomehzadeh, F.; Taheri, M.M.; Gohari, M.; Majid, M.Z. A global review of energy consumption, CO2 emissions and policy in the residential sector (with an overview of the top ten CO2 emitting countries). Renew. Sustain. Energy Rev. 2015, 43, 843–862. [Google Scholar] [CrossRef]
- Liu, Z.; Guan, D.; Moore, S.; Lee, H.; Su, J.; Zhang, Q. Climate policy: Steps to China’s carbon peak. Nature 2015, 522, 279–281. [Google Scholar] [CrossRef] [PubMed]
- World Energy Council. Energy Efficiency: A Straight Path towards Energy Sustainability; World Energy Perspectives—Energy Efficiency Policies; World Energy Council: London, UK, 2016. [Google Scholar]
- International Energy Agency (IEA). World Energy Outlook 2018; International Energy Agency: Paris, France, 2018. [Google Scholar]
- Obama, B. The irreversible momentum of clean energy. Science 2017, 355, 126–129. [Google Scholar] [CrossRef] [PubMed]
- Kanellakis, M.; Martinopoulos, G.; Zachariadis, T. European energy policy—A review. Energy Policy 2013, 62, 1020–1030. [Google Scholar] [CrossRef]
- European Union. Directive 2012/27/EU of the European Parliament and of the Council of 25 October 2012 on Energy Efficiency, Amending Directives 2009/125/EC and 2010/30/EU and Repealing Directives 2004/8/EC and 2006/32/EC. Brussels, 14 November 2012. Available online: https://eur-lex.europa.eu/legal-content/EN/TXT/?uri=celex%3A32012L0027 (accessed on 1 January 2019).
- European Union. Directive (EU) 2018/2002 of the European Parliament and of the Council of 11 December 2018 Amending Directive 2012/27/EU on Energy Efficiency. Available online: https://eur-lex.europa.eu/legal-content/EN/TXT/?uri=uriserv%3AOJ.L_.2018.328.01.0210.01.ENG (accessed on 1 January 2019).
- Economidou, M.; Labanca, N.; Castellazzi, L.; Serrenho, T.; Bertoldi, P.; Zancanella, P.; Paci, D.; Panev, S.; Gabrielaitiene, I. Assessment of the first National Energy Efficiency Action Plans under the Energy Efficiency Directive; EUR 28055 EN; European Union: Brussels, Belgium, 2016. [Google Scholar]
- Economidou, M.; Labanca, N.; Ribeiro Serrenho, T.; Castellazzi, L.; Panev, S.; Zancanella, P.; Broc, J.; Bertoldi, P. Assessment of the Second National Energy Efficiency Action Plans under the Energy Efficiency Directive; EUR 29272 EN; JRC110304; Publications Office of the European Union: Luxembourg, 2018; ISBN 978-92-79-87946-3. [Google Scholar]
- MURE (Mesures d’Utilisation Rationnelle de l’Energie) Database. Available online: http://www.measures-odyssee-mure.eu/ (accessed on October 2018).
- Economidou, M.; Kona, A.; Bertoldi, P. Implementation of the Energy Efficiency Directive: Progress, challenges and lessons learned. In Proceedings of the ECEEE 2017 Summer Study Proceedings, Toulon, France, 29 May–3 June 2017. [Google Scholar]
- Paolo, Z.; Marina, E.; Albana, K. Analysis of the Annual Reports 2017 under the Energy Efficiency Directive—Summary Report; EUR 28922 EN; JRC108810; Publications Office of the European Union: Luxembourg, 2017; ISBN 978-92-79-77040-1. [Google Scholar]
- Sofia, T.T.; Nicola, L.; Barbara, C.; Agne, T.; Paolo, Z.; Paolo, B. Analysis of the Annual Reports 2018 under the Energy Efficiency Directive—Summary Report; EUR 29667 EN; Publications Office of the European Union: Luxembourg, 2018. [Google Scholar]
- European Commission. Commission Staff Working Document, SWD(2013) 541 Final. “Progress Report on Energy Efficiency in the European Union Accompanying the Document Report from the Commission to the European Parliament and the Council Progress Report on the application of Directive 2006/32/EC on Energy End-Use Efficiency and Energy Services and on the Application of Directive 2004/8/EC on the Promotion of Cogeneration Based on a Useful Heat Demand in the Internal Energy Market {COM(2013) 938 Final}”. 2014. Available online: https://ec.europa.eu/energy/sites/ener/files/documents/swd-2013-541.pdf (accessed on 1 January 2019).
- European Commission. Commission Staff Working Document, SWD (2015) 245 Final. Report from the Commission to the European Parliament and the Council, Assessment of the Progress Made by Member States towards the National Energy Efficiency Targets for 2020 and towards the Implementation of the Energy Efficiency Directive 2012/27/EU as Required by Article 24 (3) of Energy Efficiency Directive 2012/27/EU, COM(2015) 574 Final. Brussels, 18 November 2015. Available online: https://ec.europa.eu/energy/sites/ener/files/documents/2a_EE%20progress%20report%20-%20CSWD%20part%201.pdf (accessed on 1 January 2019).
- European Commission. Report from the Commission to the European Parliament and the Council, Assessment of the Progress Made by Member States in 2014 towards the National Energy Efficiency Targets for 2020 and towards the Implementation of the Energy Efficiency Directive 2012/27/EU as required by Article 24 (3) of the Energy Efficiency Directive 2012/27/EU, COM/2017/056 Final. Brussels, 1 February 2017. Available online: https://eur-lex.europa.eu/legal-content/en/TXT/?uri=CELEX:52017DC0056 (accessed on 1 January 2019).
- European Commission. Report from the Commission to the European Parliament and the Council, Assessment of the Progress Made by Member States towards the National Energy Efficiency Targets for 2020 and towards the Implementation of the Energy Efficiency Directive as Required by Article 24(3) of the Energy Efficiency Directive 2012/27/EU, COM(2017) 687 Final. Brussels, 23 November 2017. Available online: https://eur-lex.europa.eu/legal-content/en/TXT/?uri=CELEX:52017DC0687 (accessed on 1 January 2019).
- Annual Reports and National Energy Efficiency Action Plans. Available online: https://ec.europa.eu/energy/en/topics/energy-efficiency/energy-efficiency-directive/national-energy-efficiency-action-plans (accessed on 1 October 2018).
- Eurostat Database. Available online: http://ec.europa.eu/eurostat/data/database (accessed on 1 July 2018).
- Economidou, M. Assessing the Progress towards the EU Energy Efficiency Targets Using Index Decomposition Analysis; EUR 28710 EN; JRC106782; Publications Office of the European Union: Luxembourg, 2017; ISBN 978-92-79-71299-9. [Google Scholar]
- European Union. Directive 2009/125/EC of the European Parliament and of the Council of 21 October 2009 Establishing a Framework for the Setting of Ecodesign Requirements for Energy-Related Products (Recast). Available online: https://eur-lex.europa.eu/legal-content/EN/ALL/?uri=CELEX%3A32009L0125 (accessed on 1 January 2019).
- European Union. Directive 2010/30/EU of the European Parliament and of the Council of 19 May 2010 on the Indication by Labelling and Standard Product Information of the Consumption of Energy and Other Resources by Energy-Related Products (Recast). Available online: https://eur-lex.europa.eu/legal-content/EN/ALL/?uri=CELEX%3A32010L0030 (accessed on 1 January 2019).
- European Union. Directive 2010/31/EU of the European Parliament and of the Council of 19 May 2010 on the Energy Performance of Buildings (Recast). Available online: https://eur-lex.europa.eu/eli/dir/2010/31/oj (accessed on 1 January 2019).
- Fawcett, T.; Rosenow, J.; Bertoldi, P. Energy efficiency obligation schemes: Their future in the EU. Energy Effic. 2019, 12, 57–71. [Google Scholar] [CrossRef]
- Kampman, B.; Nieuwenhuijse, I.; van de Water, S. Implementation of EED Article 7—Updating the Database; Publication Code: 19.3R57.005; Technical Assistance for DG Energy: Delft, The Netherlands, 2019. [Google Scholar]
- European Commission. Procedure 2016/0375 (COD). Proposal for a Regulation of the European Parliament and of the Council on the Governance of the Energy Union, Amending Directive 94/22/EC, Directive 98/70/EC, Directive 2009/31/EC, Regulation (EC) No 663/2009, Regulation (EC) No 715/2009, Directive 2009/. European Commission: Brussels, Belgium. Available online: https://eur-lex.europa.eu/procedure/EN/2016_375 (accessed on 1 January 2019).
- European Union. Regulation (EU) 2018/1999 of the European Parliament and of the Council of 11 December 2018 on the Governance of the Energy Union and Climate Action, Amending Regulations (EC) No 663/2009 and (EC) No 715/2009 of the European Parliament and of the Council, Directives 94/22/EC, 98/70/EC, 2009/31/EC, 2009/73/EC, 2010/31/EU, 2012/27/EU and 2013/30/EU of the European Parliament and of the Council, Council Directives 2009/119/EC and (EU) 2015/652 and Repealing Regulation (EU) No 525/2013 of the European Parliament and of the Council. Available online: https://eur-lex.europa.eu/legal-content/EN/TXT/?toc=OJ:L:2018:328:TOC&uri=uriserv:OJ.L_.2018.328.01.0001.01.ENG (accessed on 1 January 2019).
- European Commission. Procedure 2016/0376 (COD). Proposal for a Directive of the European Parliament And of the Council amending Directive 2012/27/EU on energy efficiency. European Commission: Brussels, Belgium. Available online: https://eur-lex.europa.eu/procedure/EN/2016_376 (accessed on 1 January 2019).


| AR Year | AT | BE | BG | CY | CZ | DE | DK | EE | EL | ES | FI | FR | HR | HU | IE | IT | LT | LU | LV | MT | NL | PL | PT | RO | SE | SI | SK | UK |
|---|---|---|---|---|---|---|---|---|---|---|---|---|---|---|---|---|---|---|---|---|---|---|---|---|---|---|---|---|
| 2015 | x | x | x | x | x | x | x | |||||||||||||||||||||
| 2016 | x | x | x | x | x | x | x | x | x | x | x | x | x | x | ||||||||||||||
| 2017 | x | x | x | x | x | x | x | x | x | x | x | x | ||||||||||||||||
| 2018 | x | x | x | x | x | x | x | x | x | x | x | x | x | x |
| MS | Total FEC 2016 vs. 2011 | Annual Stable/Growing FEC | |||
|---|---|---|---|---|---|
| Industry | Transport | Residential | Services | ||
| AT | +4% | 2012, 2013, 2014, 2015, 2016 | 2013, 2015, 2016 | 2012, 2013, 2015, 2016 | 2014, 2015, 2016 |
| BE | +4% | 2012, 2013, 2014, 2015, 2016 | 2014, 2015, 2016 | 2012, 2013, 2015, 2016 | 2012, 2013, 2015, 2016 |
| BG | +4% | 2013, 2014, 2015, | 2012, 2014, 2015, 2016 | 2012, 2015, 2016 | 2015, 2016 |
| HR | −5% | 2014, 2015, 2016 | 2013, 2015, 2016 | 2015, 2016 | 2015, 2016 |
| CY | -8% | 2013, 2014, 2016 | 2015, 2016 | 2015, 2016 | 2015, 2016 |
| CZ | +1% | 2012, 2013, 2015, 2016 | 2013, 2014, 2015, 2016 | 2012, 2013, 2015, 2016 | 2015, 2016 |
| DK | −2% | 2014, 2015, 2016 | 2014, 2015, 2016 | 2013, 2015, 2016 | 2012, 2013, 2015, 2016 |
| EE | −1% | 2014 | 2012, 2014, 2015, 2016 | 2012, 2016 | 2012, 2014, 2015, 2016 |
| FI | +1% | 2014, 2015, 2016 | 2013, 2015, 2016 | 2012, 2014, 2016 | 2012, 2014, 2016 |
| FR | +2% | 2015, 2016 | 2012, 2013, 2014, 2015, 2016 | 2012, 2013, 2015, 2016 | 2012, 2013, 2015, 2016 |
| DE | +4% | 2012, 2013, 2014, 2015, 2016 | 2012, 2013, 2014, 2015, 2016 | 2012, 2013, 2015, 2016 | 2012, 2013, 2015, |
| EL | −11% | 2013, 2014, 2015 | 2013, 2014, 2015, 2016 | 2014, 2015 | 2012, 2015, 2016 |
| HU | +1% | 2012, 2013, 2014, 2015, 2016 | 2014, 2015, 2016 | 2015, 2016 | 2013, 2015, 2016 |
| IE | +6% | 2013, 2014, 2015, 2016 | 2013, 2014, 2015, 2016 | 2012, 2013, 2015 | 2012, 2015, 2016 |
| IT | −6% | 2014, 2016 | 2014 | 2012, 2013, 2015, 2016 | 2012, 2013, 2015, 2016 |
| LV | −1% | 2012, 2014, 2015 | 2013, 2014, 2015, 2016 | 2012, 2016 | 2012, 2014, 2016 |
| LT | +7% | 2012, 2014, 2016 | 2012, 2013, 2014, 2015, 2016 | 2012, 2016 | 2012, 2016 |
| LU | −6% | 2014, 2016 | 2016 | 2012, 2013, 2015 | 2012, 2013, 2015, 2016 |
| MT | +18% | 2012, 2014, 2015 | 2013, 2014, 2015, 2016 | 2012, 2013, 2014, 2015, 2016 | 2012, 2013, 2014, 2015 |
| NL | −4% | 2014, 2015, 2016 | 2015, 2016 | 2012, 2013, 2015, 2016 | 2012, 2013, 2015, 2016 |
| PL | +3% | 2013, 2014, 2015, 2016 | 2014, 2015, 2016 | 2012, 2015, 2016 | 2012, 2015, 2016 |
| PT | −7% | 2014, 2015 | 2014, 2015, 2016 | 2016 | 2012, 2014, 2015 |
| RO | −2% | 2014, 2015 | 2012, 2014, 2015, 2016 | 2012, 2015, 2016 | 2012, 2013, 2014, 2015, 2016 |
| SK | −3% | 2012, 2013, 2014, 2015, 2016 | 2013, 2015, 2016 | 2013, 2015, 2016 | 2013, 2015, 2016 |
| SI | −3% | 2013, 2014, 2015, 2016 | 2012, 2016 | 2015, 2016 | 2013, 2015, 2016 |
| ES | −5% | 2014, 2016 | 2014, 2015, 2016 | 2012, 2015, 2016 | 2015, 2016 |
| SE | +1% | 2014, 2015, 2016 | 2013, 2014, 2015, 2016 | 2012, 2015, 2016 | 2012, 2014, 2015, 2016 |
| UK | +1% | 2012, 2013, 2015 | 2012, 2013, 2014, 2015, 2016 | 2012, 2013, 2015, 2016 | 2012, 2013, 2015, 2016 |
| Sector | Explanation |
|---|---|
| Industry | Economy growth (increase of the Gross Value Added of industry or by the Gross Domestic Product). Employment growth. Production growth. |
| Transport | Activity growth (increase of the total mileage, the flows of passengers and freight or the amount of exports). Reduction of the international fuel prices. Economy growth (increase of the Gross Domestic Product). Vehicles’ number growth. |
| Residential | Increase of the Heating Degree Days (HDD). Population growth Households’ number growth. Increase of the disposable income of households. Increase of electric appliances and electronic equipment of households. Decline of international fuel prices. |
| Services | Economy growth (increase of the Gross Value Added of services or by the Gross Domestic Product). Increase of the Heating Degree Days (HDD). Employment growth. Reduction of the international fuel prices. |
| Category | Classification |
|---|---|
| Legal basis | General transposition: Energy Efficiency Directive EED Energy Efficiency Obligation Scheme Art. 7 EED Alternative measure Art. 7 EED Renovation roadmap Art. 4 EED Exemplary role and purchasing by public bodies Art. 5 and 6 EED Public sector renovations Art. 5 EED Energy audits in large enterprises Art. 8 EED Metering Art. 9 EED Billing Art. 10 and 11 EED Consumer information, empowering programme, information and training Art. 12 and 17 EED Efficiency in heating and cooling (cogeneration, district heating and cooling) Art. 14 EED Demand response and efficiency in transformation and distribution networks Art. 15 EED Qualification, accreditation and certification schemes Art. 16 EED Energy services & performance contracting Art. 18 EED Other measures to promote energy efficiency Art. 19 EED National Energy Efficiency Fund Art. 19 EED Other EED-related measures Energy performance certificates Nearly zero energy buildings Minimum energy performance requirements Other measures related to the Energy Performance of Building Directive (EPBD) Energy labelling Ecodesign Other |
| Type of measure | Regulations and legislative measures Market-based instruments (e.g., Energy Efficiency Obligation Schemes) Funds, financial measures & fiscal incentives Information, knowledge & advice Competitions, pilot & demonstration projects Market surveillance Plans & strategies Voluntary agreements Other |
| Type of update | Adoption of a new measure, conclusion of agreement, publication of legislation, commencement/enforcement of a measure/programme Abolition/termination/completion of measure Amendments, implementation or design changes and extension of an on-going measure Monitoring information, update on progress or impact assessment results Continuation of existing measures/no significant updates Drafts, announcements, commitments, planned measures, discussions for a new measure Other |
| MS | Progress in Terms of Renovated Floor Area [m2] | Progress in Terms of Ratio Between Renovated Floor Area and Annual Requirement | ||||||
|---|---|---|---|---|---|---|---|---|
| 2014 | 2015 | 2016 | 2017 | 2014 | 2015 | 2016 | 2017 | |
| BG | n.a. | 72 000 | n.a. | 28 101 | n.a. | 28% | n.a. | 42% |
| EE | 17 022 | 56 321 | n.a. | 40 701 | n.a. | 184% | n.a. | 133% |
| EL | n.a. | n.a. | n.a. | n.a. | n.a. | n.a. | n.a. | n.a. |
| ES | 306 550 | 382 581 | 248 695 | 302 209 | n.a. | 132% | 90% | 110% |
| HU | n.a. | 11 184 | n.a. | n.a. | n.a. | 85% | n.a. | n.a. |
| IT | 561 090 | 468 243 | 559 737 | 459 045 | n.a. | 124% | 135% | 111% |
| LT | n.a. | 24 586 | 45 559 | 77 610 | n.a. | 76% | 143% | 161% |
| LU | n.a. | 4 281 | n.a. | 16043 | n.a. | 124% | n.a. | 709% |
| LV | 232 635 | 136 155 | n.a. | 136 155 | 299% | 206% | n.a. | 227% |
| RO | n.a. | n.a. | n.a. | n.a. | n.a. | n.a. | n.a. | n.a. |
| SI | n.a. | n.a. | 11 307 | 23 514 | n.a. | n.a. | 49% | 102% |
| MS | Progress in Terms of Energy Saved from New Measures Implemented in the Reference Year [ktoe] | Progress in Terms of Ratio between Energy Saved from New Measures and Annual Requirement | ||||||
|---|---|---|---|---|---|---|---|---|
| 2014 | 2015 | 2016 | 2017 | 2014 | 2015 | 2016 | 2017 | |
| AT | 0.318 | 0.540 | 0.170 | n.a. | 54% | 92% | 29% | n.a. |
| BE | n.a. | 0.465 | 4.060 | n.a. | n.a. | 100% | 871% | n.a. |
| CY | 0.299 | 0.295 | 0.261 | 0.268 | 105% | 103% | 92% | 94% |
| CZ | 0.173 | 0.251 | 0.170 | 0.592 | 51% | 74% | 50% | 176% |
| DE | n.a. | 0.612 | n.a. | 0.404 | n.a. | 109% | n.a. | 72% |
| DK | n.a. | n.a. | n.a. | 0 | n.a. | n.a. | n.a. | 0% |
| FI | 0.759 | 0.427 | n.a. | n.a. | 687% | 386% | n.a. | n.a. |
| FR | 49.000 | 118.659 | n.a. | 120.378 | 138% | 334% | n.a. | 339% |
| HR | 0.262 | 1.466 | 0.703 | 0.789 | 224% | 1255% | 602% | 675% |
| IE | 0.757 | 0.790 | 0.054 | 0.149 | 470% | 491% | 34% | 133% |
| MT | n.a. | n.a. | n.a. | n.a. | n.a. | n.a. | n.a. | n.a. |
| NL | n.a. | 2.723 | n.a. | n.a. | n.a. | 65% | n.a. | n.a. |
| PL | 0.385 | 0.374 | 0.468 | 0.577 | 103% | 100% | 125% | 154% |
| PT | n.a. | n.a. | 0.035 | 0.011 | n.a. | n.a. | n.a. | n.a. |
| SE | 0.621 | 1.582 | n.a. | n.a. | 27% | 69% | n.a. | n.a. |
| SK | 0.073 | 4.709 | 1.979 | 4.145 | 2% | 105% | 44% | 92% |
| UK | 23.388 | 10.000 | 2.244 | 2.089 | 665% | 284% | 64% | 59% |
| MS | Implementation Approach | Total Cumulative Savings Requirement in 2014–2020 under Article 7 [ktoe] | Savings Achieved from New Actions and from Actions Already Implemented that Continue Delivering Savings [ktoe] | Cumulative Savings Achieved over the Period 2014–2016 against Expected Average Savings on the Basis of Linear Delivery [%] | |||
|---|---|---|---|---|---|---|---|
| Obligation Schemes | Alternative Measures | 2014 | 2015 | 2016 | |||
| BE | x | 6911 | 330 | 545 | 779 | 112% | |
| BG | x | 1942 | 29 | 50 | 99 | 43% | |
| CZ | x | 4882 | 50 | 160 | 310 | 50% | |
| DK | x | 3841 | 219 | 496 | 758 | 179% | |
| DE | x | 41989 | 2541 | 3316 | 4085 | 111% | |
| EE | x | 610 | 41 | 58 | 184 | 217% | |
| IE | x | x | 2164 | 71 | 208 | 330 | 131% |
| EL | x | x | 3333 | 74 | 134 | 174 | 54% |
| ES | x | x | 15979 | 565 | 1079 | 1536 | 93% |
| FR | x | x | 31384 | 1410 | 2192 | 2887 | 96% |
| HR | x | 1296 | 3 | 21 | n.a. | 22% | |
| IT | x | x | 25502 | 1298 | 1399 | 4565 | 133% |
| CY | x | 242 | 2 | 4 | 6 | 24% | |
| LV | x | x | 851 | 8 | 17 | 32 | 31% |
| LT | x | 1004 | 45 | 53 | 86 | 86% | |
| LU | x | 515 | 0 | 10 | 14 | 22% | |
| HU | x | 3680 | 75 | 274 | 292 | 81% | |
| MT | x | x | 67 | 4 | 7 | 8 | 129% |
| NL | x | 11512 | 666 | 1130 | 3416 | 211% | |
| AT | x | x | 5200 | 245 | 637 | 1026 | 171% |
| PL | x | 14818 | 213 | 1661 | 3268 | 162% | |
| PT | x | 2532 | 46 | 65 | 94 | 38% | |
| RO | x | 5817 | 364 | 337 | n.a. | n.a. | |
| SI | x | x | 945 | 18 | 87 | 180 | 141% |
| SK | x | 2284 | 72 | 185 | n..a | n.a. | |
| FI | x | 4213 | 561 | 580 | n.a. | 529% | |
| SE | x | 9114 | 252 | 1264 | n.a. | n.a. | |
| UK | x | x | 27859 | 1195 | 2029 | 2984 | 104% |
| EU28 | 230486 | 12176 | 17999 | n.a. | n.a. | ||
© 2019 by the authors. Licensee MDPI, Basel, Switzerland. This article is an open access article distributed under the terms and conditions of the Creative Commons Attribution (CC BY) license (http://creativecommons.org/licenses/by/4.0/).
Share and Cite
Zangheri, P.; Economidou, M.; Labanca, N. Progress in the Implementation of the EU Energy Efficiency Directive through the Lens of the National Annual Reports. Energies 2019, 12, 1107. https://doi.org/10.3390/en12061107
Zangheri P, Economidou M, Labanca N. Progress in the Implementation of the EU Energy Efficiency Directive through the Lens of the National Annual Reports. Energies. 2019; 12(6):1107. https://doi.org/10.3390/en12061107
Chicago/Turabian StyleZangheri, Paolo, Marina Economidou, and Nicola Labanca. 2019. "Progress in the Implementation of the EU Energy Efficiency Directive through the Lens of the National Annual Reports" Energies 12, no. 6: 1107. https://doi.org/10.3390/en12061107
APA StyleZangheri, P., Economidou, M., & Labanca, N. (2019). Progress in the Implementation of the EU Energy Efficiency Directive through the Lens of the National Annual Reports. Energies, 12(6), 1107. https://doi.org/10.3390/en12061107