Emissions from Solid Fuel Cook Stoves in the Himalayan Region

 and
and
Abstract
1. Introduction
2. Methodology
2.1. In-Field Sampling
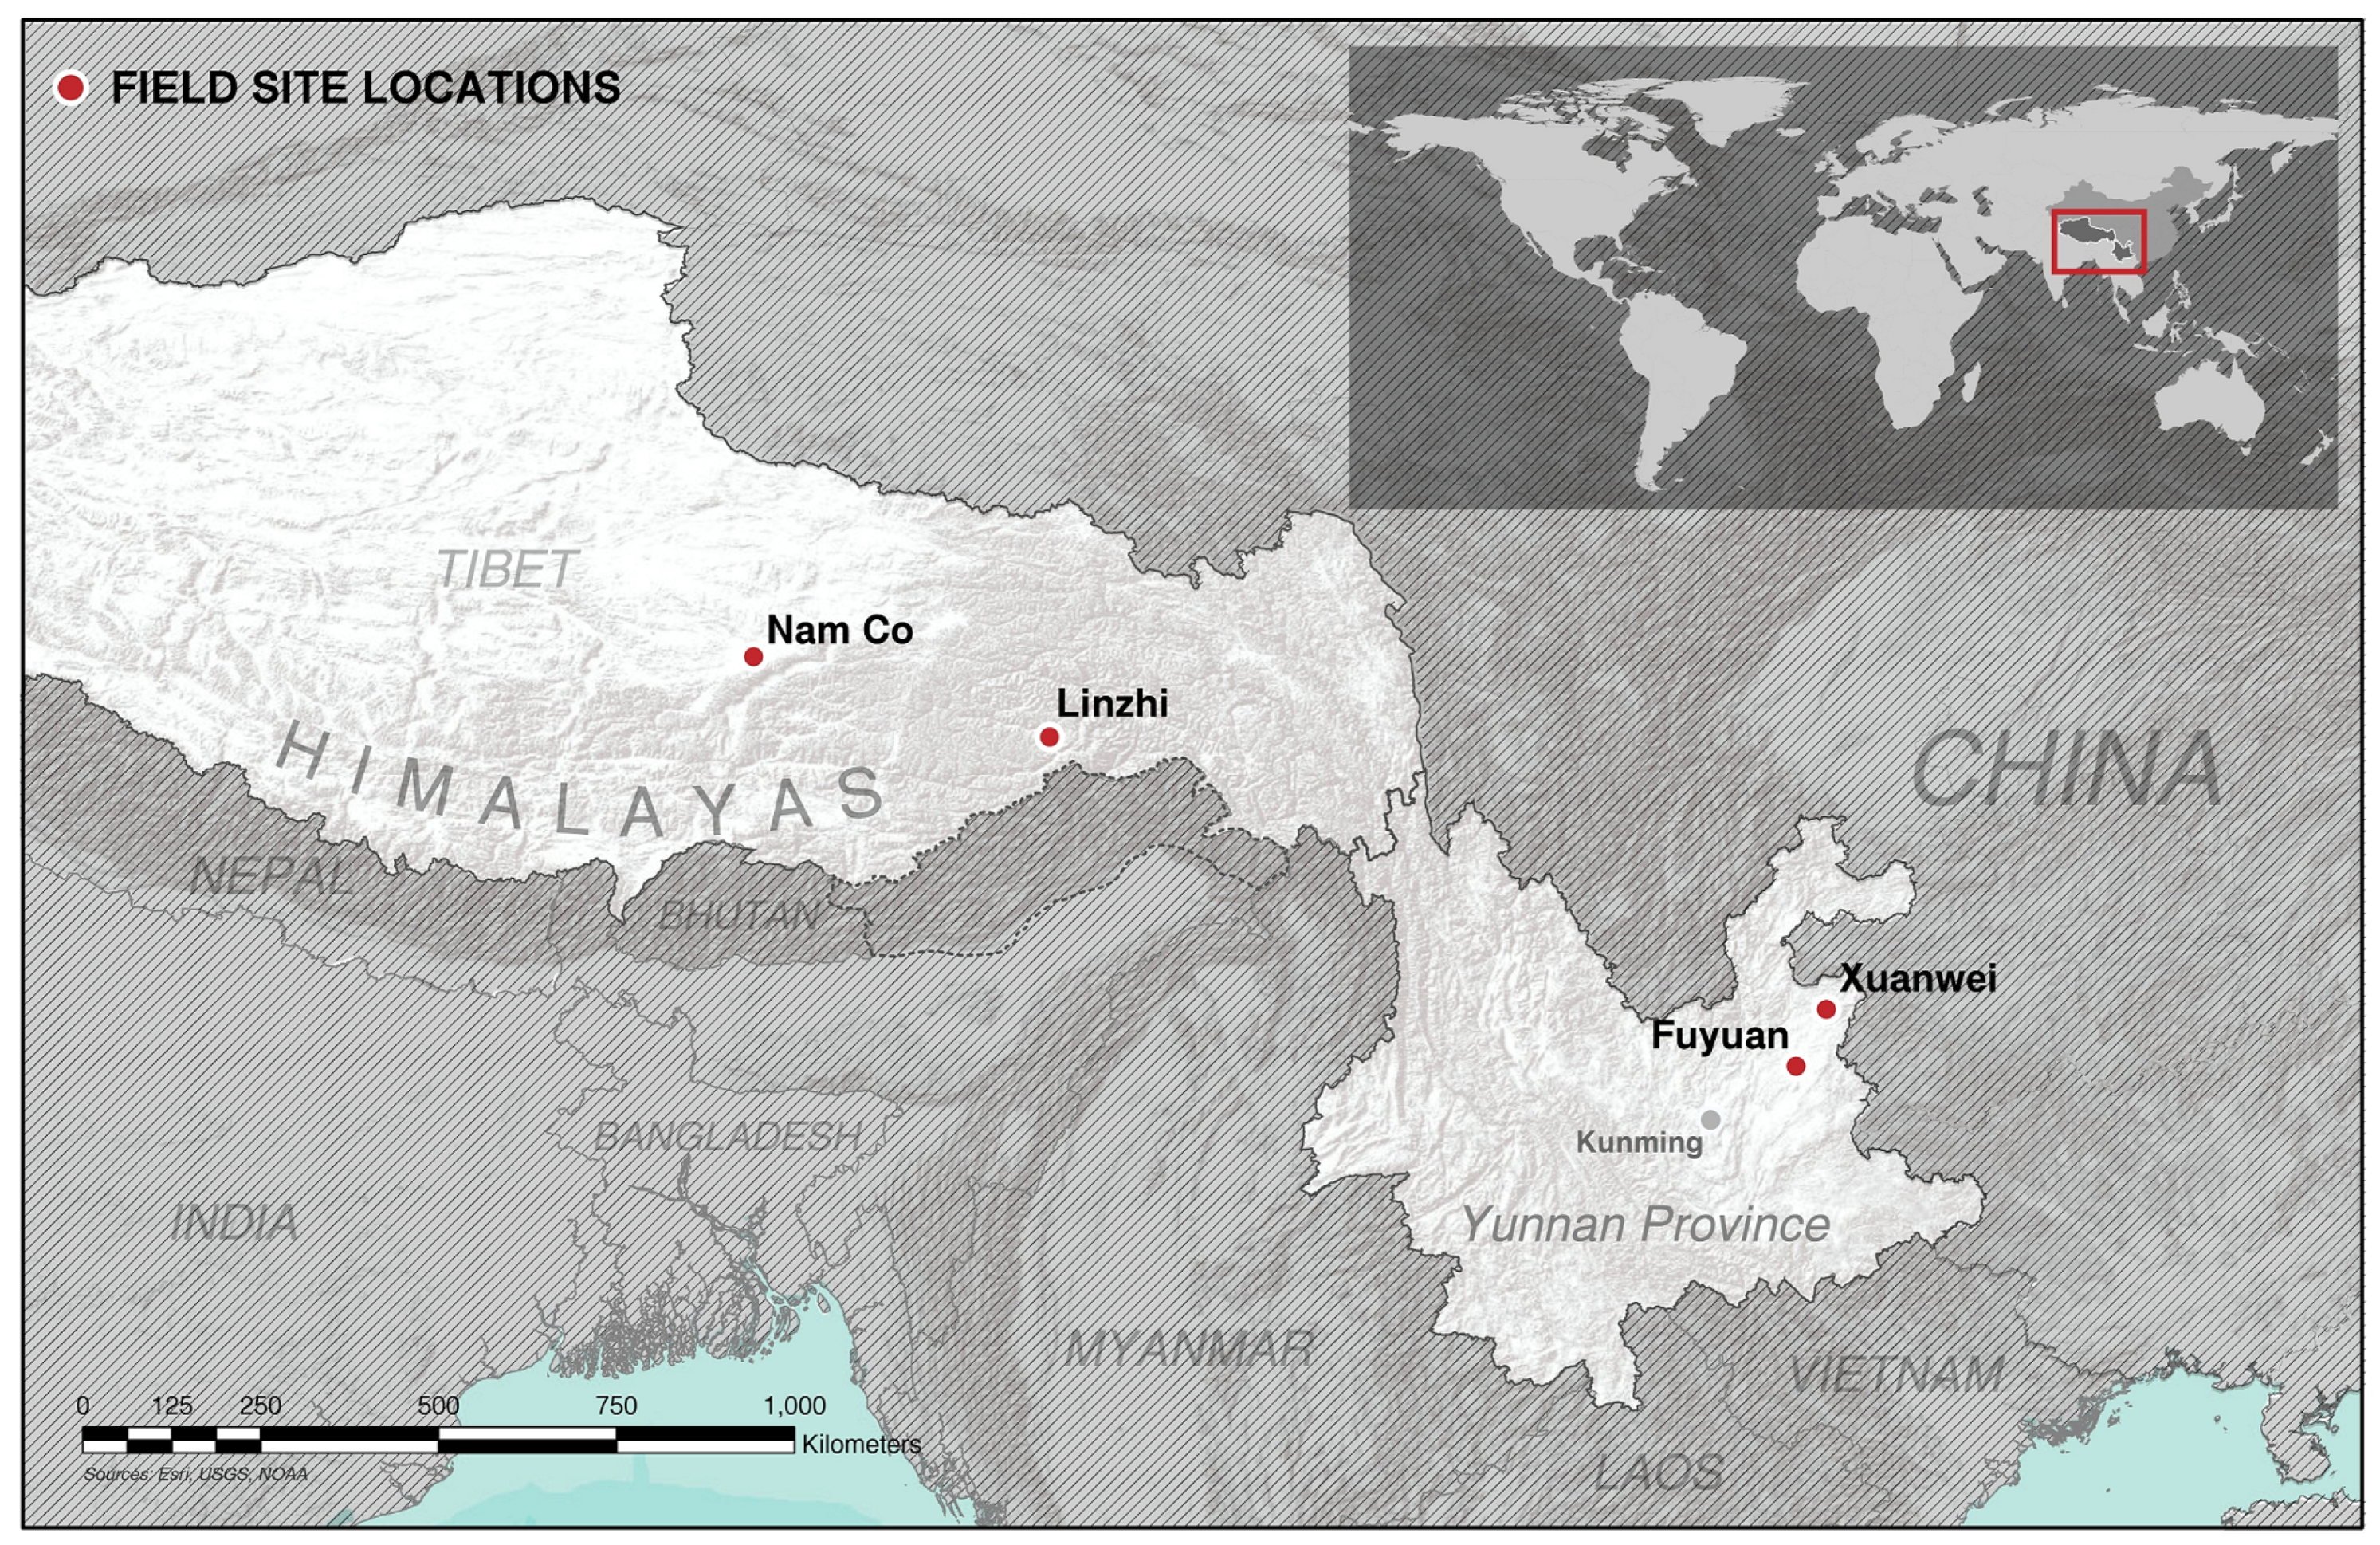
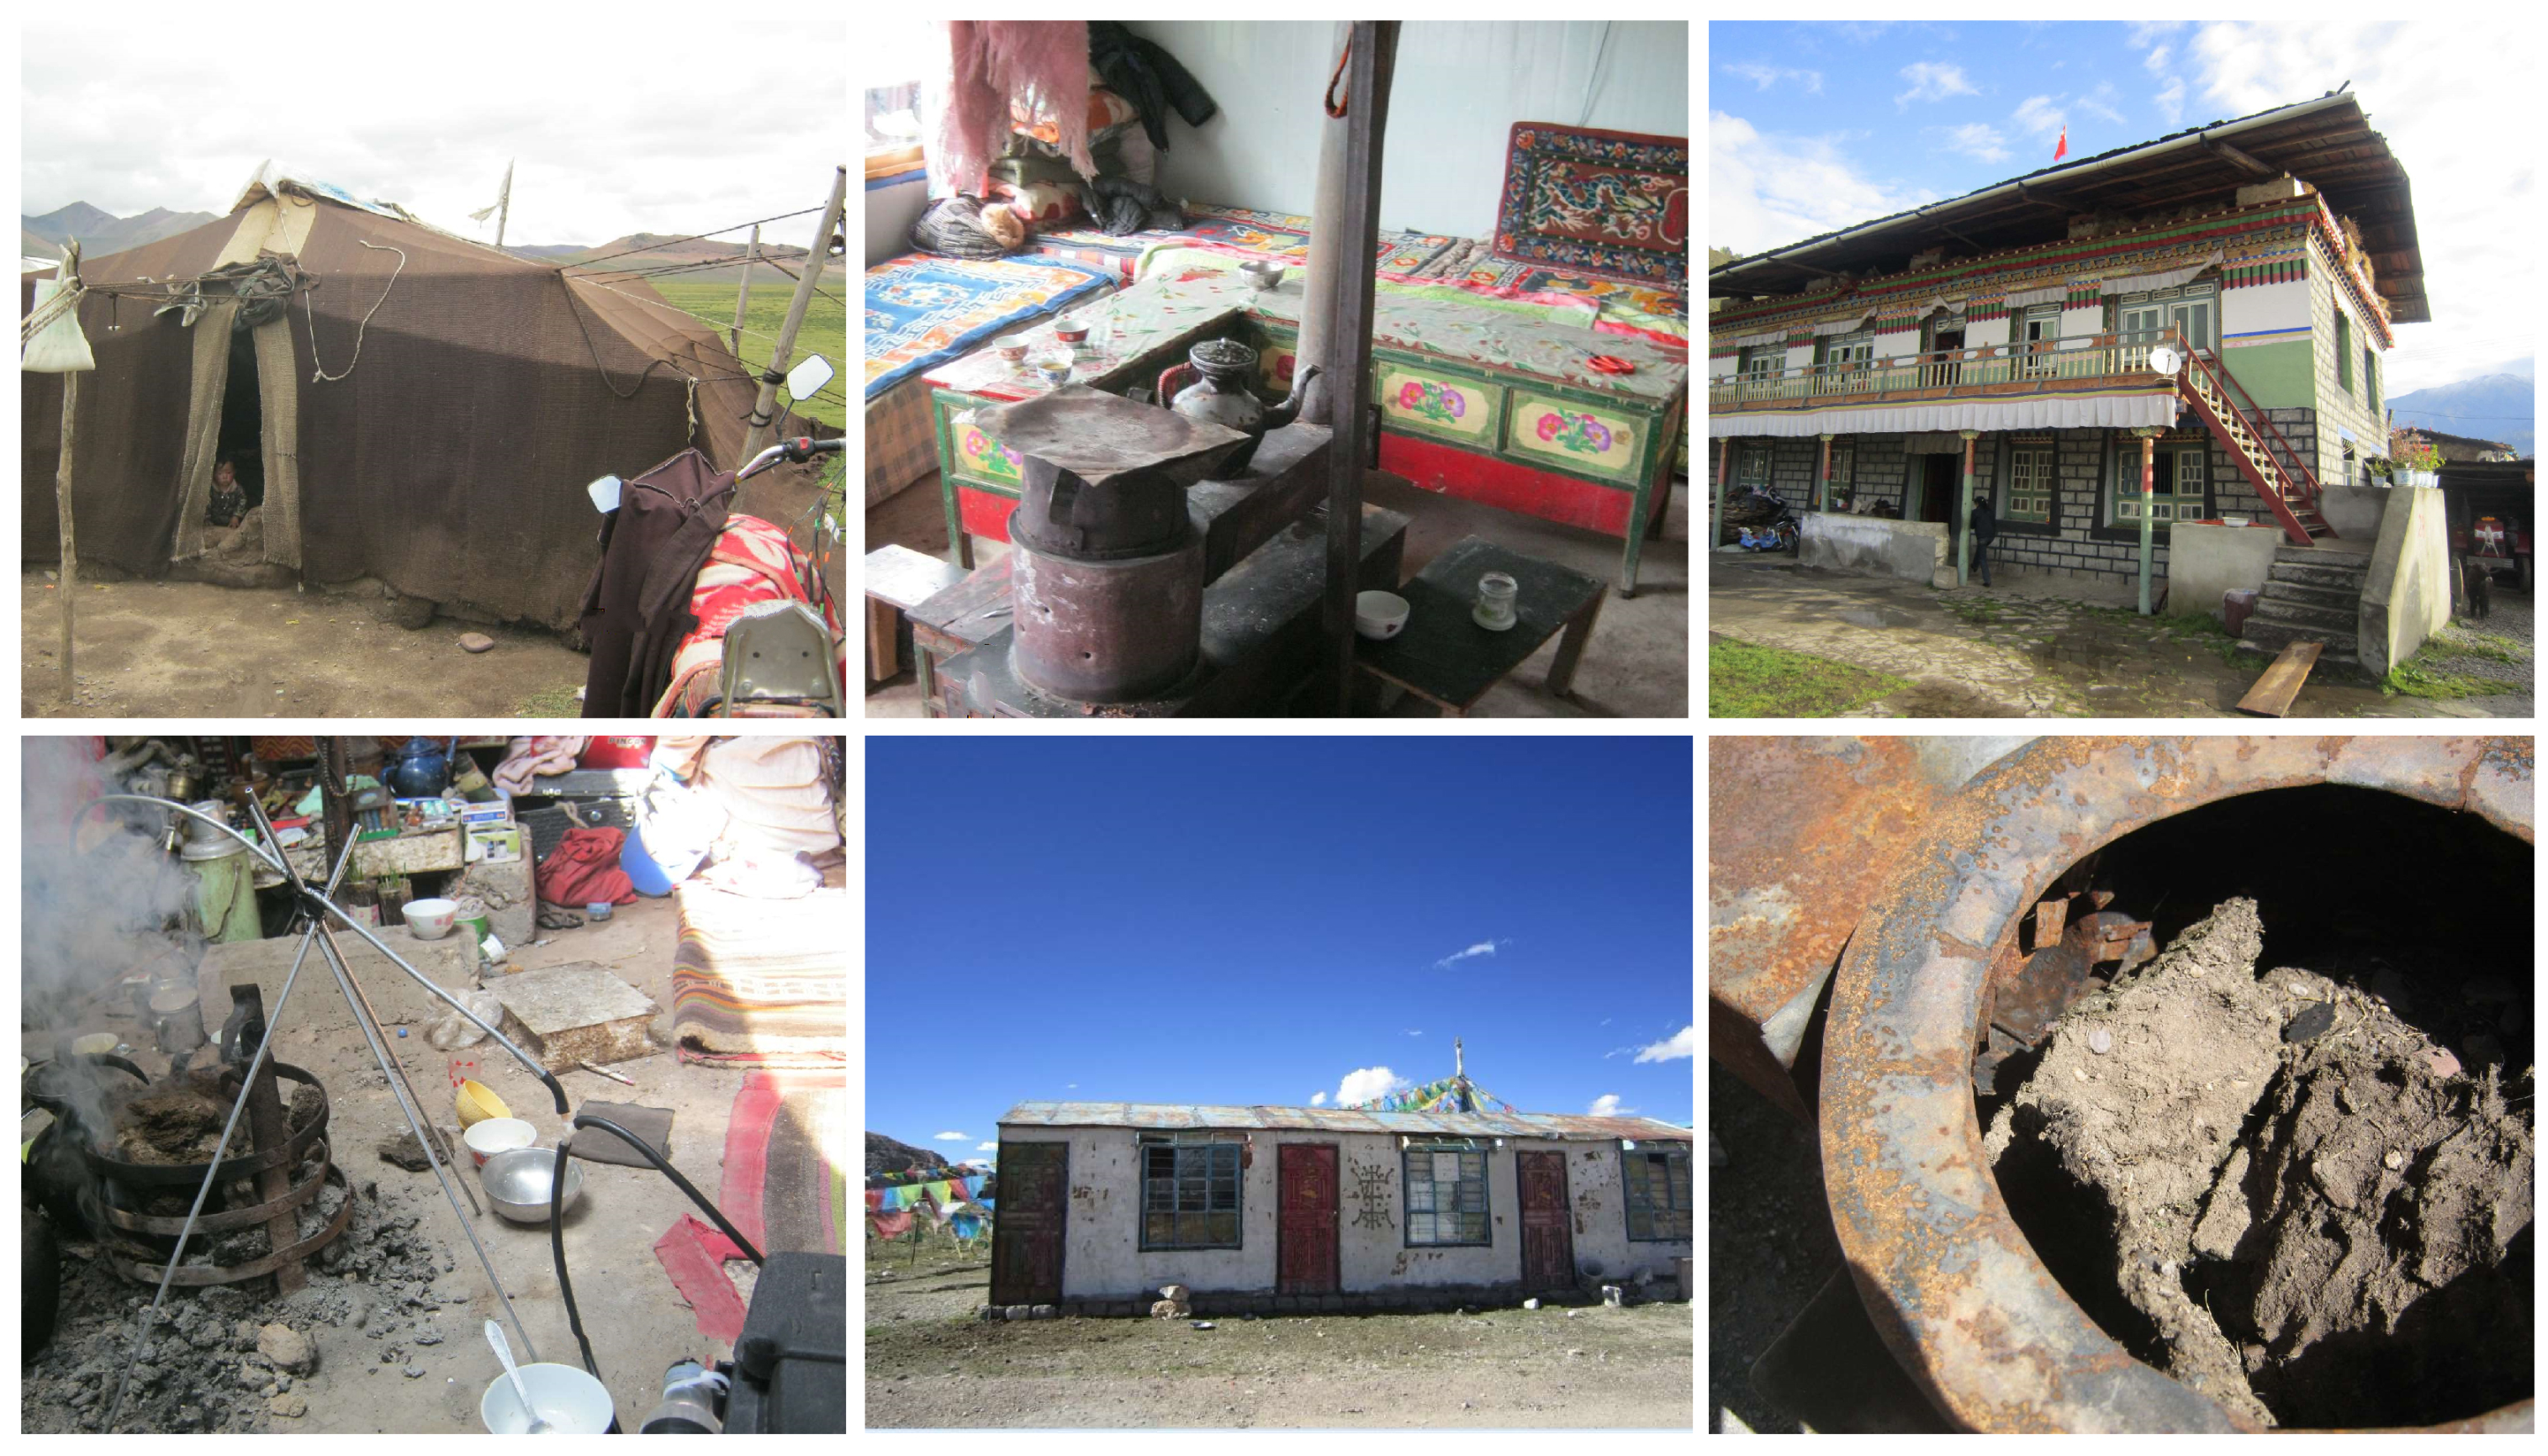
2.1.1. Tibet, China
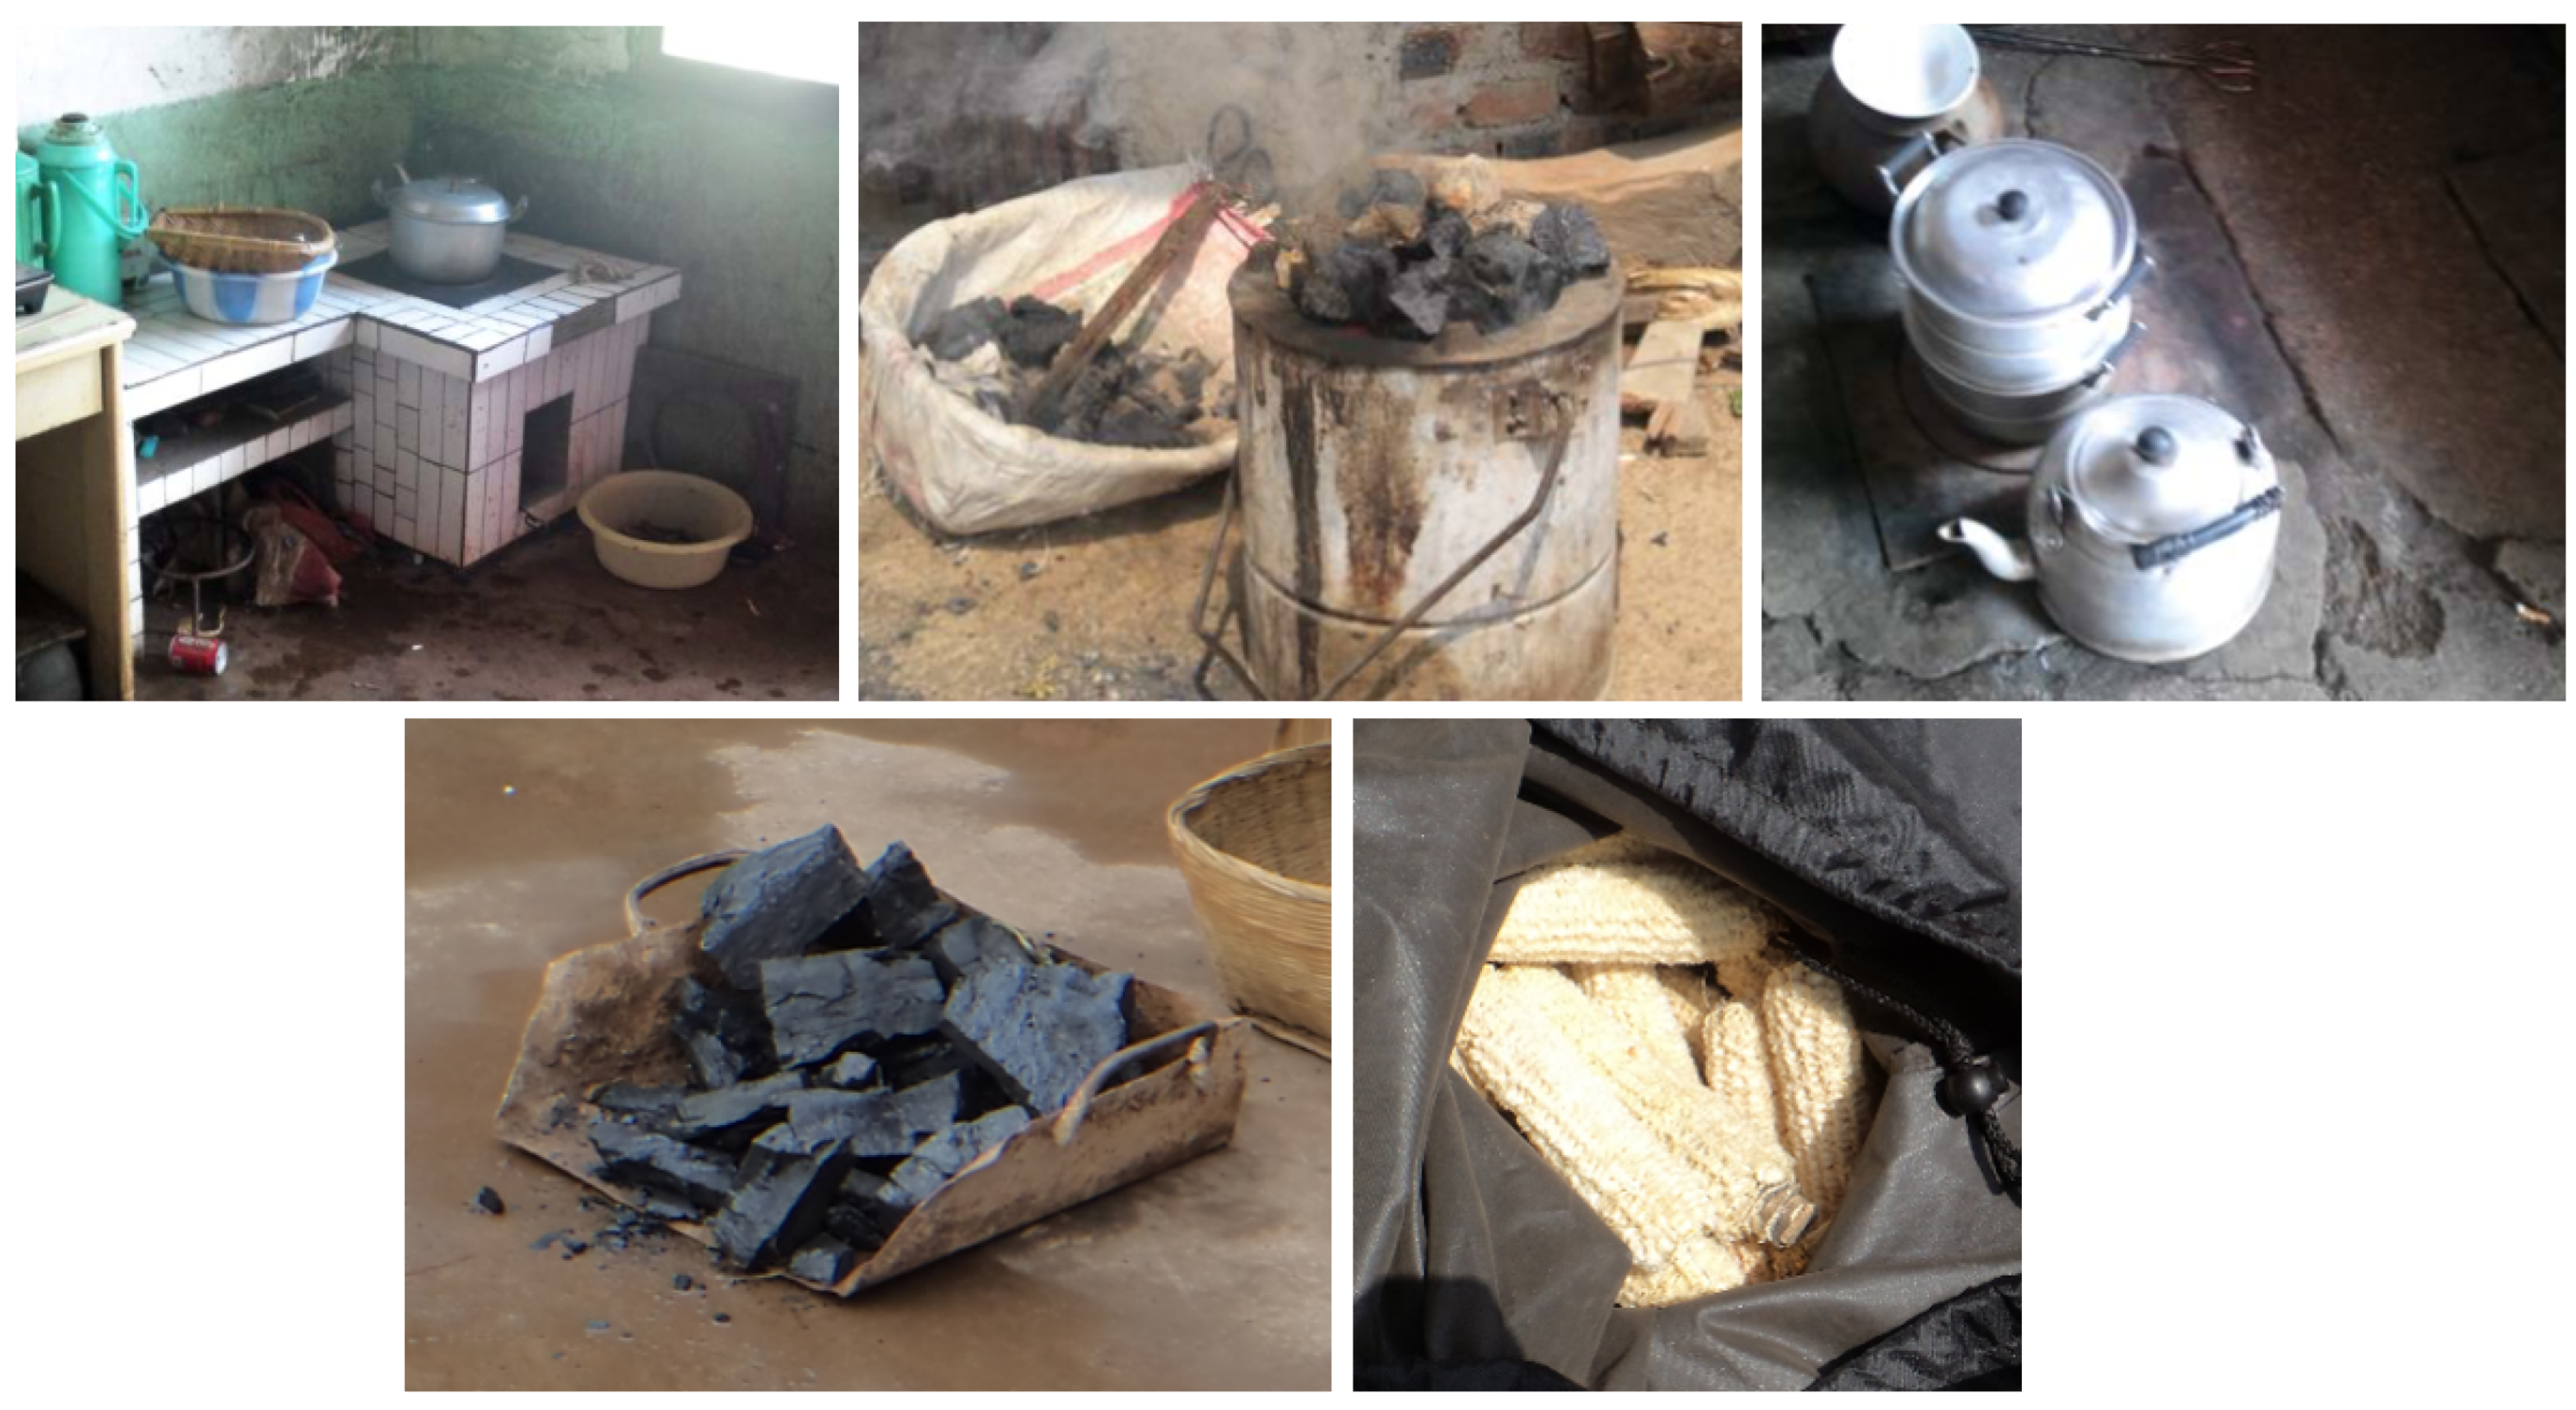
2.1.2. Yunnan, China
2.2. The Carbon Balance Method
2.3. Post-Measurement Analysis
2.3.1. Gravimetric Analysis
2.3.2. Gas Chromatography Analysis
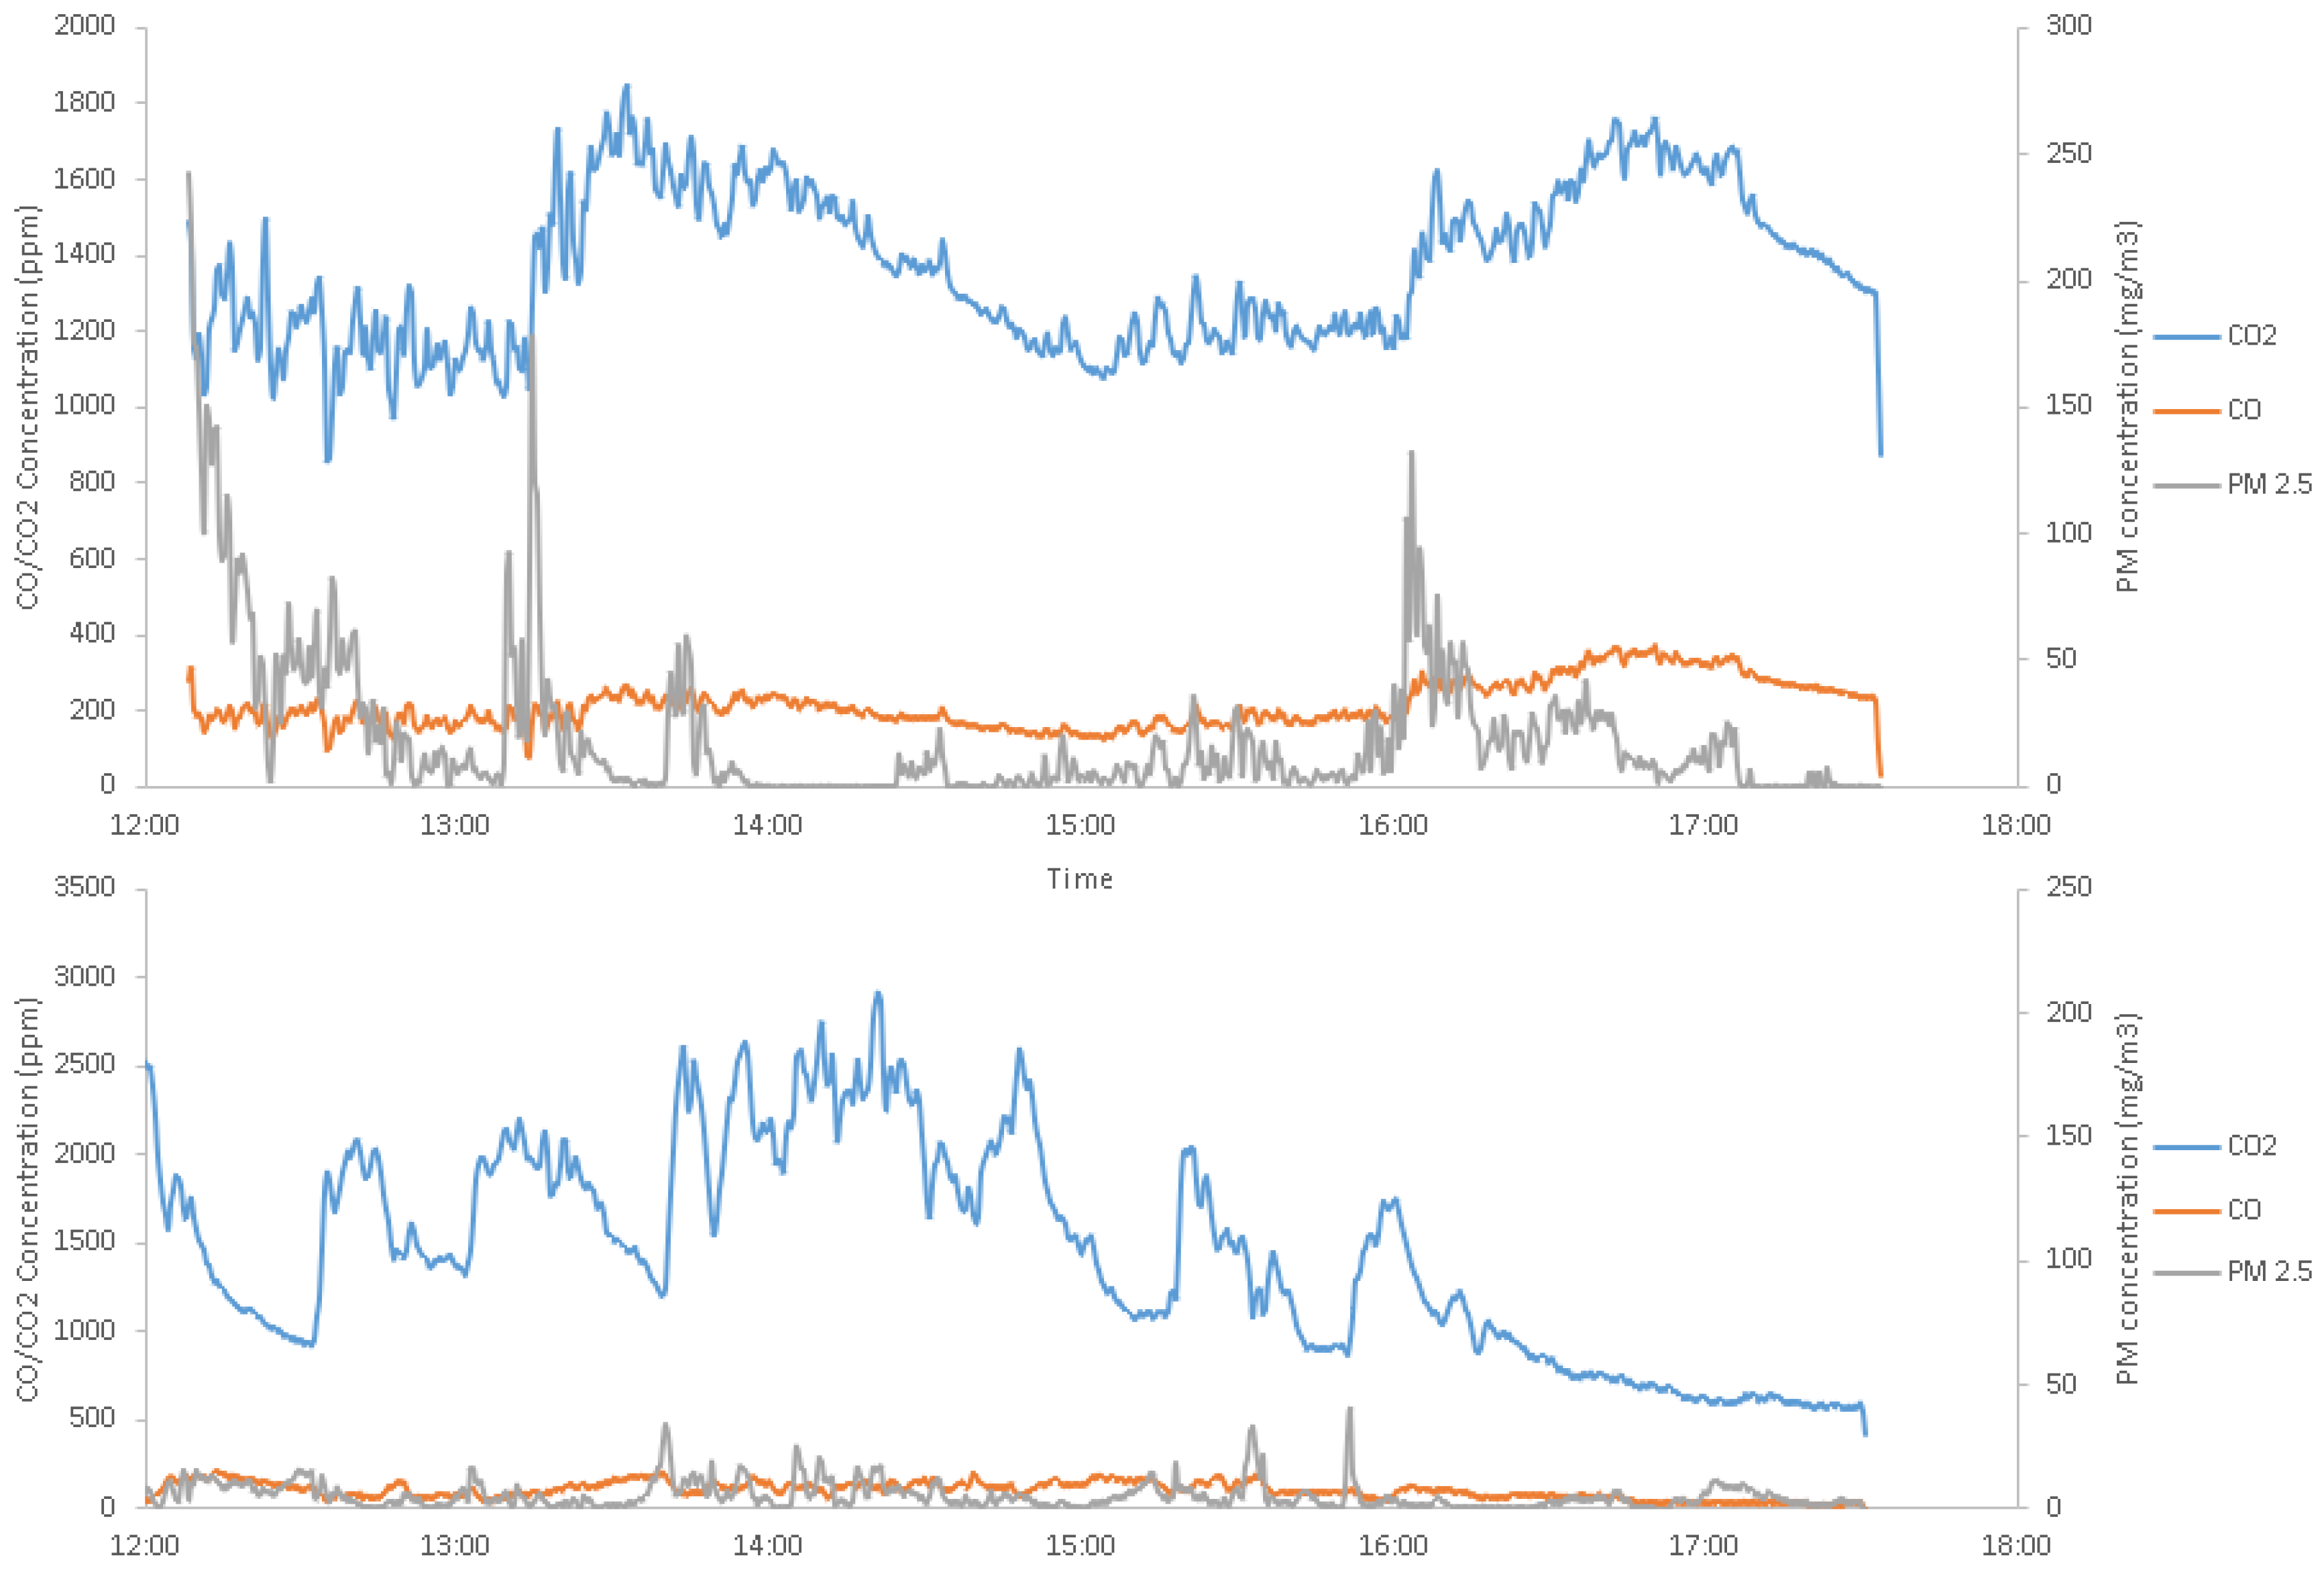
3. Results
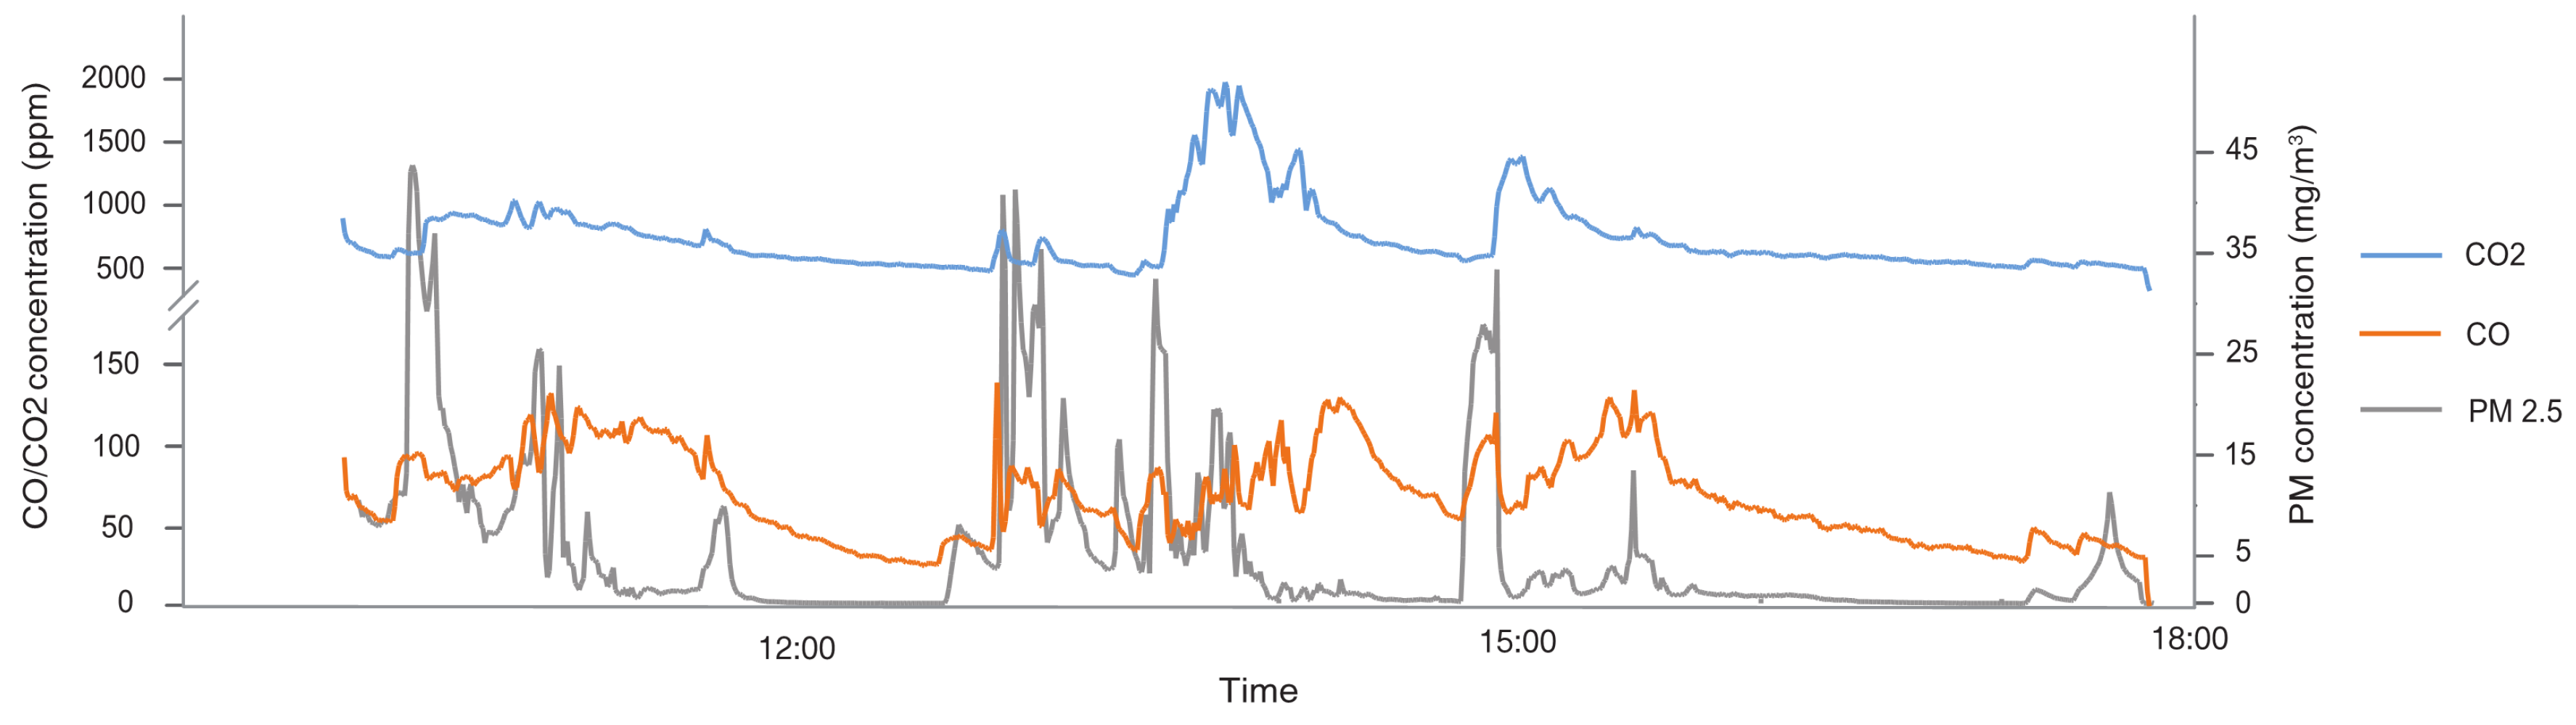
3.1. Tibet
3.2. Yunnan
4. Discussion
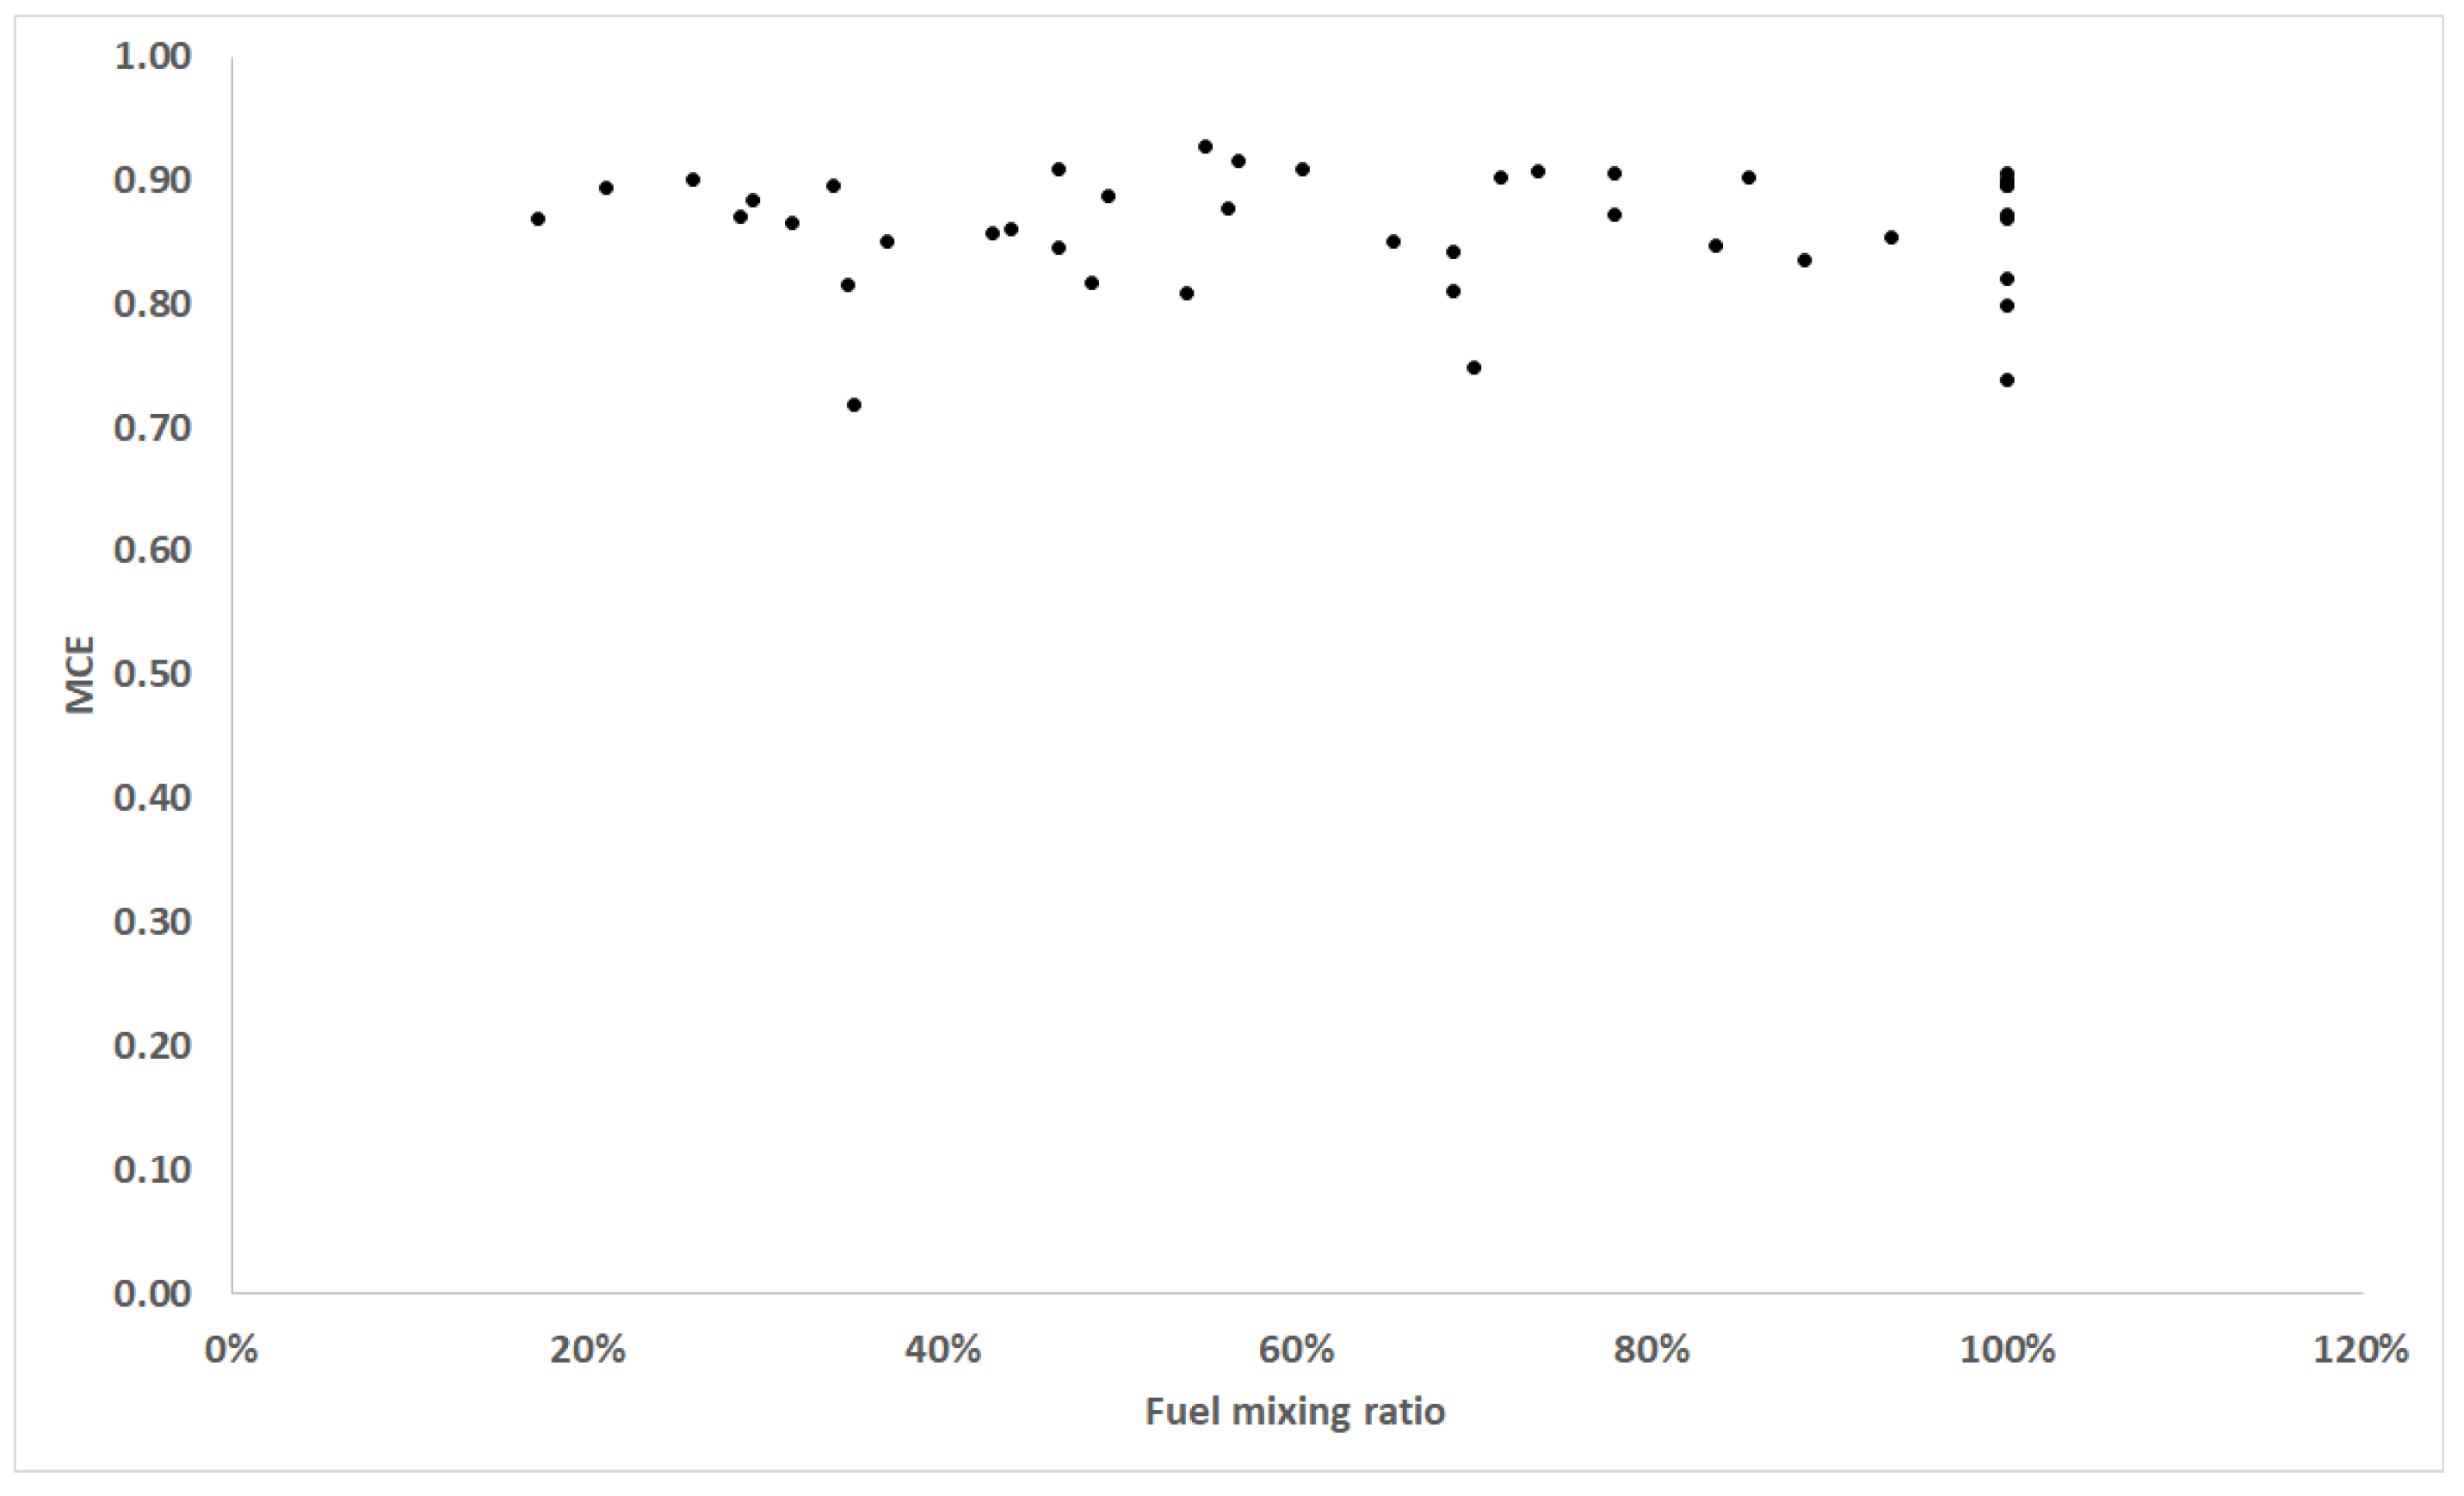
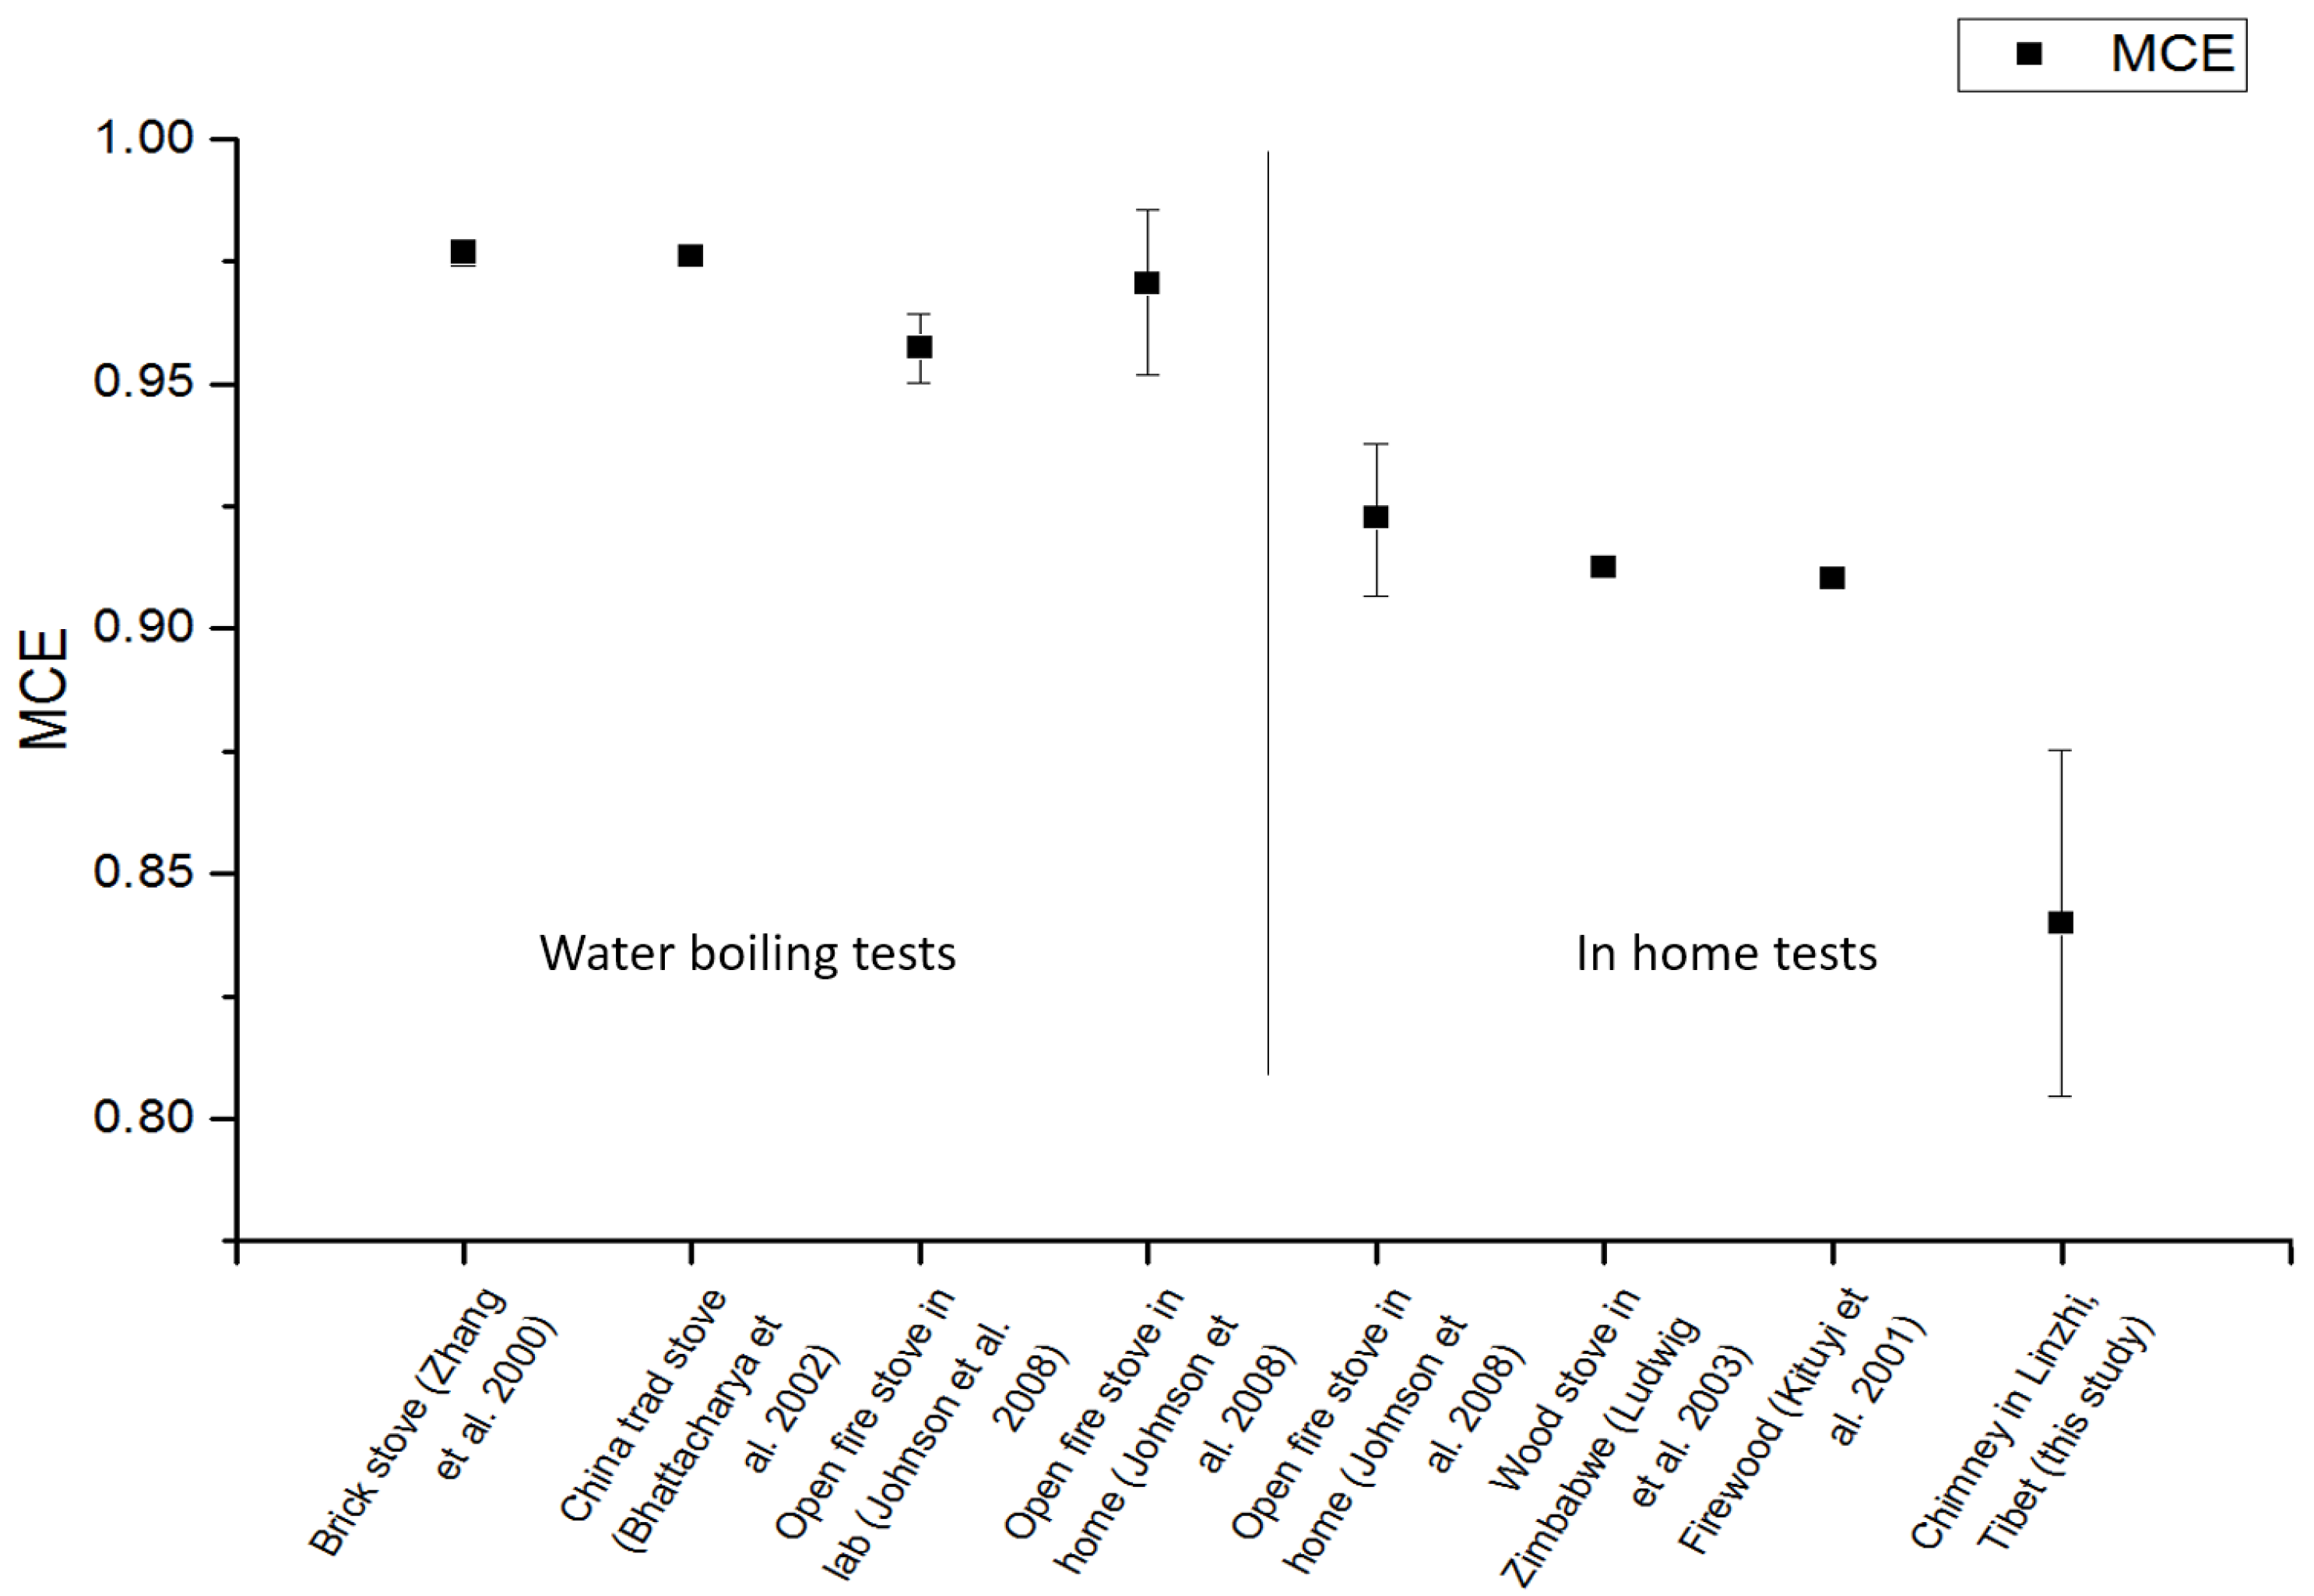
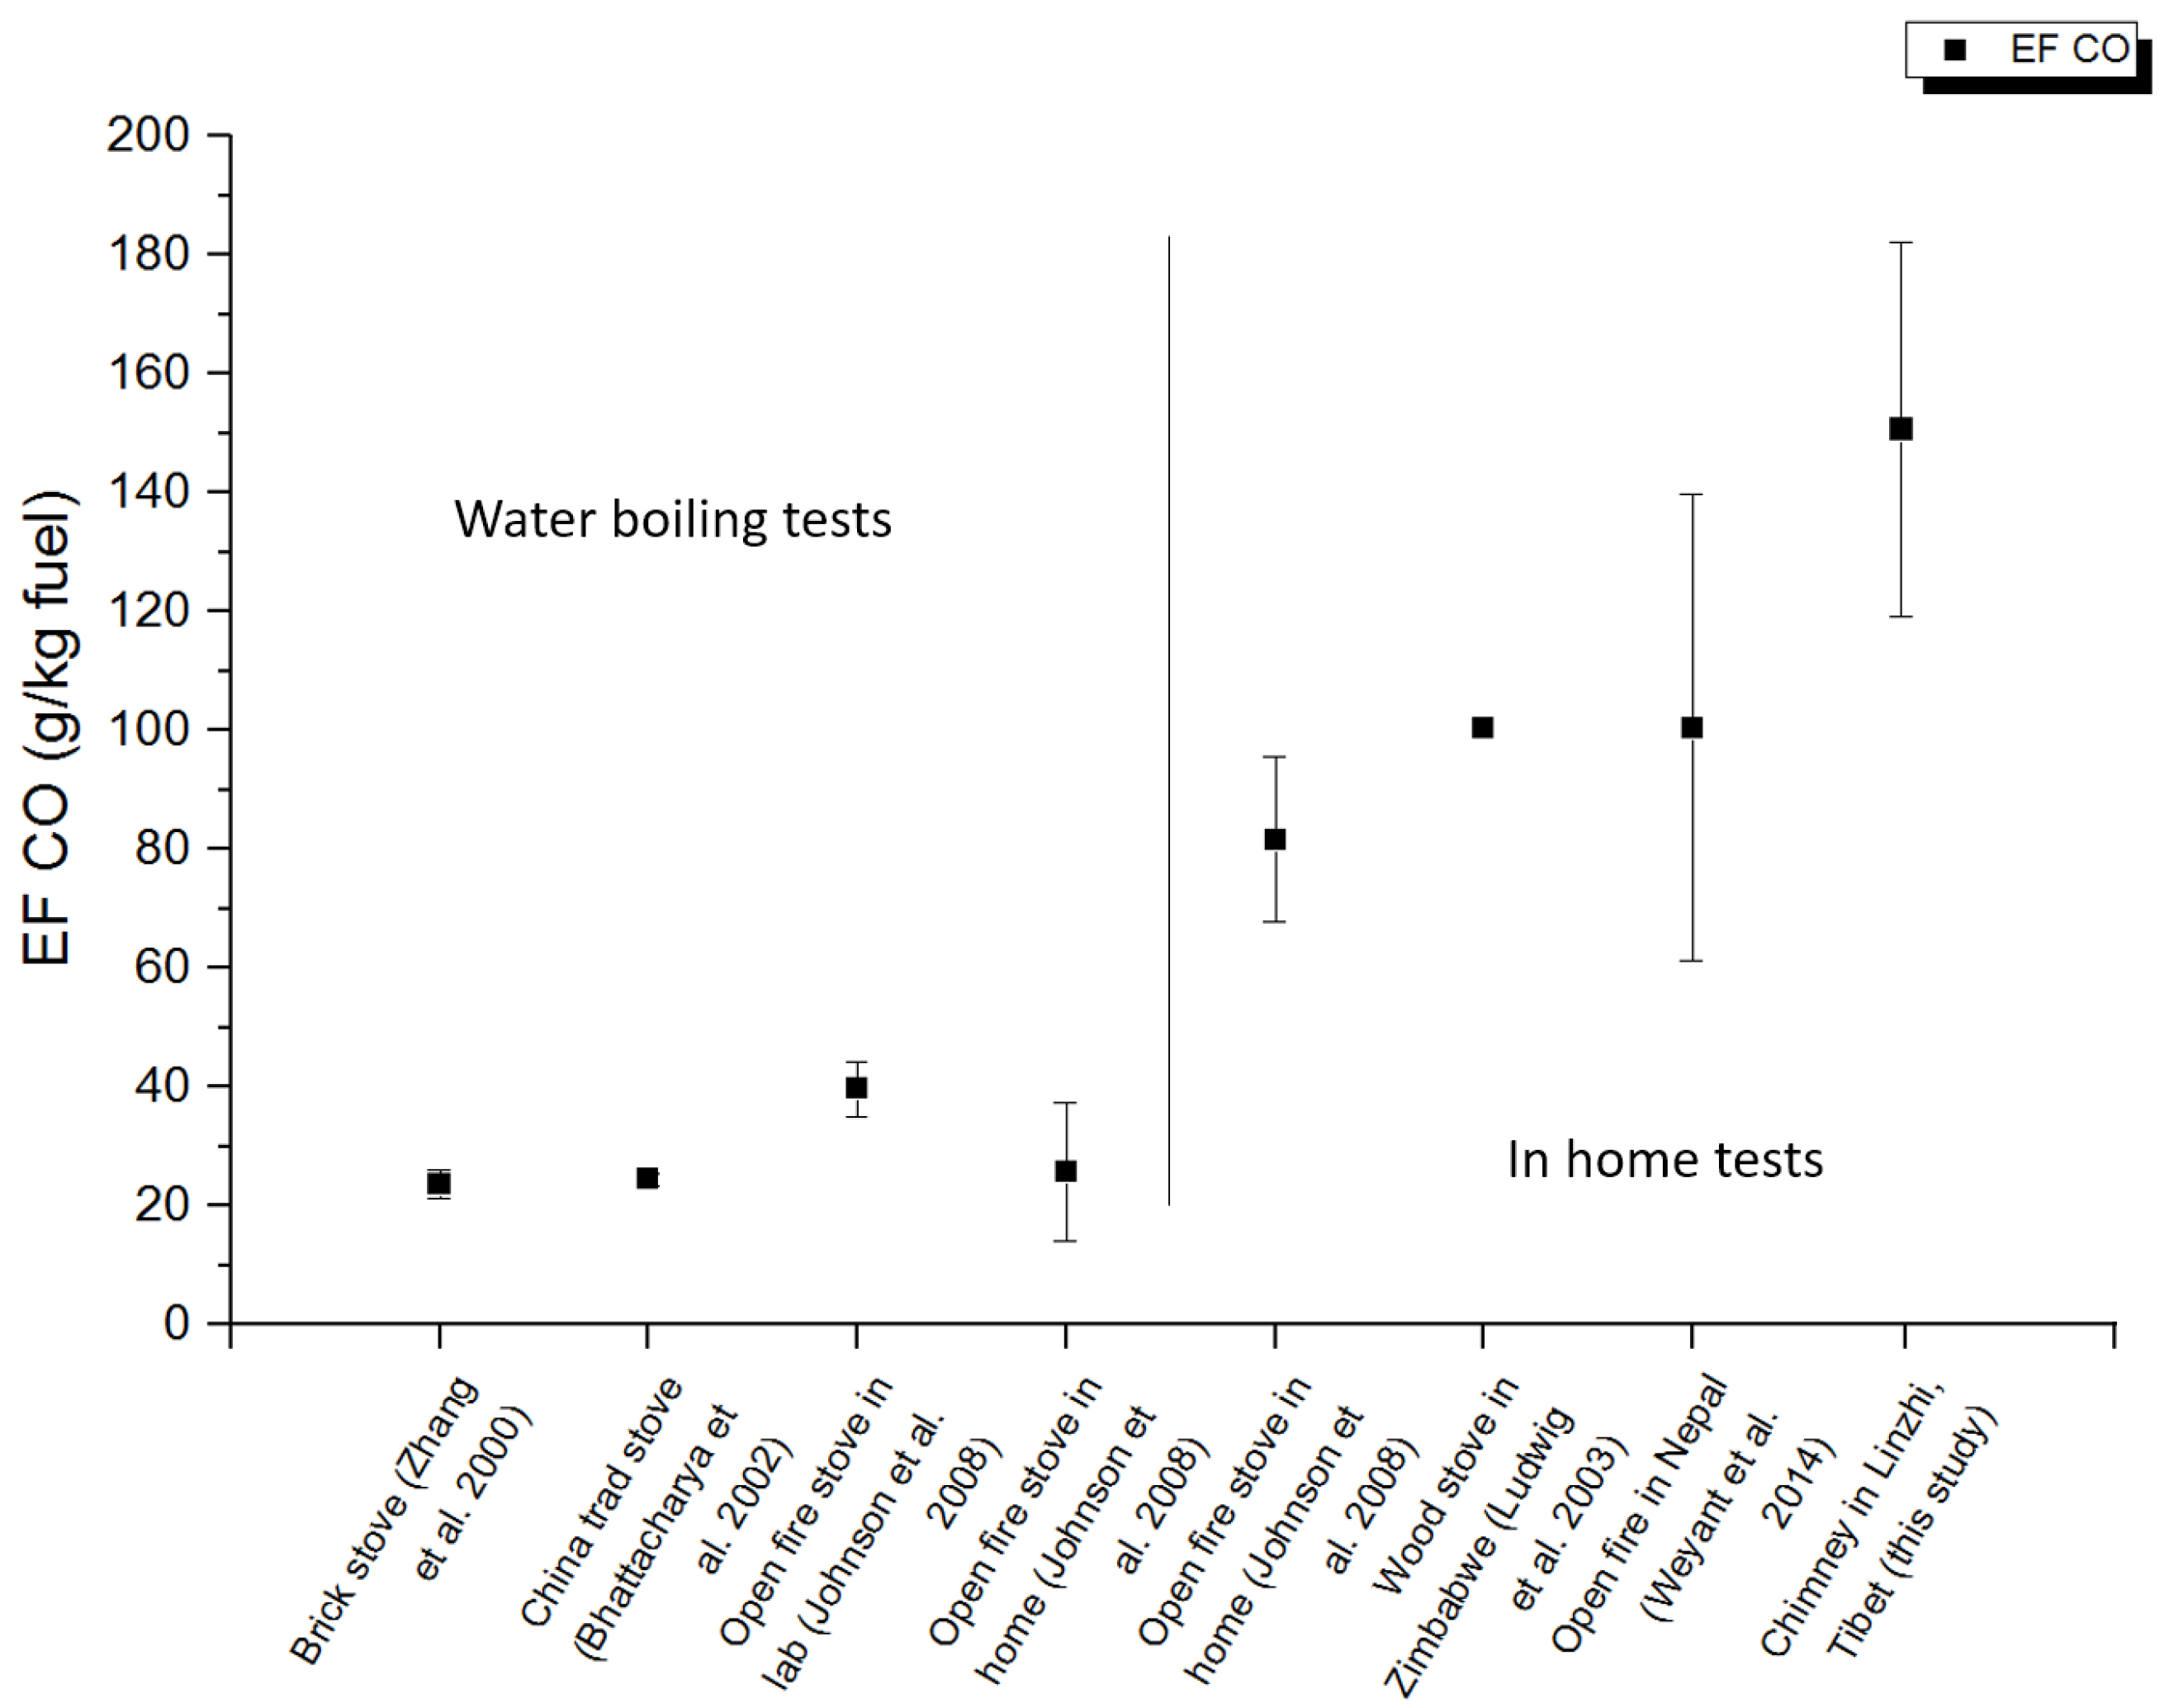
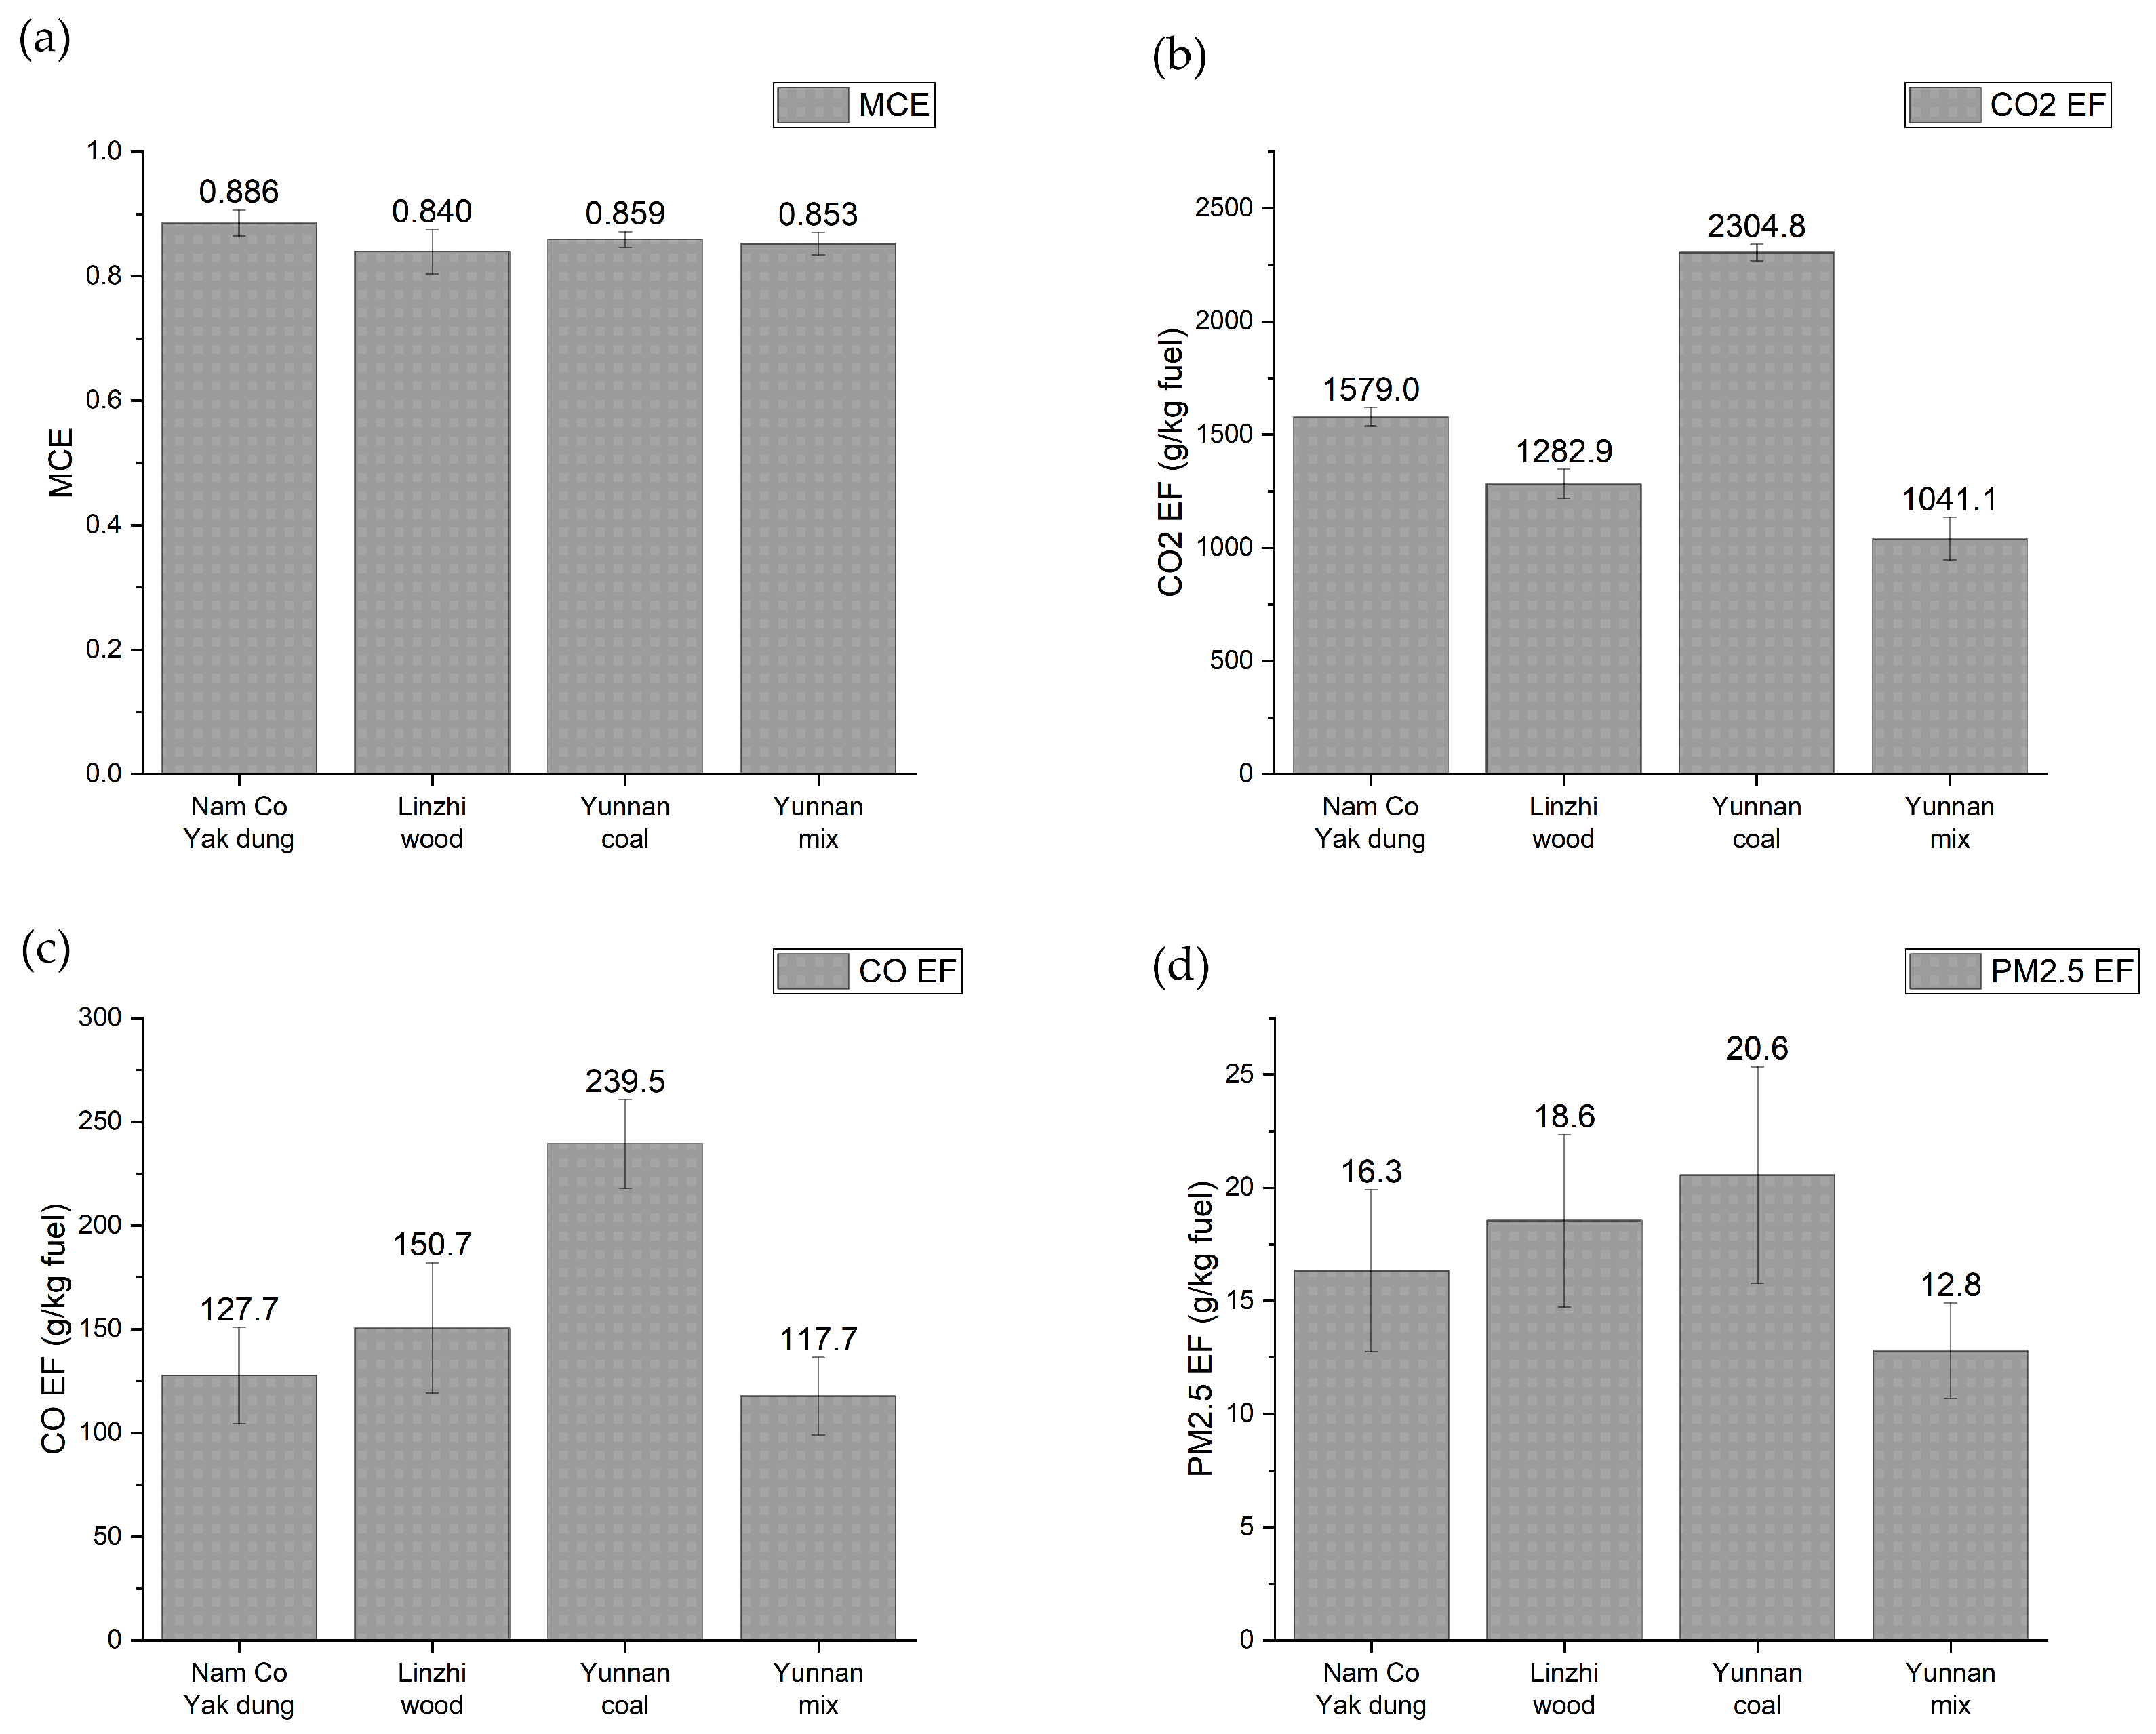
4.1. Efficiency and Emissions
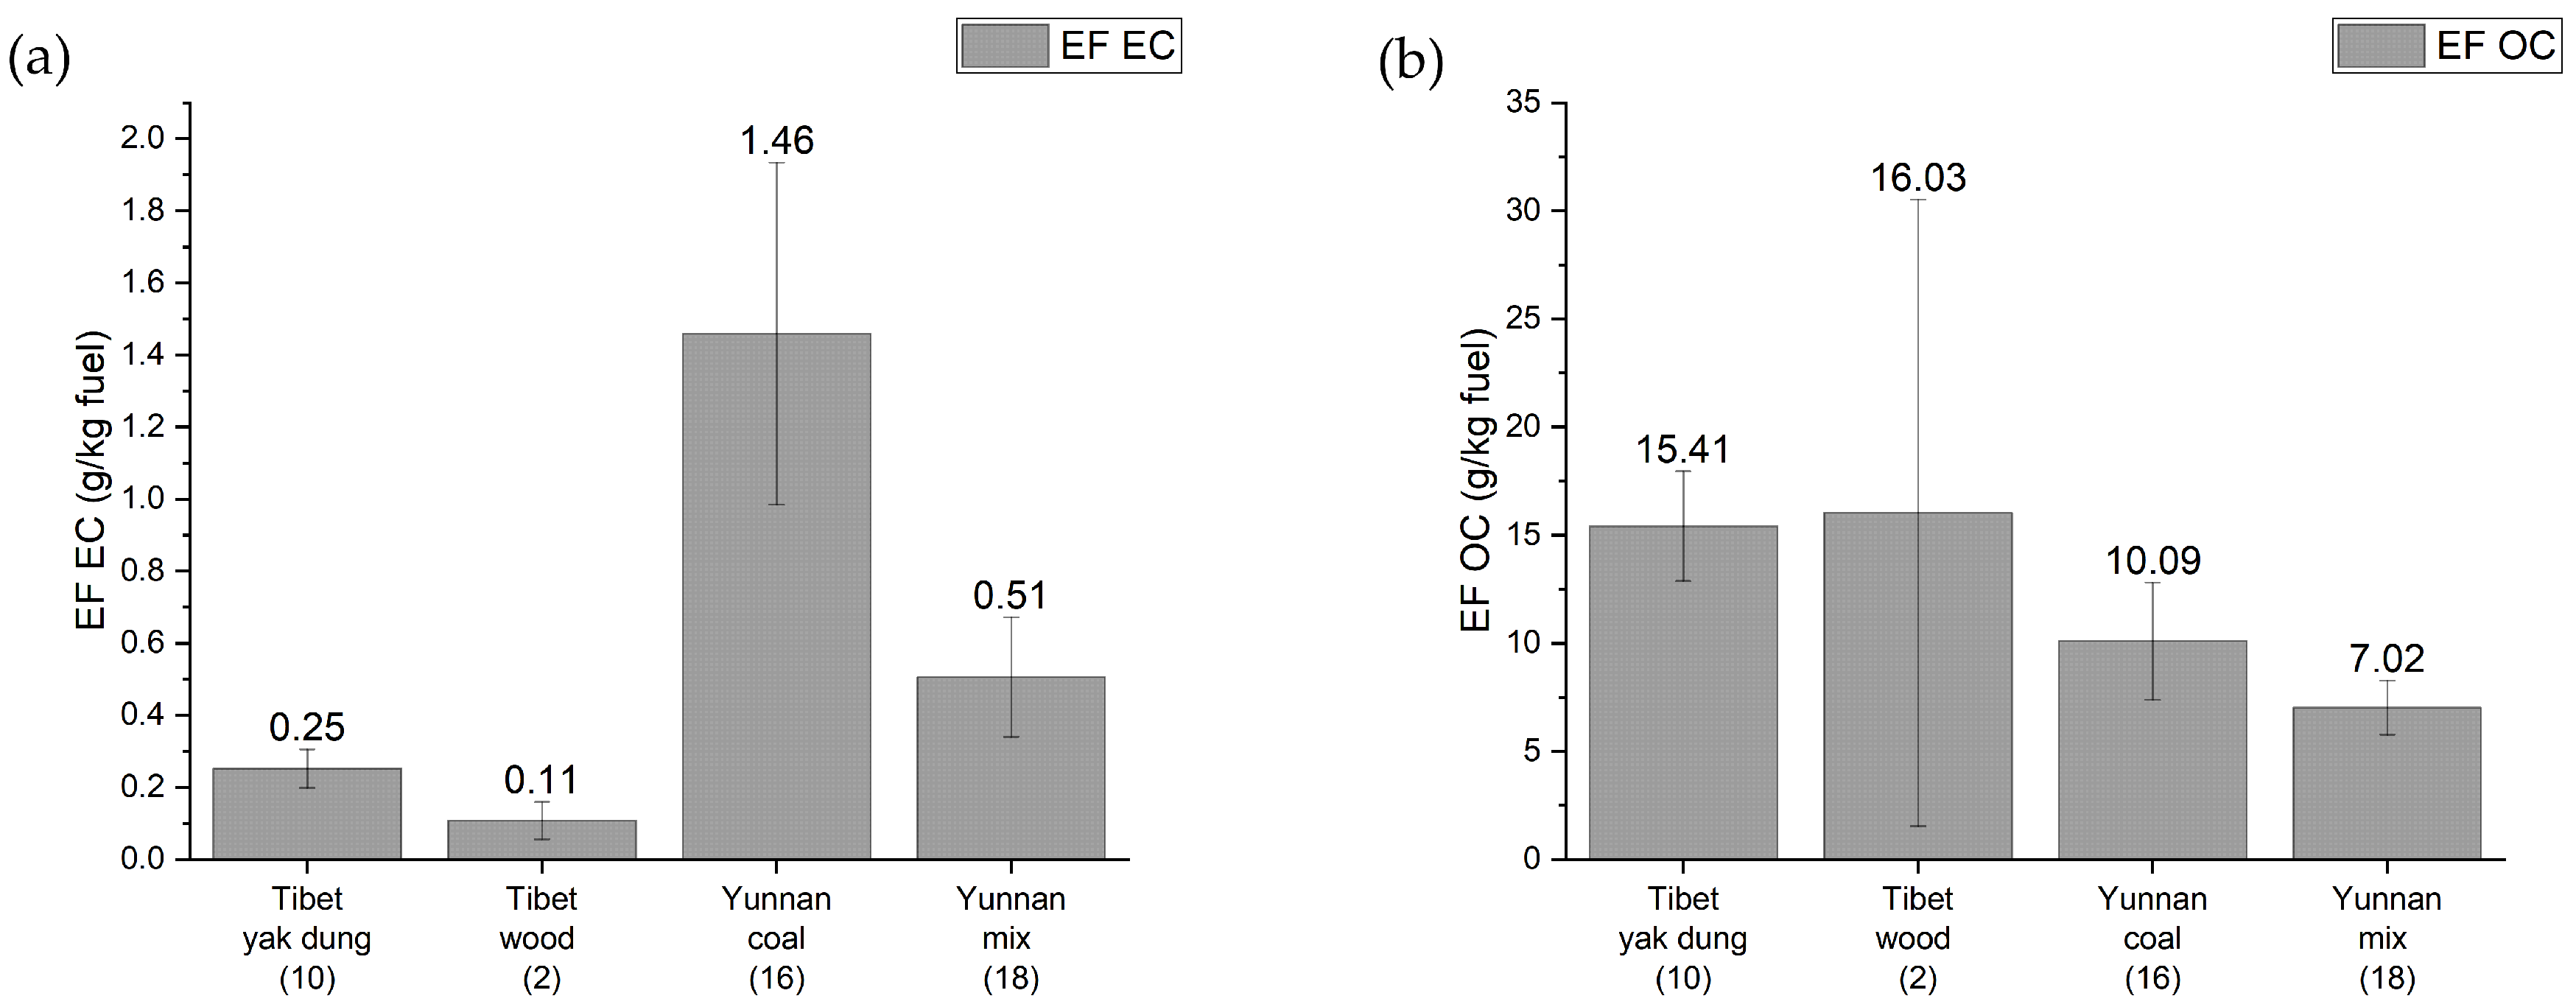
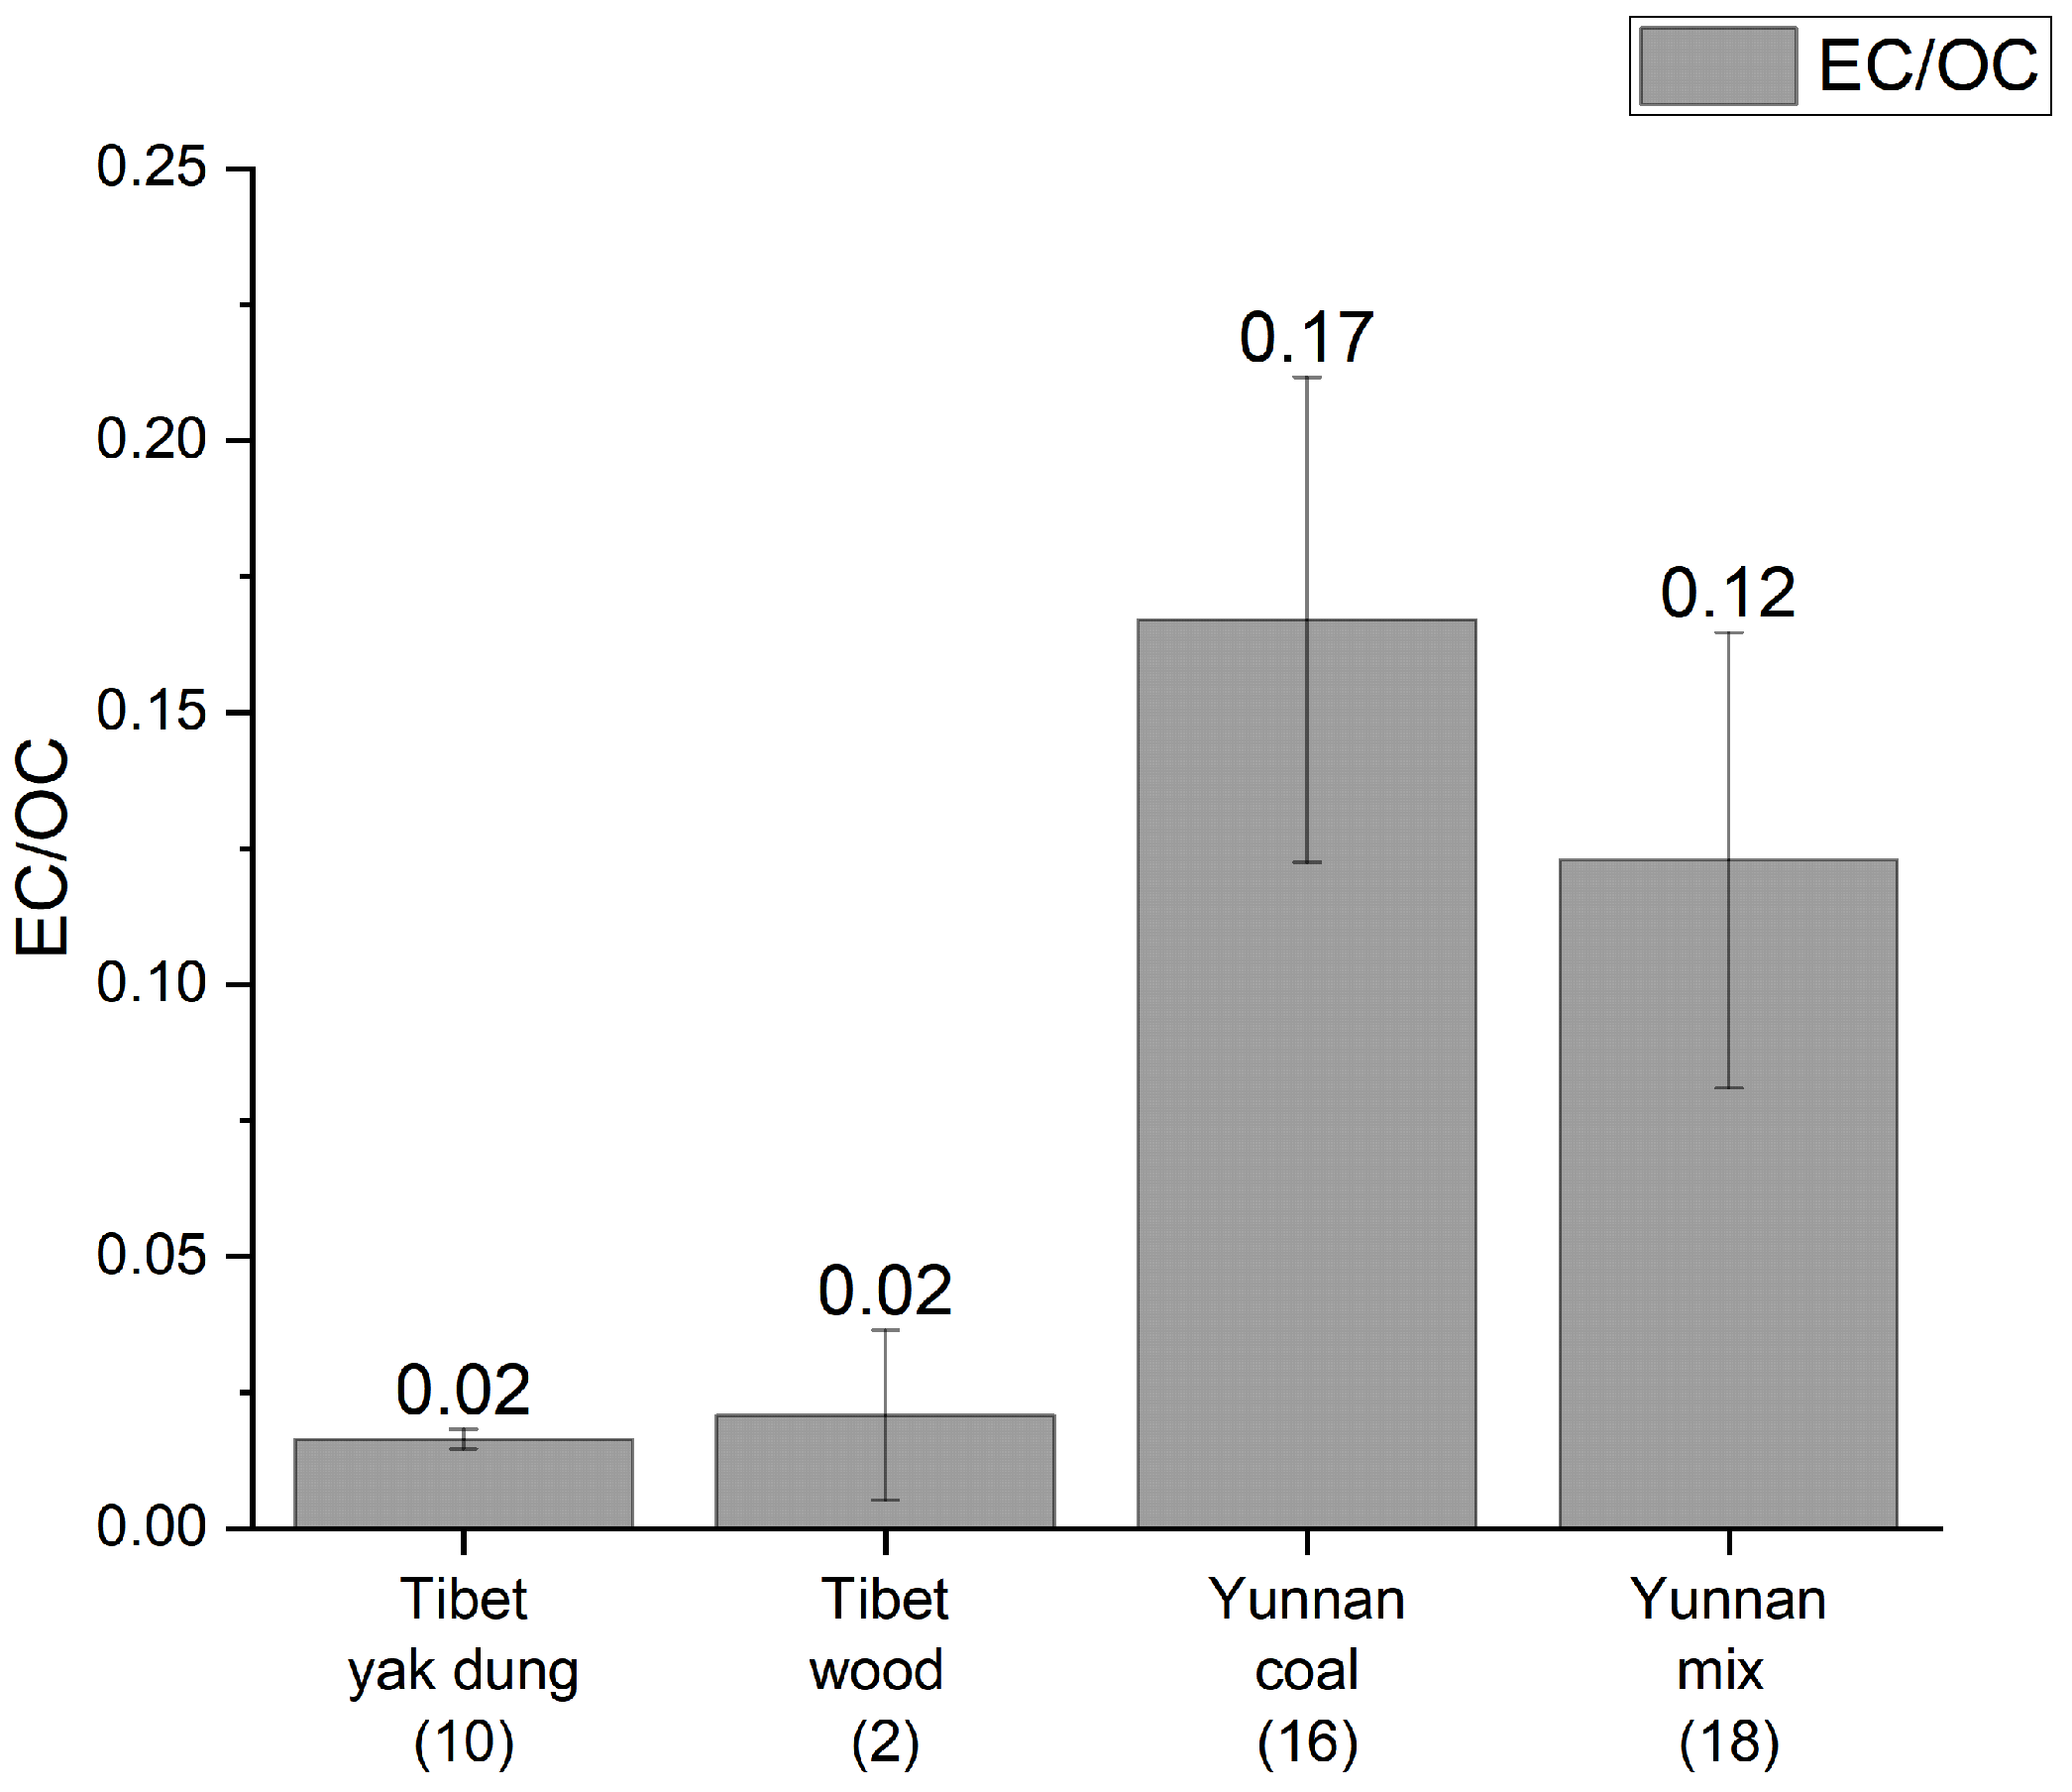
4.2. Carbon Particulate Emission
5. Conclusions
Author Contributions
Funding
Acknowledgments
Conflicts of Interest
References
- Bruce, N.; Rehfuess, E.; Mehta, S.; Hutton, G.; Smith, K. Indoor air pollution. In Disease Control Priorities in Developing Countries, 2nd ed.; Jamison, D.T., Breman, J.G., Measham, A.R., Alleyne, G., Claeson, M., Evans, D.B., Jha, P., Mills, A., Musgrove, P., Eds.; World Bank: Washington, DC, USA, 2006. [Google Scholar]
- Jetter, J.J.; Kariher, P. Solid-fuel household cooking stoves: Characterization of performance and emissions. Biomass Bioenergy 2009, 33, 294–305. [Google Scholar] [CrossRef]
- Bond, T.C.; Bhardwaj, E.; Dong, R.; Jogani, R.; Jung, S.; Roden, C.; Streets, D.G.; Trautmann, N.M. Historical emissions of black and organic carbon aerosol from energy-related combustion, 1850–2000. Glob. Biogeochem. Cycles 2007, 21, GB2018. [Google Scholar] [CrossRef]
- Turns, S.R. An Introduction to Combustion, Concepts and Applications; McGraw Hill: New York, NY, USA, 2012. [Google Scholar]
- DOE—Fossil Energy: A Brief History of Coal Use in the United States; Department of Energy: Washington, DC, USA, 2019.
- Smith, K.R.; Apte, M.G.; Yuqing, M.; Wongsekiarttirat, W.; Kulkarni, A. Air pollution and the energy ladder in asian cities. Energy 1994, 19, 587–600. [Google Scholar] [CrossRef]
- Ahrenfeldt, J.; Thomsen, T.P.; Henriksen, U.; Clausen, L.R. Biomass gasification cogeneration—A review of state of the art technology and near future perspectives. Appl. Therm. Eng. 2013, 50, 1407–1417. [Google Scholar] [CrossRef]
- Subramanian, R.; Winijkul, E.; Bond, T.C.; Thiansathit, W.; Oanh, N.T.K.; Paw-Armart, I.; Duleep, K. Climate-relevant properties of diesel particulate emissions: results from a piggyback study in Bangkok, Thailand. Environ. Sci. Technol. 2009, 43, 4213–4218. [Google Scholar] [CrossRef] [PubMed]
- Maricq, M.M.; Podsiadlik, D.H.; Chase, R.E. Examination of the size-resolved and transient nature of motor vehicle particle emissions. Environ. Sci. Technol. 1999, 33, 1618–1626. [Google Scholar] [CrossRef]
- Yan, F.; Winijkul, E.; Jung, S.; Bond, T.C.; Streets, D.G. Global emission projections of particulate matter (PM): I. Exhaust emissions from on-road vehicles. Atmos. Environ. 2011, 45, 4830–4844. [Google Scholar] [CrossRef]
- Bond, T.C.; Doherty, S.J.; Fahey, D.W.; Forster, P.M.; Berntsen, T.; DeAngelo, B.J.; Flanner, M.G.; Ghan, S.; Kärcher, B.; Koch, D.; et al. Bounding the role of black carbon in the climate system: A scientific assessment. J. Geophys. Res. Atmos. 2013, 118, 5380–5552. [Google Scholar] [CrossRef]
- Johnson, M.; Edwards, R.; Alatorre Frenk, C.; Masera, O. In-field greenhouse gas emissions from cookstoves in rural Mexican households. Atmos. Environ. 2008, 42, 1206–1222. [Google Scholar] [CrossRef]
- Zhang, J.; Smith, K.R. Hydrocarbon emissions and health risks from cookstoves in developing countries. J. Expo. Anal. Environ. Epidemiol. 1995, 6, 147–161. [Google Scholar]
- Zhang, J.; Smith, K.R.; Uma, R.; Ma, Y.; Kishore, V.V.N.; Lata, K.; Khalil, M.A.K.; Rasmussen, R.A.; Thorneloe, S.T. Carbon monoxide from cookstoves in developing countries: 1. Emission factors. Chemosph. Glob. Chang. Sci. 1999, 1, 353–366. [Google Scholar] [CrossRef]
- Zhang, J.; Smith, K.R. Emissions of carbonyl compounds from various cookstoves in China. Environ. Sci. Technol. 1999, 33, 2311–2320. [Google Scholar] [CrossRef]
- Lamarque, J.F.; Bond, T.C.; Eyring, V.; Granier, C.; Heil, A.; Klimont, Z.; Lee, D.; Liousse, C.; Mieville, A.; Owen, B.; et al. Historical (1850–2000) gridded anthropogenic and biomass burning emissions of reactive gases and aerosols: Methodology and application. Atmos. Chem. Phys. 2010, 10, 7017–7039. [Google Scholar] [CrossRef]
- Bergamaschi, P.; Hein, R.; Heimann, M.; Crutzen, P.J. Inverse modeling of the global CO cycle: 1. Inversion of CO mixing ratios. J. Geophys. Res. Atmos. 2000, 105, 1909–1927. [Google Scholar] [CrossRef]
- Kasibhatla, P.; Arellano, A.; Logan, J.A.; Palmer, P.I.; Novelli, P. Top-down estimate of a large source of atmospheric carbon monoxide associated with fuel combustion in Asia. Geophys. Res. Lett. 2002, 29, 6. [Google Scholar] [CrossRef]
- Gros, V.; Williams, J.; Lawrence, M.; Von Kuhlmann, R.; Van Aardenne, J.; Atlas, E.; Chuck, A.; Edwards, D.; Stroud, V.; Krol, M. Tracing the origin and ages of interlaced atmospheric pollution events over the tropical Atlantic Ocean with in situ measurements, satellites, trajectories, emission inventories, and global models. J. Geophys. Res. Atmos. 2004, 109. [Google Scholar] [CrossRef]
- Streets, D.G.; Zhang, Q.; Wang, L.; He, K.; Hao, J.; Wu, Y.; Tang, Y.; Carmichael, G.R. Revisiting China’s CO emissions after the transport and chemical evolution over the Pacific (TRACE-P) mission: Synthesis of inventories, atmospheric modeling, and observations. J. Geophys. Res. Atmos. 2006, 111. [Google Scholar] [CrossRef]
- Venkataraman, C.; Habib, G.; Kadamba, D.; Shrivastava, M.; Leon, J.F.; Crouzille, B.; Boucher, O.; Streets, D. Emissions from open biomass burning in India: Integrating the inventory approach with high-resolution Moderate Resolution Imaging Spectroradiometer (MODIS) active-fire and land cover data. Glob. Biogeochem. Cycles 2006, 20. [Google Scholar] [CrossRef]
- Koch, D.; Bond, T.C.; Streets, D.; Unger, N.; Van der Werf, G.R. Global impacts of aerosols from particular source regions and sectors. J. Geophys. Res. Atmos. 2007, 112. [Google Scholar] [CrossRef]
- Roden, C.A.; Bond, T.C.; Conway, S.; Osorto Pinel, A.B.; MacCarty, N.; Still, D. Laboratory and field investigations of particulate and carbon monoxide emissions from traditional and improved cookstoves. Atmos. Environ. 2009, 43, 1170–1181. [Google Scholar] [CrossRef]
- Zhang, J.; Smith, K.R.; Ma, Y.; Ye, S.; Jiang, F.; Qi, W.; Liu, P.; Khalil, M.A.K.; Rasmussen, R.A.; Thorneloe, S.A. Greenhouse gases and other airborne pollutants from household stoves in China: A database for emission factors. Atmos. Environ. 2000, 34, 4537–4549. [Google Scholar] [CrossRef]
- Smith, K.R.; Khalil, M.a.K.; Rasmussen, R.A.; Thorneloe, S.A.; Manegdeg, F.; Apte, M. Greenhouse gases from biomass and fossil fuel stoves in developing countries: A Manila pilot study. Chemosphere 1993, 26, 479–505. [Google Scholar] [CrossRef]
- Bhattacharya, S.C.; Albina, D.O.; Abdul Salam, P. Emission factors of wood and charcoal-fired cookstoves. Biomass Bioenergy 2002, 23, 453–469. [Google Scholar] [CrossRef]
- Taylor, R.P. The Uses of Laboratory Testing of Biomass Cookstoves and the Shortcomings of the Dominant U.S. Protocol. Ph.D. Thesis, Iowa State University, Ames, IA, USA, 2009. [Google Scholar]
- Bond, T.C.; Streets, D.G.; Yarber, K.F.; Nelson, S.M.; Woo, J.H.; Klimont, Z. A technology-based global inventory of black and organic carbon emissions from combustion. J. Geophys. Res. Atmos. 2004, 109, D14203. [Google Scholar] [CrossRef]
- Roden, C.A.; Bond, T.C.; Conway, S.; Pinel, A.B.O. Emission factors and real-time optical properties of particles emitted from traditional wood burning cookstoves. Environ. Sci. Technol. 2006, 40, 6750–6757. [Google Scholar] [CrossRef] [PubMed]
- Bond, T.C.; Anderson, T.L.; Campbell, D. Calibration and intercomparison of filter-based measurements of visible light absorption by aerosols. Aerosol Sci. Technol. 1999, 30, 582–600. [Google Scholar] [CrossRef]
- Crutzen, P.J.; Heidt, L.E.; Krasnec, J.P.; Pollock, W.H.; Seiler, W. Biomass burning as a source of atmospheric gases CO, H2, N2O, NO, CH3Cl and COS. Nature 1979, 282, 253–256. [Google Scholar] [CrossRef]
- Ward, D.E.; Hao, W.M.; Susott, R.A.; Babbitt, R.E.; Shea, R.W.; Kauffman, J.B.; Justice, C.O. Effect of fuel composition on combustion efficiency and emission factors for African savanna ecosystems. J. Geophys. Res. Atmos. 1996, 101, 23569–23576. [Google Scholar] [CrossRef]
- Lipsky, E.M.; Robinson, A.L. Design and evaluation of a portable dilution sampling system for measuring fine particle emissions. Aerosol Sci. Technol. 2005, 39, 542–553. [Google Scholar] [CrossRef]
- NIOSH Manual of Analytical Methods (NMAM), 4th ed.; Third Supplement; NIOSH: Washington, DC, USA, 2018. [CrossRef]
- Gaur, S.; Reed, T.B. Thermal Data for Natural and Synthetic Fuels; CRC Press: Boca Raton, FL, USA, 1998. [Google Scholar]


| Location | Residence Type | Stove Type | Fuel Type | Measurement | # of Samples |
|---|---|---|---|---|---|
| Nam Co | Tent | Open fire | Yak dung | 1-Day | 4 |
| Tent | Chimney | Yak dung | 1-Day | 4 | |
| Prefab house | Chimney | Yak dung | 1-Day | 12 | |
| Stone house | Chimney | Yak dung | 1-Day | 6 | |
| SSI | Chimney | Yak dung | 1-Day | 2 | |
| Linzhi | Garret | Chimney | Wood | 3-Day | 4 |
| Garret | Chimney | Wood | 1-Day | 8 | |
| Total | 38 |
| Sample Amount | MCE (%) | EF CO2 (g/kg Fuel) | EF CO (g/kg Fuel) | EF PM2.5 (g/kg Fuel) | EF CH4 (g/kg Fuel) | |
|---|---|---|---|---|---|---|
| Dung, open fire stove in tent | 3 | 73.0 ± 7.5 | 1298.8 ± 148.3 | 303.1 ± 80.8 | 18.5 ± 10.2 | 32.4 ± 7 |
| Dung, chimney stove in tent | 2 | 90.2 ± 7.1 | 1590.4 ± 176.3 | 107.1 ± 76.4 | 26 ± 26 | 5.8 ± 1.6 |
| Dung, chimney stove in house | 15 | 91.4 ± 1.8 | 1632.4 ± 38.1 | 96 ± 20 | 14.7 ± 4.1 | 22 ± 4.6 |
| Wood, chimney stove in house | 15 | 84.0 ± 3.5 | 1282.9 ± 64.4 | 150.7 ± 31.5 | 18.6 ± 3.8 | 9.8 ± 1.3 |
| All dung | 22 | 88.6 ± 2.1 | 1579 ± 41.5 | 127.7 ± 23.2 | 16.3 ± 3.6 | 24.1 ± 3.8 |
| All household | 35 | 86.6 ± 2.0 | 1451.6 ± 44.9 | 137.8 ± 19.6 | 17.3 ± 2.7 | 16.7 ± 2.5 |
| All SSI | 2 | 89.1 ± 4.6 | 1587.5 ± 97.5 | 122.6 ± 51.5 | 16.1 ± 7.7 | 46.1 ± 5.7 |
| Overall | 37 | 86.7 ± 1.9 | 1459 ± 42.9 | 137 ± 18.6 | 17.2 ± 2.6 | 18.3 ± 2.6 |
| Location | Residence Type | Stove Type | Fuel Type | Measurement | # of Samples |
|---|---|---|---|---|---|
| Fuyuan | House | High stove | Coal | 1-Day | 13 |
| House | High stove | Coal | 3-Day | 2 | |
| House | Portable stove | Coal | 1-Day | 5 | |
| House | Portable stove | Coal | 3-Day | 1 | |
| House | Low stove | Coal | 1-Day | 1 | |
| Xuanwei | House | High stove | Coal | 1-Day | 7 |
| House | High stove | Coal | 3-Day | 1 | |
| House | Portable stove | Coal | 1-Day | 8 | |
| House | Portable stove | Coal | 3-Day | 1 | |
| House | Low stove | Coal | 1-Day | 1 | |
| Total | 40 |
| Sample Amount | MCE (%) | EF CO2 (g/kg Fuel) | EF CO (g/kg Fuel) | EF PM2.5 (g/kg Fuel) | EF CH4 (g/kg Fuel) | |
|---|---|---|---|---|---|---|
| High stove in Fuyuan | 15 | 82.7 ± 2.7 | 1528.366 ± 174.458 | 194.982 ± 30.674 | 16.585 ± 3.49 | 83.584 ± 17.85 |
| Portable stove in Fuyuan | 6 | 87.1 ± 3.1 | 1973.451 ± 217.36 | 199.102 ± 60.626 | 12.052 ± 2.311 | 106.308 ± 24.3 |
| Low stove in Fuyuan | 1 | 85.2 | 1379.019 | 152.8224 | 32.09369 | 89.74726 |
| High stove in Xuanwei | 9 | 85.8 ± 1.4 | 1573.745 ± 251.195 | 172.03 ± 34.978 | 21.757 ± 8.609 | 61.563 ± 11.245 |
| Portable stove in Xuanwei | 11 | 88.2 ± 0.7 | 1457.356 ± 269.818 | 125.194 ± 25.393 | 13.323 ± 4.251 | 88.588 ± 20.922 |
| Low stove in Xuanwei | 1 | 89.7 | 2437.381 | 178.345 | 2.360746 | 54.69838 |
| Overall Fuyuan | 22 | 84.0 ± 2.1 | 1642.964 ± 137.47 | 194.189 ± 25.892 | 16.054 ± 2.58 | 90.061 ± 13.71 |
| Overall Xuanwei | 21 | 87.2 ± 0.7 | 1553.905 ± 178.872 | 147.798 ± 20.169 | 16.415 ± 4.332 | 75.392 ± 12.083 |
| Overall high stove | 24 | 83.8 ± 1.8 | 1545.383 ± 140.819 | 186.375 ± 22.867 | 18.525 ± 3.817 | 75.326 ± 11.943 |
| Overall portable stove | 17 | 87.8 ± 1.1 | 1639.507 ± 196.098 | 151.279 ± 27.279 | 12.874 ± 2.814 | 94.842 ± 15.704 |
| Overall low stove | 2 | 87.4 ± 2.3 | 1908.2 ± 529.181 | 165.584 ± 12.761 | 17.227 ± 14.866 | 72.223 ± 17.524 |
| Overall | 43 | 85.6 ± 1.1 | 1599.47 ± 111.006 | 171.533 ± 16.7 | 16.23 ± 2.463 | 82.897 ± 9.128 |
| Location | Fuel | Sample Amount | EF EC (g/kg Fuel) | EF OC (g/kg Fuel) |
|---|---|---|---|---|
| Tibet, China | Yak Dung | 10 | 0.25 ± 0.05 | 15.41 ± 2.54 |
| Tibet, China | Wood | 2 | 0.11 ± 0.05 | 16.03 ± 14.48 |
| Yunnan, China | Coal | 16 | 1.46 ± 0.47 | 10.09 ± 2.71 |
| Yunnan, China | Mix | 18 | 0.51 ± 0.17 | 7.02 ± 1.26 |
© 2019 by the authors. Licensee MDPI, Basel, Switzerland. This article is an open access article distributed under the terms and conditions of the Creative Commons Attribution (CC BY) license (http://creativecommons.org/licenses/by/4.0/).
Share and Cite
Dang, J.; Li, C.; Li, J.; Dang, A.; Zhang, Q.; Chen, P.; Kang, S.; Dunn-Rankin, D. Emissions from Solid Fuel Cook Stoves in the Himalayan Region. Energies 2019, 12, 1089. https://doi.org/10.3390/en12061089
Dang J, Li C, Li J, Dang A, Zhang Q, Chen P, Kang S, Dunn-Rankin D. Emissions from Solid Fuel Cook Stoves in the Himalayan Region. Energies. 2019; 12(6):1089. https://doi.org/10.3390/en12061089
Chicago/Turabian StyleDang, Jin, Chaoliu Li, Jihua Li, Andy Dang, Qianggong Zhang, Pengfei Chen, Shichang Kang, and Derek Dunn-Rankin. 2019. "Emissions from Solid Fuel Cook Stoves in the Himalayan Region" Energies 12, no. 6: 1089. https://doi.org/10.3390/en12061089
APA StyleDang, J., Li, C., Li, J., Dang, A., Zhang, Q., Chen, P., Kang, S., & Dunn-Rankin, D. (2019). Emissions from Solid Fuel Cook Stoves in the Himalayan Region. Energies, 12(6), 1089. https://doi.org/10.3390/en12061089