1. Introduction
Due to the phase down of global warming and phase out of ozone depleting substances enacted through the Montreal Protocol and strengthened recently by the Kigali Amendment [
1], various alternative refrigerants including ammonia, hydrocarbons and carbon dioxide (CO
2) have been studied as substitutes. Ammonia is toxic while hydrocarbons are flammable, and therefore their use are severely controlled [
2]. One of the main contenders among the alternatives is CO
2, known as R744. R744′s re-emergence in refrigeration industries has been attributed to its very low environmental footprint, having zero ozone depletion potential (ODP) and low global warming potential (GWP) of unity [
3]. In addition, the energy efficiency of CO
2 systems is comparable to systems using other refrigerants, particularly in cool climates.
One of the distinct features of the CO
2 refrigeration system is its low critical point of 31 °C which results in the CO
2 refrigerant operating in a supercritical state as it passes through the air-cooled condenser [
3]. In this transcritical mode, the system COP (i.e., cooling energy generated divided by power input) is significantly degraded, resulting in this system being more suitable to colder climates [
4]. The predominant method of minimising the impact of transcritical operation is through modifying the refrigeration cycle, through parallel compression or the use of a mechanical expander [
5,
6,
7] or ejector [
8,
9]. All of these methods may bring marginal performance improvements during transcritical operation. Heat rejected by the gas cooler can be recovered for other applications such as water or space heating. However, heat recovery for other purposes is not always technically and or economically viable. In such a case, system performance can be improved by minimising the approach temperature [
10], using a well (optimally) designed gas cooler [
11] and by having an internal heat exchanger (IHX) or mechanical subcooling to further reduce the gas cooler outlet temperature. Collectively, these techniques may improve efficiency marginally during hot conditions, but add to system complexity and cost. Furthermore, the simultaneous presence of an IHX and an expander can in fact degrade the system performance. The presence of an expander reduces the temperature of gas exiting the gas cooler which degrades the effectiveness of the IHX [
5,
7]. Given these conflicting impacts and the cost associated with and the marginal gain attained from these techniques, it can be concluded that these approaches are not an ideal solution to the issues associated with system transcritical operation.
Previous researchers have investigated the performance of CO
2 system condensers/gas coolers [
10,
11,
12]. Ge et al. [
12] constructed two CO
2 gas coolers/condensers of finned-tube type having different structural designs and controls and tested them with an existing test rig of a CO
2 booster refrigeration system. Finned-tube heat exchangers are normally employed as gas coolers due to economic considerations [
11] although minichannel heat exchangers have also gained research interest [
13]. Recently, Li et al. [
14] developed a prototype of an integrated fin and micro-channel gas cooler for a CO
2 automotive air conditioning system. Enhancement of the air side heat transfer coefficient of the finned tube gas cooler is still a research challenge. This is further exacerbated by the existence of the pseudo-critical region above the critical point where large variations of CO
2 gas properties exist [
15] which “
coincides with the region where the specific heat has a maximum” ([
16], p. 889). Santosa et al. [
17] developed a computational fluid dynamics (CFD) model to study the finned-tube gas cooler and developed heat transfer coefficient correlations for the air side. The work also improves the gas cooler design by introducing slit-fins which increases the heat rejection rate between 6 to 8%. However collectively these techniques are still limited by the ambient conditions.
As discussed above, to date, research efforts have focused mainly on improving the condenser/gas cooler performance when the system operates in subcritical or transcritical mode, primarily through affecting the refrigeration cycle. However, little research has been directed towards enabling the system operating in subcritical mode through modification of the ambient condition.
In some climate zones, the transcritical operation may only occur during a limited number of hours in a year during the hot ambient conditions. This can result in choosing a compressor with much larger capacity only to satisfy this load. This has led to the concept of controlling the minimum gas cooler temperature through evaporative cooling as in the case of adiabatically cooled condensers [
18]. An extensive literature search so far on this topic has only led to a research paper written in 1975 by Rubin [
19] to evaluate the performance of an adiabatic cooling system used to improve the performance of air-cooled heat exchangers. However, this technique has been employed to enhance air-cooled heat exchangers by a number of condenser manufacturers [
20,
21]. In essence, the injection of about 20-micron droplets of water “could adiabatically cool the inlet air with complete evaporation of the droplets to prevent fouling by dissolved solids” [
19]. Hence, the water spray technique whereby the fin surface of the gas cooler is sprayed with fine droplets of water using high pressure water nozzles is ideally suited to CO
2 systems, minimising transcritical operation [
18]. According to [
18], a water spray system should only operate during peak summer days. However, in hot dry climates when wet bulb temperatures are above 20 °C, condenser temperatures approach the transcritical point, and therefore transcritical operation is unavoidable. An alternative approach is to couple an indirect evaporative system with a solid desiccant dehumidifier [
22,
23]. Although potentially capable of reducing the air temperature and approach much lower inlet temperatures, the dramatic increase in fan power limits the benefits to the system efficiency.
Indirect evaporative cooling is capable of delivering temperatures below the wet bulb, approaching the dew point. The most effective form of dew point cooling (DPC) applies counterflow heat exchange, as presented by Bruno [
24]. This research experimentally demonstrated the capability of DPC to minimise the approach temperature to the dew point. The dew point in hot dry climates is generally well below 20 °C, capable of sustaining condenser temperatures below the critical temperature of CO
2. Consequently, DPC enables CO
2 refrigeration to operate subcritically in hot dry climates, potentially expanding the number of climate zones where it can be efficiently used, warranting investigation. To date, no research has applied this concept to reducing transcritical operation of CO
2 refrigeration systems.
The objectives of this research are to identify the optimal coupling of DPC with CO2 refrigeration and determine the improvement in the COP across a range of conditions that can significantly reduce the duration of transcritical operation of the system.
This paper presents the outcome of an experimental investigation on the performance of the CO2 refrigeration system enhanced with the DPC. This includes the impacts of the DPC precooling technology on the condensing temperature, transcritical operation, system COP, and the annual electrical energy consumption and peak demand for Adelaide, Australia.
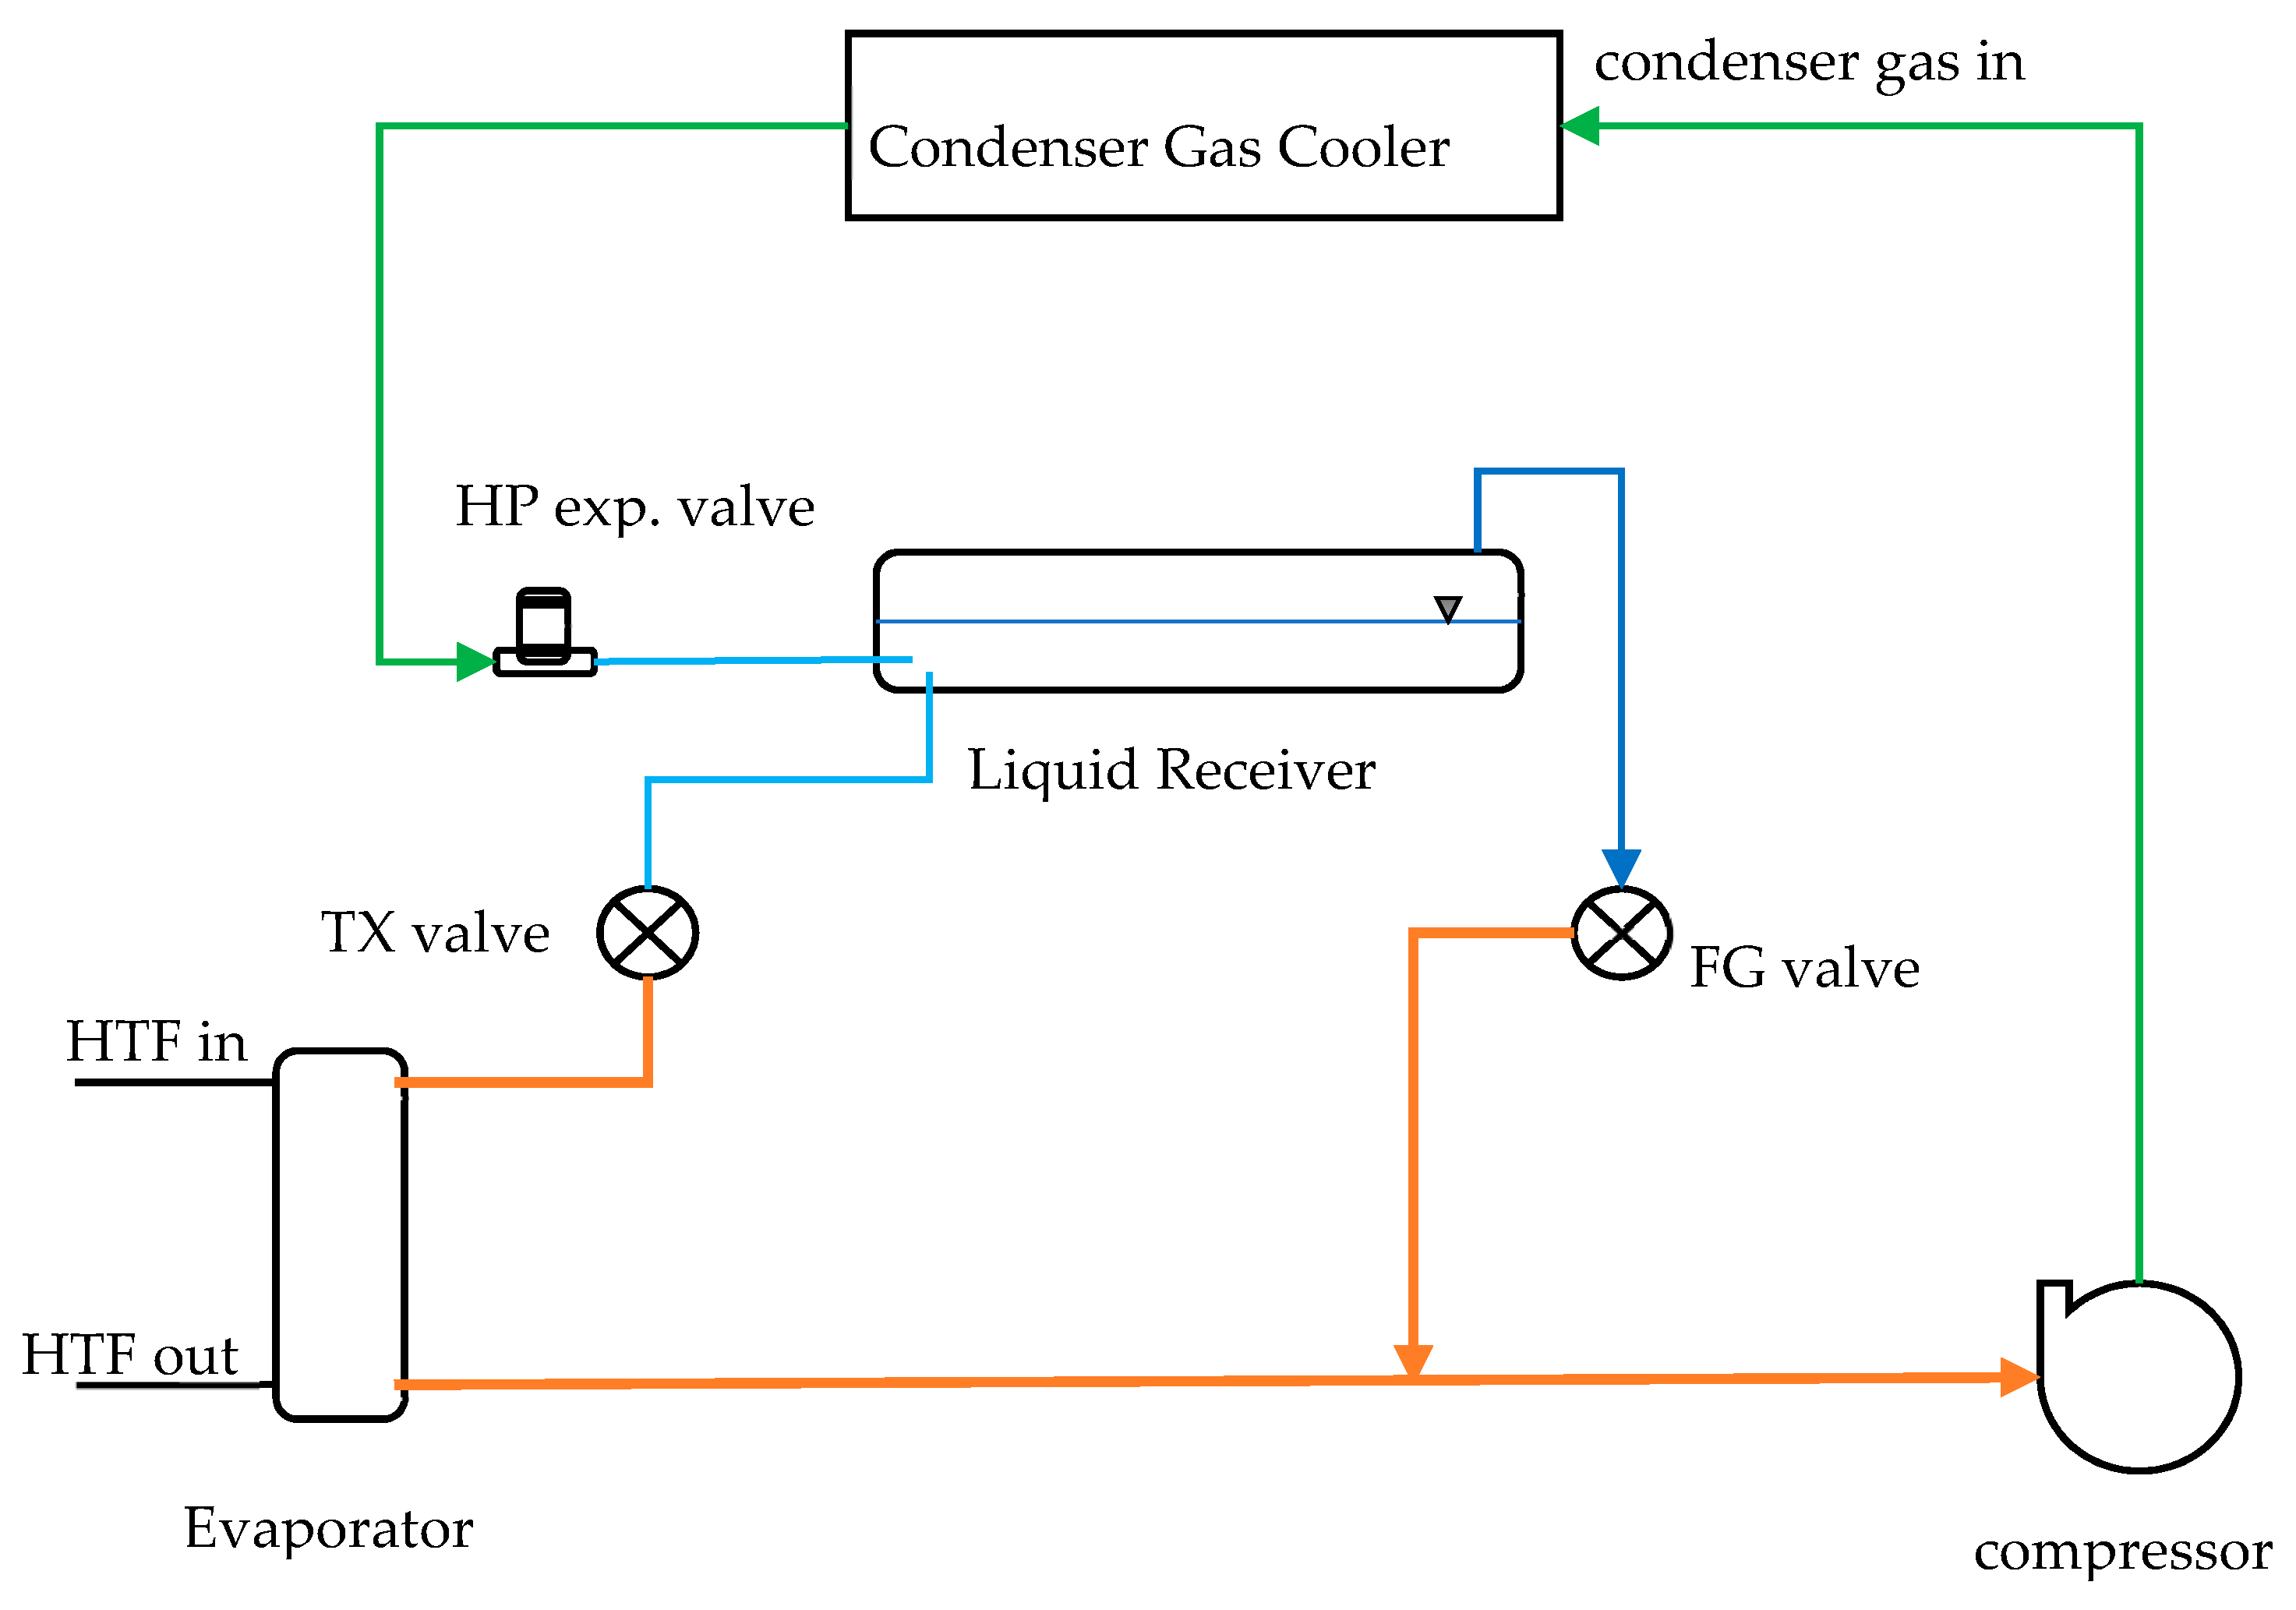
2. System Description
The system under experimental investigation consists of a CO
2 refrigeration system (
Figure 1) powered by a Bitzer compressor model 4MTC-7K [
25] with cooling capacity of 25.5 kW and a COP of 6.3 at a compressor operating frequency of 50 Hz, condensing temperature of 15 °C and evaporating temperature of −5 °C.
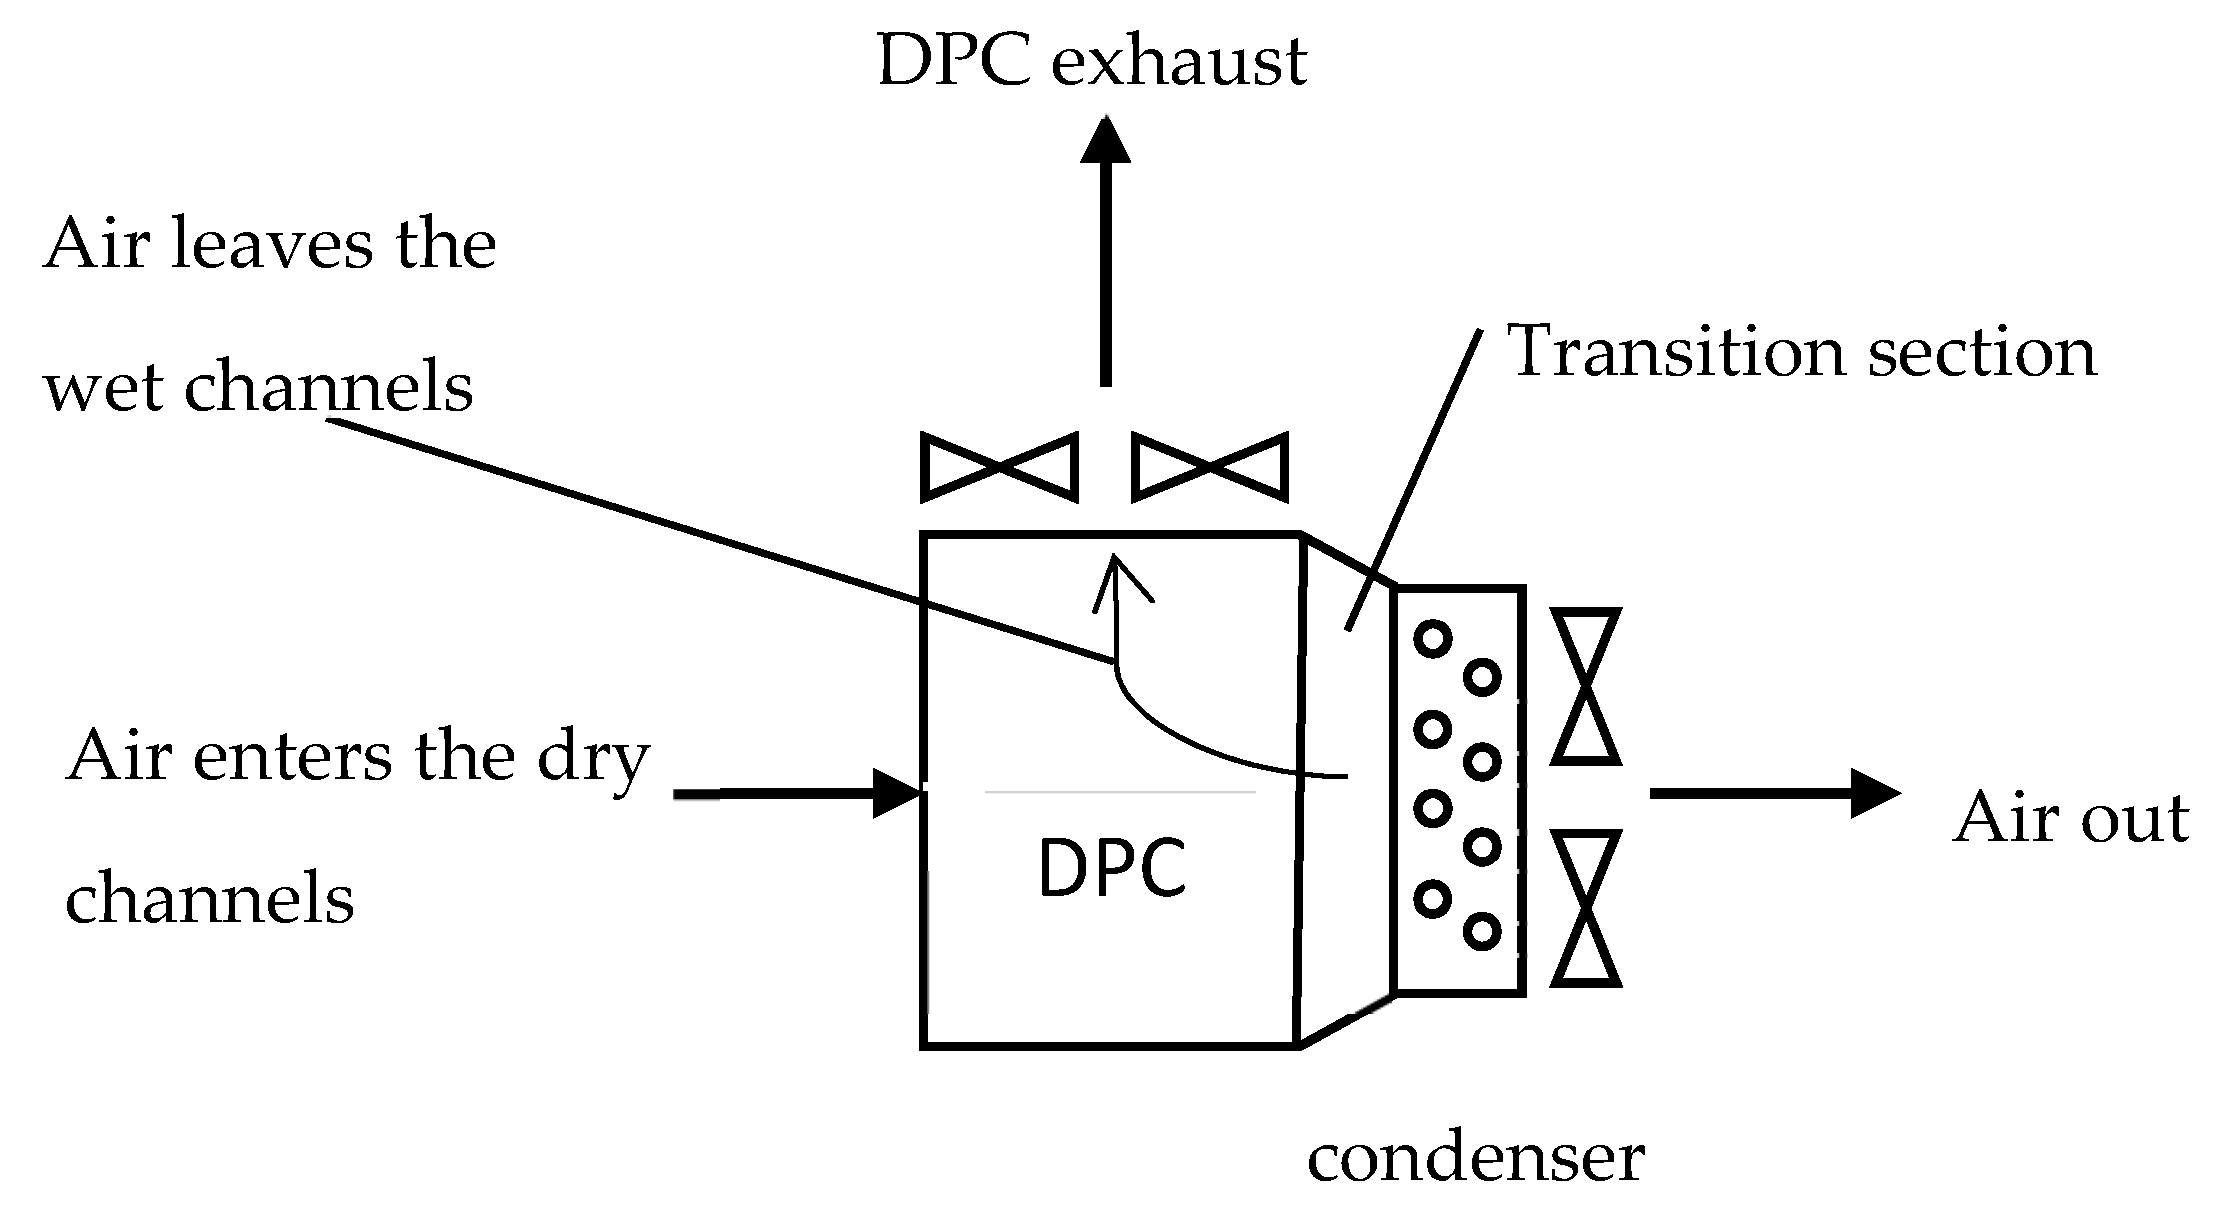
The coupled DPC with gas cooler is presented in
Figure 2. The finned-tube condenser used two centrifugal variable speed EC fans with rated power of 3.46 kW located downstream of the condenser with the DPC driven by two additional EC fans with rated power of 1.9 kW. The condenser fans draw air through the dry channels of the DPC and the condenser.
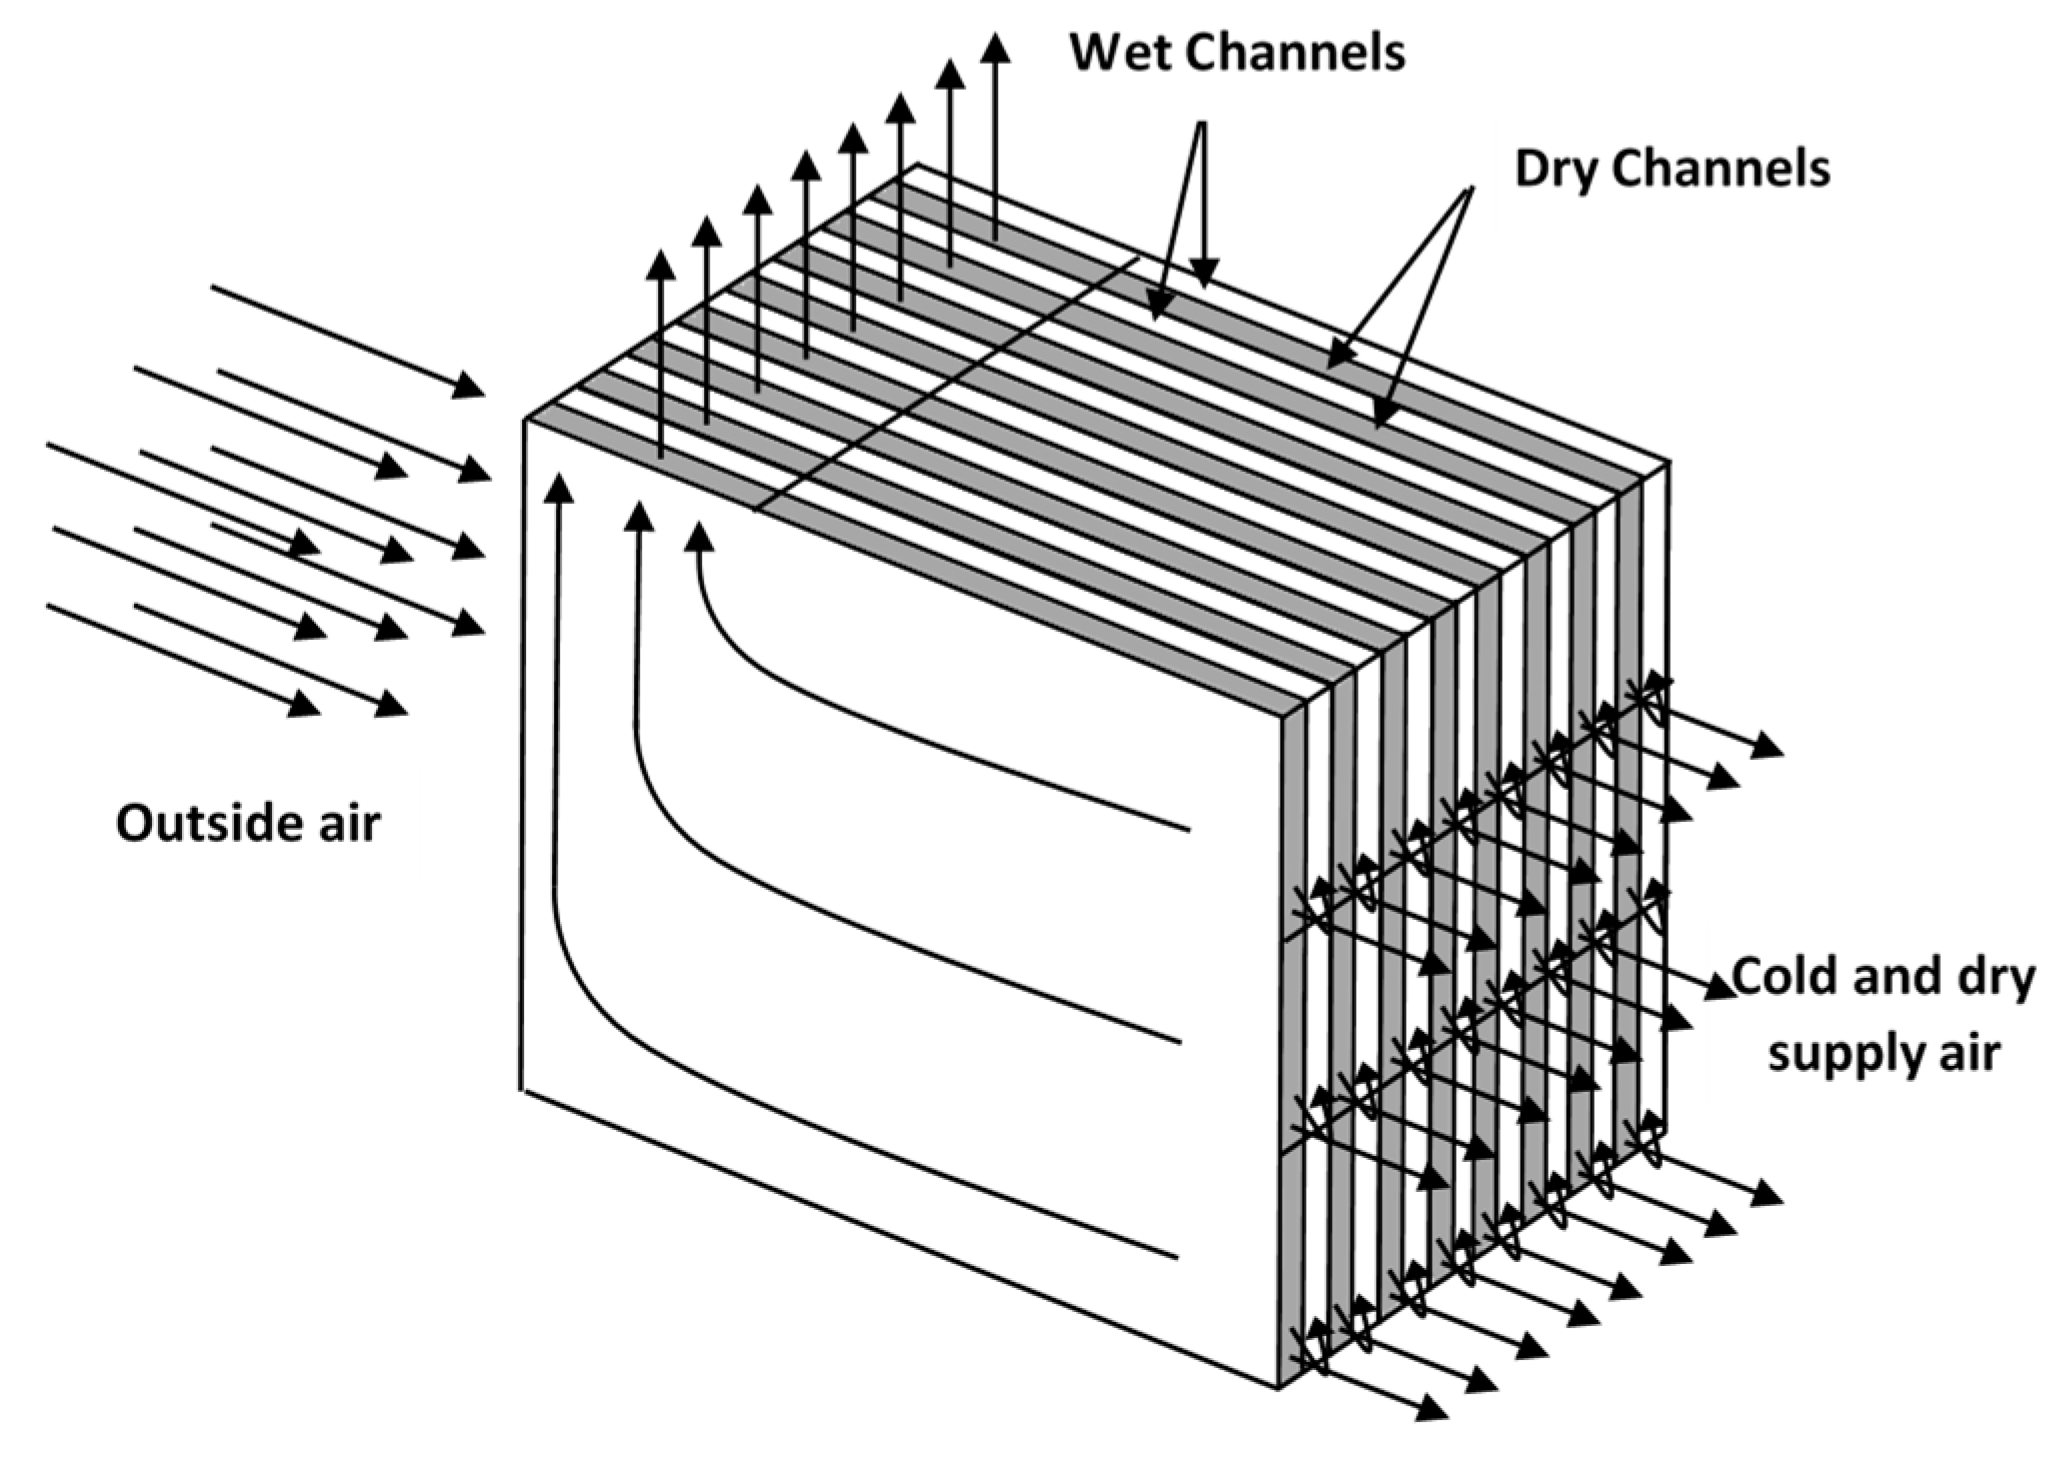
The DPC model CW40, a product of Seeley International, is used to precondition ambient air before it cools the condenser. The principal operation of this cooler is based on the cooling technology patented by Maisotsenko and his colleagues [
26]. As seen in
Figure 3, the outside (“primary”) air is drawn through the primary, dry channels to a plenum chamber. From the plenum chamber, a portion of the air is supplied as
supply air. An optimally selected proportion of air which maximises the COP of the DPC, approximately 50% of the supply air, is drawn back to
wet channels of the heat exchanger and leaves the heat exchanger through the exhaust. The air traveling through these channels is cooled through an evaporation process. This provides a temperature difference across the heat exchanger channels and heat from the dry channel is exchanged to the now cooler wet channel air. Since the air flowing through the wet channels has a depressed wet bulb temperature, evaporation on the wet surfaces of the wet channel will produce air with temperature approaching the now lower wet bulb temperature. Ultimately, it is consistent with an infinite number of indirect evaporative cooling processes and enables the primary air to approach the dew point.
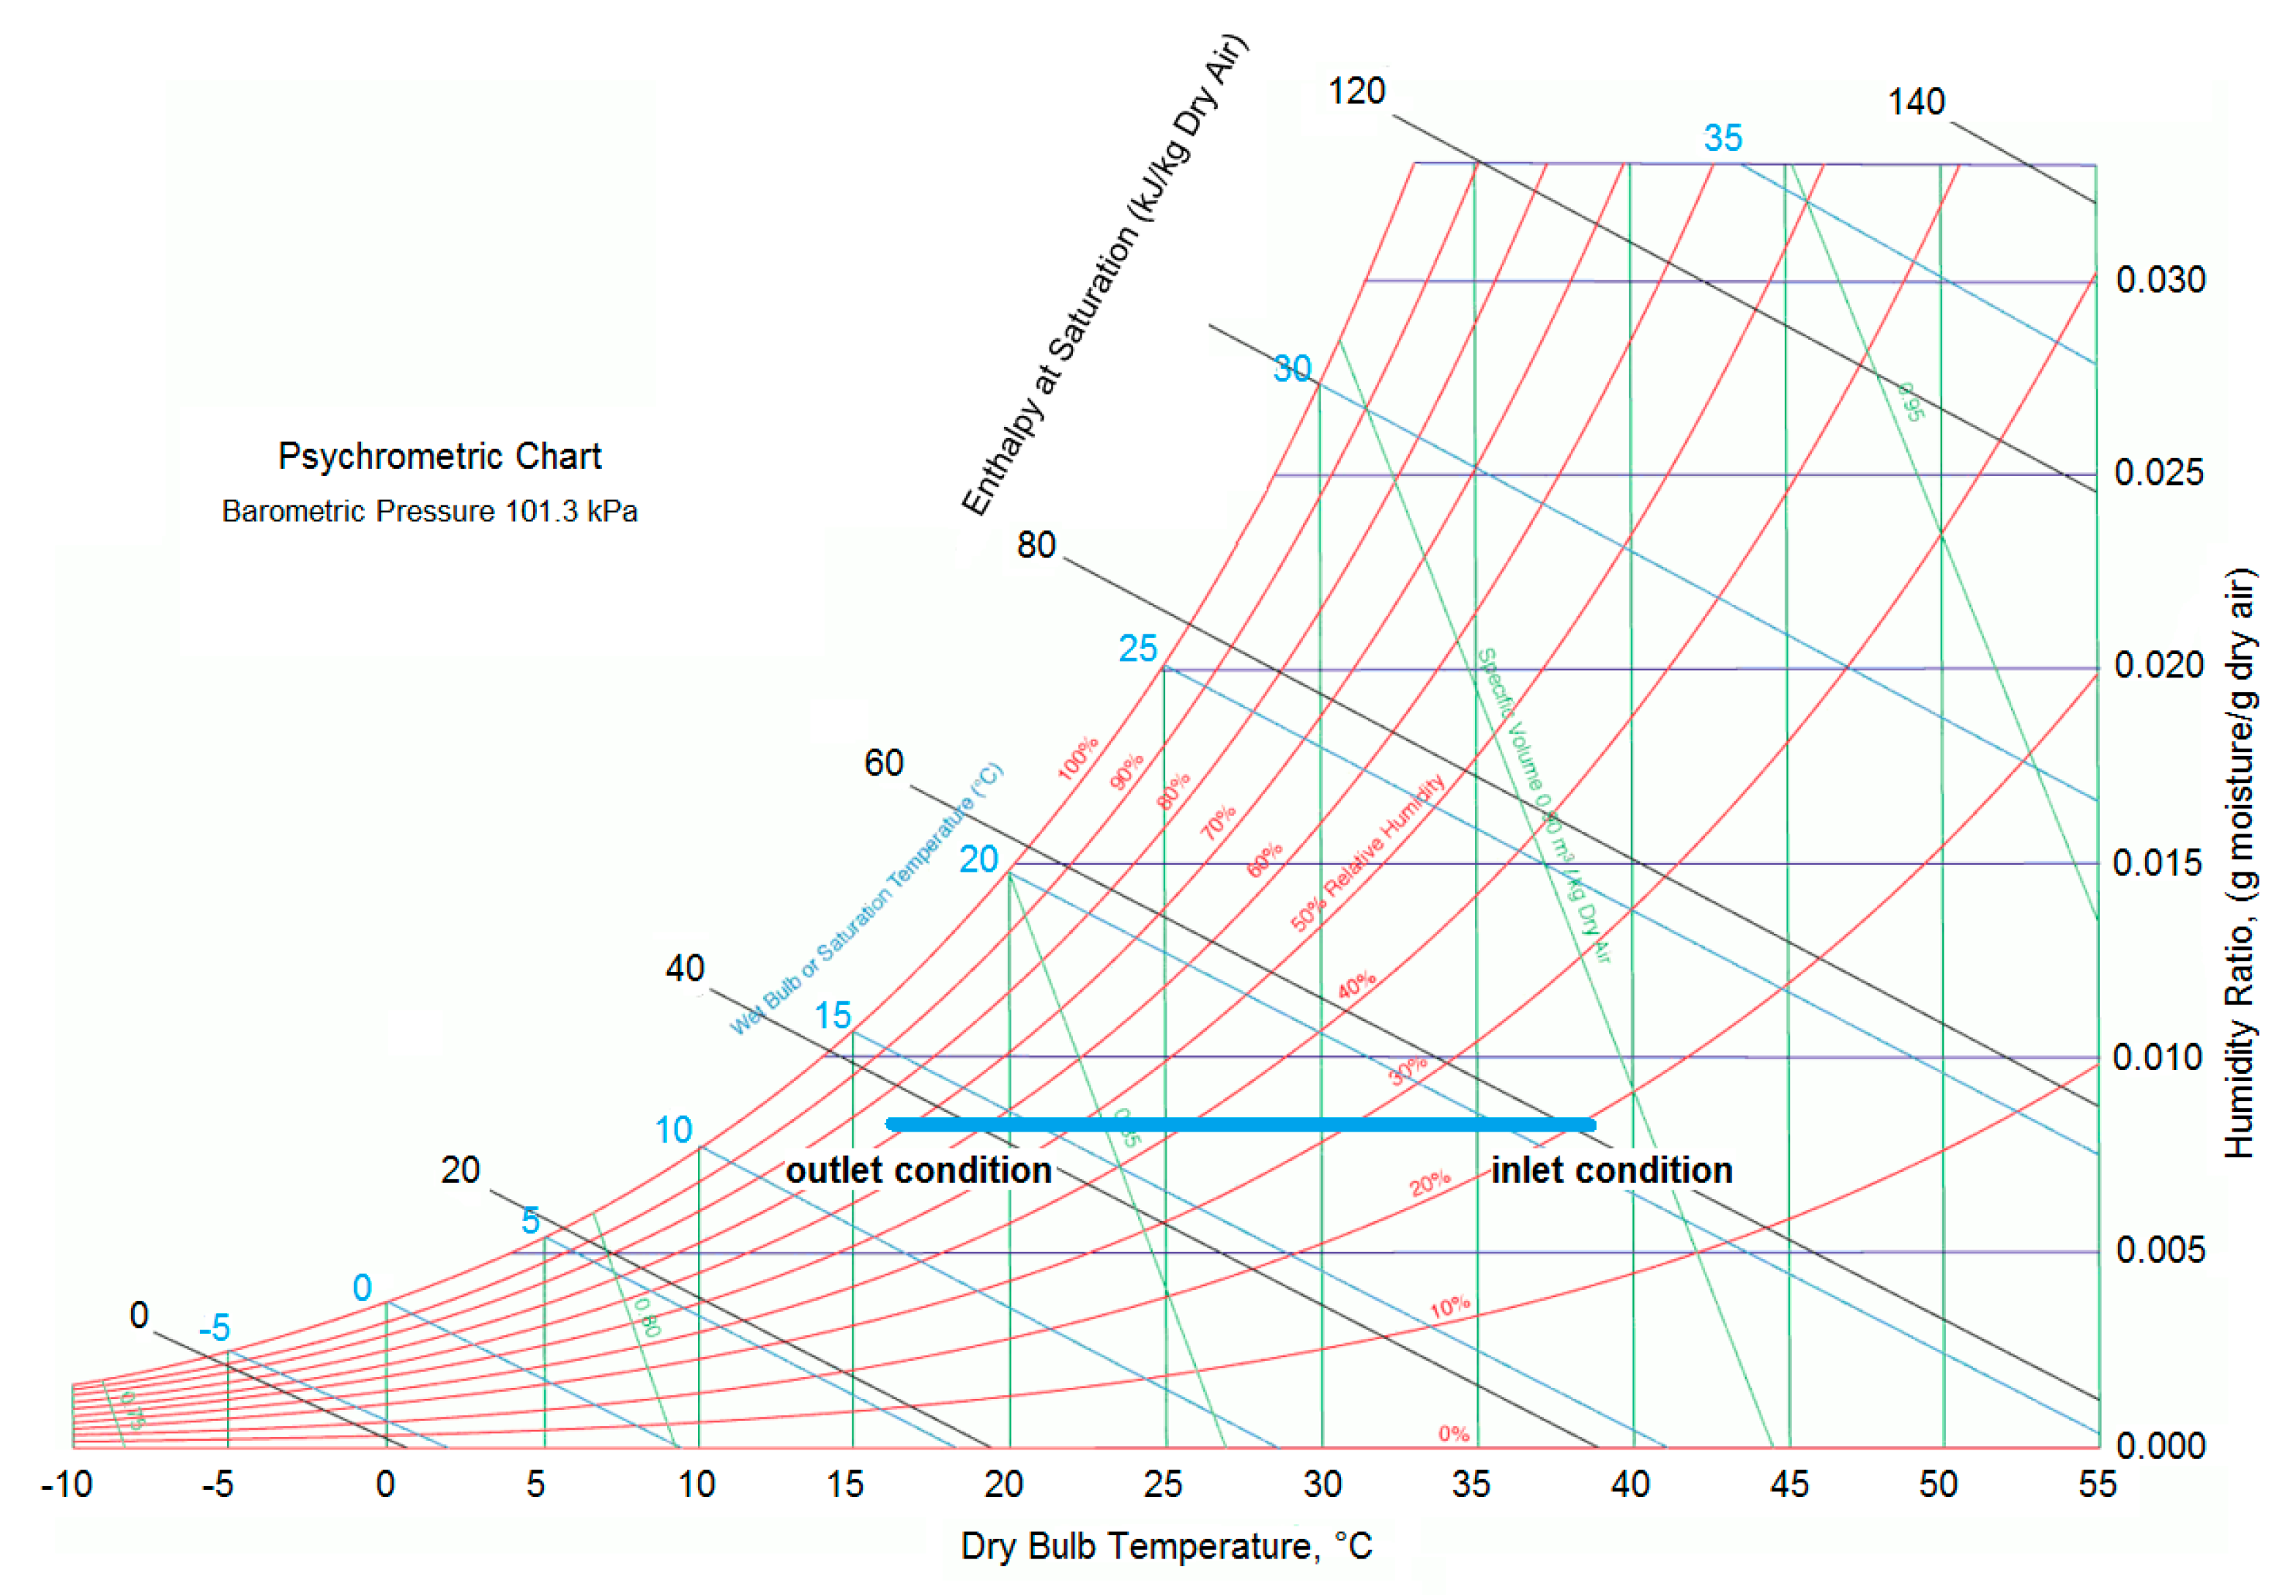
The cooling process is represented on a psychrometric chart shown in
Figure 4. In the example shown, air enters the dry side of the dew point cooler at the nominal design condition of 38 °C DB/21 °C WB corresponding to a humidity ratio of 8 g/kg. The sensible cooling process brings down the primary air temperature to 16 °C DB/13 °C WB. Ultimately, the final delivered temperature is below the entering wet bulb temperature and approaches the dew point. As a result, the performance is measured with respect to the dew point effectiveness.
Due to its greatly enhanced sensible cooling capability, the dew point cooler has the potential to improve the performance of the CO2 refrigeration system by dramatically reducing the periods during which it operates in transcritical mode. Furthermore, it can deliver lower condenser air inlet temperatures during subcritical operation, enhancing the COP of the compressor. An experimental investigation of the concept was undertaken.
3. Experimental Setup
Figure 5 shows the test chamber employed to evaluate the system performance. It consists of a prechamber, a main chamber and the refrigeration system.
The prechamber was designed to be able to supply air with constant temperature and humidity conditions to the refrigeration system. To achieve this, the prechamber was fitted with three gas heaters (one rated at 55 kW, two others rated at 15 kW each), and two 7.5 kW electrical elements. The prechamber is therefore capable of supplying 100 kW of heat, 6000 l/s air flow with the inlet ambient conditions of up to 50 °C and wet bulb temperature of up to 25 °C representing up to 40 kg/hr of additional moisture to the air using a steam humidifier. The two electrical element heaters were electronically controlled to accurately produce air at a set temperature. The supply air temperature was able to be controlled to within 0.1 °C. There were three fans that supplied air to the prechamber. One fan supplied 3000 l/s of recirculated air from the main chamber while two other fans supplied fresh air to the prechamber. These fans maintained the pressure in the prechamber equal to the ambient air pressure, ensuring that the flow rate through the DPC was not artificially increased.
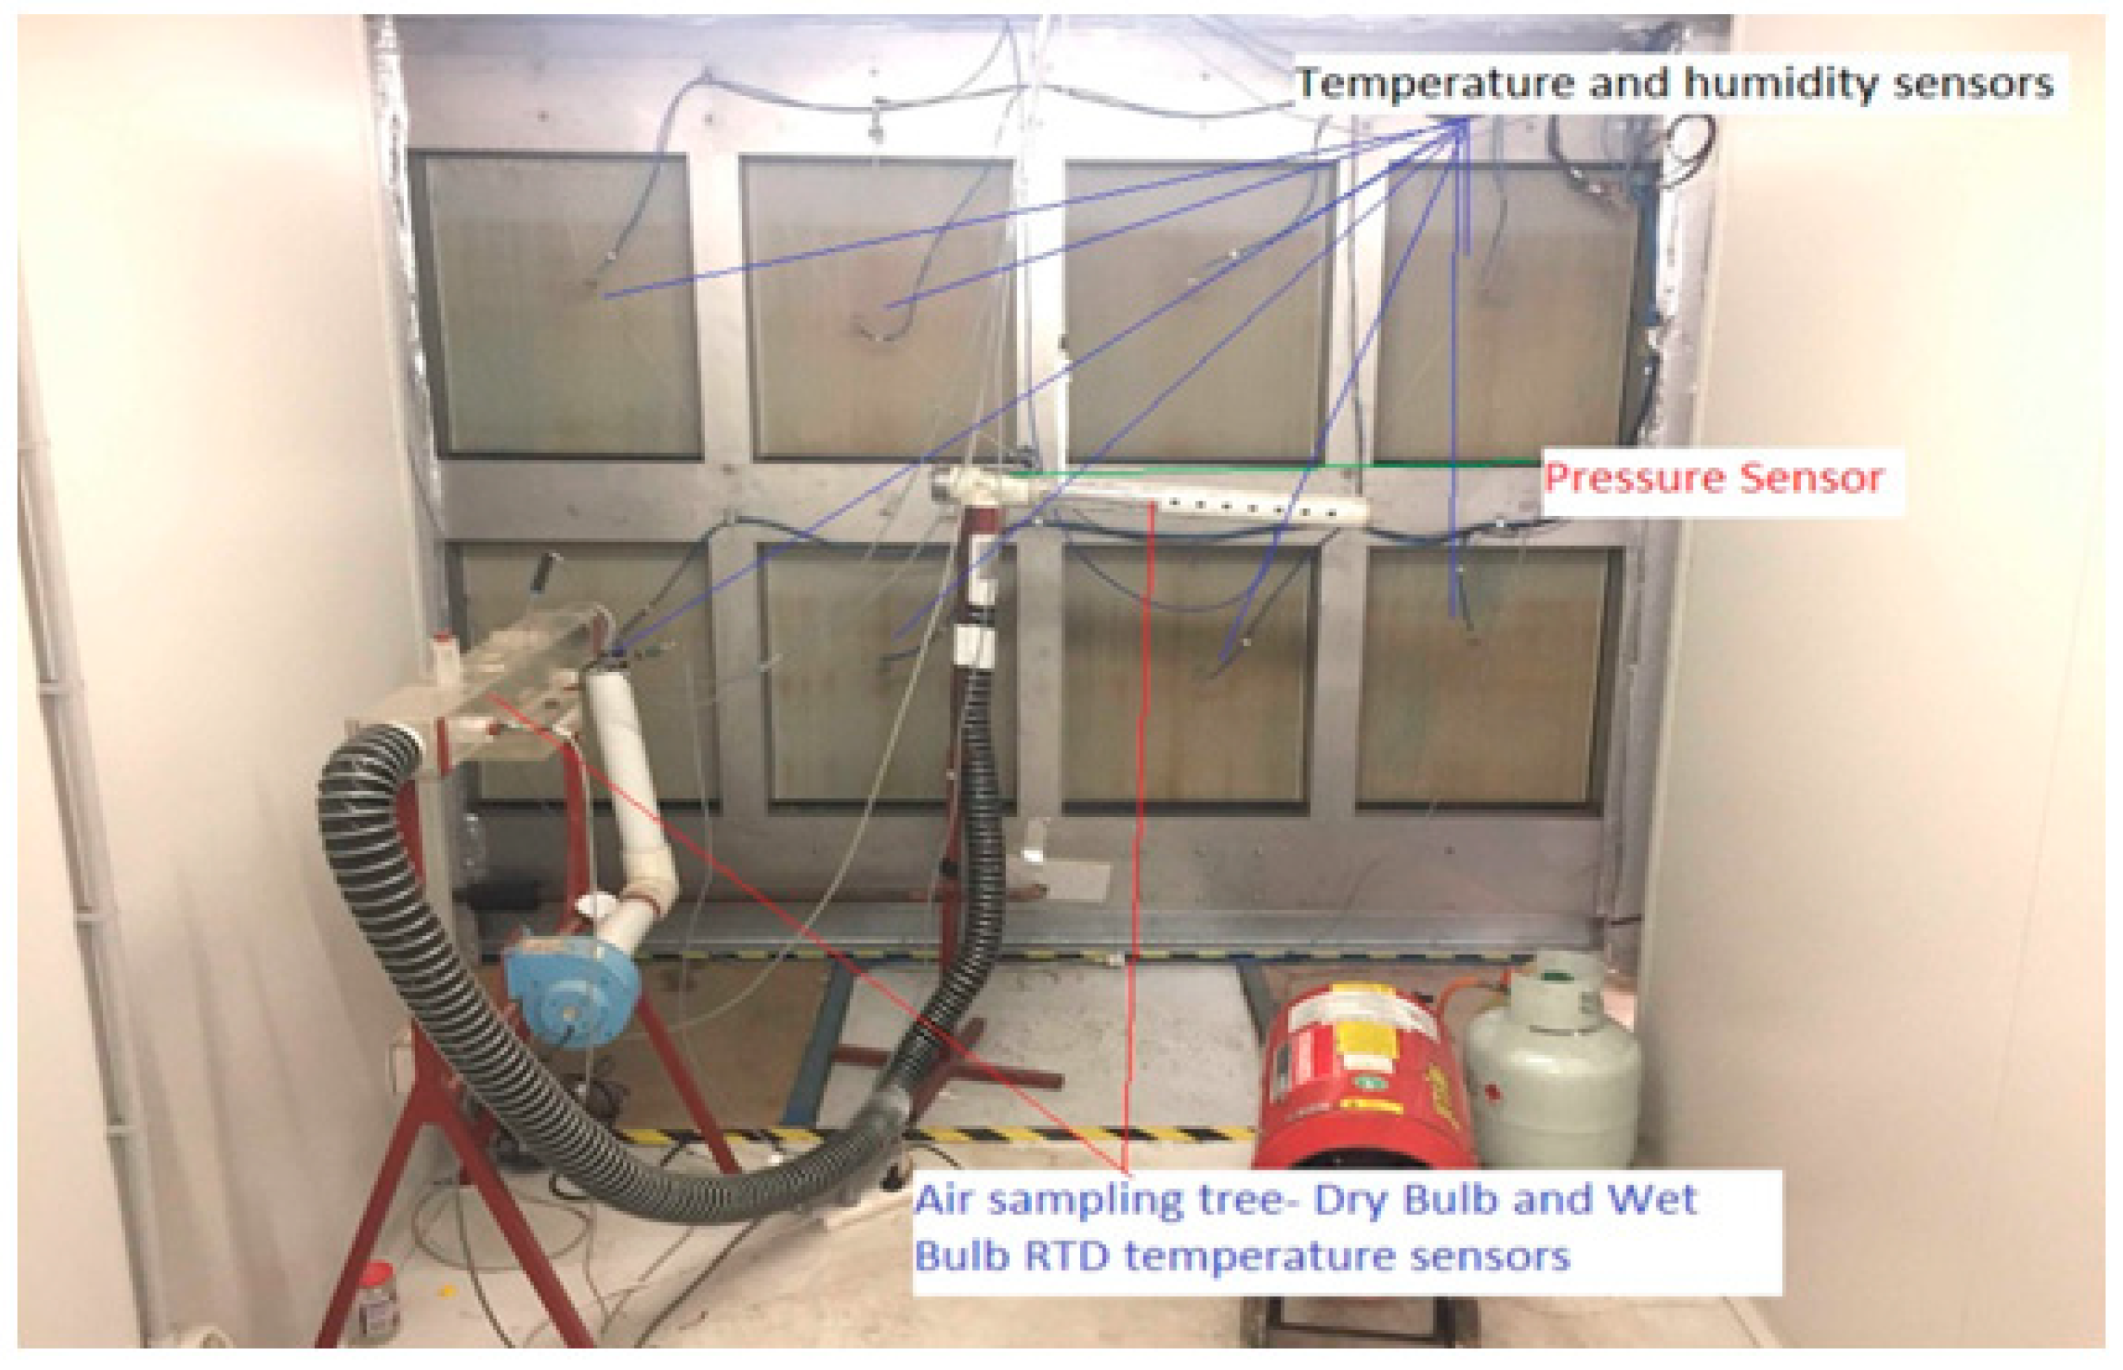
The test rig was equipped with an array of 56 sensors measuring air temperature, humidity, flow rates and pressures, refrigerant temperatures and pressures, and heat transfer fluid (HTF) temperatures and flow rates (
Figure 6). Data from the sensors were logged at 10 s intervals via a Datataker DT80 with two CEM 20 expansion modules.
The load to the evaporator heat exchanger was provided through a HTF circulated around a loop that included a tank with three 6 kW electrical resistance heating elements. These heating elements could be activated individually to vary the load on the evaporator. The total load was 21.5 kW which consisted of 18 kW heating element and 3.5 kW line losses. In the test, Dynalene HC-50 was used as the HTF.
Table 1 shows the thermophysical properties of the HTF used in the analysis.
Testing was performed to verify the performance of the refrigeration system without the operation of the dew point cooler, with the dew point cooler in operation and during transcritical operation. During the whole testing the saturated suction temperature of CO2 was set and maintained at approximately −5 °C.
5. Results and Discussions
This Section presents the CO2 system performance improvements gained from introducing the DPC. The results present the impact of the DPC on reducing condensing temperature, condenser air inlet temperature, the reduction in the range of conditions in which transcritical operation would occur, and the optimal operation of the coupled system.
5.1. Impact of DPC on the Condenser Temperature
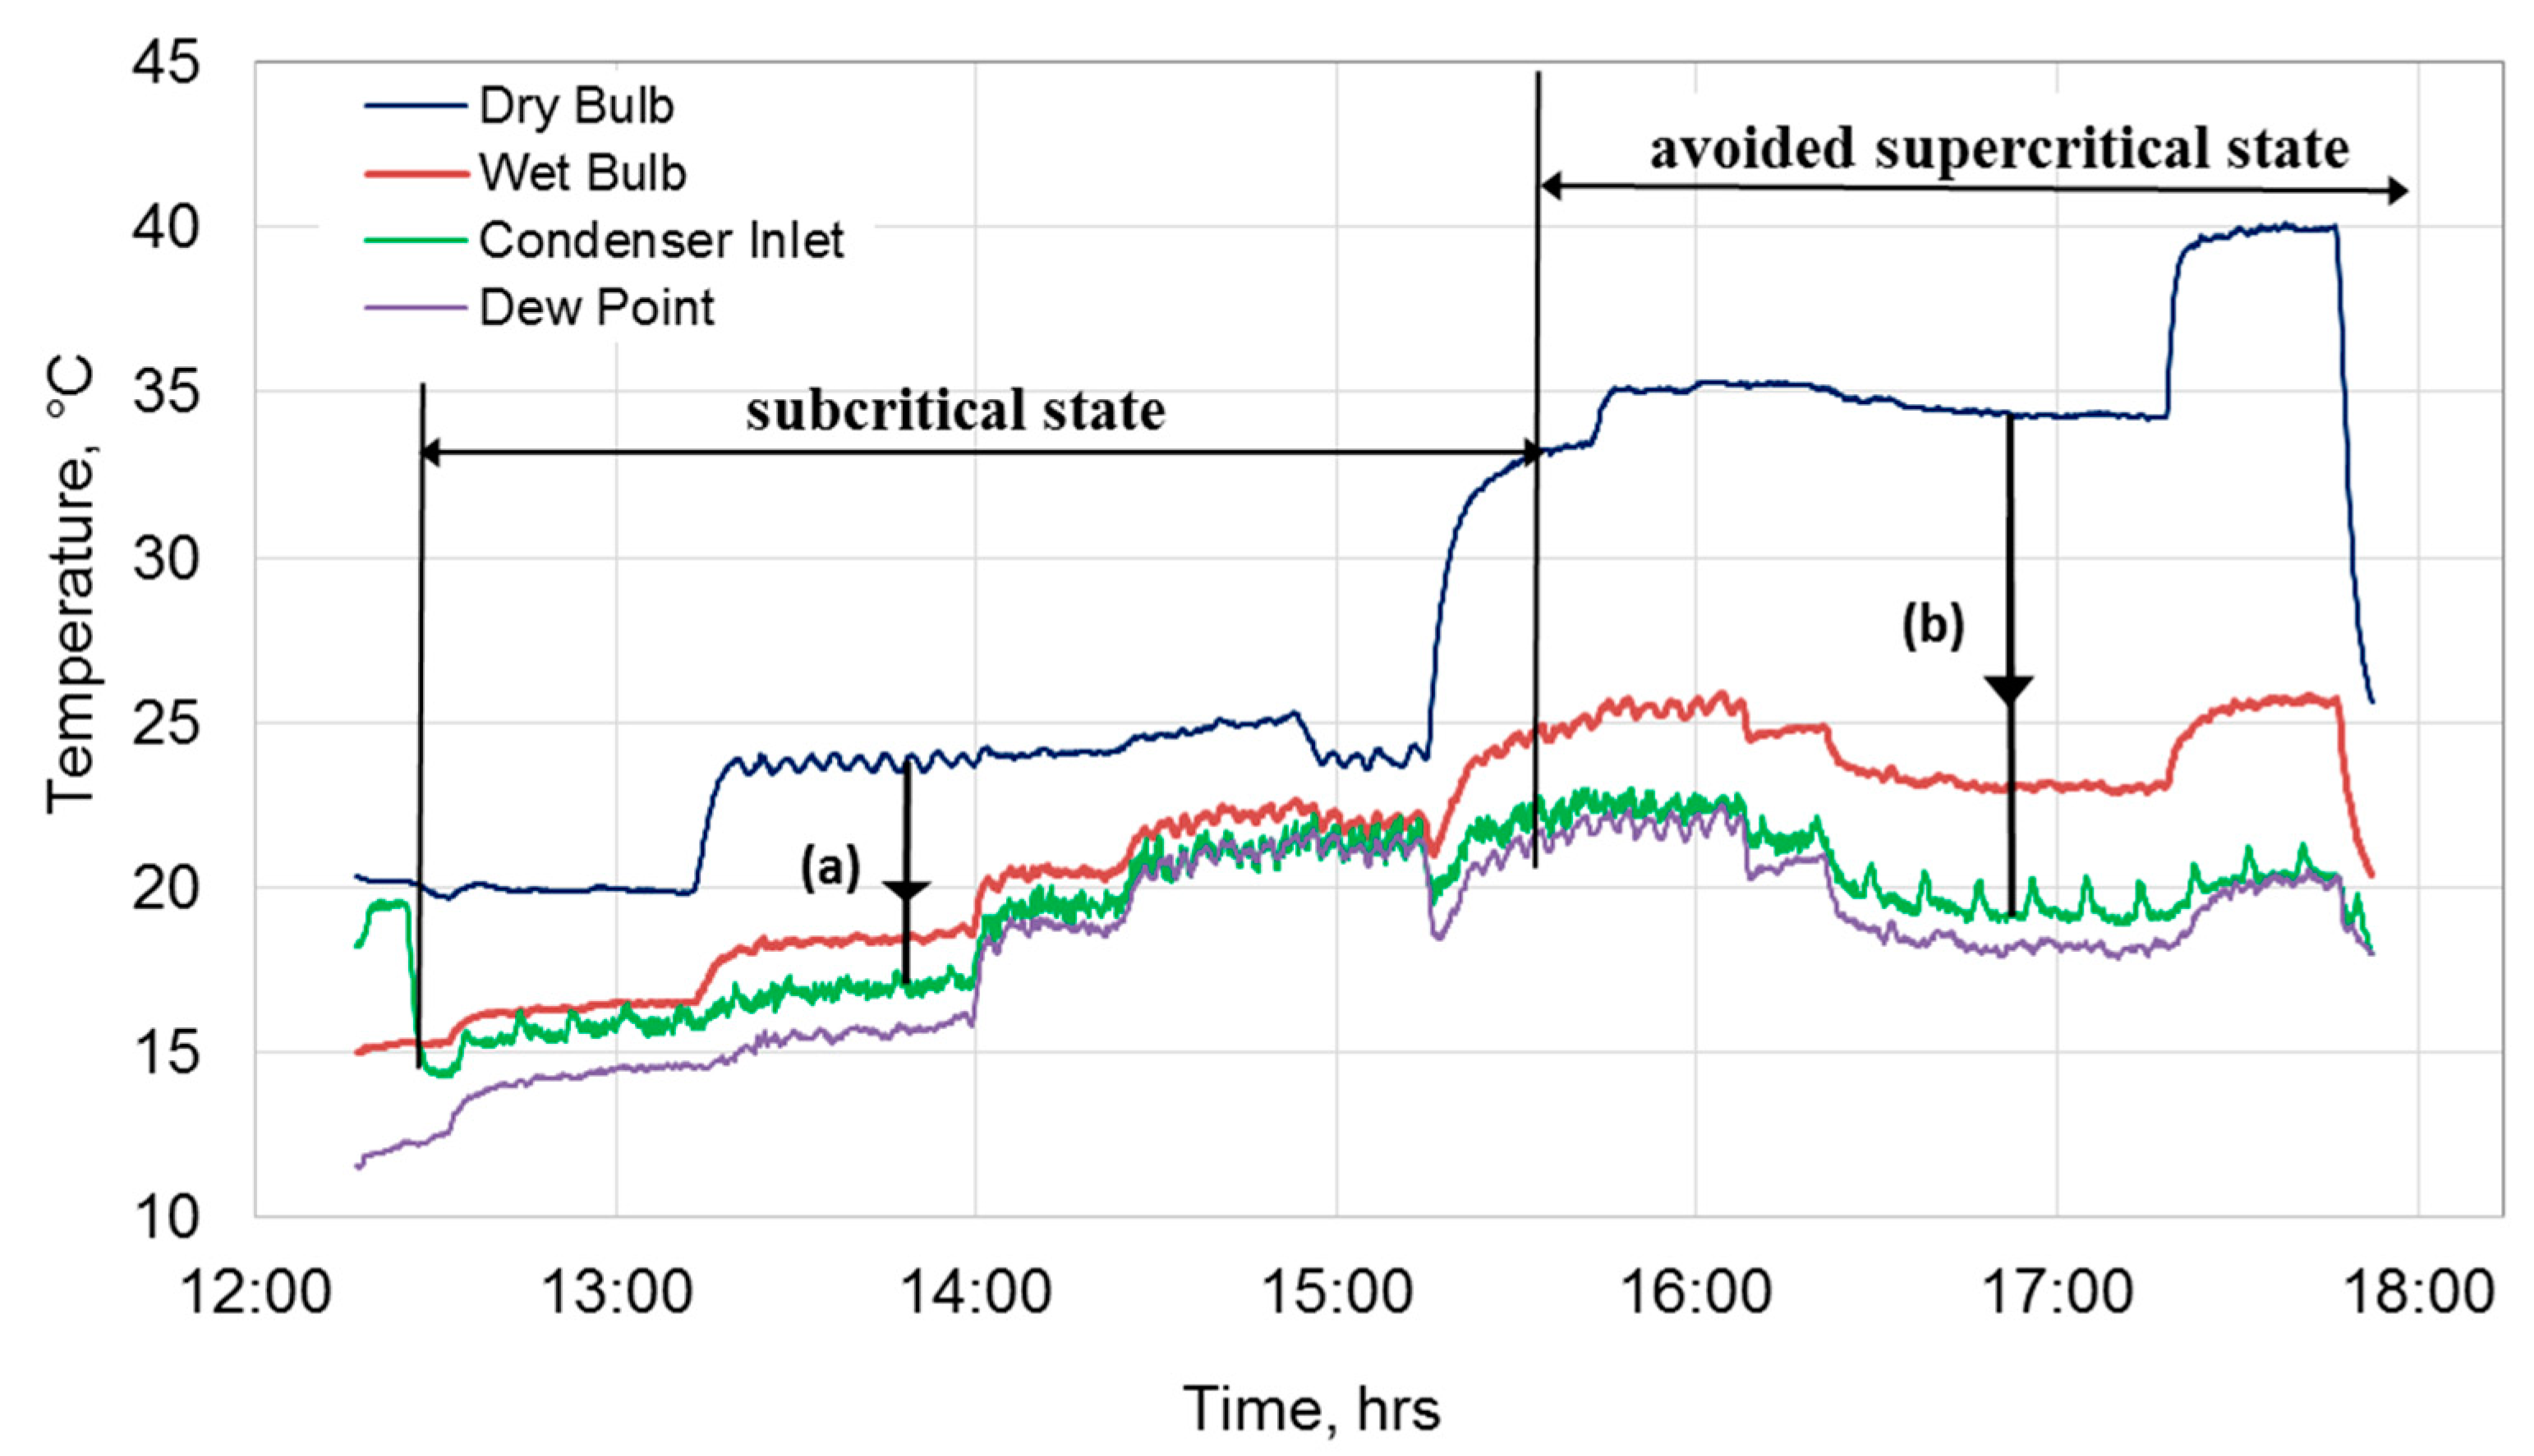
Figure 7 shows an example of experimental results for a range of operating conditions. Throughout the test the DB and DP temperatures of the incoming air were increased to show the impact on the condenser inlet air temperature. The first few hours of the testing show the case when the CO
2 system could have operated in subcritical state even without the DPC switched on with ambient temperatures up to 25 °C. In this case, the main function of the DPC is to precool the air to temperatures indicated by the green line before entering the condenser thereby reducing the system discharge pressure and corresponding condensing temperature.
When the DB temperature was increased to and above 35 °C, which corresponds to transcritical operation for the case of conventional CO2 systems, the DPC was able to maintain the condenser air inlet temperature between 19 °C and 22 °C. In this case, the system operates in subcritical mode, avoiding transcritical operation, which results in a significant increase in the compressor COP.
In reality, ambient temperatures of up to around 24 °C to 25 °C is the maximum range at which the CO
2 refrigerant flowing in the condenser condenses into a liquid state. Above this range, the refrigerant may still condense; however, the operation is much less efficient, and in fact it has been found to be less efficient than when it operates in a transcritical mode. Earlier work on gas coolers by Santosa [
27] showed that at a condenser air inlet temperature of 28 °C, the system operates in transcritical mode where with an approach temperature (i.e., the difference between refrigerant outlet temperature and air inlet temperature) of 1.5 K the gas cooler outlet temperature was 29.5 °C.
Referring back to
Figure 7, the DPC performs well in bringing down temperatures from as high as 40 °C to as low as 20 °C at a favourable combination of dry bulb and dew point temperatures.
5.2. The DPC Air Precool Zone
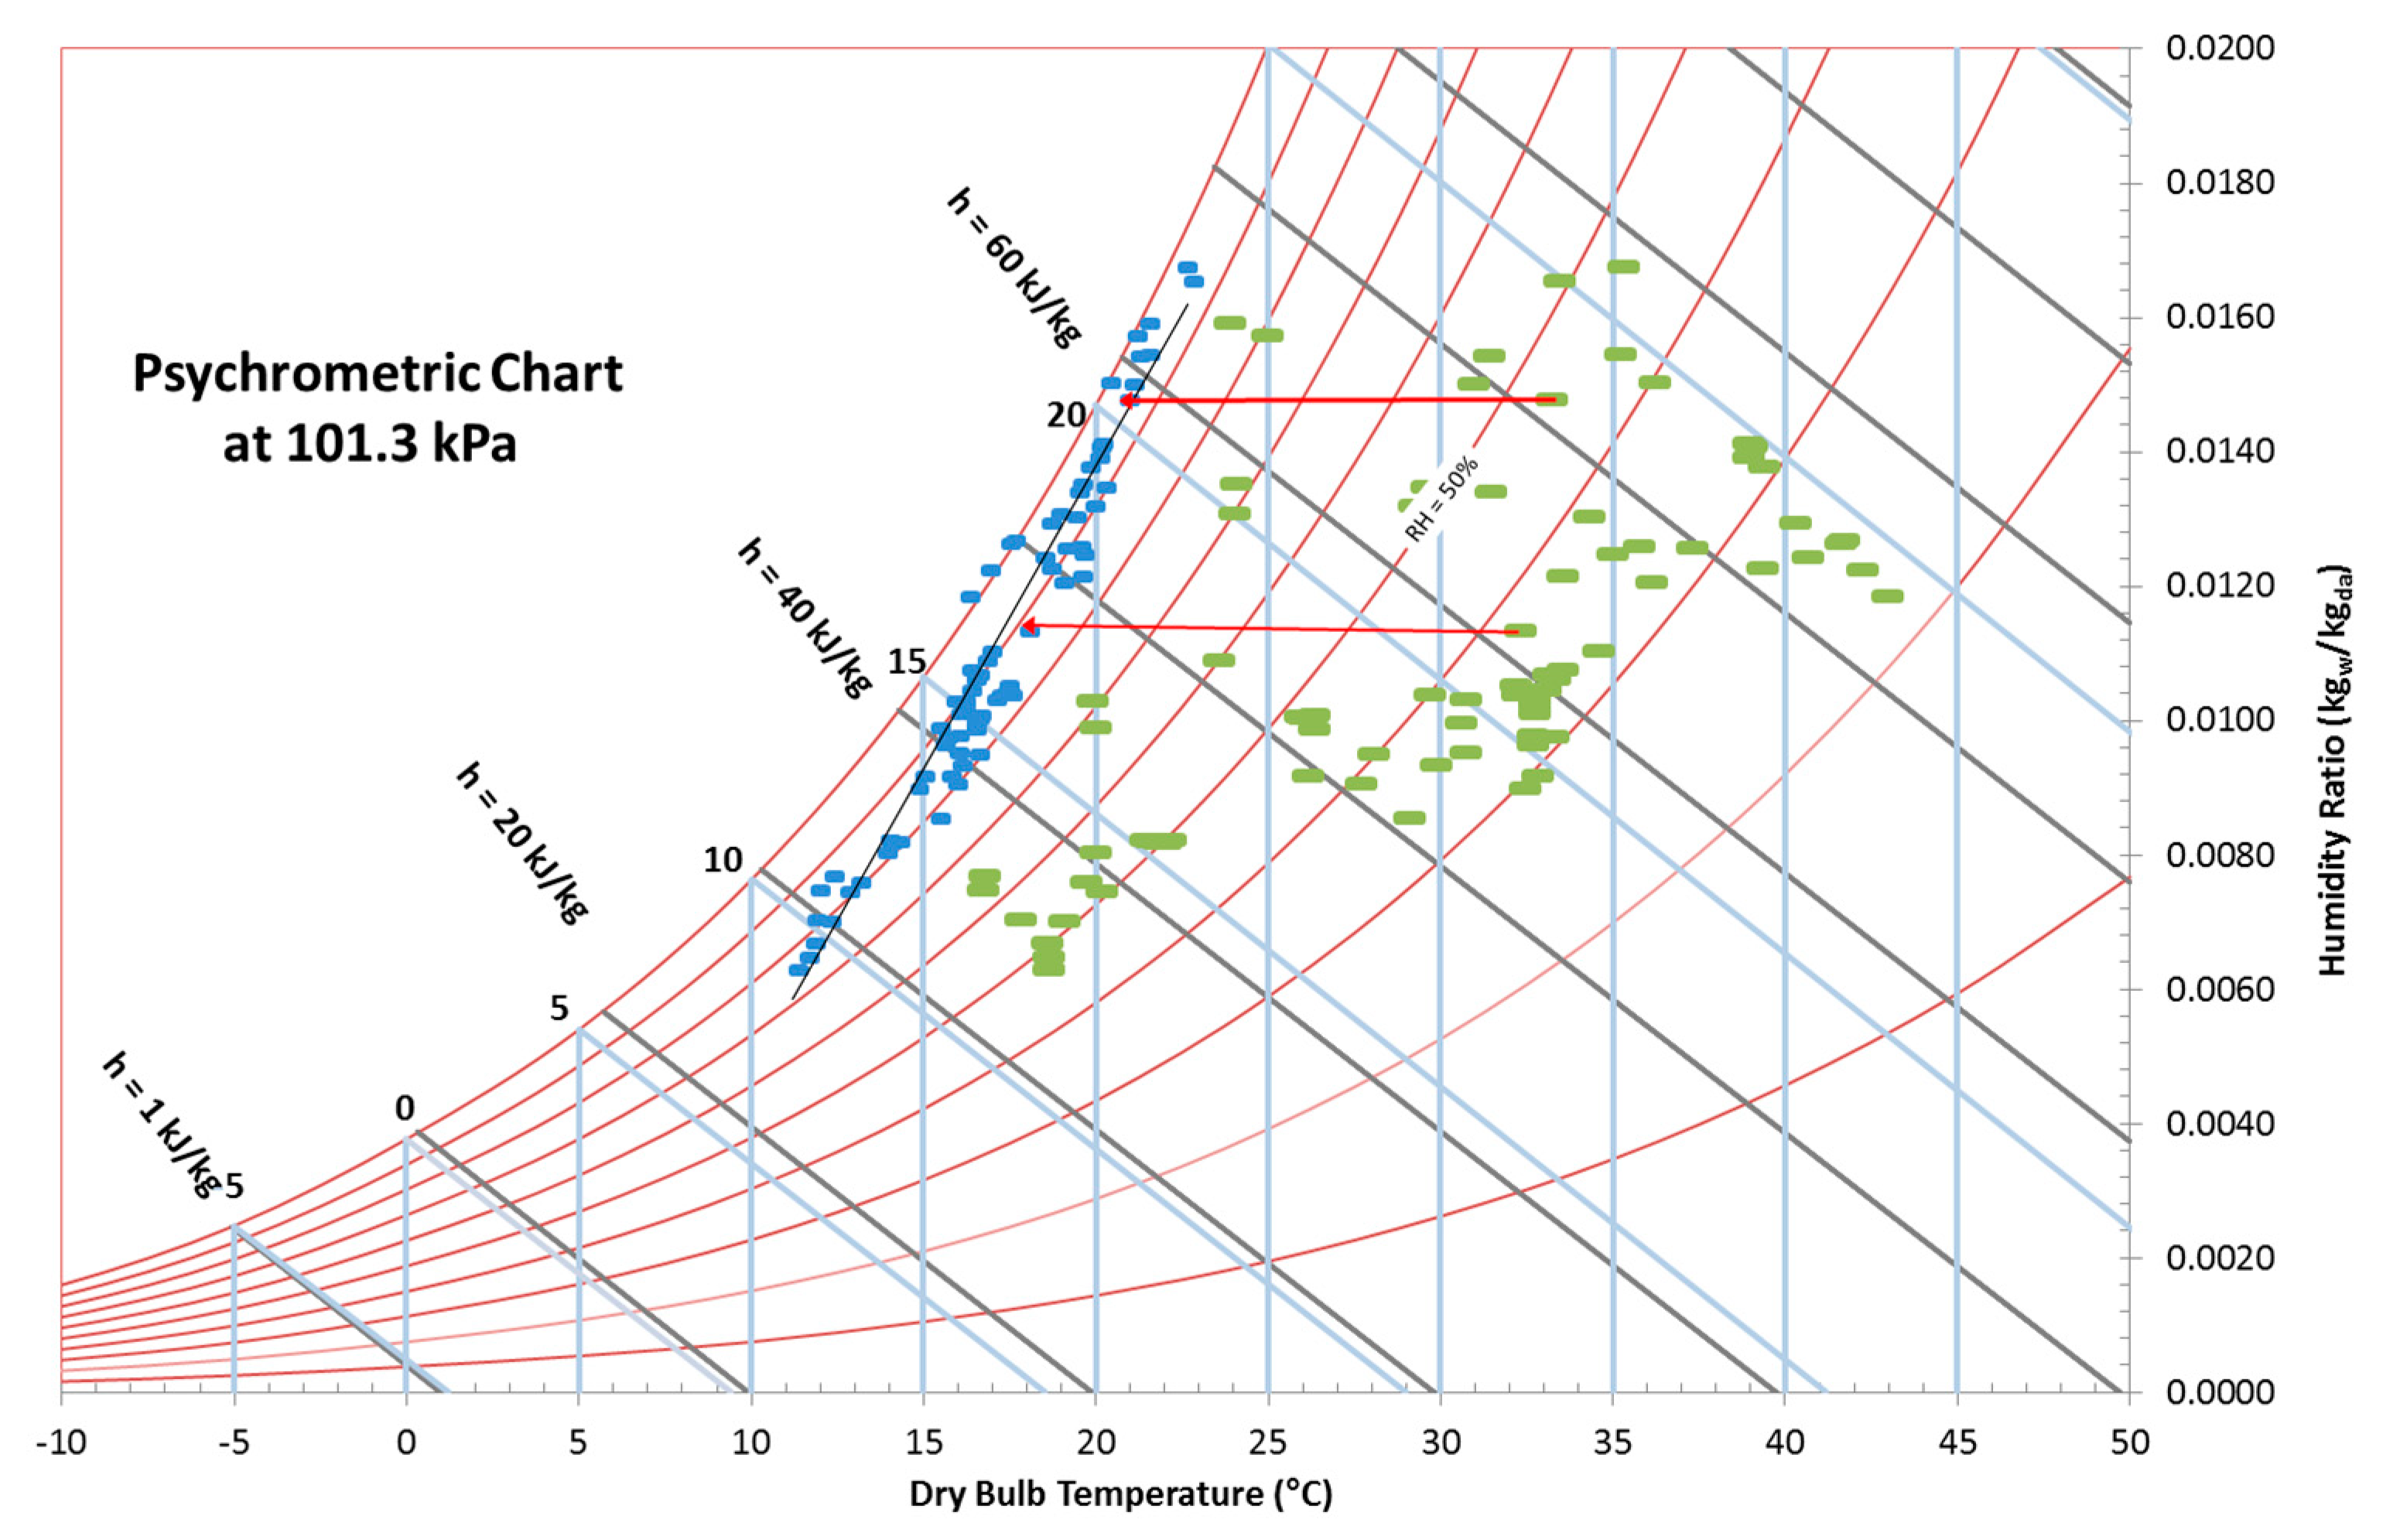
Figure 8 presents the range of ambient air conditions during the experiments in which the DPC was operated. It forms the basis for the creation of the subcritical-transcritical operating modes (
Section 5.4). The experiments were carried out with condenser air volumetric flow rates up to 3.8 m
3·s
−1. Since the DPC operates on a constant dew point principle, the process of cooling the air entering the DPC occurred at a constant humidity ratio indicated by the two horizontal red lines shown in
Figure 8.
The green points on the graph are the ambient conditions tested. The highest moisture condition was at 17 g/kg, 35 °C DB corresponding to a DP of 22.3 °C, while the hottest condition was 43 °C DB, 12 g/kg corresponding to a DP of 16.8 °C. The DPC brings down the ambient temperatures (green dots) closer to the saturation temperatures (blue dots). For those conditions where the dry bulb temperatures are above 22 °C, the system without DPC would normally transition to transcritical mode, as condenser temperatures approach the critical temperature. As shown in
Figure 8, the DPC is able to prevent transcritical operation for the majority of ambient conditions, while for temperatures below 22 °C, the DPC can dramatically reduce inlet condenser air temperatures, resulting in improved system COP.
The cooling performance of a dew point cooler is expressed in terms of its dew point effectiveness,
, defined as:
In Equation (1), tdb,in is intake dry bulb air temperature (°C), tdb,out is supply dry bulb air temperature (°C) and tdp,in is intake dew point temperature (°C).
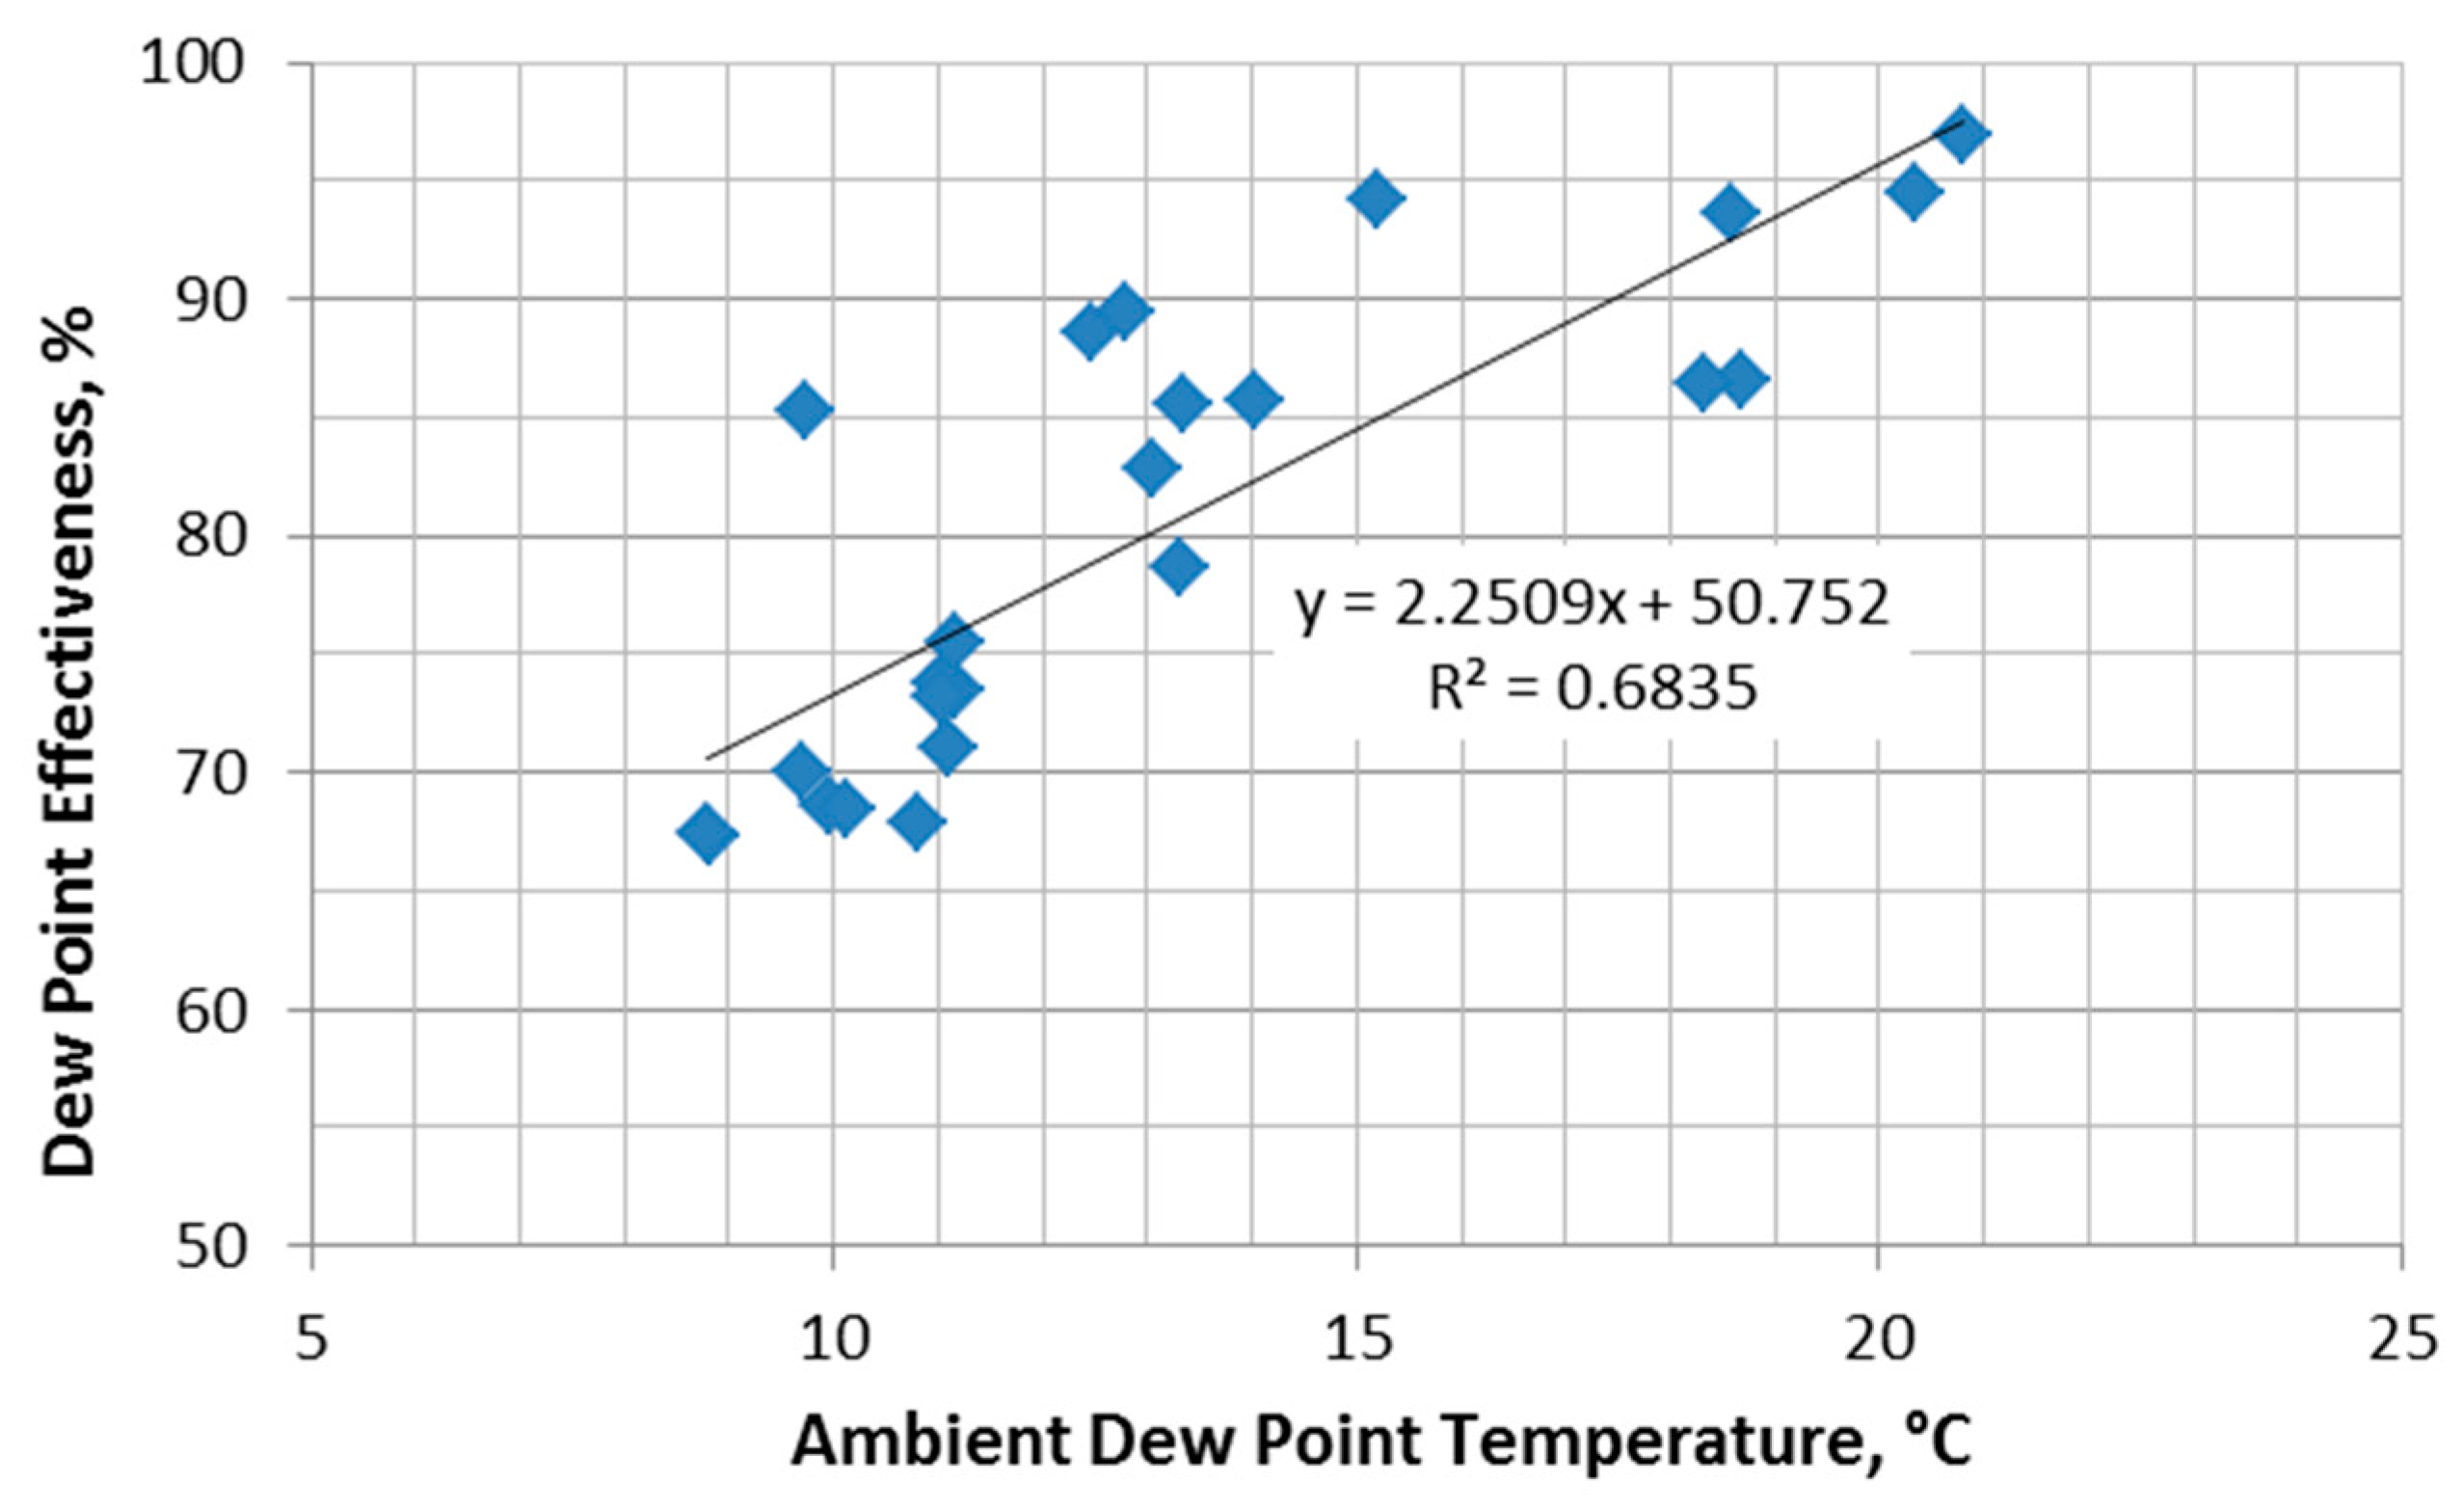
Figure 9 shows the DPC dew point effectiveness verses the ambient dew point temperature. As shown, the effectiveness ranges from 67% at a dew point temperature of 8.8 °C to 97% at a dew point temperature of 20.8 °C. Overall these values are consistent with the effectiveness values of previous DPC testing as reported earlier by Bruno [
24], except that at higher dew points the effectiveness approaches unity. The scatter is attributable to the different flow rates used, with lower flow rates resulting in improved effectiveness values.
This increase in effectiveness is of particular value as maximum effectiveness is achieved when the dew point approaches the condition where the CO2 reaches its critical temperature. This effect ensures the inlet temperature is as close as possible to the dew point, avoiding transcritical operation during periods of high moisture content.
For the purpose of the investigation presented in this paper, a dedicated empirical equation from the data in
Figure 8 was derived which included both the variables of the ambient condition and the condenser air mass flow rate. From the analysis of the DPC experimental data presented in
Figure 8, the condenser air inlet temperatures,
can be predicted using the following linear regression equation, with an error of less than 5%:
where
tdb is dry bulb temperature (°C), V is the air volume flow rate through the condenser (m
3·s
−1) and
W is humidity ratio of the ambient air, kg·kg dry air
−1.
5.3. Optimum Approach Temperature Difference
At higher condenser fan power, the temperature of the condenser approaches the inlet air temperature. For a constant evaporator temperature this has the effect of decreasing compressor power, as well as increasing fan power. Consequently, an optimum Approach Temperature Difference (ATD)—defined as the difference between the condensing temperature and the condenser air inlet temperature-occurs for a given set of ambient and load conditions regardless of whether the DPC is operating or not. To establish the optimum ATD for these cases, the power consumptions of fans, compressor and ancillary needed to be mathematically represented.
The total power consumption,
is the sum of the compressor power, fan power and ancillary power:
PANCIL includes the electrical control loads which were 0.72 kW when the DPC is on and 0.6 kW when the DPC is off. PCOMP is the compressors power.
The power consumption of the condenser and DPC extraction fans (PFAN) can be expressed in terms of volumetric flow rate.
5.3.1. Dew Point Cooler in Operation
The power consumption by the condenser,
PCOND-FAN and DPC exhaust fans,
PEXH-FAN are calculated based on the experimentally derived correlations as follows:
5.3.2. Dew Point Cooler Not in Operation
In Equations (4)–(7), n is the number of condenser fans, m is the number of DPC exhaust fans, and V is the flow rate through a single fan (m3 s−1).
The compressor power is predicted using normalised equations derived from Bitzer’s compressor’s data [
25].
The power of the compressors (PCOMP) can be calculated as follows.
For the subcritical condition, the normalised capacity and COP of the medium temperature (MT) compressors at 50 Hz can be evaluated as:
In Equations (8) and (9), Q50Hz-MT is the capacity of the medium temperature (MT) compressors at 50 Hz (kW), QRated-MT is the rated capacity of the MT compressors (kW), COP50Hz-MT is the COP of the medium temperature (MT) compressors at 50 Hz, and COPRated-MT is the rated COP of the MT compressors. The rated capacity and COP of the MT compressors are evaluated at evaporator temperature of −4 °C and condenser temperature of 25 °C.
The coefficients are derived from Bitzer’s 4FTC-30k [
25] compressor. As the equations are normalised, they can be applied to the same family of compressors with reasonable accuracy, and this has been verified using Bitzer compressor data sets.
Table 2 gives the coefficients
c0,
c1, …,
c9 for Equation (8) and coefficients
b0,
b1, …,
b9 for Equation (9).
In the flooded system, the bypass flash gas valve is not used for the subcritical condition and hence no performance degradation is observed.
The COP of the compressor depends also on the evaporator load. The load factor can be calculated as:
where
is the MT evaporator load.
The COP is calculated using the following regression equation derived from the 4FTC-30k compressor in normalised values:
where the values of the coefficients are as follows:
b0 = 0.4755,
b1 = 1.2011,
b2 = −0.9257, and
b3 = 0.2493.
The power for the compressor is then calculated as:
System COP is calculated as:
When the dew power cooler is on, the predicted power was compared with the measured power with the following measured input test conditions:
the evaporator temperature varied between −4 °C and −7 °C,
the ATD was varied between 7 °C and 13 °C with condenser temperature ranging from 20 °C to 27 °C.
The evaporator load ranged from 17 kW up to 22 kW.
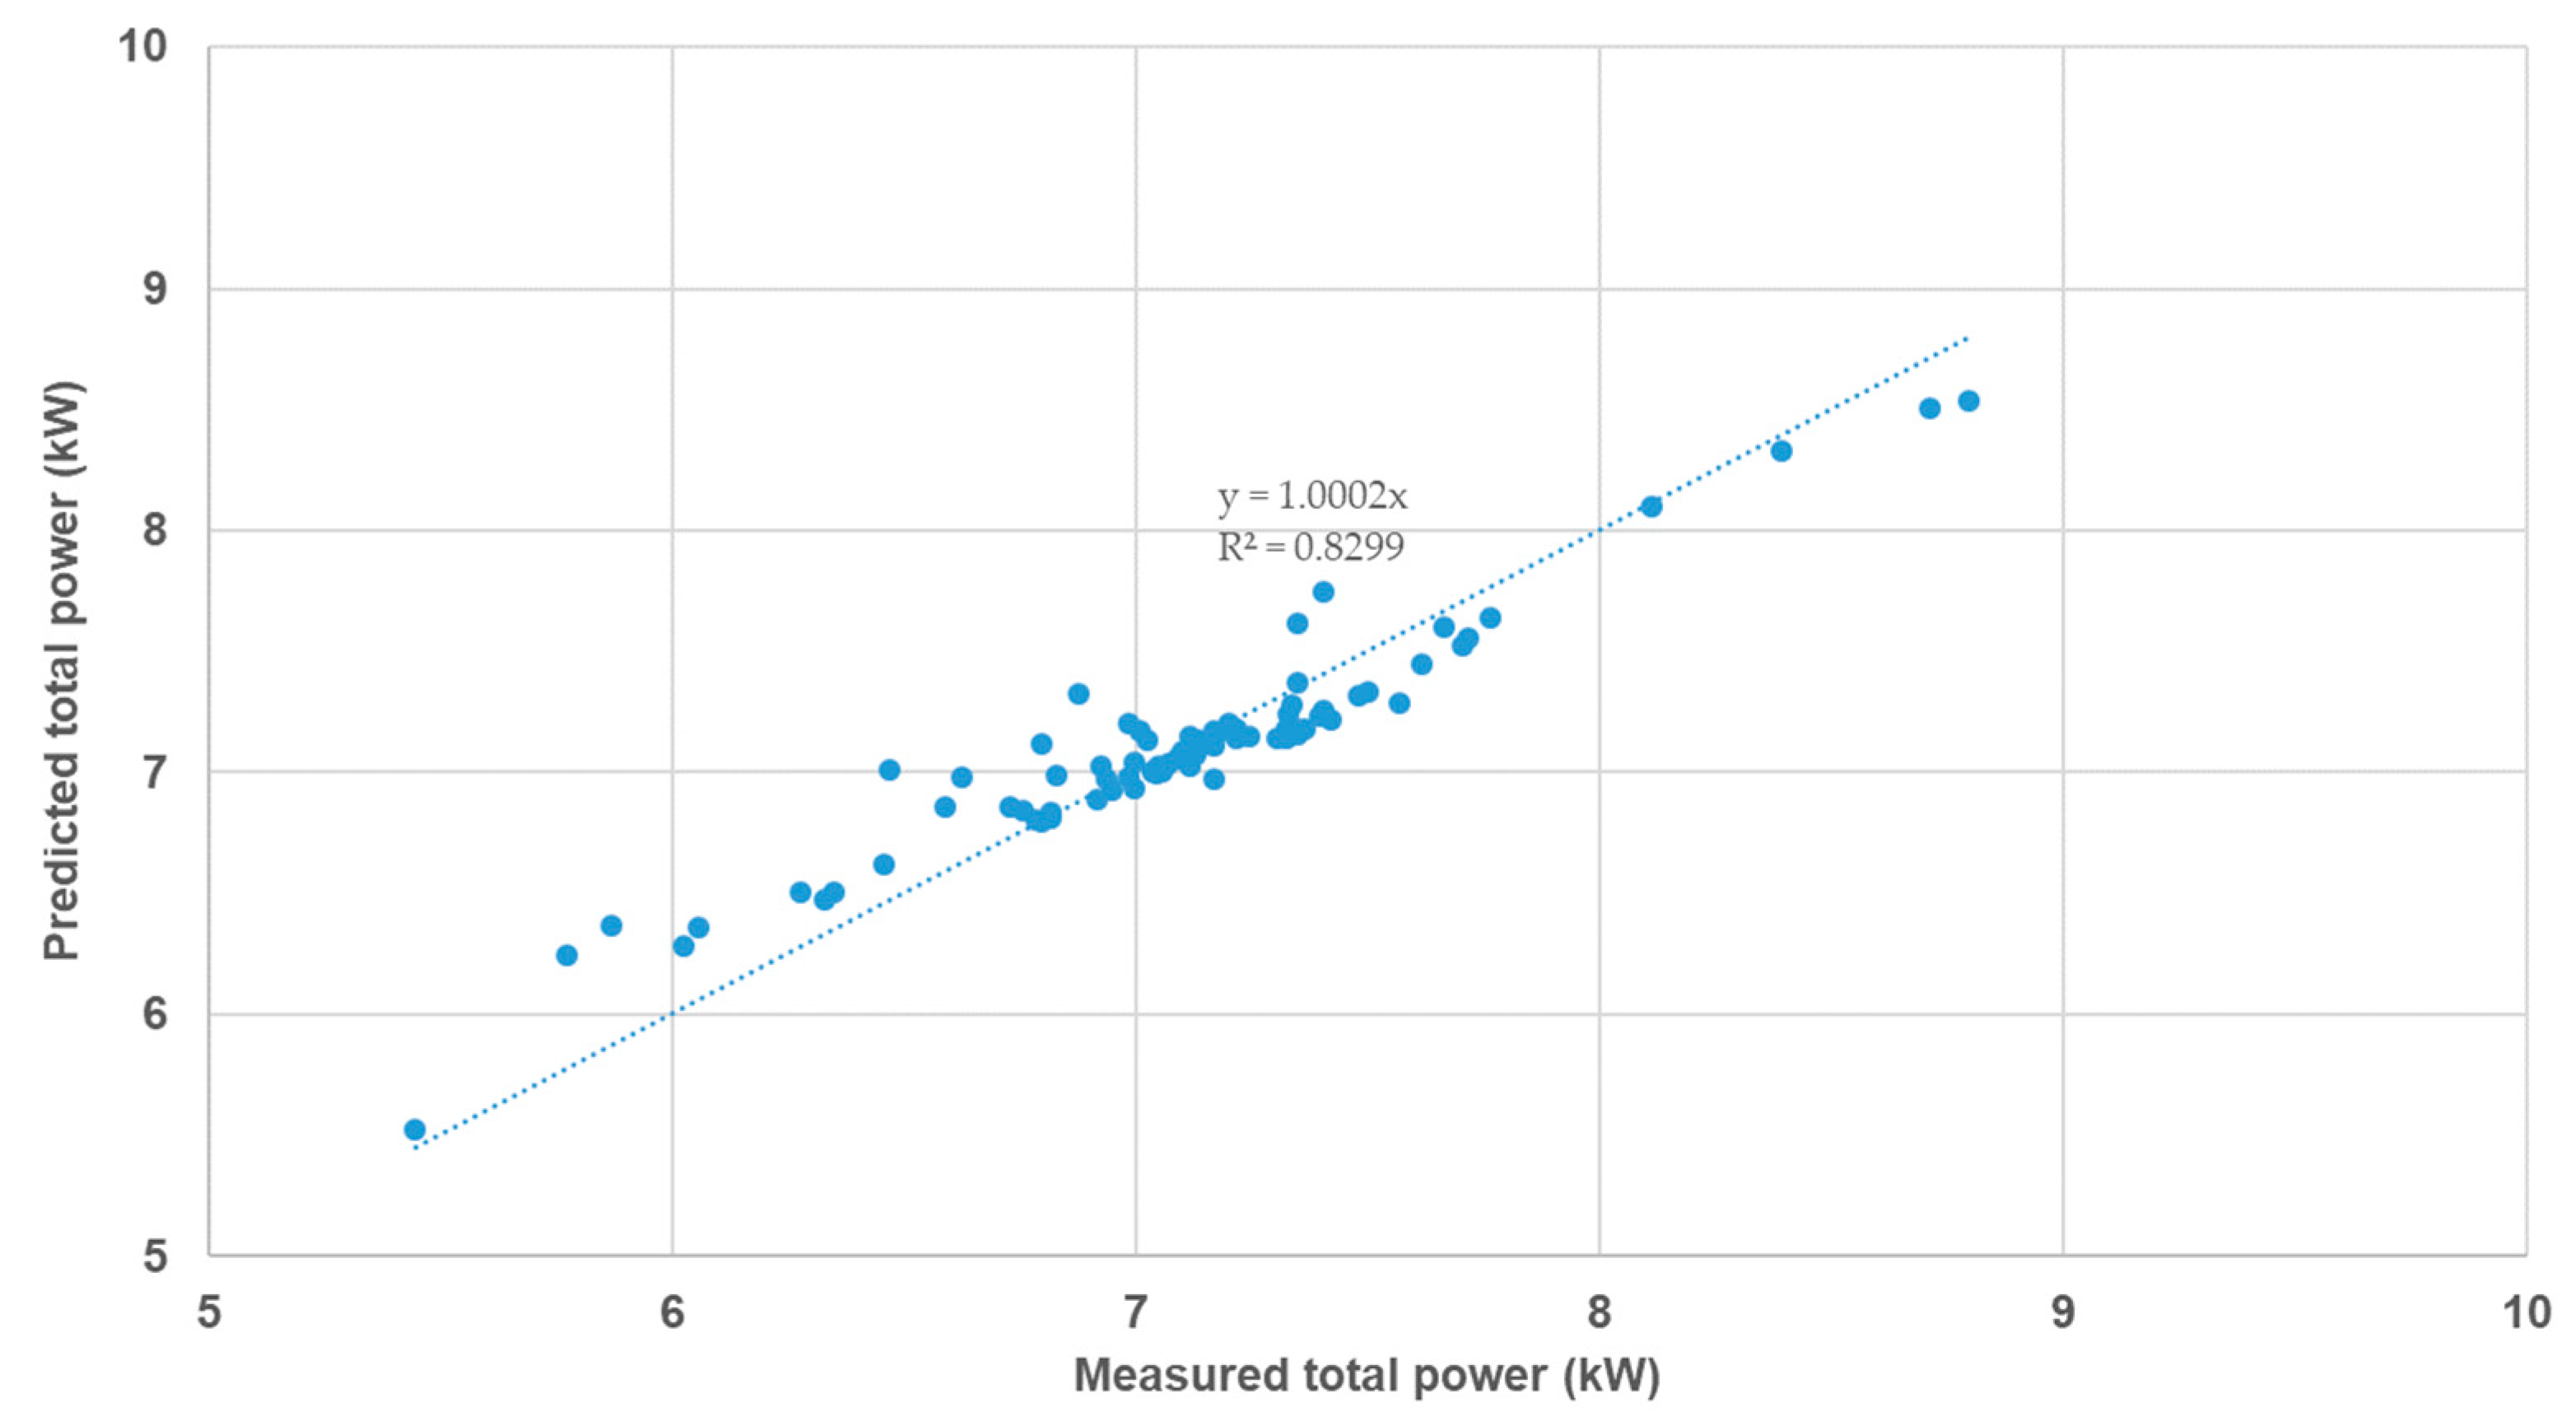
Figure 10 shows the comparison of the total predicted and measured powers, applying the relevant input test conditions. The predicted power is well correlated with the measured power.
To enable the DPC to perform optimally, the ATDs which minimise the overall power consumption were established. Using the validated model,
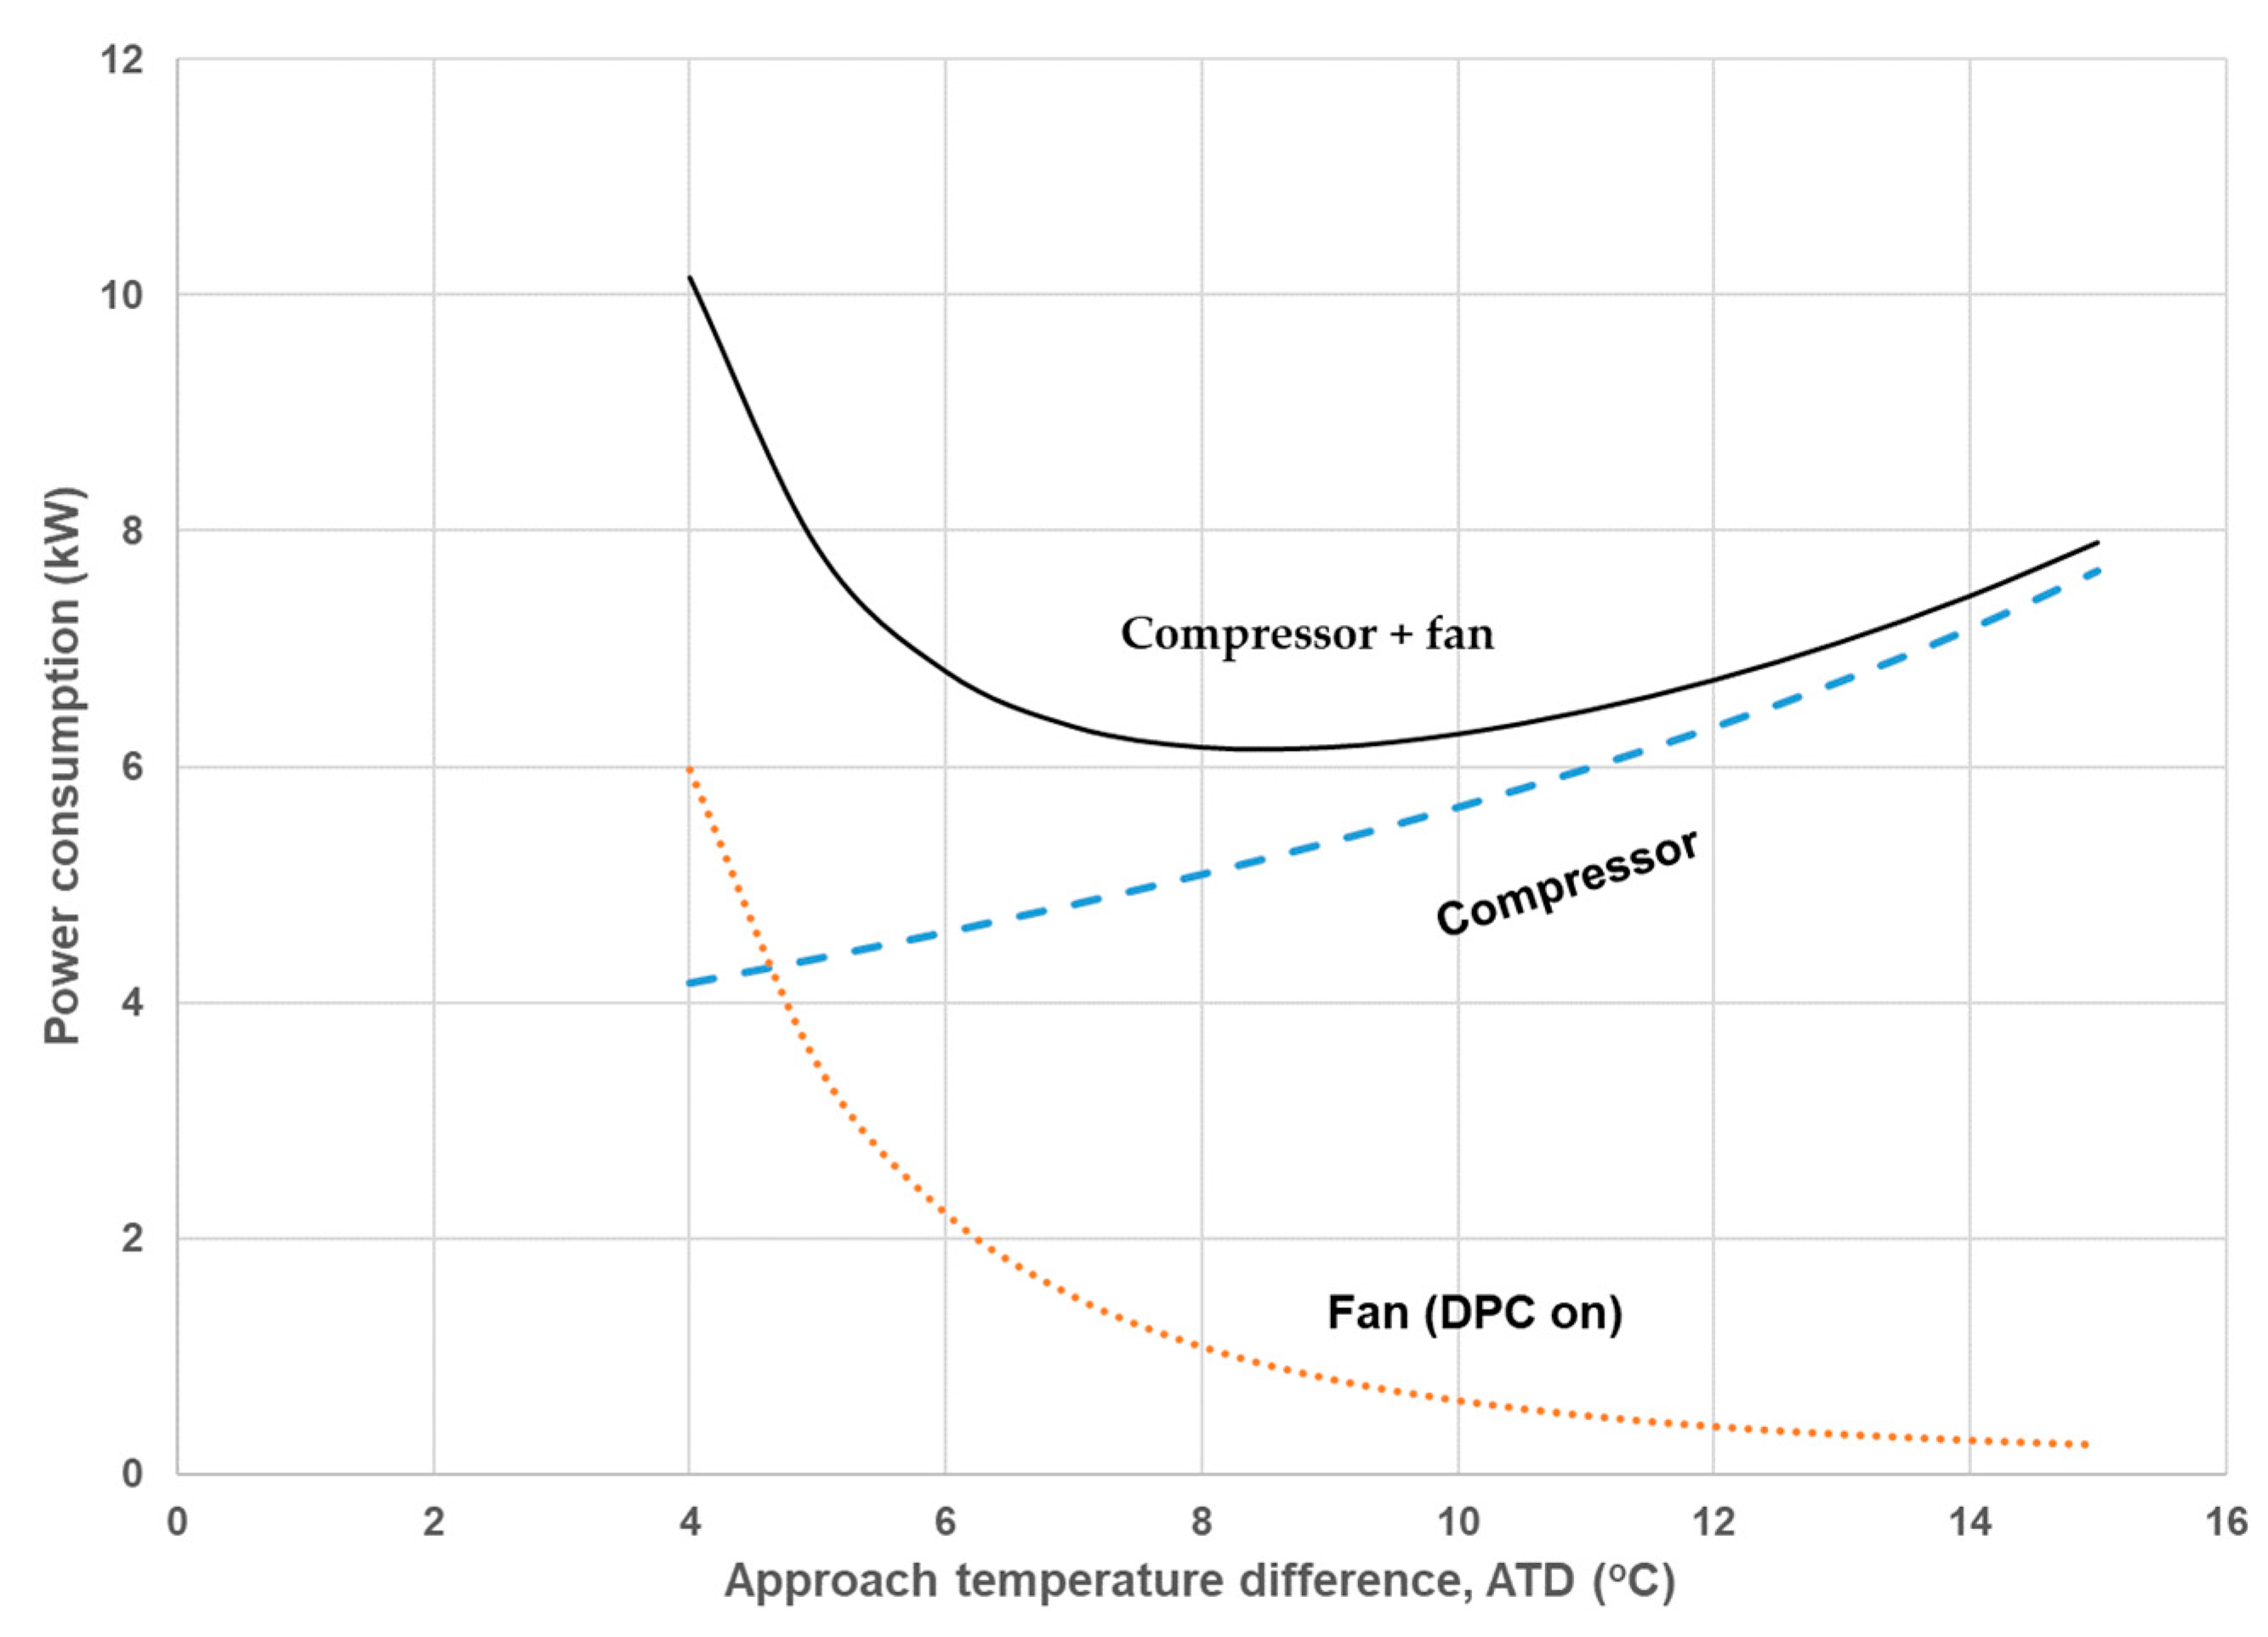
Figure 11 presents the fan, compressor and the combined compressor and fan power, to deliver a fixed cooling load of 21.5 kW, at various ATDs with constant condenser inlet air temperature of 14 °C and evaporator temperature of −5 °C. The figure shows how the compressor power decreases with lower ATD when the condensing temperature is reduced. It also shows that the corresponding fan power of the DPC increases with lower ATD. In an extreme case the fan power can even exceed the compressor power at a very low ATD, highlighting that fan power is a significant factor for this system. The figure also shows that there is an optimum ATD setting required for minimum power consumption to deliver a given load at given evaporator delivery temperature.
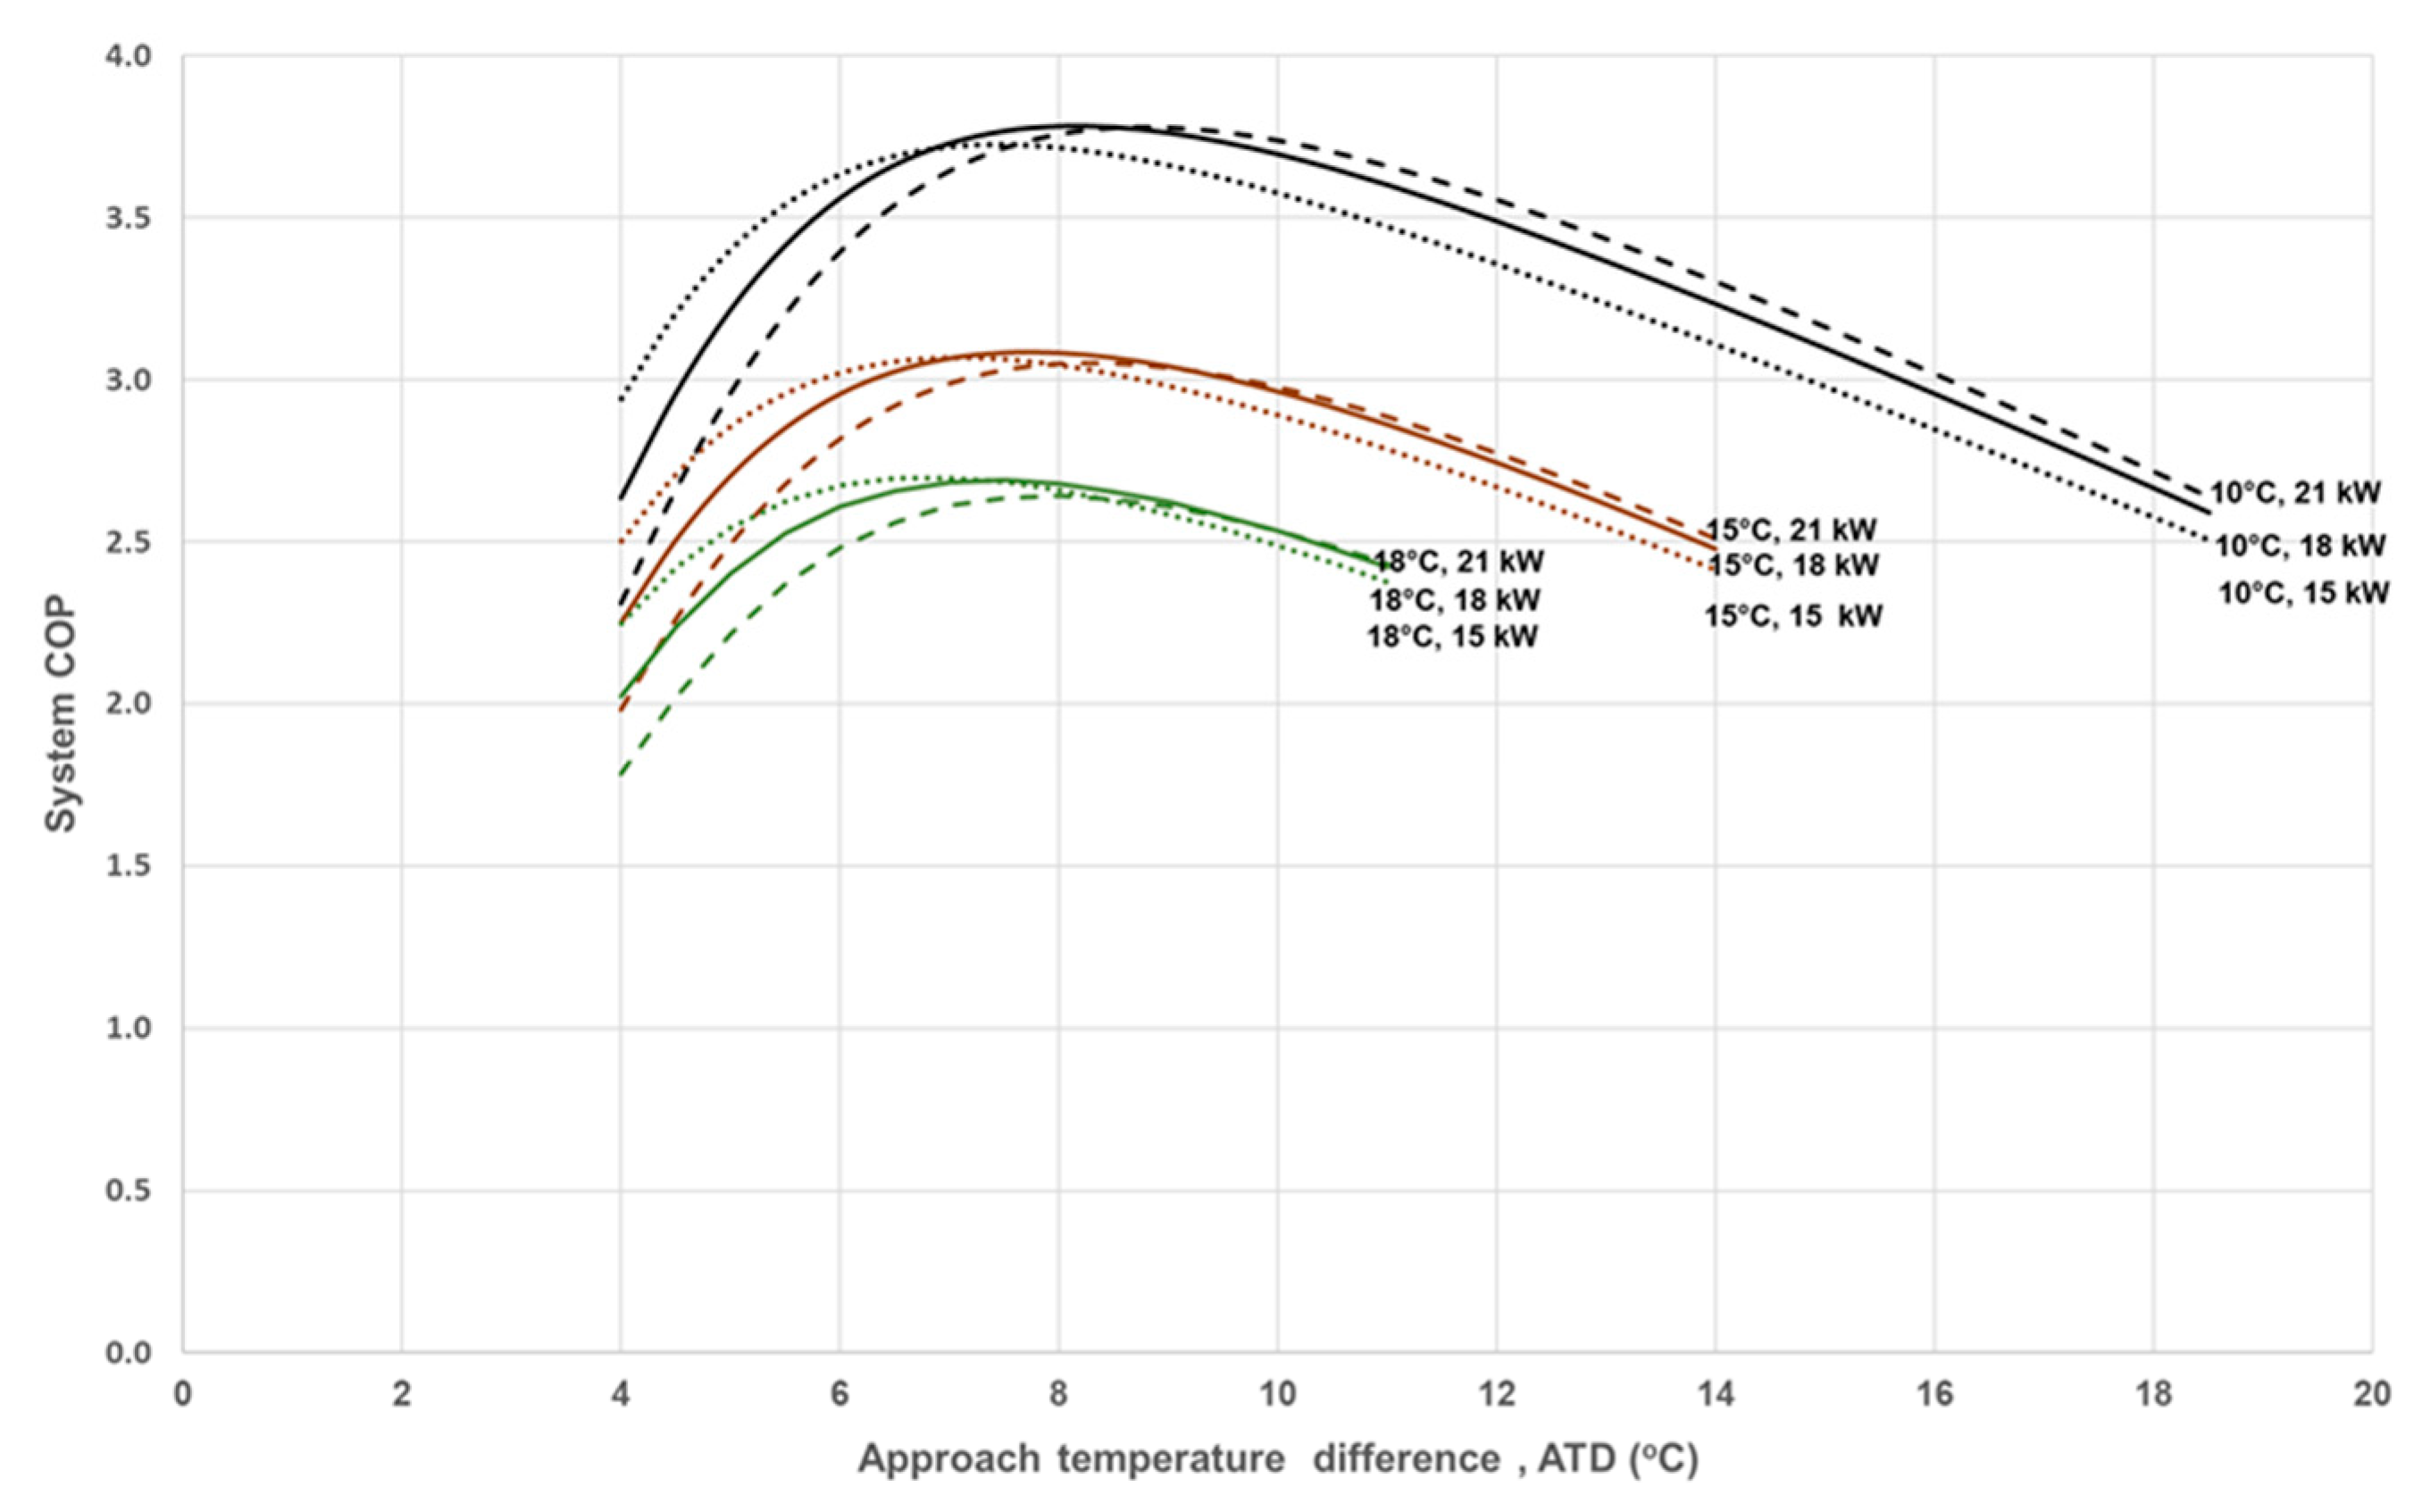
Using the model, the optimum ATD was investigated for a range of conditions with the DPC operating. At a given evaporator temperature of −5 °C, three evaporator load scenarios of 15 kW, 18 kW and 21 kW for three condenser inlet temperatures of 10 °C, 15 °C and 18 °C are considered. The system COP is calculated for varying ATD ranging between 4 °C and 19 °C in 0.5 °C increment for each combination (
Figure 12).
Consistent with
Figure 11, there exists an optimum ATD for each set of conditions. For a given load the optimum ATD increases with lower condenser air inlet temperature. At lower condenser air inlet temperature, by definition, the condenser temperature is lower, and therefore closer to the evaporator temperature. As a result, the COP is already high and therefore any further decrease in condenser temperature has a diminishing benefit, relative to the increase in fan power. For a given condenser air inlet temperature, the higher the evaporator load the higher is the optimum ATD. The condenser load increases as a result of higher evaporator load which requires a higher ATD to remove a larger amount of heat without increasing fan power. Overall an optimum ATD occurs for a given set of ambient and load conditions. The existence of an optimum ATD also applies to the cases where the DPC is not operating; in such a case, the fan power is significantly lower, as only the condenser fans are active.
The existence of such optimum points presented in
Figure 12 are consistent with previous findings [
28,
29] for transcritical operation. However, a significant observation from
Figure 12 is that the values of maximum COP are spread within a relatively narrow range of the condenser ATD of 7 to 9 K. This optimal range was found to apply to the allowable load conditions investigated, whether the DPC is on or off. This range enables the implementation of a simple real time control system that maximises the system percformance, a task which according to previous research [
30,
31,
32] is quite challenging.
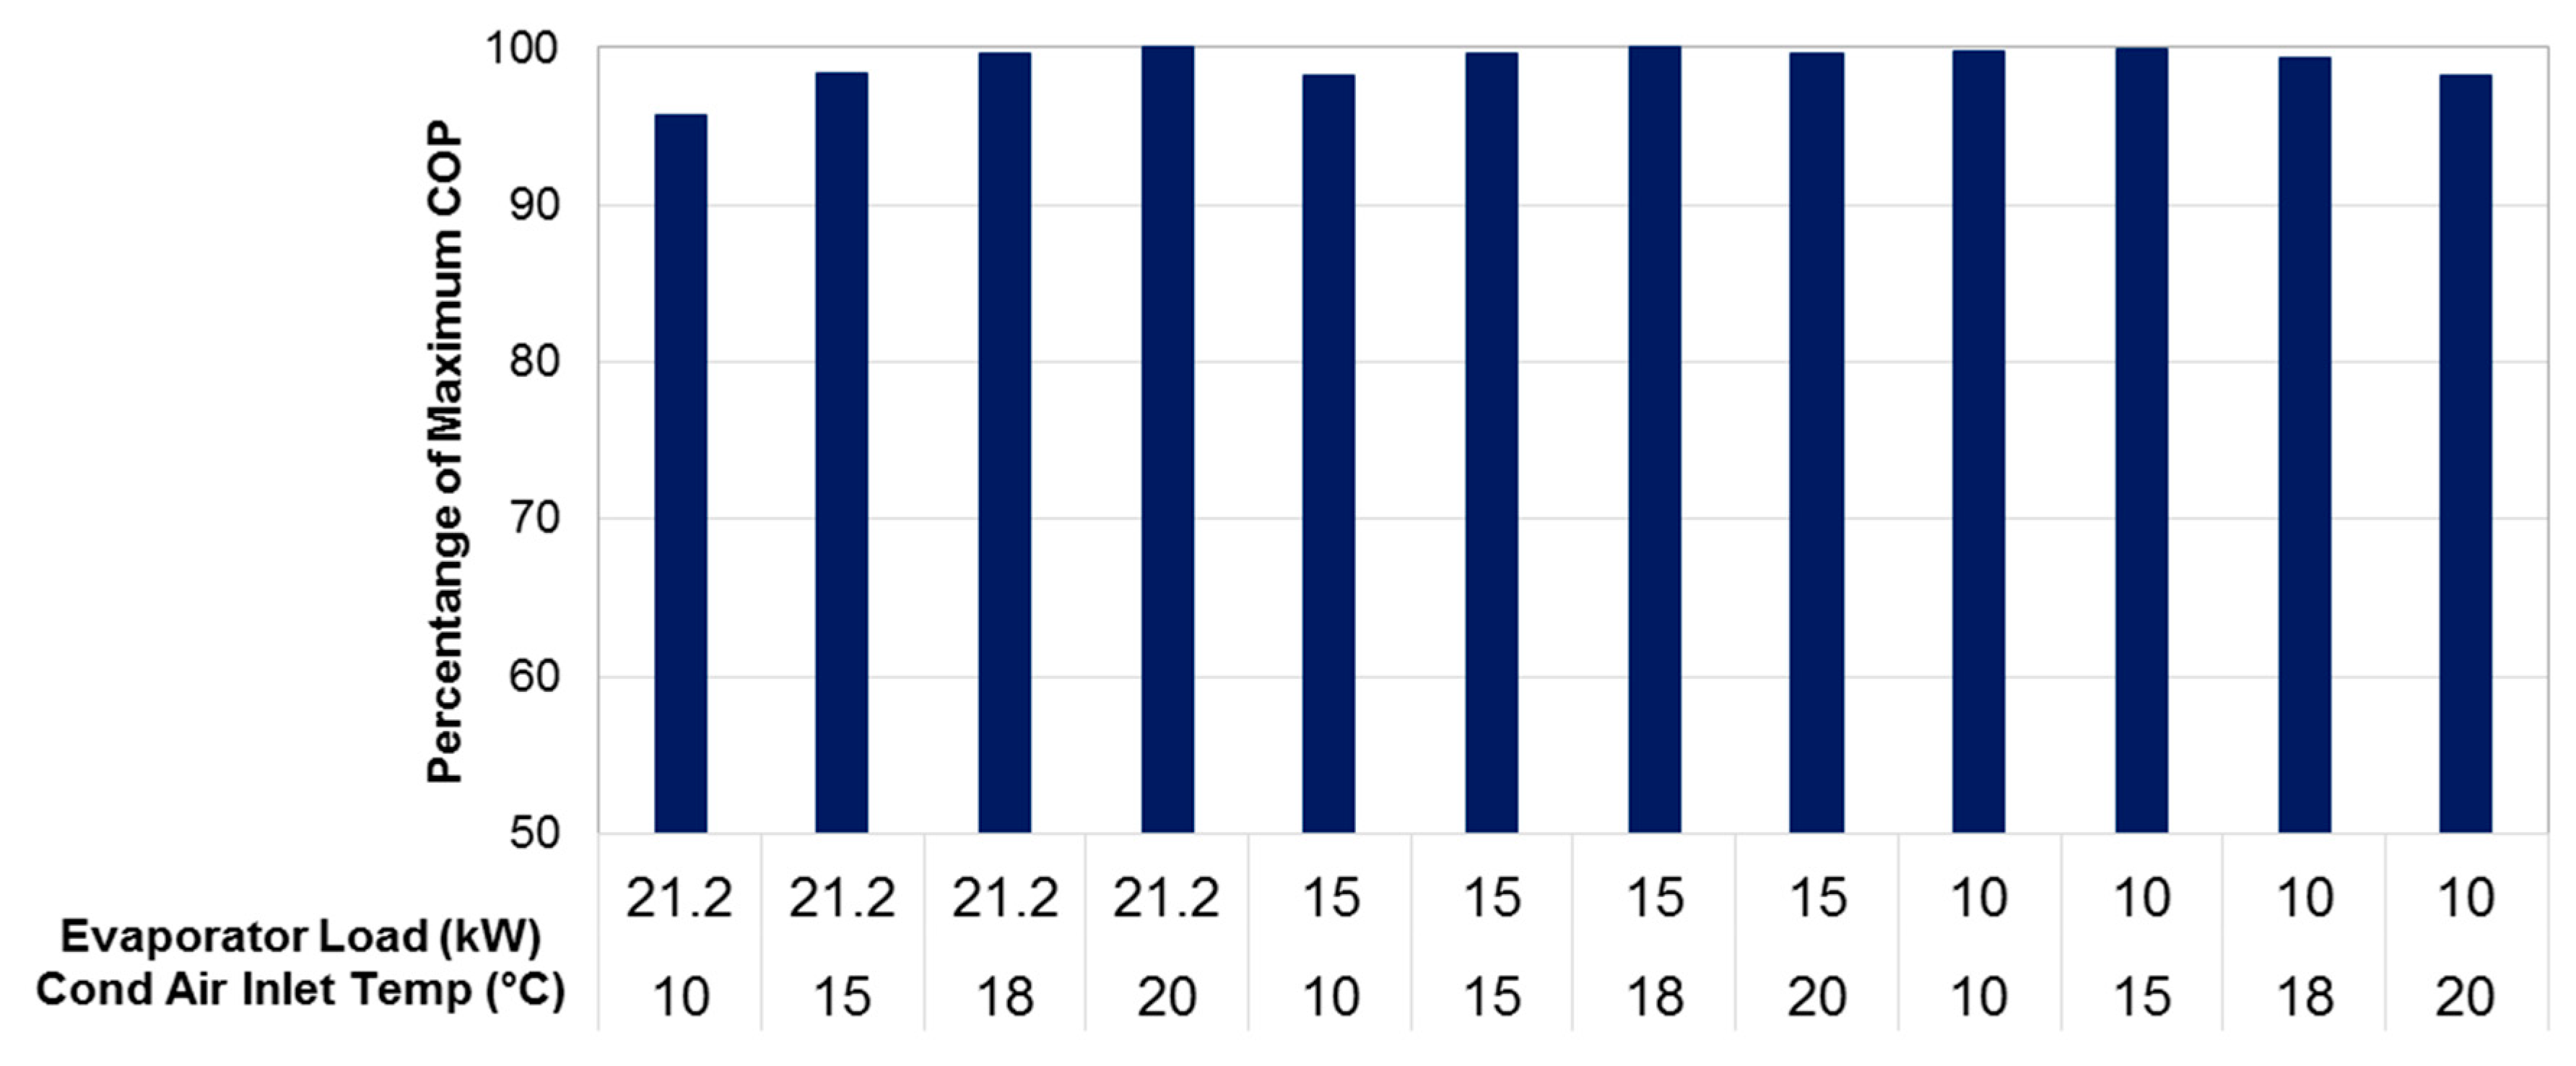
The narrow range of optimum condenser ATD paves the way for the development of a simpler control strategy that is still able to bring the system COP very close to the optimum values. Such an approach is demonstrated in
Figure 13, where a condenser ATD is fixed at 8 K. As shown, the resulting COP values are very close to the maximum COP for all the conditions and loads covered in
Figure 12.
5.4. Operating Modes of the DPC-Enhanced CO2 System
Using Equations 2 to 7, it is possible to evaluate the system operating modes which gives COP values closer to optimum for a range of DB and moisture content conditions.
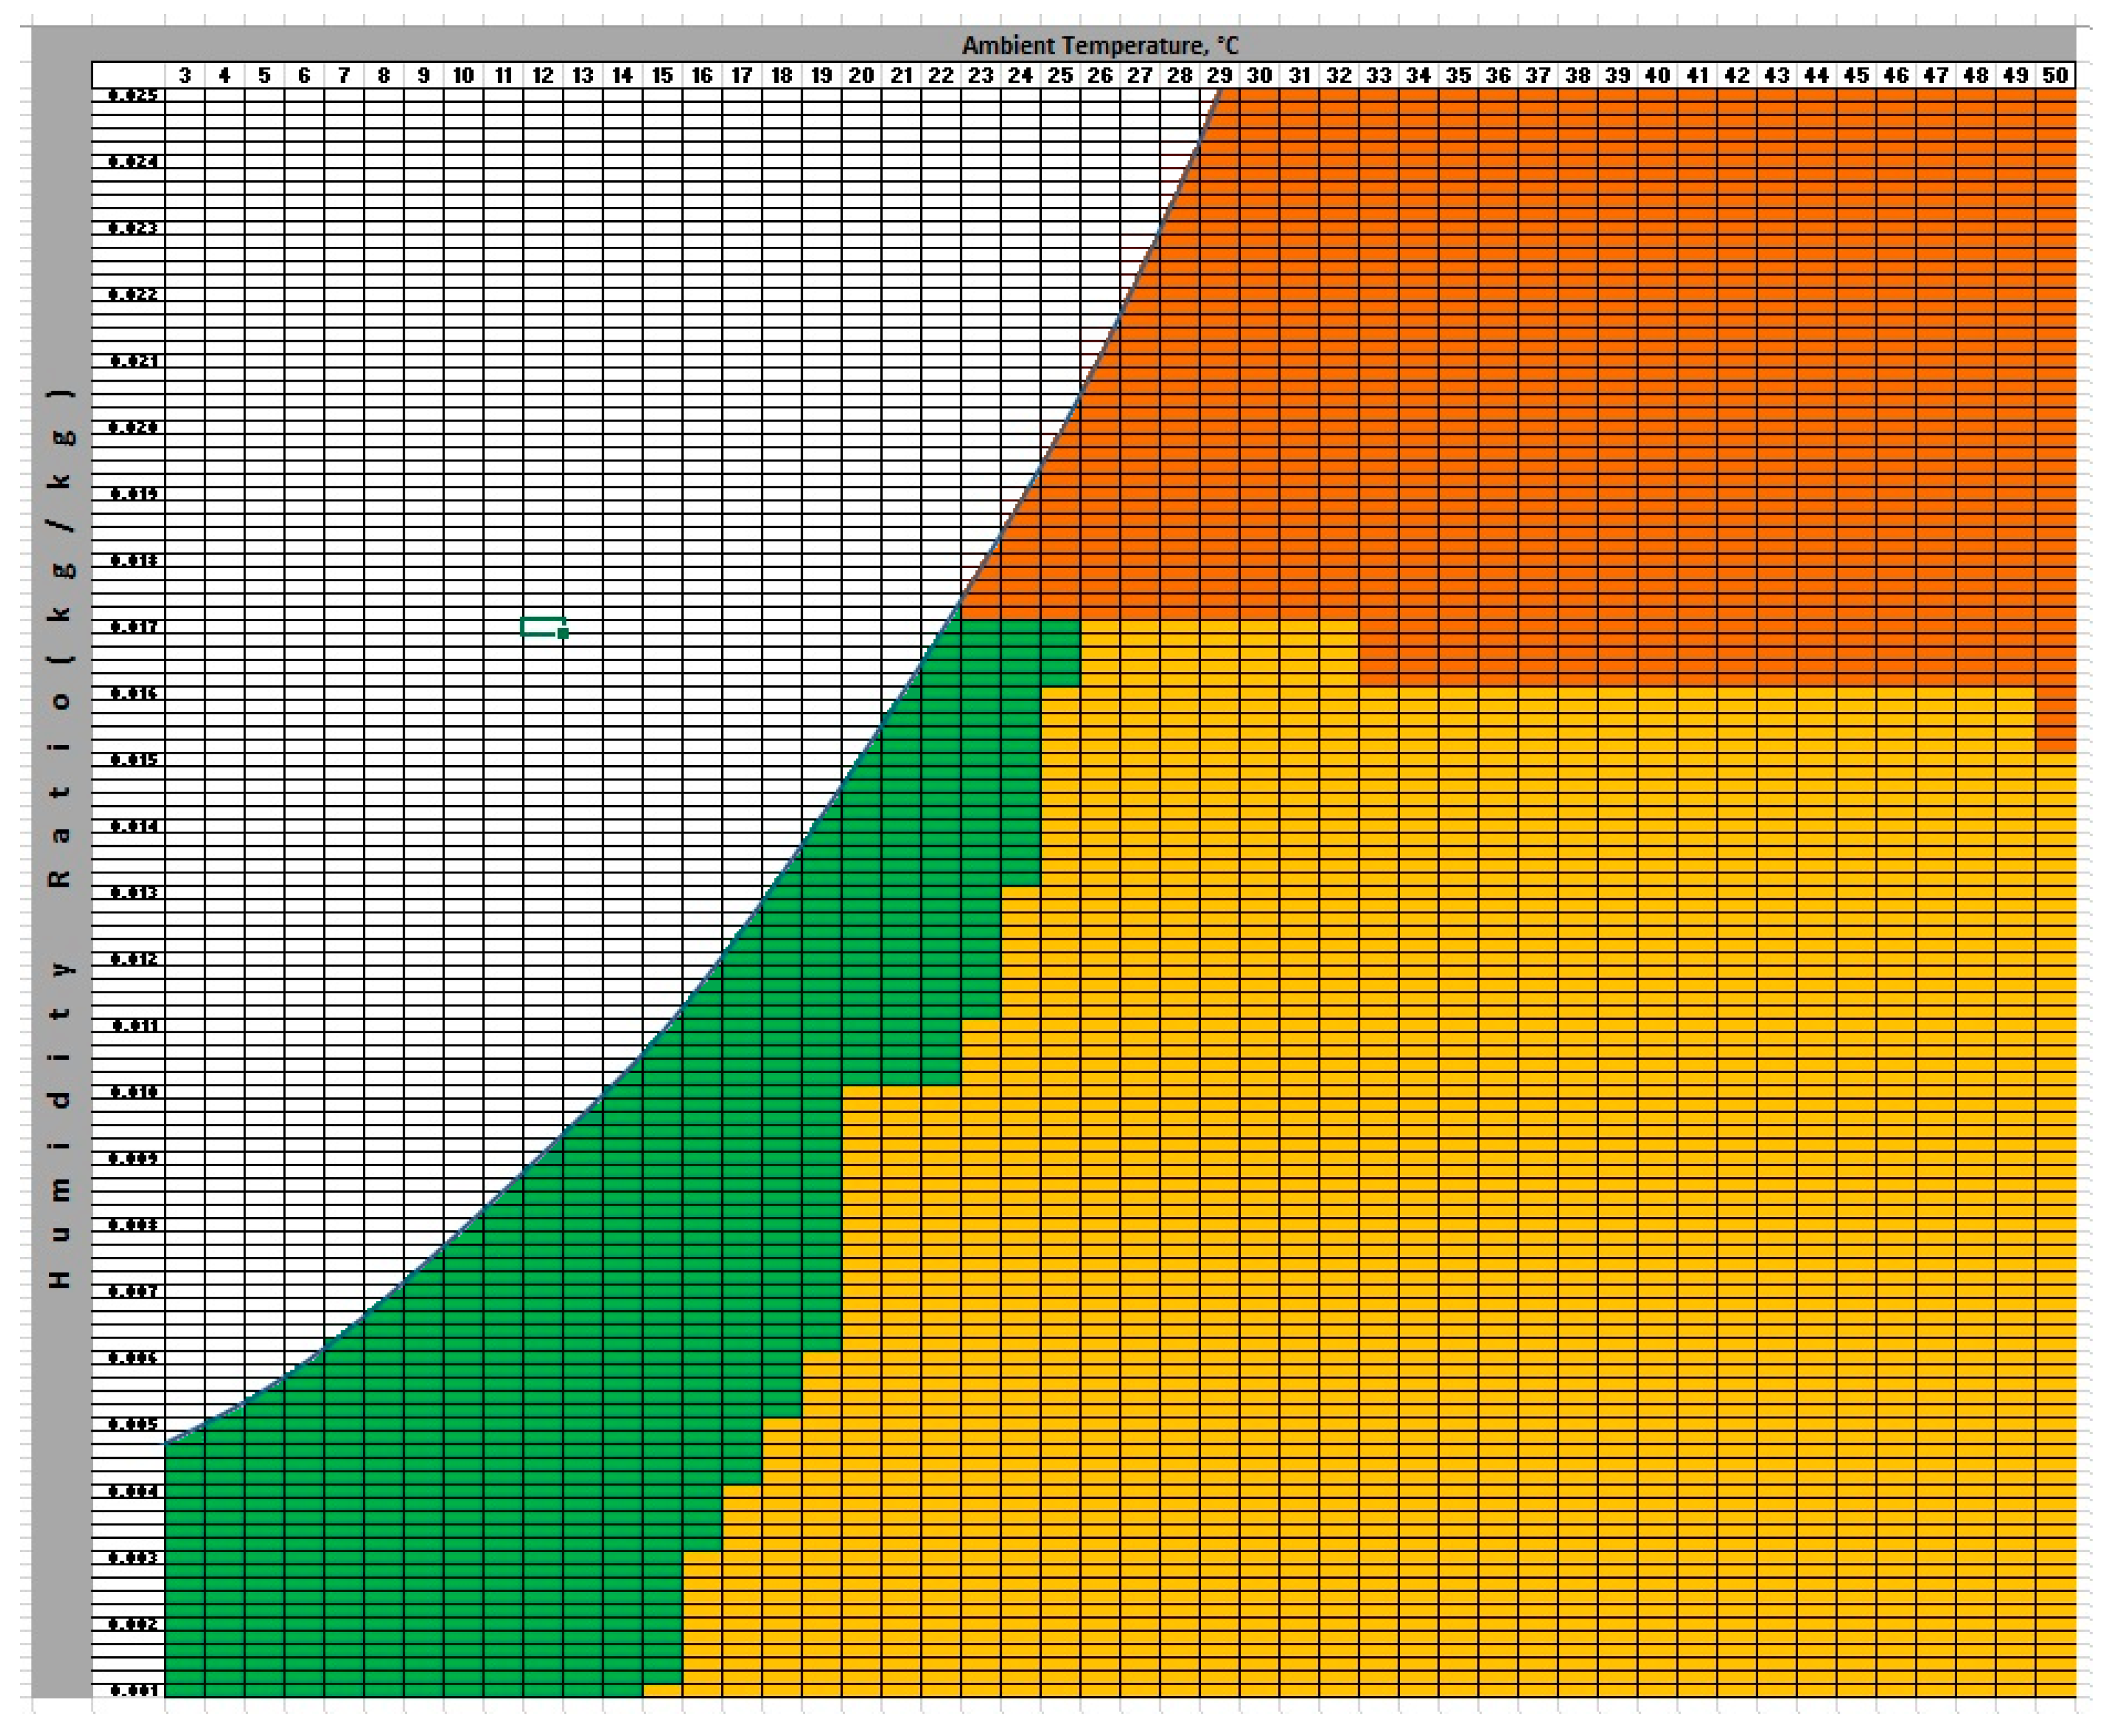
Figure 14 presents these operating modes applied to the conditions presented in the psychometric chart of
Figure 8. These are: (1) subcritical mode when the DPC is not running (mode 1—green zone), (2) subcritical mode when the DPC is running (mode 2—yellow zone), and (3) transcritical mode (mode 3—orange zone). To determine the relative merit of operating in transcritical mode, Equations (24) and (25) were used for compressor power.
The green zone (Mode 1) is the area where the temperature is too low or the humidity is too high. This corresponds to cool conditions whereby the additional fan power required to run the DPC is not compensated by the resulting decrease in the compressor power. The yellow area (Mode 2) shows the favourable combination of ambient temperature and humidity for the DPC to operate. This corresponds to warm to hot climates whereby operating the DPC results in significant system COP improvement. The orange area (Mode 3) is the transcritical mode where the CO2 gas is cooled by the condenser fans, normally called the gas cooler. This corresponds to the system operating in hot tropical climates. Future work based on additional experimental data sets will optimise the shared boundaries between the operating modes.
6. Application of the DPC Precool Technology to a CO2 Booster System—A Case Study
To demonstrate the potential performance improvement of a CO
2 system using the DPC, a system COP of a combined fridge/freezer booster system was analysed applicable to Adelaide, Australia, a mild temperature climate, considering a conventional CO
2 booster system and the novel system presented in this study. A typical configuration involving a constant low temperature (LT) load of 50 kW and medium temperature (MT) load of 150 kW has been modelled. The system operates at evaporating temperatures of −28 °C (LT) and −4 °C (MT), respectively, and was subject to varying ambient conditions representing subcritical and transcritical operations. The system operates at the optimum condenser ATD of 8 K. The system COP is defined by the following equation:
In this case the total power,
is defined as:
is the LT evaporator load.
The LT compressor power (
is calculated using the following procedure. The capacity and COP of the LT compressors at 50 Hz can be evaluated as follows if they are operated as stand-alone systems.
The coefficients are derived from Bitzer’s 2ESL-4K compressor [
25]. The values of the coefficients of Equations (16) and (17) are provided in
Table 3. As these equations are normalised, they can be applied to the same family of compressors with reasonable accuracy, which has been verified. The rated capacity,
and COP,
of the LT compressors are evaluated at the evaporator temperature of −28°C and condenser temperature of −1 °C.
To predict the cooling capacity (
Q50Hz-BLT) and the coefficient of performance (
COP50Hz-BLT) of LT compressors of the CO
2 booster system at 50 Hz, it has been found that the change in the values have a linear relationship with the difference between saturation temperature at intermediate pressure and MT evaporator temperature,
, when the flash gas bypass valve is on.
In Equations (18) and (19), Tsat@Pint is the saturation temperature at intermediate pressure (°C) whilst the values of the coefficients are as follows: c0 = 0.9731, c1 = −0.0087, b0 = 0.9749, and b1 = −0.0087.
The COP of the LT compressor,
COPBLT, also depends on freezer load. The load factor,
can be calculated as:
The COP is calculated using the following regression equation derived from the 2ESL-4K compressor in a normalised values:
where the values of the coefficients are as follows:
c0 = 0.3053,
c1 = 1.6434,
c2 = −1.2327, and
c3 = 0.2845.
The LT compressor power can be calculated as:
The MT cooling load will be:
The MT compressor power is predicted as
The booster COP for MT subsystem, is calculated using Equation (11) for subcritical operation.
For the case of transcritical operation, a correction is required for the booster system, as the flash bypass valve is on.
The capacity,
Q50HZ-MT and COP,
of the MT compressors at 50 Hz as a standalone system for transcritical operation can be evaluated as:
The gas outlet temperature from the gas cooler,
can be predicted as
where
Ta is the gas cooler inlet air temperature. C is a constant and depends on the gas cooler design, and it is recommended to be 1 to 3 K. In this paper, C is chosen to be 1 K. The rated capacity,
and rated COP,
are evaluated at the evaporator temperature of −4 °C and gas cooler outlet temperature of 30 °C.
The values of the coefficients of Equations (24) and (25) are provided in
Table 4. The coefficients are derived from Bitzer’s 4FTC-30k compressor [
25].
To predict the capacity and COP for MT compressors of the CO
2–booster system at 50 Hz, it has been found that the normalised change in the values from Equations (24) and (25) have a linear relationship with the normalised temperature difference, defined as
.
where the values of the coefficients are as follows:
c0 = 0.9108,
c1 = 0.0874,
b0 = 0.9181, and
b1 = 0.0893.
The COP of the MT compressor in transcritical operation also depends on the total cooling load. The load factor can be calculated as:
The COP is calculated using the following regression equation derived from 4FTC-30k compressor in normalised values.
The values of the coefficients in Equation (31) are: b0 = 0.4909, b1 = 1.184, b2 = −0.9259, and b3 = 0.2517.
The above empirical equations are used to predict the COP of the system at different ambient air temperatures ranging from 5 °C up to 45 °C. Parallel LT (ESL-4K) and MT (FTC-30K) compressors with a variable speed drive are considered to be used. The analysis shows that 6 MT compressors and 4 LT compressors are needed for the conventional system while 4 MT compressors and 4 LT compressors are needed for the novel CO2 system to meet the specified loads.
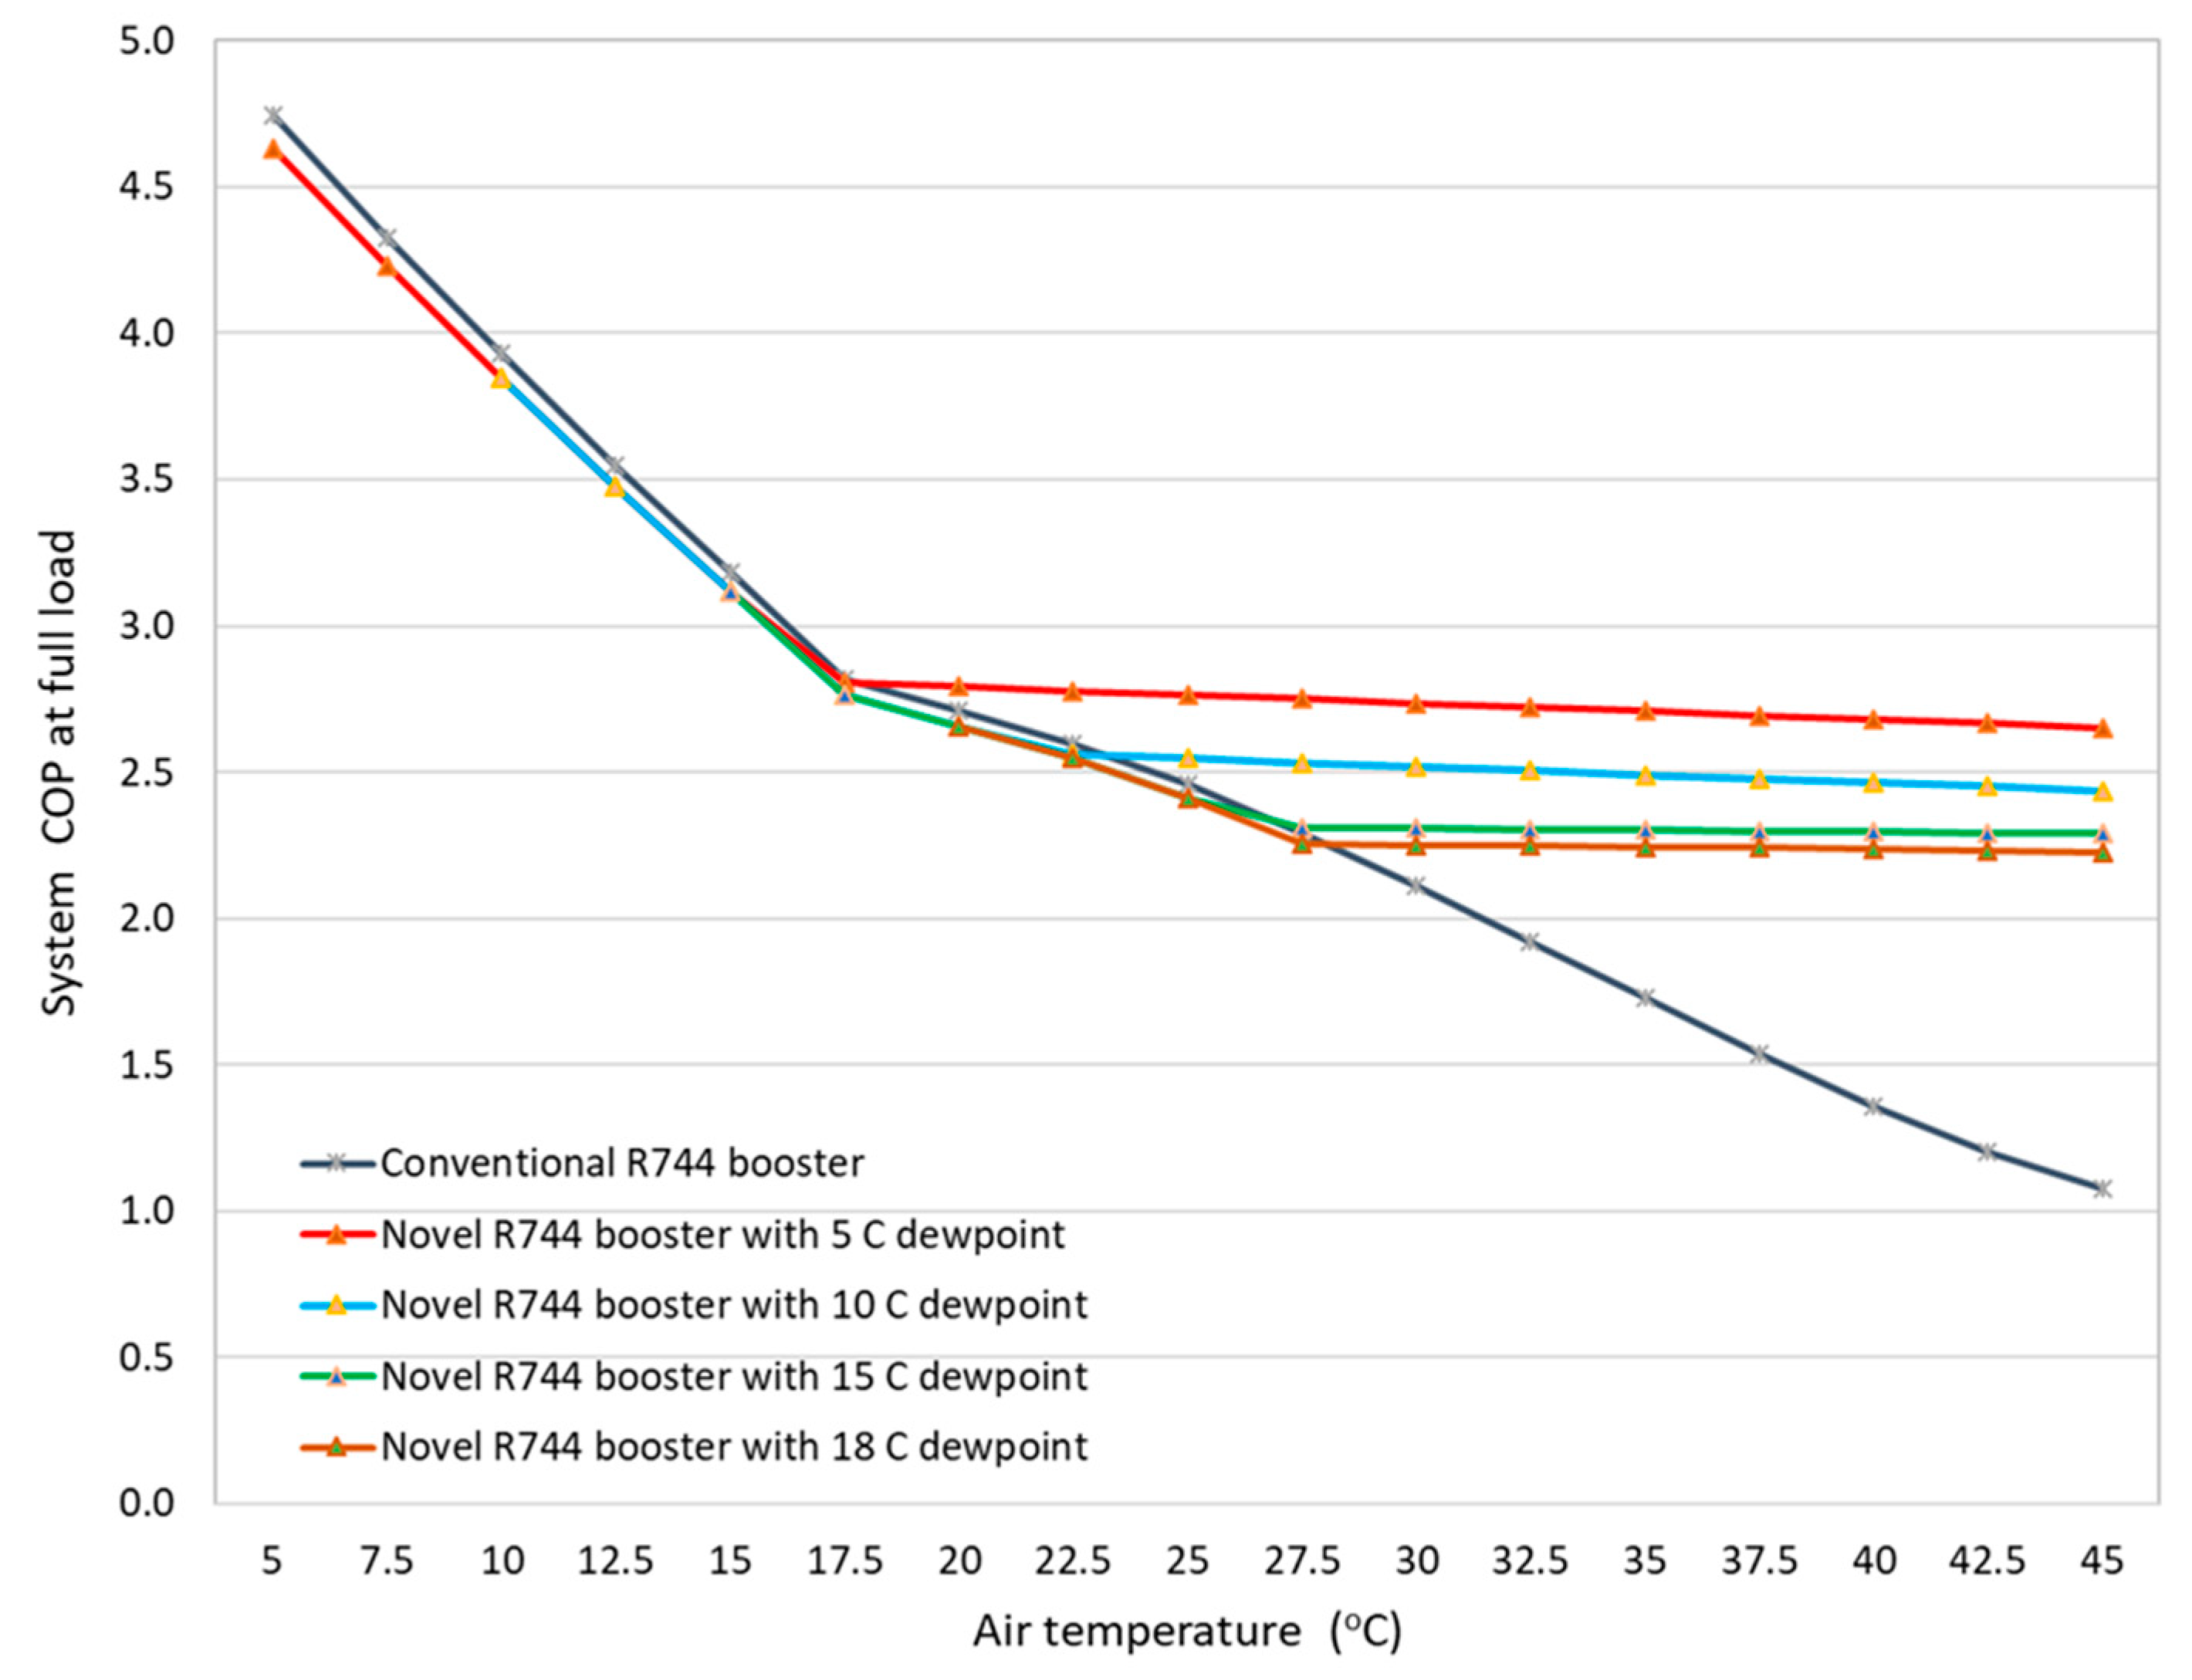
Figure 15 shows the system COP vs ambient air temperature when operating without the DPC (“conventional R744 booster”) and when the DPC precools the air at various dew point temperatures before entering the condenser (novel R744 system). In
Figure 15, the resulting condenser air inlet temperatures when the DPC is operating can be found using Equation (2),
Section 4.
At very low air temperatures (5–17.5 °C), the DPC is off, consistent with the green zone in
Figure 14. Consequently, the COP of the system running the DPC at these conditions is lower than that for the system without DPC. The slight decrease in COP at these conditions reflect the higher fan power due to the presence of the DPC even with it being off.
As the ambient temperature increases, the impact of the DPC precooling on the system COP becomes significant. For instance, at an ambient air temperature of 32.5 °C and low dew point temperature of 5 °C, the DPC precooling improves the system COP by 40.6% compared to the conventional system. In the 40 °C to 45 °C dry bulb temperature range and at 10 °C dew point temperature, the design condition in Adelaide during peak summer months, the conventional system operates with a COP of just above 1, while the novel system operates with a COP of 2.4.
One of the distinctive features of the DPC precool technology demonstrated in
Figure 15 is it’s near constant COP with increasing ambient temperature consistent in hot climates. Consequently, the DPC precooling technology overcomes the poor performance of regular CO
2 systems dramatically reducing the number of hours operating in transcritical modes.
In order to explore the annual energy efficiency impact of the DPC, an analysis was conducted for Adelaide, Australia, using the validated model. The refrigeration system was modelled in conjunction with a cold storage load. The load was modelled based on the transmission load only, through the cold room such that at the temperature of 43.7 °C, the peak load matched the design MT load of 150 kW and LT load of 50 kW. The typical meteorological year for Adelaide was used.
Table 5 presents the annual electricity consumption of both systems and the corresponding savings. It highlights how the number of hours per year the system runs in transcritical mode reduces from 3278 to 27. The annual and peak electricity savings of 16% and 47%, respectively, were determined. Both of these savings have significant implications for the electricity costs associated with refrigeration as both energy and peak demand are reduced.


