Article

Numerical Simulation and Experimental Investigation of Diesel Fuel Reforming over a Pt/CeO2-Al2O3 Catalyst

1
School of Energy and Power Engineering, Wuhan University of Technology, Wuhan 430063, China
2
School of Physical Education, Jianghan University, Wuhan 430056, China
3
Department of Mechanical Engineering, University of Birmingham, Birmingham B15 2TT, UK
*
Authors to whom correspondence should be addressed.
Energies 2019, 12(6), 1056; https://doi.org/10.3390/en12061056
Submission received: 24 February 2019 / Revised: 10 March 2019 / Accepted: 14 March 2019 / Published: 19 March 2019
(This article belongs to the Special Issue Sustainable Hydrogen Production, Storage and Utilization)

Abstract

:
In order to benefit from a realistic hydrogen production device equipped on a vehicle, issues with the effects of the process parameters on H2 and CO yield need to be resolved. In this study, a reduced mechanism for n-heptane (as a surrogate diesel) reforming over a Pt/CeO2-Al2O3 catalyst is adopted to investigate the effects of the process parameters on H2 and CO yield, and the preferred process parameters are concluded. In addition, the comparison of reforming bench tests of diesel fuel and n-heptane under typical diesel engine operating conditions is conducted. The n-heptane reforming simulation results show that the maximum H2 and CO yield moves toward unity with the decreased GHSV and increased reaction temperature, and the GHSV of 10,000 1/h, O2/C ratio of 0.6 and reaction temperature of 500 °C is preferable. The contrast experiments reveal that the change trend of H2 and CO yield displays consistence, although the difference of the average H2 and CO yield results is obvious. The characteristics of n-heptane reforming can represent H2 and CO yield features of diesel fuel reforming at typical reaction temperatures in a way.

1. Introduction

Hydrogen as an additive to fossil fuel can improve the thermal efficiency and reduce the harmful tailpipe emissions of engines [1,2]. A special device equipped on a vehicle, using hydrogen fuel as an additive, that can produce hydrogen from various kinds of hydrocarbons is required, and the reaction process of hydrogen production is called fuel reforming [3]. As reported in the previous literature, the methods of fuel reforming mainly include steam reforming (SR), autothermal reforming (ATR), partial oxidation reforming (POX) and water gas shift reaction (WGSR) [4]. The on-board hydrogen production devices must satisfy many requirements such as efficiency, weight, compactness, cost and simple plant displacement [5,6,7,8,9,10,11,12]. In view of the compactness and modification cost of the fuel supply system, the on-board diesel reforming devices equipped on a vehicles are considered as a feasible technique at present.
Commercial diesel fuel is mainly composed of high-molecular-weight hydrocarbons, with carbon numbers ranging from approximately C7 to C20 [13,14]. Due to the complicated properties of diesel fuel and the cost of numerical simulations to deal with numerous components in modelling and the subsequent chemical reaction processes of diesel fuel reforming, most previous studies model the problems by representing diesel with a primary reference fuel, i.e., n-heptane and iso-octane, as an approximation [15,16,17,18]. In addition, an appropriate catalyst is essential in order to achieve high conversions and product selectivity in diesel fuel reforming [19,20,21]. Among the additives with different activity discussed in the published literatures, CeO2 remains an outstanding choice due to its high oxygen storage capacity and the oxidation/reduction reversibility of active metals, providing assistance in coke elimination [22,23,24,25]. However, few studies on the catalytic reforming mechanism of n-heptane and the effect of process parameter optimization on the hydrogen yield, especially for on-board reforming devices under typical engine running conditions, has been conducted until now. For example, Hamoule et al. [26] investigated the catalytic activities of Pt catalysts supported on Al-HMS for the n-heptane reforming reaction. Abashar [27] discussed the simultaneous hydrogen production from the catalytic reforming of n-heptane in circulating fast fluidized bed reactors. The results implied that the increase of the temperature might have adverse effects on the optimal H2/CO ratio. Gonzalez-Marcos et al. [28] investigated an industrial characterisation method for naphtha reforming bimetallic Pt-Sn/Al2O3 catalysts through n-heptane reforming test reactions. The research showed that n-heptane reforming was a useful test reaction to characterise Pt-Sn/Al2O3 catalysts and could be used for the evaluation of naphtha reforming catalysts. Whether the n-heptane reforming can also represent the features of diesel fuel reforming at typical reaction temperature is unknown and how different are the H2 and CO yield (vol.%) between n-heptane reforming and diesel fuel reforming are questions that remain unresolved. In order to benefit from an efficient and realistic hydrogen production device equipped on a vehicle, issues with the effects of the process parameters and the key species concentrations of hydrogen to individual reaction steps for n-heptane reforming under typical diesel engine operating conditions need to be resolved. All these factors would stimulate the research to develop cost-effective technologies for efficient on-board production of hydrogen as an addition to the fossil fuels utilized on internal combustion engines.
In this study, n-heptane (C7H16) was used as a surrogate diesel fuel to simulate the diesel reforming process for a diesel engine operating under medium load. A reduced mechanism for n-heptane reforming over a Pt/CeO2-Al2O3 catalyst was adopted to investigate the effects of the process parameters in order to achieve production of hydrogen in this study. Sensitivity analysis results were used to assess the temporal sensitivity of temperature and key species concentrations of hydrogen to individual reaction steps from those of the base mechanism. Through the aforementioned work, the preferred process parameters (GHSV, O2/C ratio, H2O/C ratio and reaction temperature) were concluded and these could guide the diesel reforming test in a laboratory reformer setup. At the end, a comparison of reforming bench tests of diesel fuel and n-heptane under the typical diesel engine operating conditions in a laboratory mini reformer was conducted to study the composition variation tendency of the reforming reactor product gas, in order to demonstrate the usefulness of n-heptane as a surrogate for diesel fuel reforming. The aim of this work was to clarify whether n-heptane reforming could represent the features of diesel fuel reforming at typical reaction temperatures, and to reveal any differences in the change trends of H2 and CO yield (vol.%) between diesel fuel reforming and n-heptane reforming.

2. Theory and Experiment

2.1. Reforming Kinetics of Representative Hydrocarbons

The catalytic reforming mechanism of hydrocarbon fuels includes gas phase chemical kinetics and surface reaction chemical kinetics. In this study, a skeletal mechanism for n-heptane reforming was obtained from the Lawrence Livermore National Laboratory (LLNL) and related literatures [29,30,31,32,33]. Table 1 lists the significant reactions and related rate constant expressions for n-heptane gas phase reactions. Propene is one of the major pollutants and is usually taken as representative of unburnt hydrocarbons [29,31]. The surface reaction mechanism of propene could help investigate the performance of the platinum catalyst. Table 2 lists the significant reactions and related rate constant expressions for propene surface reactions. In the abovementioned tables, the nomenclatures of related constants were as follows: A is the pre-exponential factor, s−1; n is temperature index; E is the activation energy, J·mol−1.

2.2. Reforming Process Evaluated

For the numerical simulation of diesel reforming over a Pt/CeO2-Al2O3 catalyst, the skeletal reaction mechanism mentioned above was applied in this research. Gas phase reactions and surface reactions were modelled by an elementary-step reaction mechanism based on the molecular processes implemented in Chemkin code [34], and the chemical kinetics files were available in Chemkin format.
The following assumptions were made:
  • n-Heptane was used as surrogate diesel fuel to simulate the gas phase reaction processes.
  • The surface reaction mechanisms of propene were applied to investigate the reforming products over platinum catalyst.
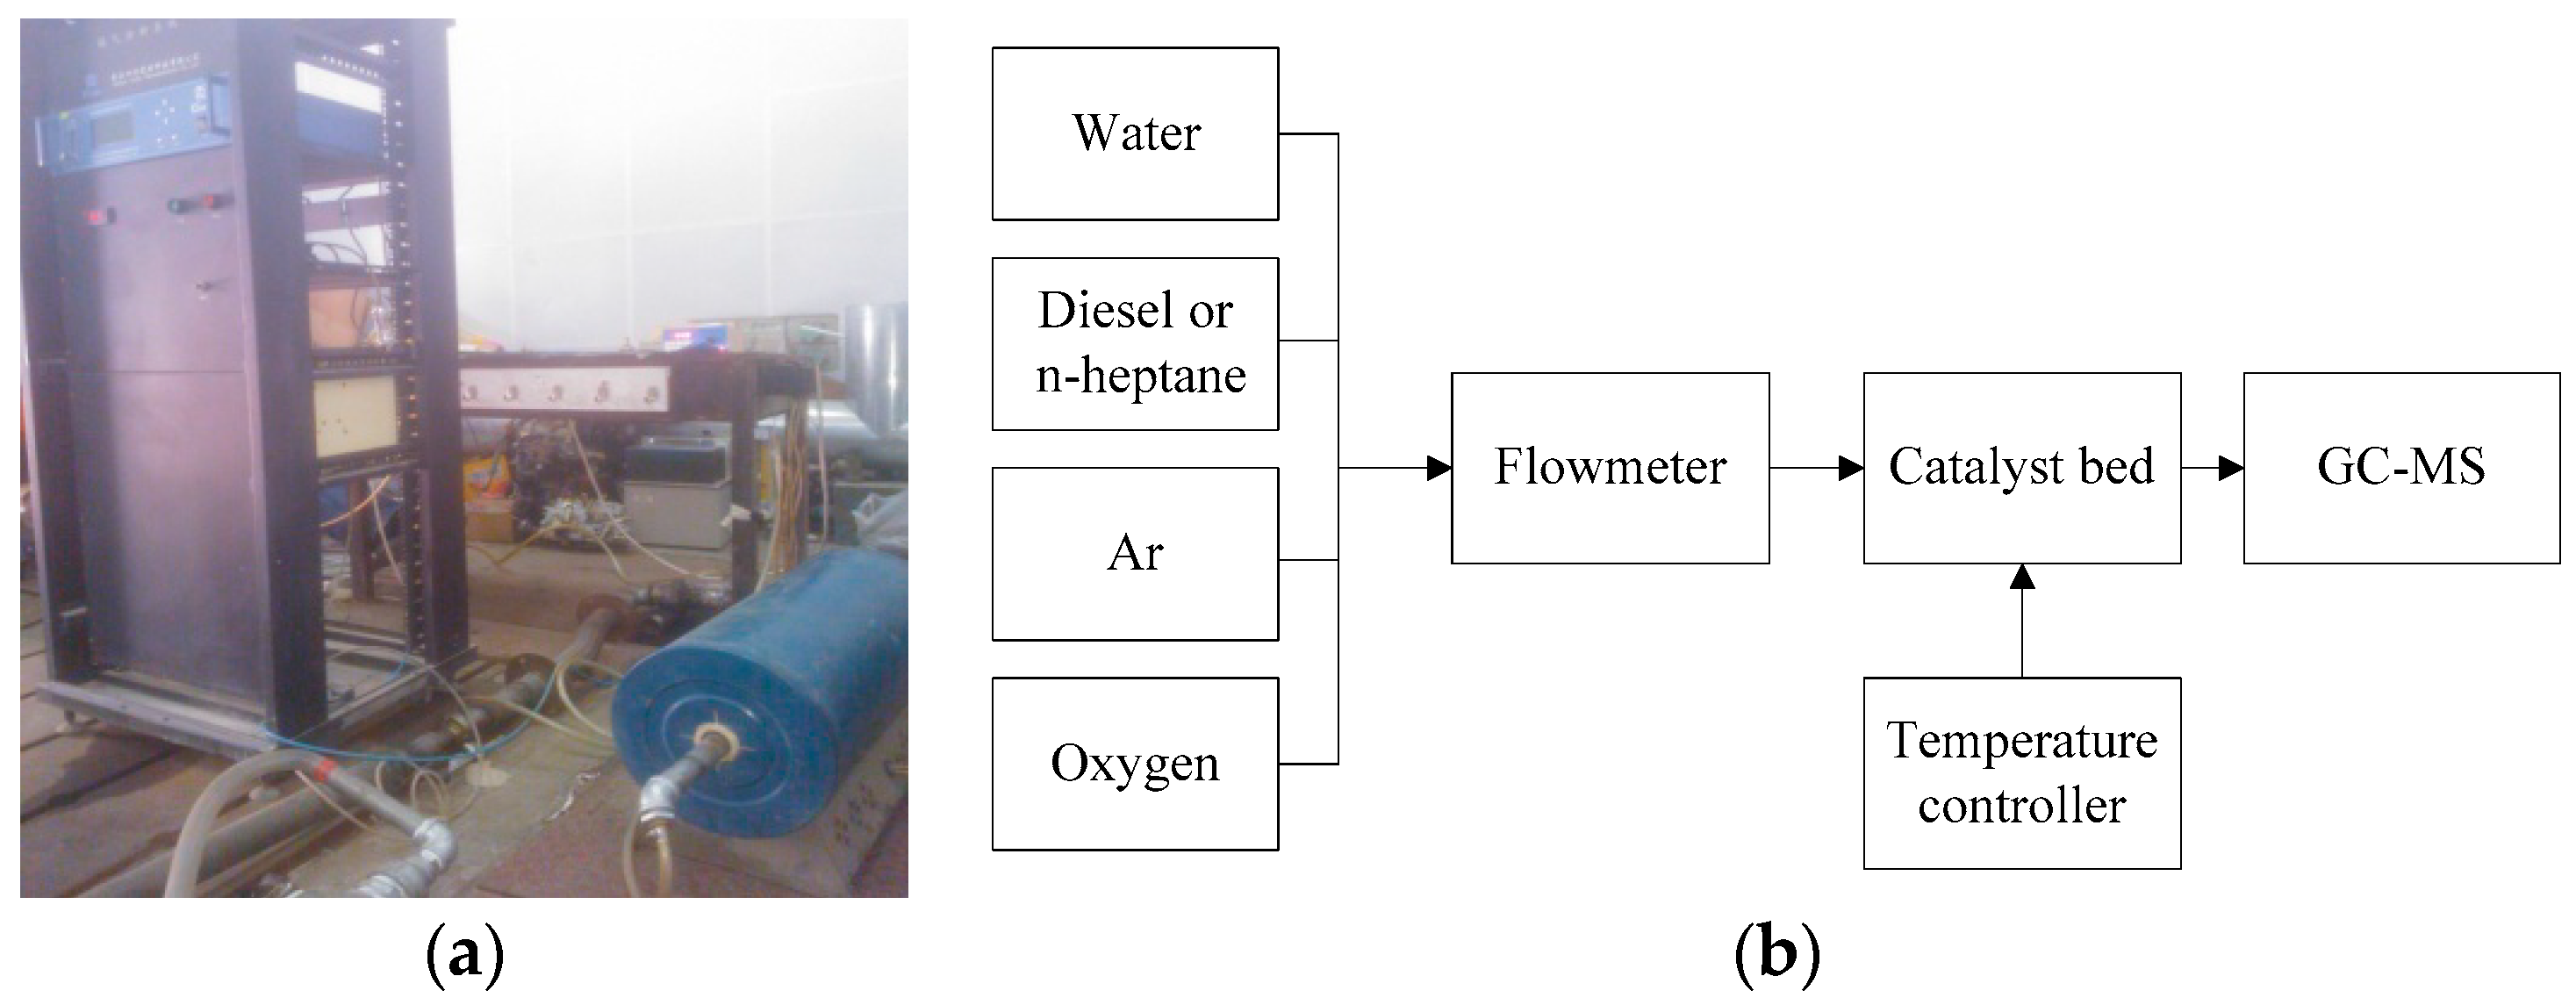
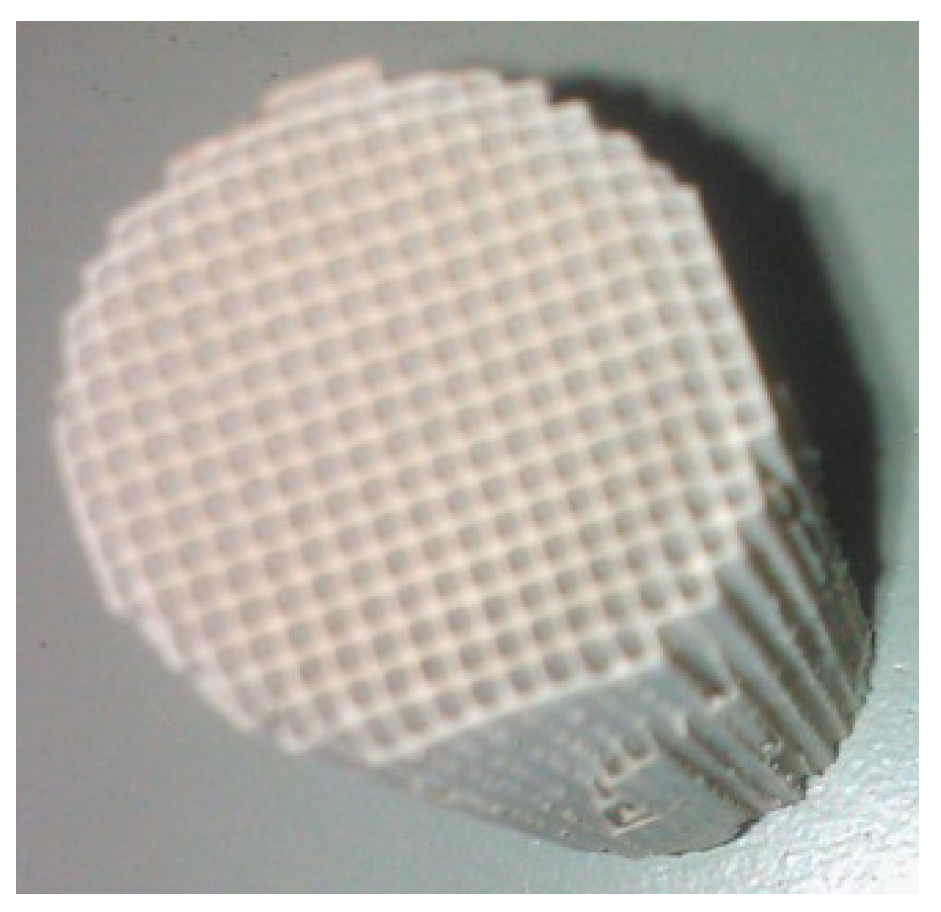
  • Pt/CeO2-Al2O3 catalyst seen in Figure 1 was chosen and its profile was measured by using a Micromeritics ASAP 2020 device. The measured parameters of the catalyst were: Pt 2.0 wt %, CeO2 49.0 wt %, Al2O3 49.0 wt %, surface area 100 m2/g, surface density 2.04 × 10⁻⁹ moles/cm2, porosity 0.8, diameter 2.2 cm and length 8.5 cm.
  • Referring to the prototype diesel engine operating conditions [35], the Gas Hourly Space Velocity (GHSV; volumetric flow rate of gas per hour divided by the volume of the catalyst bed) was set to 10,000, 15,000, 20,000 and 25,000 1/h. O2/C molar ratio was set to 0.6, 0.8, 1.0 and 1.2. H2O/C molar ratio was set to 1, 1.5, 2 and 2.5. The reaction temperature was set to 400, 450, 500, and 550 °C.

2.3. Experimental Procedure

The products of diesel reforming usually include H2 and CO, along with the formation of ethane and ethylene, etc. [36]. In this study, the reforming tests were conducted in a self-designed mini- reformer of which the overall dimensions were: length 48 cm, diameter 22 cm and weight 13 kg, as shown in Figure 2. The catalytic reformer setup was mainly composed of a carrier gas supply (Ar), water, oxygen, diesel fuel or n-heptane supply, furnace temperature controller, catalyst bed and reforming reactor product gas analyser so on.
The catalytic reforming reactor was fed by water, oxygen, diesel fuel or n-heptane, and it was loaded with a prototype precious metal catalyst (Pt/CeO2-Al2O3). The reactor was placed in a tubular furnace and the temperature was controlled by means of a temperature controller. In addition, a micro-evaporator was placed in inlet of the reactor in order to make sure water, diesel fuel or n-heptane were evaporated. A K-type thermocouple was adopted and its arrangement allowed vertical movement in the mixture and thus monitoring the reactor temperature profile. Two syringe pumps fitted with a glass syringe were used to supply water, diesel fuel or n-heptane, as well as to control their flow rates, respectively. A gas chromatograph-mass spectrometer (GC-MS) system (Agilent 7890B/5977B MSD), which was equipped with a flame ionization detector and two thermal conductivity detectors, was used to measure the H2 and CO content of the reactor products. Before the content tests of the reactor products, the GC-MS device should be calibrated with high purity H2 and CO, respectively. Note that the averaged data in six replicates was used for all experimental and their standard deviation was required to be less than 5%.
The reaction temperature was set to 400, 450, 500, and 550 °C for the reforming tests, respectively. These different reaction temperatures were selected, referring to the exhaust temperature of the abovementioned prototype diesel engine running at the representative operating conditions. Through with the simulated optimization results, GHSV was kept constant at approximately 10,000 1/h during the reforming tests referring to a typical diesel engine operating under medium load. The basic process parameters for the reforming reactions were the oxygen-to-carbon molar ratio O2/C and the water-to-carbon molar ratio H2O/C. The process parameters had to be accurately determined and accordingly water, oxygen and diesel fuel (or n-heptane) flow into the reactor had to be controlled for the maximum hydrogen yield. Referring to the above simulated optimization results and the realistic operating conditions of the prototype diesel engine [35], the flow rates of water, diesel fuel and n-heptane were calculated to be 8, 5.4 and 3.7 mL/min under the constant GHSV condition of 10,000 1/h during the reforming bench tests, respectively.

3. Results and Discussion

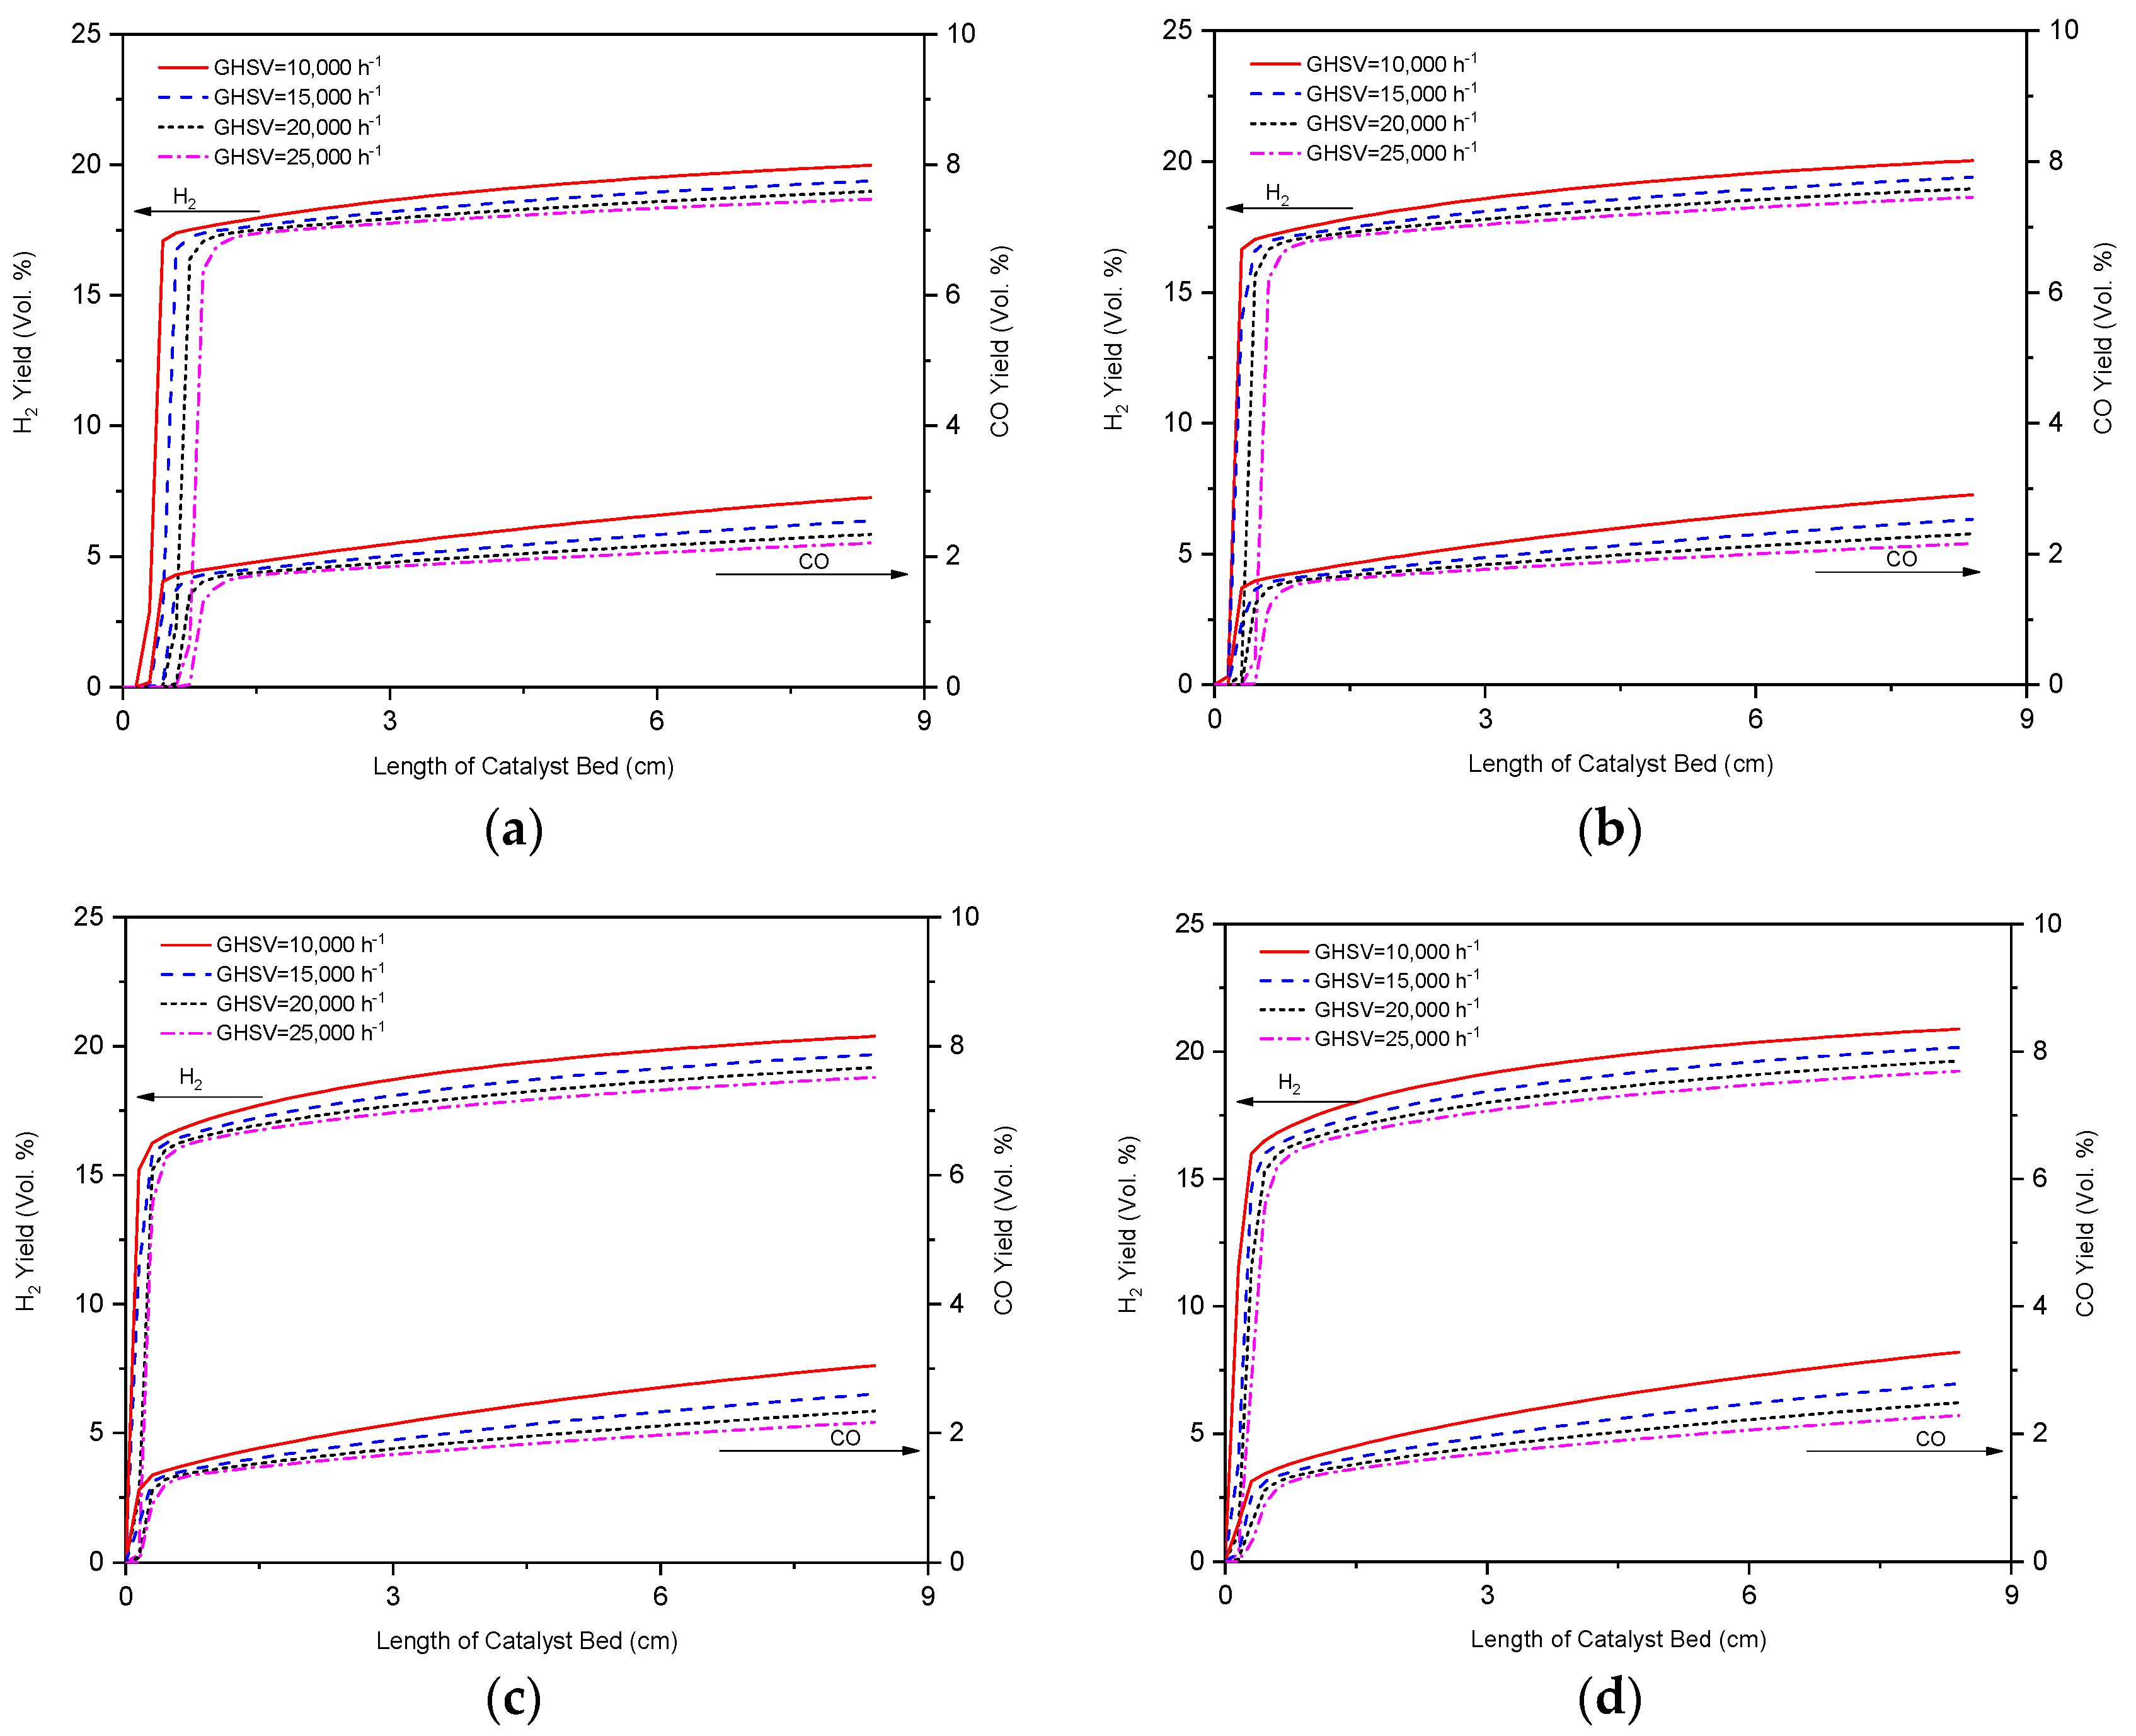
3.1. Effect of GHSV on Reformer Product

The effect on GHSV on the reaction profiles was evaluated at different reaction temperatures. Figure 3 shows the simulated results of H2 and CO yield (vol.%) for n-heptane reforming with length variation of the catalyst bed at different reaction temperatures, for four different GHSV values 10,000, 15,000, 20,000 and 25,000 1/h, separately.
A higher GHSV requires better catalytic activity of the Pt/CeO2-Al2O3 catalyst, as higher GHSV shortens the residence time of the reforming mixture over the catalyst. All of abovementioned factors could affect the fuel conversion rate and H2, CO yield. As shown in Figure 3, H2 and CO yield (vol.%) increased as the GHSV decreased. In addition, the maximum H2 and CO yield moved toward unity as the GHSV decreased and the reaction temperature increased. Under lower GHSV conditions, the hydrogen and carbon monoxide selectivities were much lower than those at higher GHSV conditions.
From Figure 3, it also could be concluded that the H2 and CO yield (vol.%) increased as the length of the catalyst bed increased. The peak production velocity of H2 and CO appeared at the front part of the catalyst bed, and then it decreased as the axial length of the catalyst bed increased. The H2 and CO yield (vol.%) increased as the reaction temperature was increased from 400 to 500 °C. The maximum H2 and CO yield (vol.%) exceeded 22.6% and 3.3%, separately, as shown in Figure 3. The product mole ratio of H2/CO exceeded 2.2, which was an approximate stoichiometric ratio of a one-step n-heptane SR reaction. As illustrated in [27,37], the amount of vaporized n-heptane and water had significant effect on the H2 and CO yield. Due to the high temperatures of the gas mixture, injected water was expected to be fully evaporated and mixed with the n-heptane. In addition, the aforesaid reaction conditions promoted the occurrence of WGSR reactions, where CO was consumed and further H2 was produced. Hence the actual mole ratio of H2/CO for the reformer product exceeded the stoichiometric ratio of H2/CO for a one-step n-heptane SR reaction. Nevertheless too high a temperature could deactivate the activity of Pt/CeO2-Al2O3 catalyst. From the above results, GHSV of 10,000 1/h was preferable in terms of H2 and CO productivity.

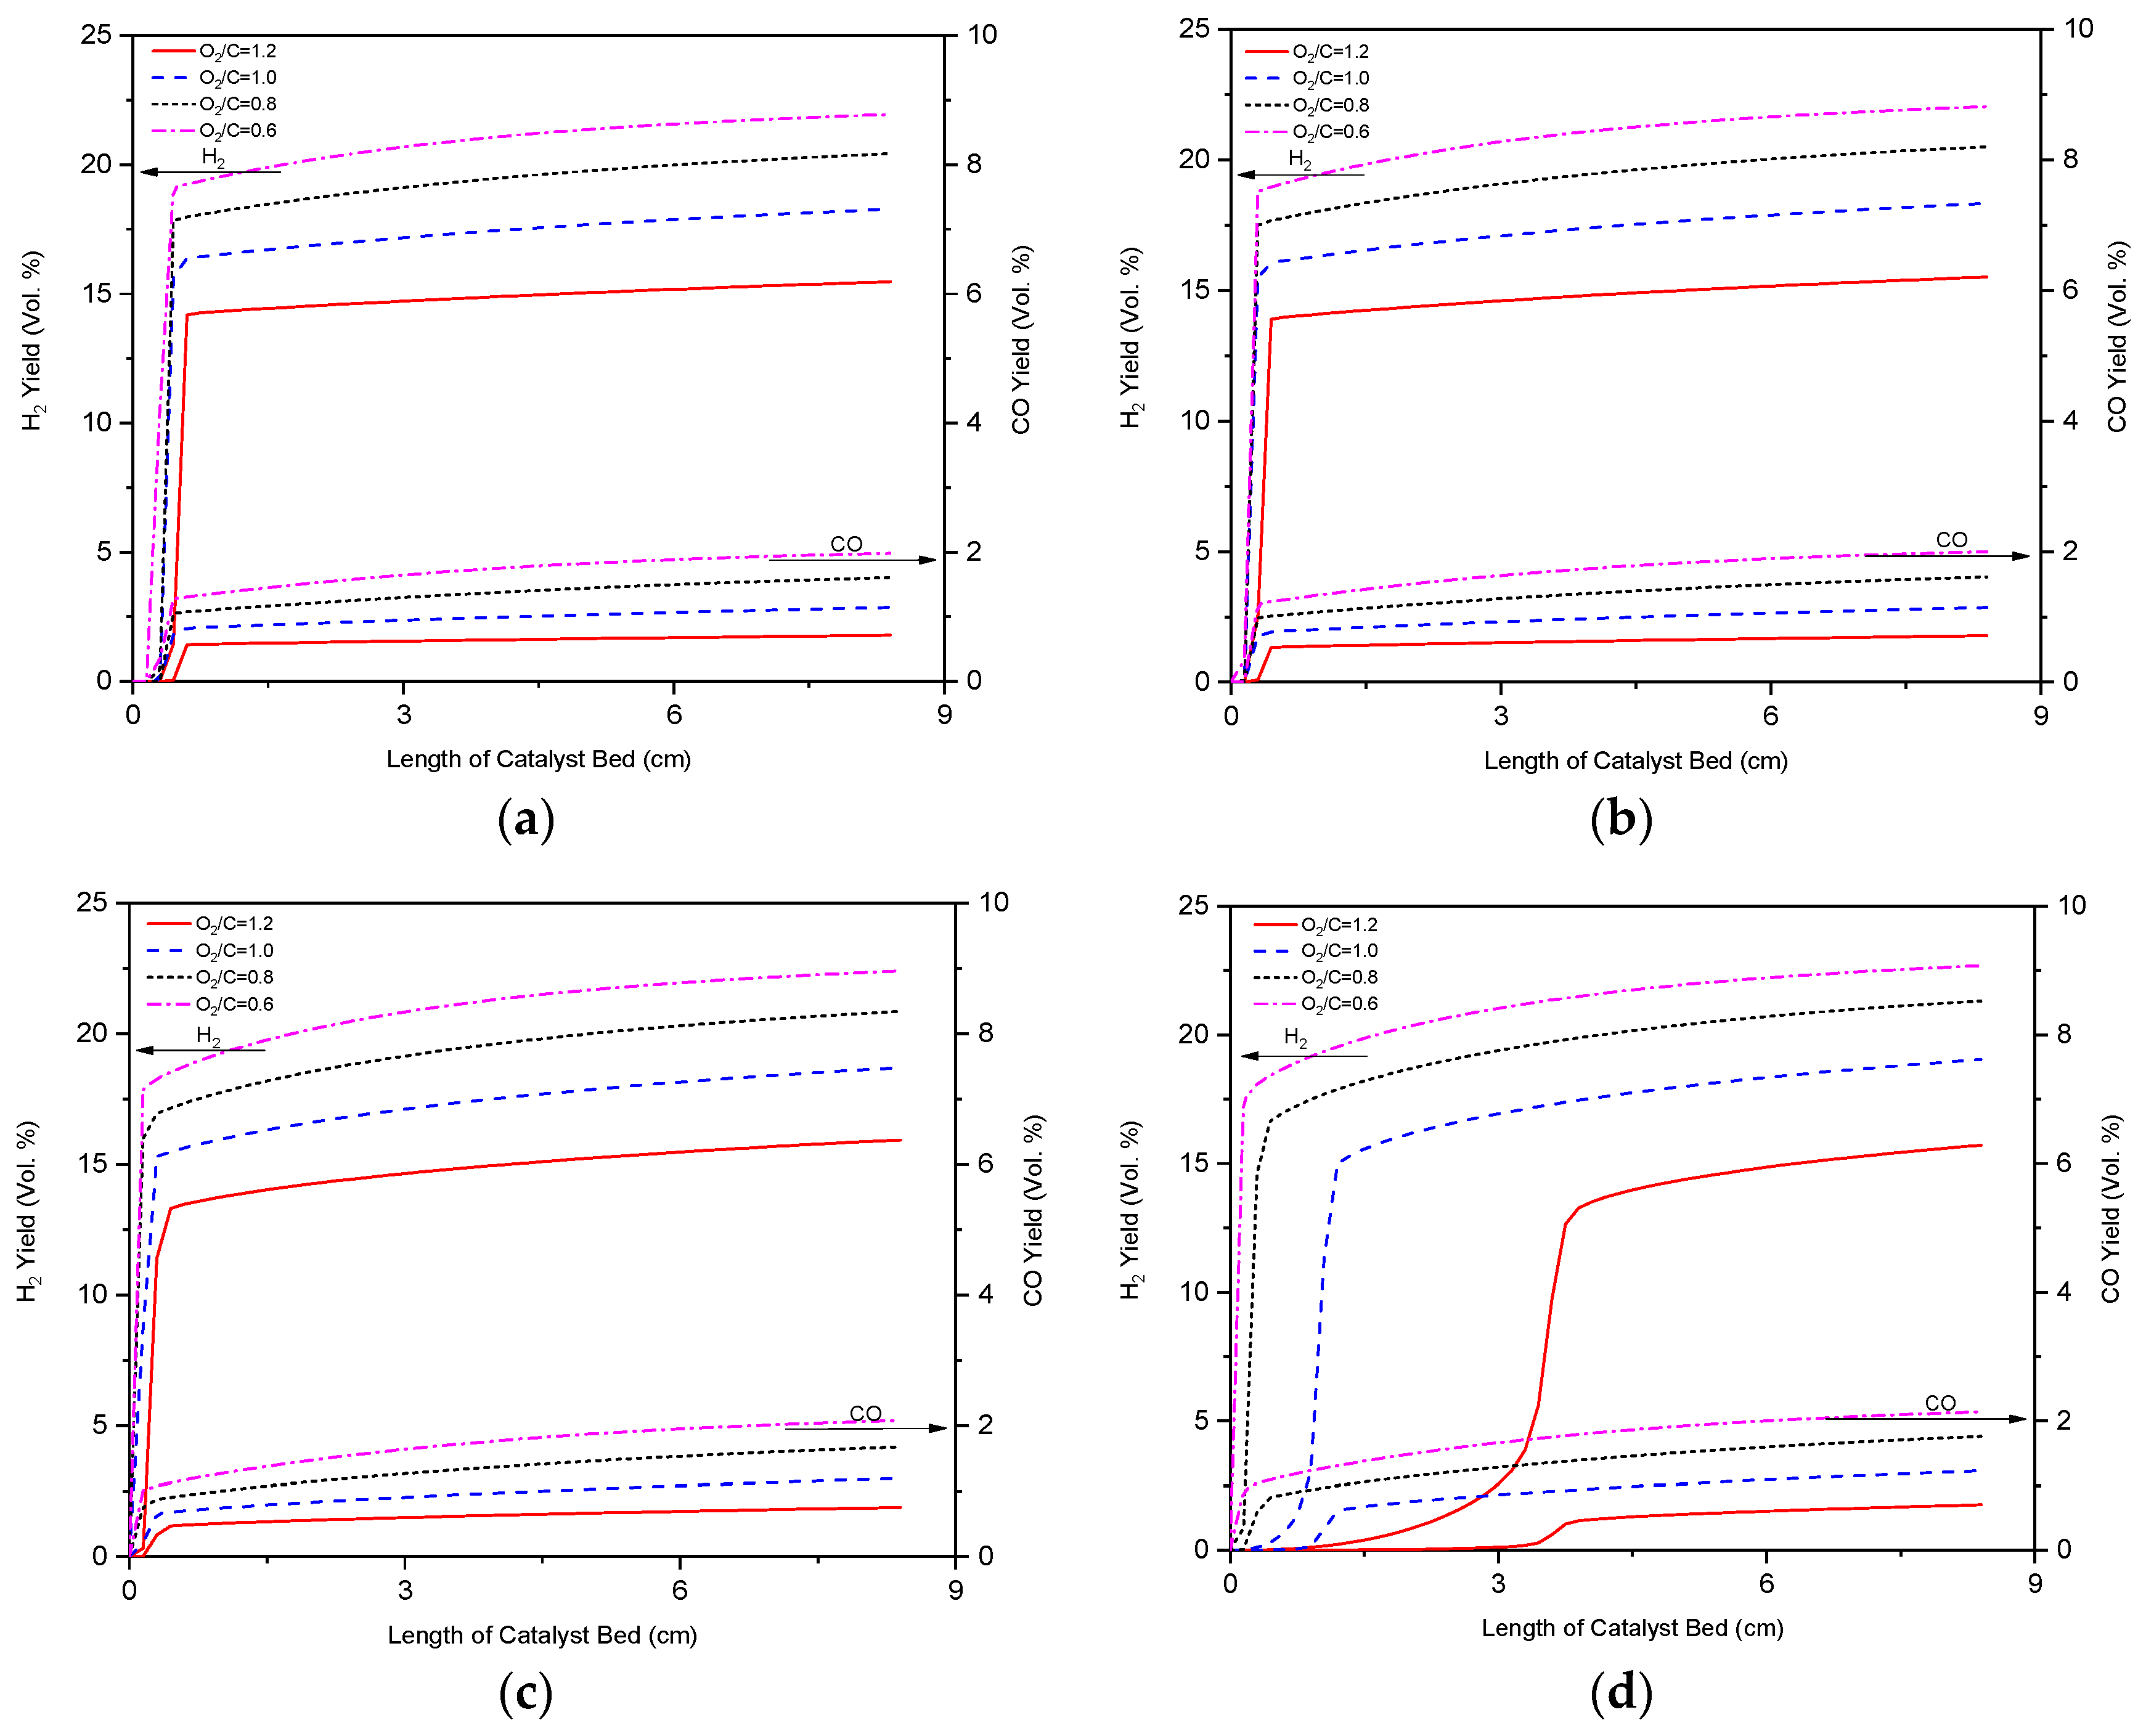
3.2. Effect of O2/C Ratio on Reformer Product

The effect on O2/C ratio on the reaction profiles was evaluated at different reaction temperatures. The calculation of the O2/C ratio was explained in [1]. Figure 4 shows the simulated results of H2 and CO yield (vol.%) for n-heptane reforming with length variation of the catalyst bed at different reaction temperatures, for four different O2/C ratio conditions of 0.6, 0.8, 1.0 and 1.2, separately.
In fact, an increase of O2/C ratio meant an increase of the quantity of oxygen reacting with hydrogen and carbon monoxide. Some results were also confirmed by the experimental studies on the partial oxidation reforming of hydrocarbons [38,39]. From those results, it was clear that the O2/C ratio of the reactants had a strong influence on hydrogen and carbon monoxide production. For the different GHSV and fuel flow rates into the catalyst bed, the corresponding O2/C ratios were 0.6, 0.8, 1.0 and 1.2, separately. As shown in Figure 4, H2 and CO yield (vol.%) increased as the O2/C ratio decreased. Comparing Figure 4 with Figure 3, it also illustrated that WGSR reaction played an important role in promoting H2 yield and consuming CO, which was indicated by the mole ratio of H2/CO.
As discussed in [38,39], the hydrogen yield of steam reforming depends on the reaction temperature, therefore the optimal operating temperature of the reactor had been determined by means of a parametric analysis and this value had been adjusted to achieve the best fit of the experimental data. As shown in Figure 4, an O2/C ratio of 0.6 and reaction temperature of 500 °C was preferable in terms of H2 and CO productivity.

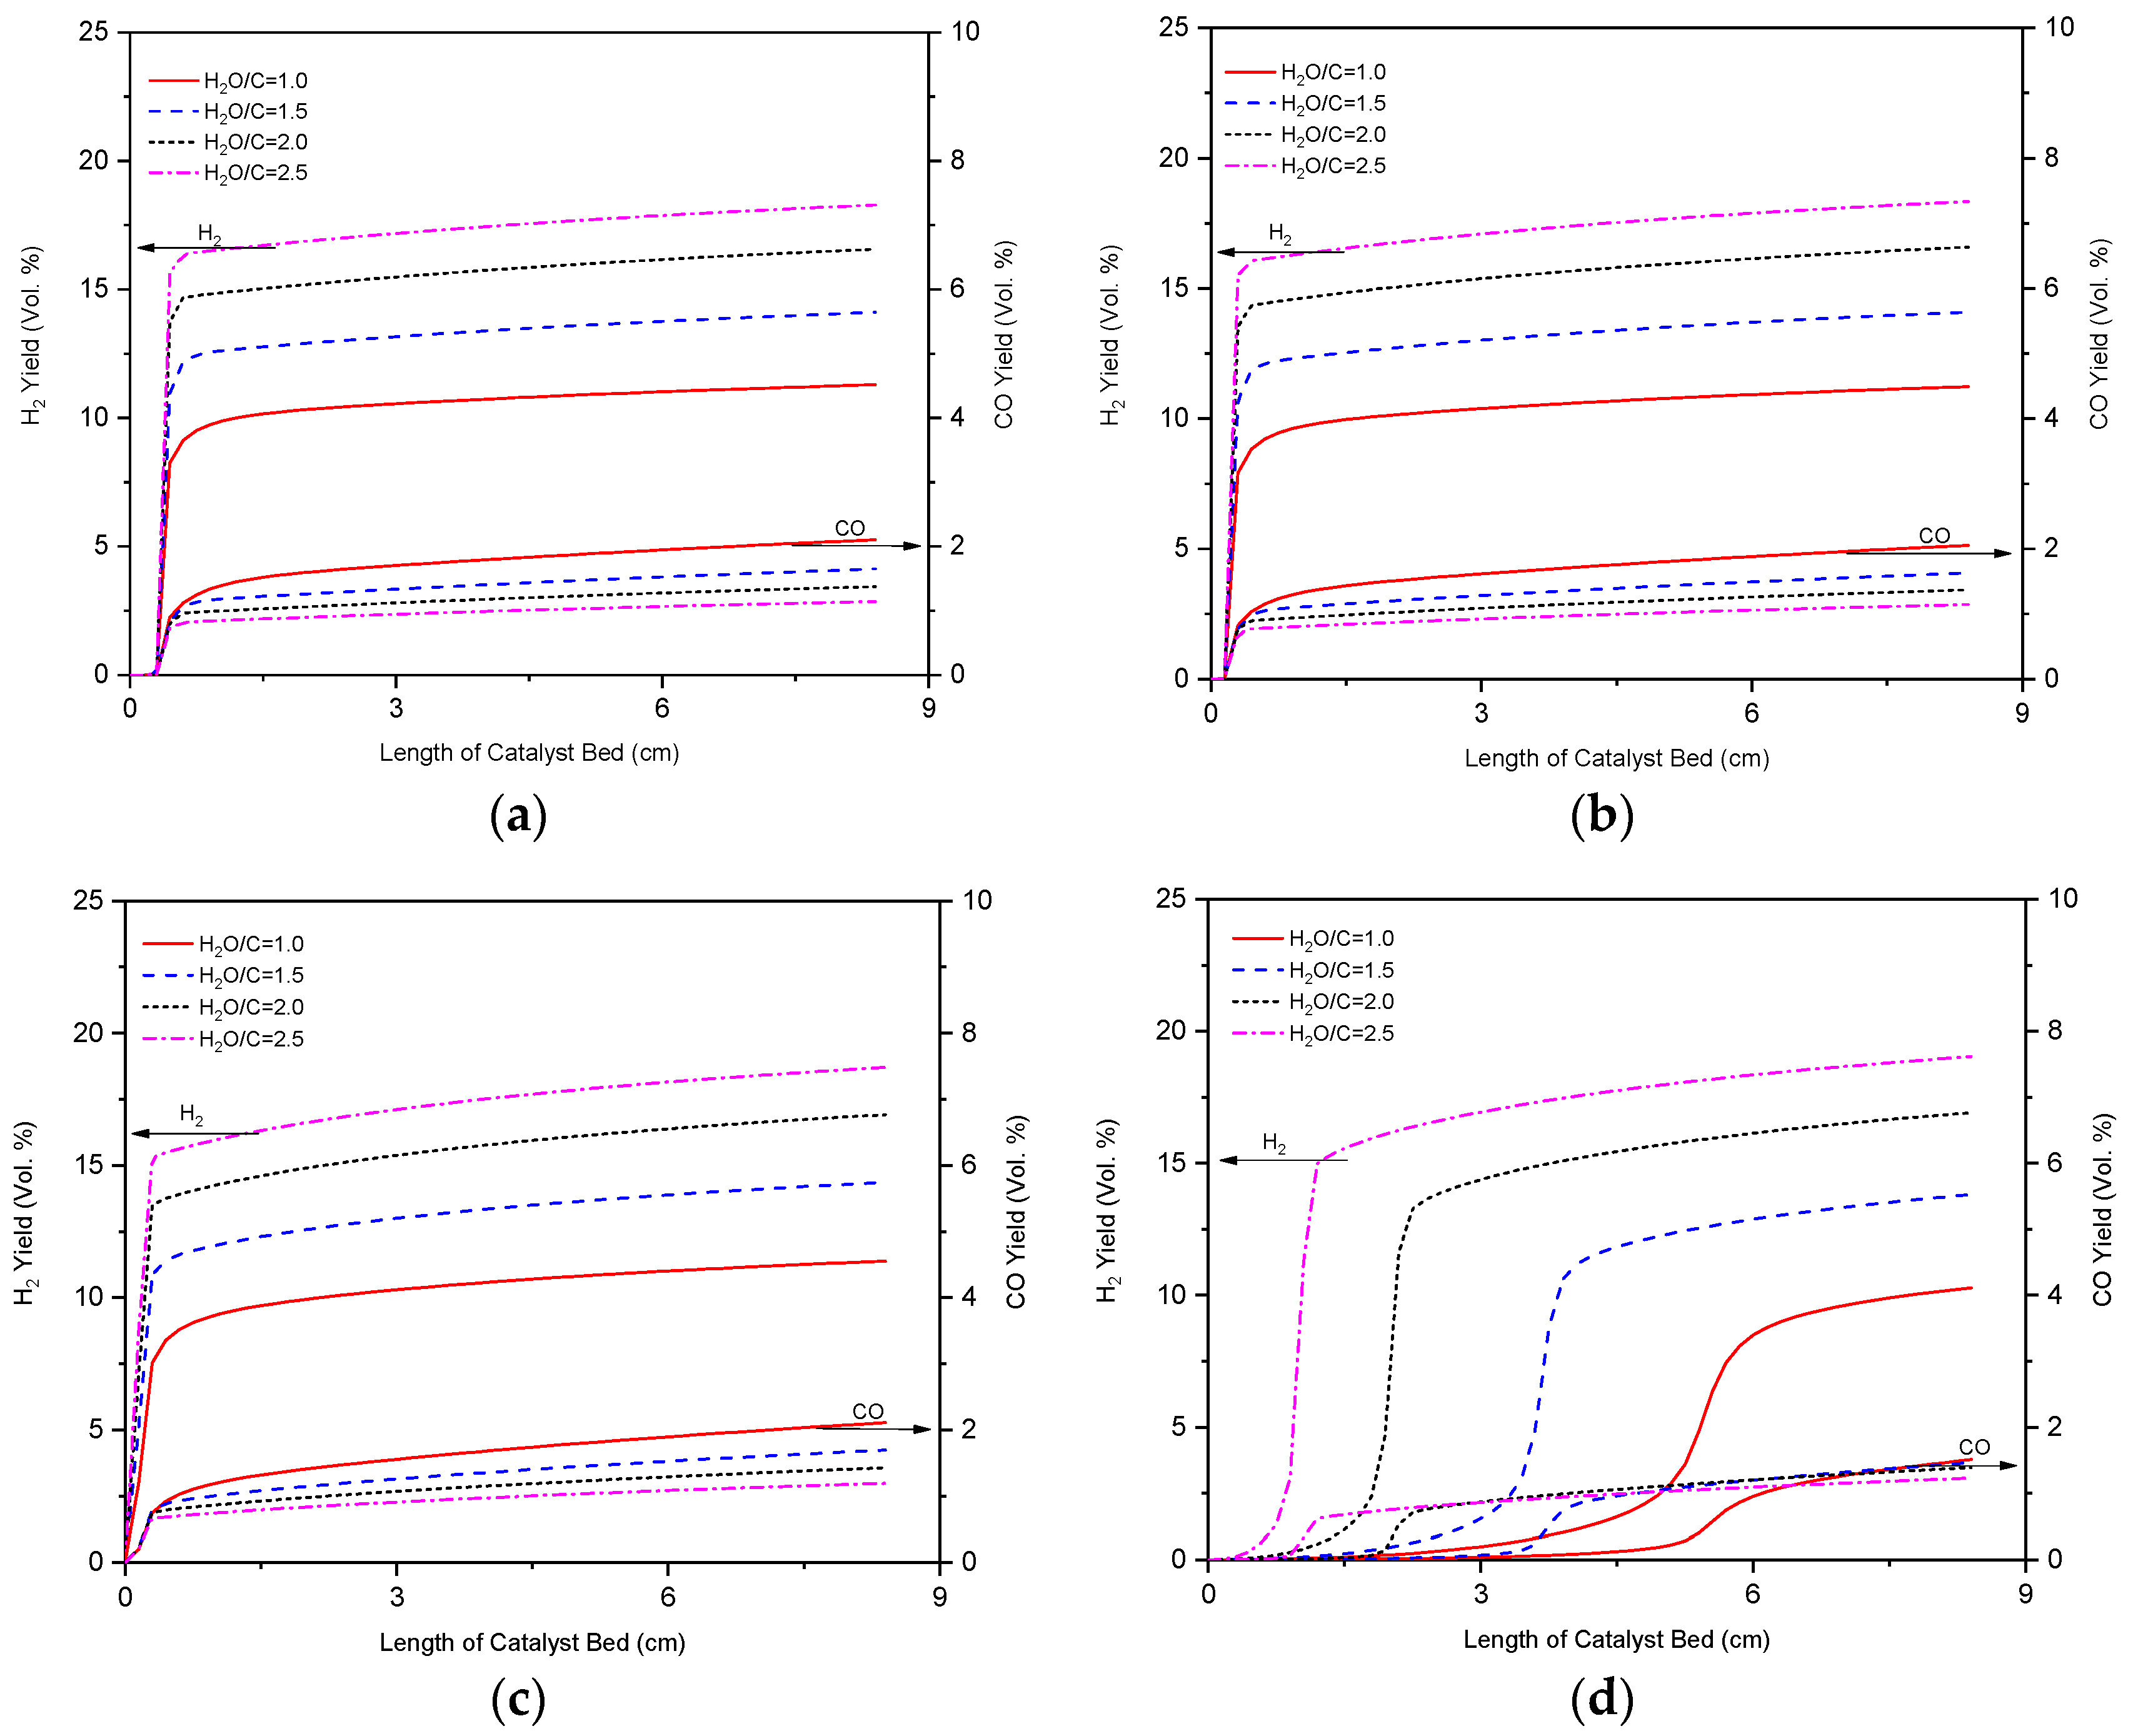
3.3. Effect of H2O/C Ratio on Reformer Product

A higher H2O/C ratio indicated that more water was added to the reforming reactor. As shown in Figure 5, H2 yield (vol.%) increased and CO yield (vol.%) decreased as the H2O/C ratio increased. As the water added to the reforming reactor and H2O/C ratio increased from 1.0 to 2.5, the H2 production increased but the CO content of the reformer product dropped. As shown in the literature [37], the new reaction occurring with water addition was considered to be WGSR and it could be demonstrated by the decreased CO yield. The maximum hydrogen yield (vol.%), approximately 19%, was achieved with the H2O/C ratio of 2.5 as shown in Figure 5. Further increase of water addition brought about an increased hydrogen yield by the WGSR as illustrated in [37]. Optimisation of the reforming reaction process and the catalyst to obtain further conversion of the carbon monoxide to hydrogen by the WGSR would improve the produced hydrogen levels even further.

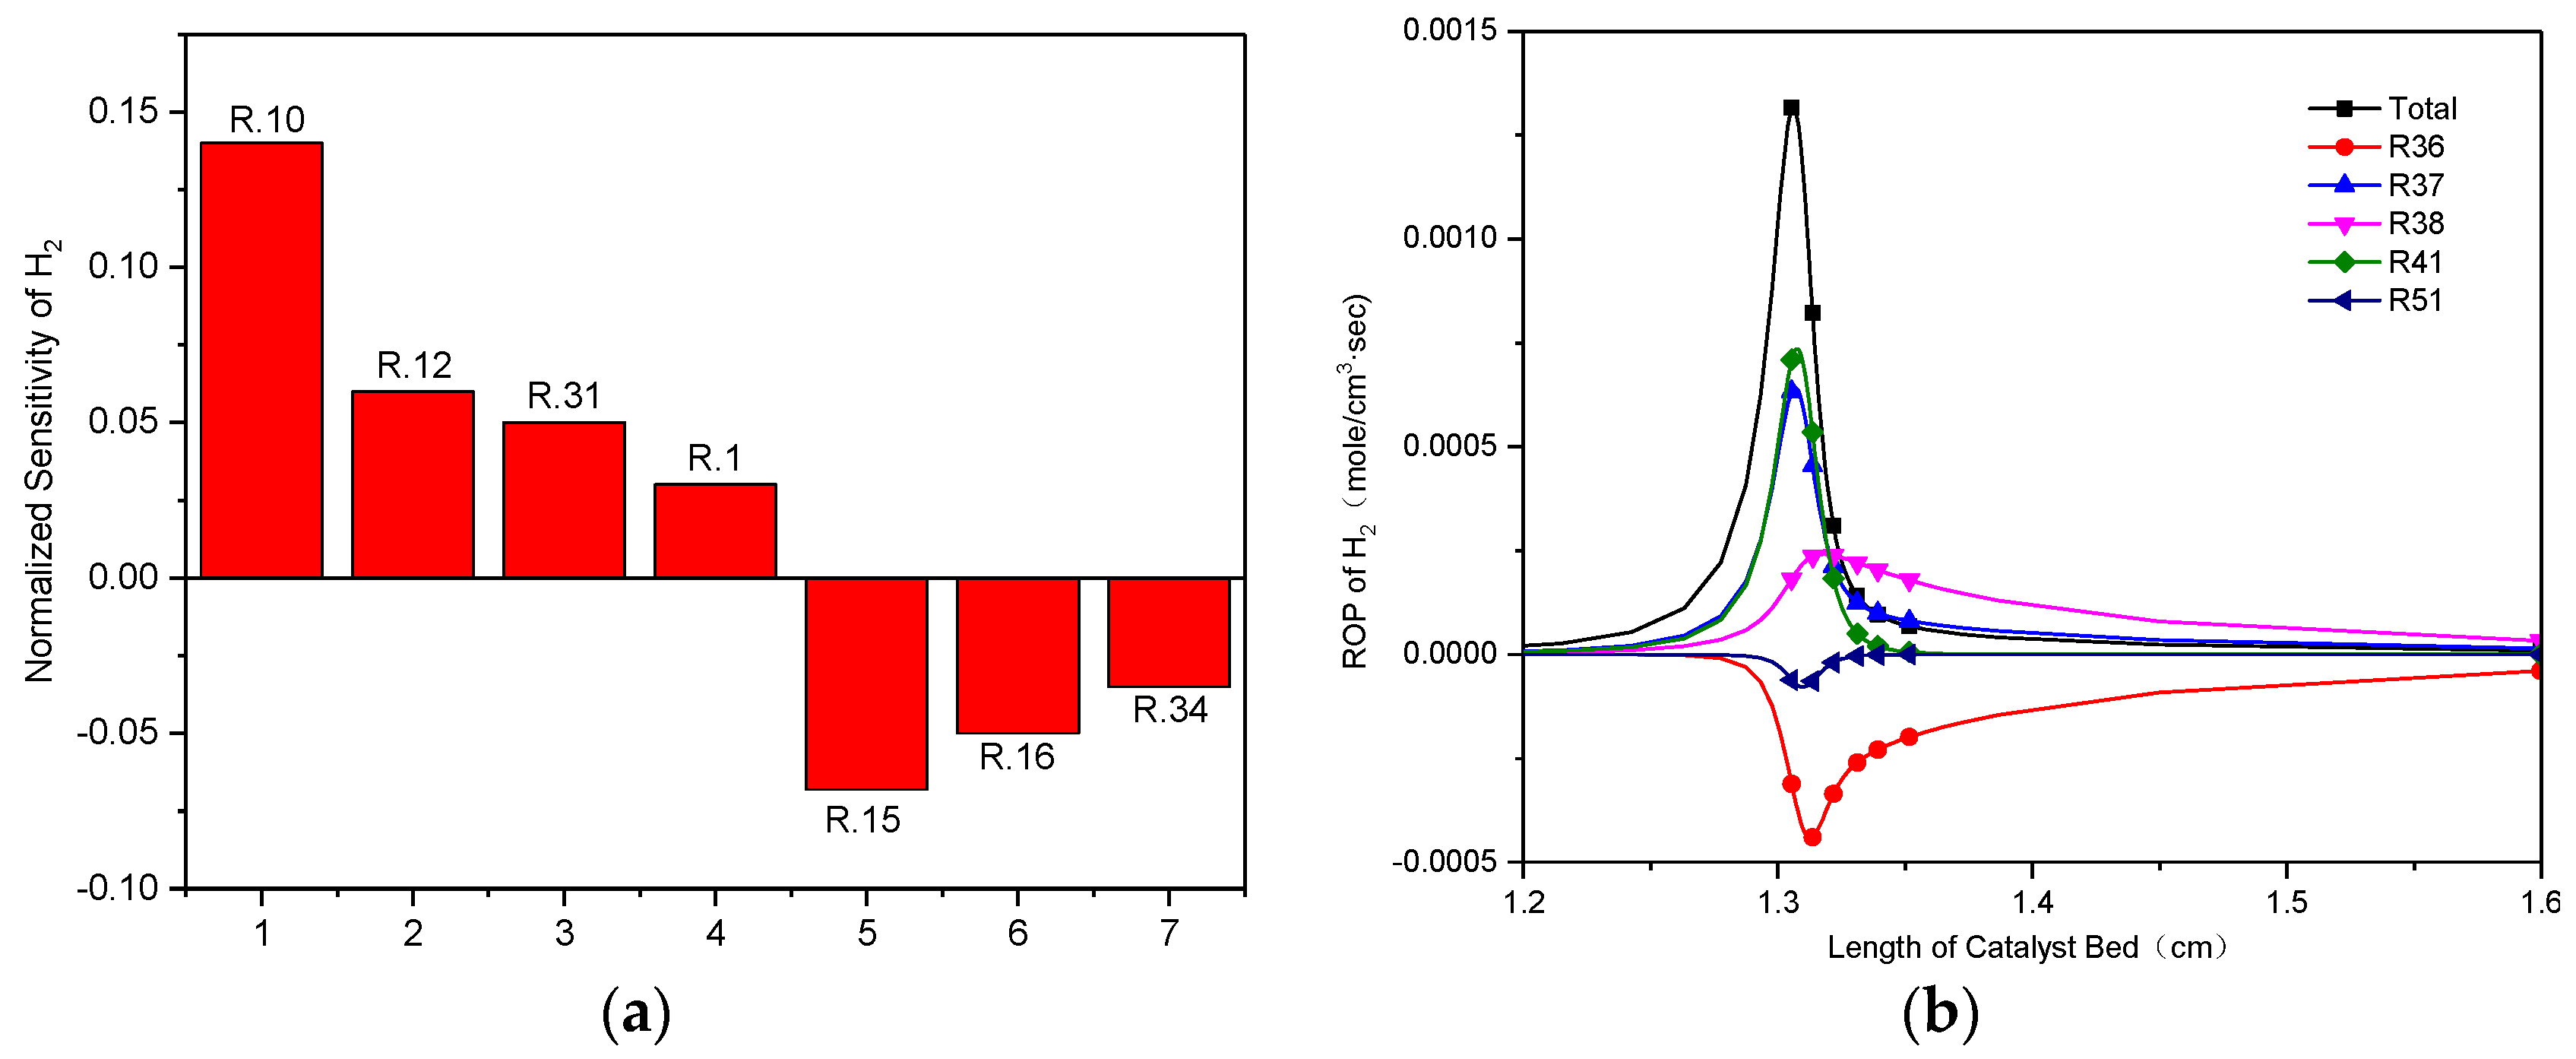
3.4. Sensitivity Analysis and ROP Analysis of the Reaction Steps Effect on H2 Production

In order to understand the detailed mechanisms and sensitivity of the H2 yield, a sensitivity analysis and ROP analysis of the reaction steps’ effect on H2 production was carried out in this study. The rate expression for the n-heptane reforming reaction was given by [40,41] and the direction of the thermodynamic equilibrium for reforming reactions depended on the prevailing conditions in the reaction media. As shown in Figure 6a, the highest sensitivity coefficient for H2 production occurred in the reaction step R.10 (Table 1) which promoted hydrogen yield. For the reaction steps R.10, R.12, R.31 and R.1, the positive sensitivity coefficients were reduced gradually. Figure 6a also illustrated that the lowest sensitivity coefficients for H2 production occurred in the reaction step R.15 (Table 1) which inhibited the hydrogen yield. For the reaction steps R.15, R.16 and R.34, the negative sensitivity coefficients reduced gradually.
The rate-of-production (ROP) analysis could identify the degree of contribution of reaction steps to the H2 yield. As shown in Figure 6b, the ROP coefficient in the reaction steps R.41, R.37 and R.38 (Table 1) was positive, which promoted the H2 yield. The ROP coefficients in the reaction steps R.36 and R.51 were negative, which inhibited H2 yield, but the total ROP coefficient was positive which illustrated the reforming process of n-heptane moved forward to hydrogen yield.
The reaction temperature has a profound effect on the reaction rate constants and participates in supplying the necessary heat required to shift the thermodynamic equilibria of endothermic reactions. As shown in Figure 4 and Figure 5, the reaction temperature effect was more pronounced at low reaction temperatures, e.g., from 400 °C to 500 °C, than at high reaction temperatures, e.g., from 500 °C to 550 °C. Similar findings were reported in [27].

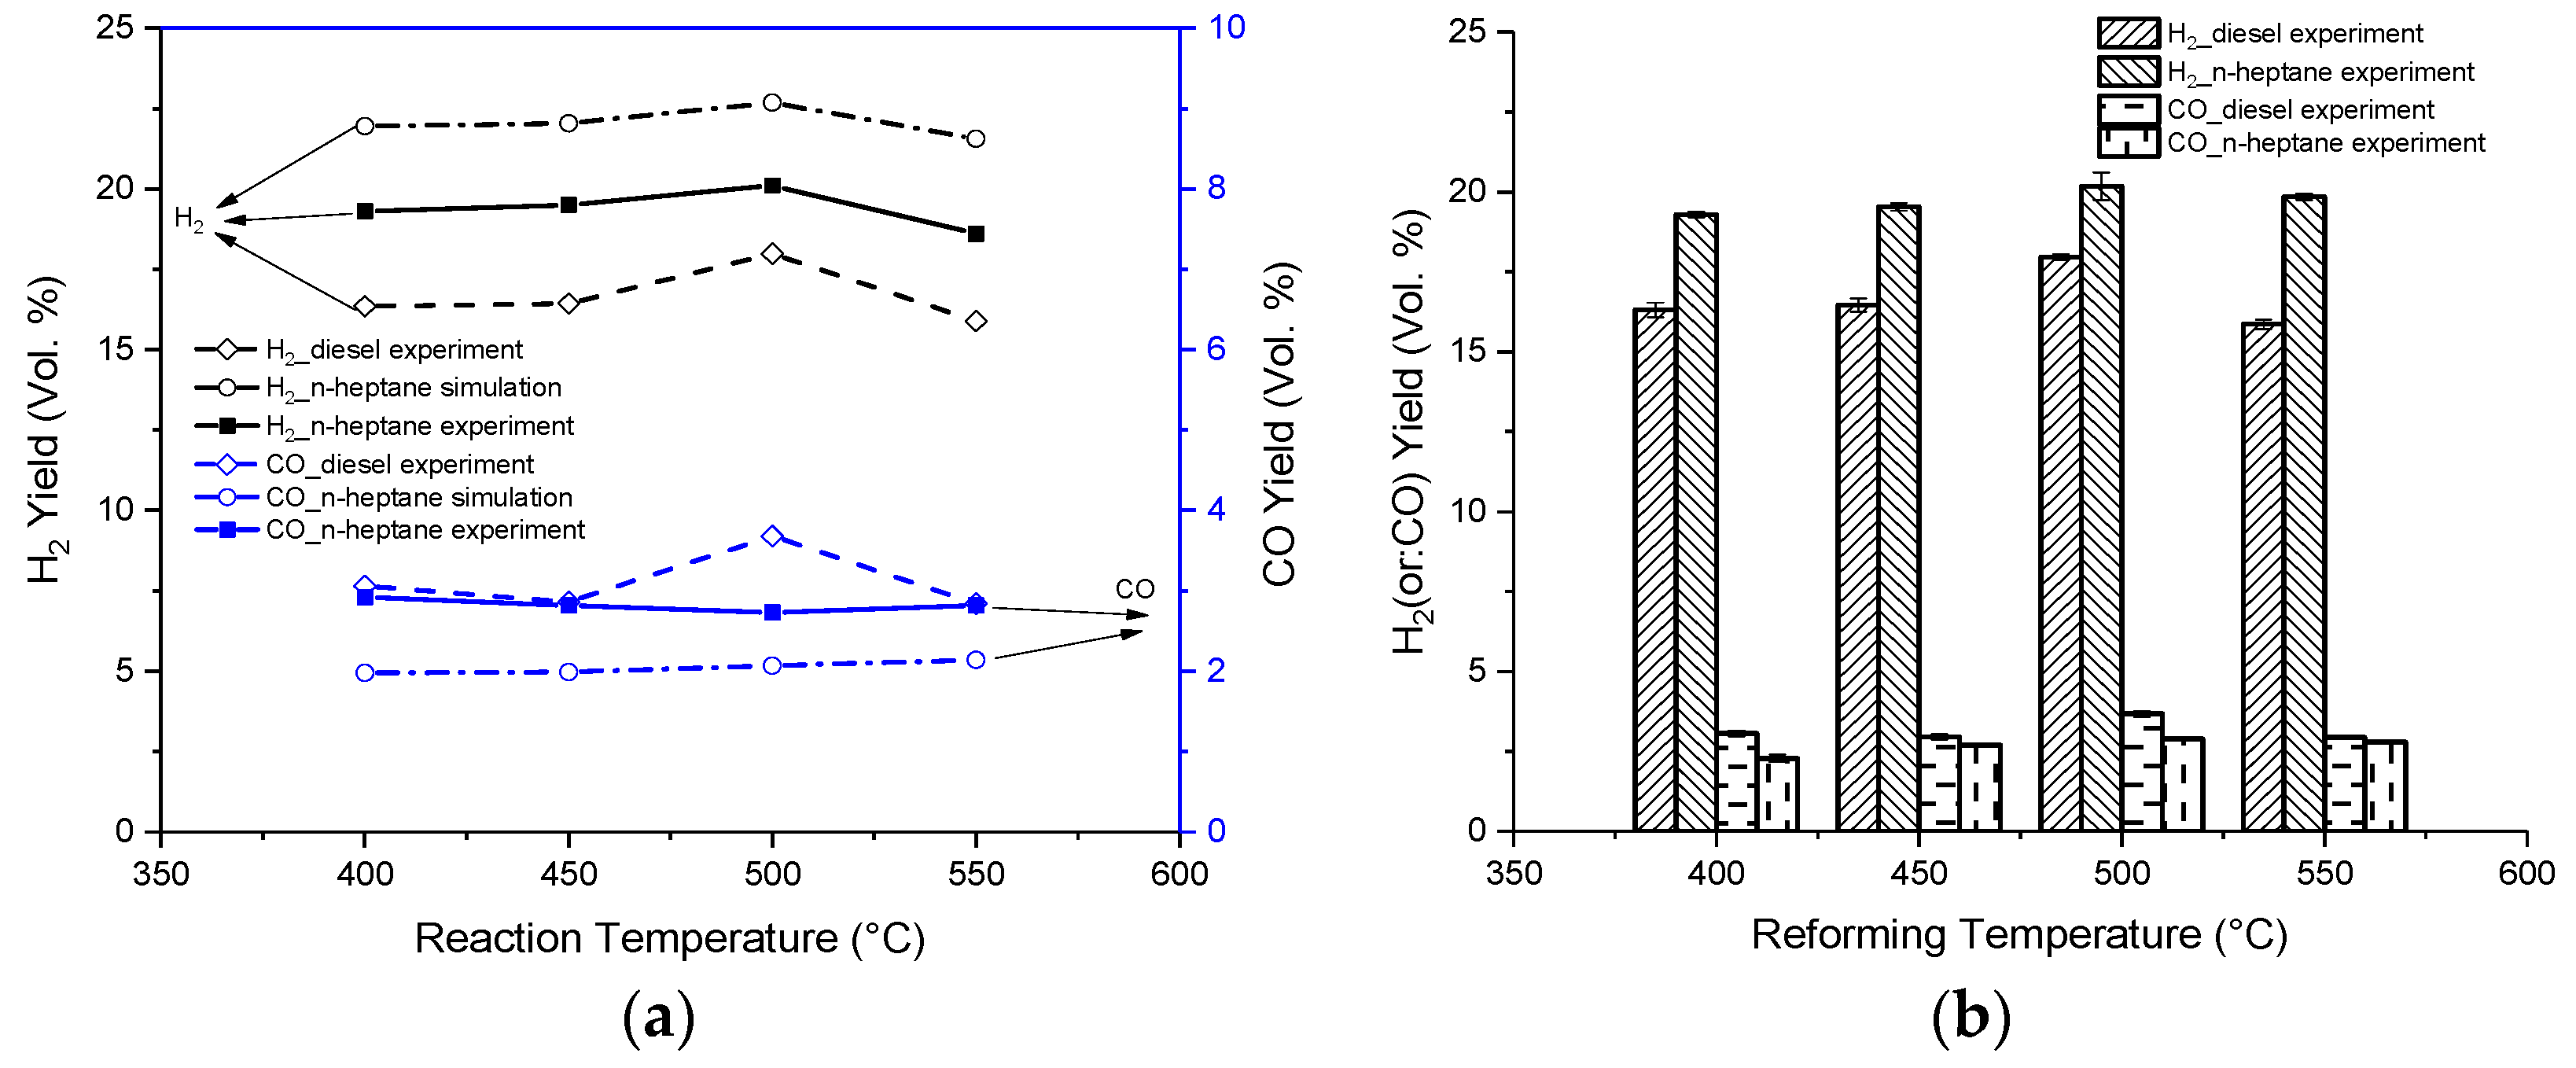
3.5. Experimental Results of H2 and CO Production

The fundamental properties of the feed commercial diesel fuel were as follows: density 832 kg/m3, cetane number 56, lower heating value 42.7 MJ/kg and kinematic viscosity at 0 °C 4.12 mm2/s. Figure 7 shows the experimental results of H2 and CO yield (vol.%) at the different reaction temperatures of 400, 450, 500 and 550 °C, respectively. During the contrast experiments, GHSV was kept constant at approximately 10,000 1/h referring to a typical diesel engine operating under medium load and the above simulated optimization results. The flow rates of water, diesel fuel and n-heptane in the bench test were calculated as mentioned in Section 2.3.
Figure 7a shows the average H2 and CO yield comparison results of the diesel experiment, n-heptane simulation and n-heptane experiment at different reaction temperatures. As shown in Figure 7a, the average H2 yields (vol.%) of the diesel reforming experiment were 16.3%, 16.4%, 17.9% and 15.8% at the reaction temperatures of 400, 450, 500 and 550 °C, respectively; the corresponding average CO yields (vol.%) were 3.1%, 2.96%, 3.7% and 2.94%. Figure 7a also shows that the average H2 yields (vol.%) of the n-heptane reforming experiments were 19.3%, 19.5%, 20.1% and 19.8% at the reaction temperatures of 400, 450, 500 and 550 °C, respectively; the corresponding average CO yields (vol.%) were 2.3%, 2.7%, 2.9% and 2.8%. As shown in Figure 3, Figure 4 and Figure 5 and Figure 7a, the average outlet yields (vol.%) of H2 and CO in the n-heptane experimental results corresponded with those in the simulated results under typical reaction temperatures.
Figure 7b shows the error bars of the H2 and CO yields (vol.%) for the diesel fuel and n-heptane experiments. As shown in Figure 7b, the standard deviations of the average H2 yield (vol.%) for the diesel and n-heptane experiments at the reaction temperatures of 400, 450, 500 and 550 °C were less than 0.23% and 0.43%, respectively; the corresponding standard deviations of the average CO yields (vol.%) for the diesel and n-heptane experiments were less than 0.09% and 0.12%. The average H2 yields (vol.%) for the diesel fuel experiments compared to the n-heptane experiments were reduced by 15.4%, 15.7%, 10.9% and 20.1% at the reaction temperatures of 400, 450, 500 and 550 °C, respectively; the corresponding average CO yields (vol.%) for the diesel fuel experiments compared to n-heptane experiments increased by 34.1%, 9.4%, 26.9% and 5.1%. As illustrated in Figure 7, an O2/C ratio of 0.6 and reaction temperature of 500 °C were preferable considering H2 and CO yield.
Through the comparison of the reforming bench tests of diesel fuel and n-heptane, the change trends of H2 and CO yield (vol.%) revealed consistence, as shown in Figure 7, although the differences between the average H2 and CO yield (vol.%) results were obvious. The reduction range that H2 yield (vol.%) of diesel fuel reforming varied from 10.9% to 20.1% compared to n-heptane reforming experiments was achieved at the typical reaction temperature. The characteristics of n-heptane reforming could represent the H2 and CO yield (vol.%) features of diesel fuel reforming at typical reaction temperatures in a way. In order to benefit from representing the diesel fuel reforming as accurately as possible by means of a numerical simulation method, a multi-component wide distillation range surrogate fuel ought to be proposed in further studies. Obviously, the decrease of the hydrogen yield went along with an increase of carbon monoxide, indicating that the WGSR was constrained at higher reaction temperatures. Although ceria-supported rhodium and platinum was an acceptable catalyst for WGSR, its optimal activity was restricted to a narrow range, and at high temperature by the superiority of the more thermodynamically favoured reverse-shift reaction [8,42]. In the diesel fuel reforming as shown in Figure 7, the presence of the endothermic dry reforming reaction that might had also taken place was obvious from the experimental results. Compared to that of diesel fuel reforming, the fluctuation of the average H2 and CO exit yield (vol.%) of n-heptane reforming was small at different reaction temperatures as long as an adequate catalyst bed length was ensured. The primary cause for the aforementioned phenomenon was attributed to different components in commercial diesel fuel with different classes of chemical structures that were affected differently by different reaction temperatures during the reforming process.

4. Conclusions

In this study, a reduced mechanism for n-heptane as surrogate diesel reforming was adopted to investigate the effects of the process parameters in order to achieve production of hydrogen and carbon monoxide. Meanwhile the sensitivity analysis and ROP analysis of the effect of the reaction steps on hydrogen production was carried out. Finally diesel fuel and n-heptane reforming tests were conducted in a laboratory mini-reformer to study the composition variation of the reforming reactor product gas under typical diesel engine operating conditions, respectively. The following conclusions are drawn from the results and discussion.
  • During the n-heptane reforming simulation process, the H2 and CO yields (vol.%) increased as the GHSV decreased. In addition, the maximum H2 and CO yield moved toward unity as the GHSV decreased and the reaction temperature increased. Under lower GHSV conditions, hydrogen and carbon monoxide selectivity was much lower than under higher GHSV conditions. The H2 and CO yield (vol.%) increased as the reaction temperature increased from 400 to 500 °C. Due to occurrence of the WGSR reaction, the actual mole ratio of H2/CO for the reformer products exceeded the stoichiometric ratio of H2/CO for the one-step n-heptane SR reaction.
  • An increase of O2/C ratio meant an increase of the quantity of oxygen reacting with hydrogen and carbon monoxide. In the n-heptane reforming simulation results, both the hydrogen and carbon monoxide mole fractions decreased with an increase of O2/C ratio. A GHSV of 10,000 1/h, O2/C ratio of 0.6 and reaction temperature of 500 °C were preferable in terms of H2 and CO productivity.
  • As the water added to the reforming reactor and H2O/C ratio increased from 1.0 to 2.5, the H2 production increased but the CO content of the reformer product was reduced during the n-heptane reforming simulation process. There was a trade-off between the H2O/C ratio and the reaction temperature. Optimisation of the reforming reaction process and the catalyst to obtain further conversion of the carbon monoxide to hydrogen by the WGSR would improve the produced hydrogen levels even further.
  • For the simulation of n-heptane reforming under typical diesel engine operating conditions, the reaction temperature effect was more pronounced at low reaction temperatures, e.g., from 400 °C to 500 °C, than at high reaction temperatures, e.g., from 500 °C to 550 °C.
  • Through the comparison of reforming bench tests of diesel fuel and n-heptane, the change trends of H2 and CO yield (vol.%) revealed consistence, although differences between the average H2 and CO yield (vol.%) results were obvious. A reduction range of H2 yield (vol.%) of diesel fuel reforming from 10.9% to 20.1% compared to n-heptane reforming experiments was achieved at typical reaction temperatures. The characteristics of n-heptane reforming could represent the H2 and CO yield (vol.%) features of diesel fuel reforming under typical reaction temperature to a certain extent.

Author Contributions

H.C. conceived and developed the paper; X.W. conducted the simulation and experiments; Z.P. and H.X. provided guidance and reviews throughout the development of this paper.

Funding

This research was funded by “State Key Laboratory of Engines at Tianjin University (K2018-09)”, “the Key Laboratory of Marine Power Engineering & Technology, Ministry of Transport (KLMPET 2016-01)” and “research fund of Center for Materials Research and Analysis, WHUT (2018KFJJ07)”.

Acknowledgments

The authors would like to thank CSSC Huangpu Wenchong Shipbuilding Company Limited for financial support.

Conflicts of Interest

The authors declare no conflict of interest.

Nomenclature

GHSVgas hourly space velocity
SRsteam reforming
ATRautothermal reforming
POXpartial oxidation reforming
WGSRwater gas shift reaction
LLNLLawrence Livermore National Laboratory
GC-MSgas chromatograph-mass spectrometer
vol.volume
ROPrate-of-production
1/h1/hour
Apre-exponential factor
s−1second−1
ntemperature index
Eactivation energy
Jjoule
molmole
cmcentimetre
kgkilogram
wtweight

References

  1. Tsolakis, A.; Megaritis, A.; Wyszynski, M.L. Low temperature exhaust gas fuel reforming of diesel fuel. Fuel 2004, 83, 1837–1845. [Google Scholar] [CrossRef]
  2. Tsolakis, A.; Megaritis, A.; Wyszynski, M.L. Application of exhaust gas fuel reforming in compression ignition engines fuelled by diesel and biodiesel fuel mixtures. Energy Fuels 2003, 17, 1464–1473. [Google Scholar] [CrossRef]
  3. Lee, J.; Song, S.; Chun, K.M. Study of n-C12H26 reforming over DFC catalyst in a simulated diesel exhaust. Int. J. Automot. Technol. 2012, 13, 23–31. [Google Scholar] [CrossRef]
  4. Xu, L.; Mi, W.; Su, Q. Hydrogen production through diesel steam reforming over rare-earth promoted Ni/γ-Al2O3 catalysts. J. Nat. Gas Chem. 2011, 20, 287–293. [Google Scholar] [CrossRef]
  5. Boon, J.; Van Dijk, E.; De Munck, S.; Van den Brink, R. Steam reforming of commercial ultra-low sulphur diesel. J. Power Sources 2011, 196, 5928–5935. [Google Scholar] [CrossRef]
  6. Achouri, I.E.; Abatzoglou, N.; Fauteux-Lefebvre, C.; Braidy, N. Diesel steam reforming: Comparison of two nickel aluminate catalysts prepared by wet-impregnation and co-precipitation. Catal. Today 2013, 207, 13–20. [Google Scholar] [CrossRef]
  7. Wang, P.J.; Zhou, L.; Li, G.L.; Lin, H.X.; Shao, Z.G.; Zhang, X.F.; Yi, B.L. Direct internal reforming molten carbonate fuel cell with core-shell catalyst. Int. J. Hydrogen Energy 2012, 37, 2588–2595. [Google Scholar] [CrossRef]
  8. Meißner, J.; Pasel, J.; Peters, R.; Samsun, R.C.; Thimm, F.; Stolten, D. Quantitative analysis of sub-ppm traces of hydrocarbons in the product gas from diesel reforming. Int. J. Hydrogen Energy 2019, 44, 4020–4030. [Google Scholar] [CrossRef]
  9. Kang, I.; Bae, J.; Bae, G. Performance comparison of autothermal reforming for liquid hydrocarbons, gasoline and diesel for fuel cell applications. J. Power Sources 2006, 163, 538–546. [Google Scholar] [CrossRef]
  10. Choi, W.Y.; Lee, J.W.; Kim, M.J.; Park, C.J.; Jeong, Y.H.; Choi, H.Y.; Park, N.K.; Lee, T.J. Durability tests of Rh/Al-Ce-Zr catalysts coated on NiCrAl metal foam for ATR of dodecane at high temperature. Int. J. Precis. Eng. Manuf.-Green Technol. 2017, 4, 183–189. [Google Scholar] [CrossRef]
  11. Thiyagarajan, S.; Herfatmanesh, M.R.; Geo, V.E.; Peng, Z. Experimental investigation into the effect of magnetic fuel reforming on diesel combustion and emissions running on wheat germ and pine oil. Fuel Process. Technol. 2019, 186, 116–124. [Google Scholar] [CrossRef]
  12. Huerta, G.V.; Jordan, J.A.; Dragon, M.; Leites, K.; Kabelac, S. Energy analysis of the diesel pre-reforming solid oxide fuel cell system with anode off-gas recycling in the SchIBZ project. Pat I: Modeling and validation. Int. J. Hydrogen Energy 2018, 43, 16684–16693. [Google Scholar] [CrossRef]
  13. Garcia-Diez, E.; Garcia-Labiano, F.; De, L.F.; Abad, A.; Gayan, P.; Adanez, J. Autothermal chemical looping reforming process of different fossil liquid fuels. Int. J. Hydrogen Energy 2017, 42, 13633–13640. [Google Scholar] [CrossRef]
  14. Lee, W.S.; Dong, G.J.; Jung, S.Y.; Lee, S.C.; Dong, S.H.; Hwang, B.W.; Jae, C.K. N-Dodecane autothermal reforming properties of Ni-Al based catalysts prepared by various methods. Top. Catal. 2017, 60, 727–734. [Google Scholar] [CrossRef]
  15. Ra, Y.; Reitz, R.D. A combustion model for IC engine combustion simulations with multi-component fuels. Combust. Flame 2011, 158, 69–90. [Google Scholar] [CrossRef]
  16. Palm, C.; Cremer, P.; Peters, R.; Stolten, D. Small-scale testing of a precious metal catalyst in the autothermal reforming of various hydrocarbon feeds. J. Power Sources 2002, 106, 231–237. [Google Scholar] [CrossRef]
  17. Tsolakis, A.; Megaritis, A.; Golunski, S.E. Reaction profiles during exhaust-assisted reforming of diesel engine fuels. Energy Fuels 2005, 19, 744–752. [Google Scholar] [CrossRef]
  18. Tsolakis, A.; Golunski, S.E. Sensitivity of process efficiency to reaction routes in exhaust-gas reforming of diesel fuel. Chem. Eng. J. 2006, 117, 131–136. [Google Scholar] [CrossRef]
  19. Amphlett, J.C.; Mann, R.F.; Peppley, B.A.; Roberge, P.R.; Rodrigues, A.; Salvador, J.P. Simulation of a 250kW diesel fuel processor/PEM fuel cell system. J. Power Sources 1998, 71, 179–184. [Google Scholar] [CrossRef]
  20. Cheekatamarla, P.K.; Finnerty, C.M. Reforming catalysts for hydrogen generation in fuel cell applications. J. Power Sources 2006, 160, 490–499. [Google Scholar] [CrossRef]
  21. Ghenciu, A.F. Review of fuel processing catalysts for hydrogen production in PEM fuel cell systems. Curr. Opin. Solid State Mater. Sci. 2002, 6, 389–399. [Google Scholar] [CrossRef]
  22. Craciun, R.; Shereck, B.; Gorte, R.J. Kinetic studies of methane steam reforming on ceria-supported Pd. Catal. Lett. 1998, 51, 149–153. [Google Scholar] [CrossRef]
  23. Wang, X.; Gorte, R.J. A study of steam reforming of hydrocarbon fuels on Pd/ceria. Appl. Catal. A-Gen. 2002, 224, 209–218. [Google Scholar] [CrossRef]
  24. Montini, T.; Melchionna, M.; Monai, M.; Fornasiero, P. Fundamentals and catalytic applications of CeO2-Based materials. Chem. Rev. 2016, 116, 5987–6041. [Google Scholar] [CrossRef] [PubMed]
  25. Devaiah, D.; Reddy, L.H.; Park, S.E.; Reddy, B.M. Ceria-zirconia mixed oxides: Synthetic methods and applications. Catal. Rev. 2018, 60, 177–277. [Google Scholar] [CrossRef]
  26. Hamoule, T.; Peyrovi, M.H.; Rashidzadeh, M.; Toosi, M.R. Catalytic reforming of n-heptane over Pt/Al-HMS catalysts. Catal. Commun. 2011, 16, 234–239. [Google Scholar] [CrossRef]
  27. Abashar, M.E.E. Steam reforming of n-heptane for production of hydrogen and syngas. Int. J. Hydrogen Energy 2013, 38, 861–869. [Google Scholar] [CrossRef]
  28. Gonzalez-Marcos, M.P.; Inarra, B.; Guil, J.M.; Gutierrez-Ortiz, M.A. Development of an industrial characterisation method for naphtha reforming bimetallic Pt-Sn/Al2O3 catalysts through n-heptane reforming test reactions. Catal. Today 2005, 44, 685–692. [Google Scholar] [CrossRef]
  29. Koop, J.; Deutschmann, O. Detailed surface reaction mechanism for Pt-catalyzed abatement of automotive exhaust gases. Appl. Catal. B-Environ. 2009, 91, 47–58. [Google Scholar] [CrossRef]
  30. Zamostny, P.; Karaba, A.; Olahova, N.; Petru, J.; Patera, J.; Hajekova, E.; Bajus, M.; Belohlav, Z. Generalized model of n-heptane pyrolysis and steam cracking kinetics based on automated reaction network generation. J. Anal. Appl. Pyrol. 2014, 109, 159–167. [Google Scholar] [CrossRef]
  31. Chatterjee, D.; Deutschmann, O.; Warnatz, J. Detailed surface reaction mechanism in a three-way catalyst. Faraday Discuss. 2001, 119, 371–384. [Google Scholar] [CrossRef]
  32. Curran, H.J.; Gaffuri, P.; Pitz, W.J.; Westbrook, C.K. A comprehensive modelling study of n-heptane oxidation. Combust. Flame 1998, 114, 149–177. [Google Scholar] [CrossRef]
  33. Zhang, K.; Banyon, C.; Bugler, J.; Curran, H.J.; Rodriguez, A.; Herbinet, O.; Battin-Leclerc, F.; B’Chir, C.; Heufer, K.A. An updated experimental and kinetic modelling study of n-heptane oxidation. Combust. Flame 2016, 172, 116–135. [Google Scholar] [CrossRef]
  34. Reaction Design. Available online: http://www.reactiondesign.com/products/chemkin/chemkin-2/ (accessed on 10 January 2019).
  35. Chen, H.; Shen, H.; Wu, T.; Zuo, C. Numerical simulation and experimental research on combustion characteristics of compression-ignition engine under an O2/CO2 atmosphere. HKIE Trans. 2017, 24, 121–132. [Google Scholar] [CrossRef]
  36. Kim, D.H.; Kang, J.S.; Lee, Y.J.; Park, N.K.; Kim, Y.C.; Hong, S.I.; Moon, D.J. Steam reforming of n-hexadecane over noble metal-modified Ni-based catalysts. Catal. Today 2008, 136, 228–234. [Google Scholar] [CrossRef]
  37. Tsolakis, A.; Megaritis, A. Catalytic exhaust gas fuel reforming for diesel engines-effects of water addition on hydrogen production and fuel conversion efficiency. Int. J. Hydrogen Energy 2004, 29, 1409–1419. [Google Scholar] [CrossRef]
  38. Mariagiovanna, M. On-board fuel processor modelling for hydrogen-enriched gasoline fuelled engine. Int. J. Hydrogen Energy 2005, 30, 1483–1490. [Google Scholar]
  39. Dong, J.M.; Sreekumar, K.; Sang, D.L.; Lee, B.G.; Kim, H.S. Study on gasoline fuel processor system for fuel-cell powered vehicles application. Appl. Catal. A-Gen. 2001, 215, 1–9. [Google Scholar]
  40. Tottrup, P.B. Evaluation of intrinsic steam reforming kinetic parameters from rate measurements on full particle size. Appl. Catal. 1982, 4, 377–389. [Google Scholar] [CrossRef]
  41. Nah, C.Y.; Palanki, S. Analysis of heptane autothermal reformer to generate hydrogen for fuel cell applications. Int. J. Hydrogen Energy 2009, 34, 8566–8573. [Google Scholar] [CrossRef]
  42. Whittington, B.I.; Jiang, C.J.; Trimm, D.L. The relative importance of catalytic oxidation, steam reforming and water-gas shift reactions. Catal. Today 1995, 26, 41–45. [Google Scholar] [CrossRef]
Figure 1. Reforming catalyst.
Energies 12 01056 g001
Figure 2. Catalytic reformer setup: (a) Catalytic reforming reactor (b) Schematic of reforming experimental set-up.
Energies 12 01056 g002
Figure 3. GHSV conditions: 10,000, 15,000, 20,000 and 25,000 1/h at different reaction temperatures: (a) 400 °C; (b) 450 °C; (c) 500 °C; (d) 550 °C.
Energies 12 01056 g003
Figure 4. O2/C ratio conditions: 0.6, 0.8, 1.0 and 1.2 at different reaction temperatures: (a) 400 °C; (b) 450 °C; (c) 500 °C; (d) 550 °C.
Energies 12 01056 g004
Figure 5. H2O/C ratio conditions: 1.0, 1.5, 2.0 and 2.5 at different reaction temperatures: (a) 400 °C; (b) 450 °C; (c) 500 °C; (d) 550 °C.
Energies 12 01056 g005
Figure 6. Sensitivity analysis and ROP analysis of the reaction steps on H2 production: (a) Sensitivity analysis; (b) ROP analysis.
Energies 12 01056 g006
Figure 7. H2 and CO yield comparison results at different reaction temperatures: (a) comparison of simulations and experiments; (b) error bars of the experimental results.
Energies 12 01056 g007
Table 1. Significant reactions and related rate constant expressions for n-heptane gas phase reaction.
Reaction StepElementary-Step ReactionAnE
R.1C7H16 + O2 = C7H15 + HO22.8 × 10140.047,180.0
R.2C7H16 + H = C7H15 + H25.6 × 1072.07667.0
R.3C7H16 = C7H15 + H3.972 × 1019−0.95103,200.0
R.4C7H16 + OH = C7H15 + H2O8.600 × 1091.11815.0
R.5C7H16 + HO2 = C7H15 + H2O28.000 × 10120.019,300.0
R.6C7H15 + O2 = C7H15O22.000 × 10120.00.0
R.7C5H11CO = C5H11 + CO1.000 × 10110.09600.0
R.8C7H15O2 = C7H14O2H6.000 × 10110.020,380.0
R.9C7H16 = C4H9 + C3H72.000 × 10160.080,710.0
R.10C7H14O2H + O2 = C7H14O2HO22.34 × 10110.00.0
R.11C7H14O2HO2 = C7H14O3 + OH2.965 × 10130.026,700.0
R.12C7H14O3 = C5H11CO + CH2O + OH1.000 × 10160.042,400.0
R.13C5H11CO = C2H5 + C3H6 + CO1.000 × 10110.09600.0
R.14C5H11 = C2H5 + C3H63.200 × 10130.028,300.0
R.15C7H15 = CH3 + 2C3H63.000 × 10130.029,800.0
R.16C7H15 = C2H5 + C2H4 + C3H61.200 × 10130.028,300.0
R.17C3H6 + OH = CH3CHO + CH33.500 × 10110.00.0
R.18CH3CHO + OH = CH3 + CO + H2O1.000 × 10130.00.0
R.19C4H9 = C2H5 + C2H42.500 × 10130.028,810.0
R.20C3H7 = C2H4 + CH39.600 × 10130.030,950.0
R.21C3H6 = C2H3 + CH36.150 × 10150.085,500.0
R.22CH3 + HO2 = CH2O + H + OH4.300 × 10130.00.0
R.23CO + OH = CO2 + H3.510 × 1071.3−758.0
R.24O + OH = O2 + H4.000 × 1014−0.50.0
R.25H + O2 + M = HO2 + M2.800 × 1018−0.860.0
R.26HO2 + HO2 = H2O2 + O22.000 × 10120.00.0
R.27OH + OH (+M) = H2O2 (+M)7.600 × 10¹³−0.370.0
R.28CH2O + OH = HCO + H2O2.430 × 10101.18−447.0
R.29CH2O + HO2 = HCO + H2O23.000 × 10120.08000.0
R.30HCO + O2 = HO2 + CO3.300 × 1013−0.40.0
R.31CH4 + O = CH3 + OH1.020 × 10191.58604.0
R.32CH4 + HO2 = CH3 + H2O21.000 × 10130.018,700.0
R.33C2H4 + OH = CH2O + CH36.000 × 10130.0960.0
R.34H + O2 + N2 = HO2 + N22.600 × 1019−1.240.0
R.35C2H5 + O2 = C2H4 + HO22.000 × 10100.0−2200.0
R.36CH4 + 2H2O = CO2 + 4H22.290 × 10120.020,000.0
R.37CO + H2O = CO2 + H26.200 × 10150.020,000.0
R.38C3H6 + 3H2O ⇒ 3CO + 6H29.49 × 10200.010,000.0
R.39C3H5+3H2O ⇒ 3CO + 5.5H29.49 × 10150.067,800.0
R.40C2H5 + 2H2O ⇒ 2CO + 4.5H29.49 × 10150.010,000.0
R.41C2H4 + 2H2O ⇒ 2CO + 4H29.49 × 10200.018,000.0
R.42CH3 + H2O ⇒ CO + 2.5H29.49 × 10160.067,800.0
R.43H + C2H5 ⇒ H2 + C2H42.000 × 10120.00.0
R.44C2H4 + H = C2H3 + H25.670 × 10190.062,900.0
R.45C2H6 + H = C2H5 + H21.400 × 10190.031,000.0
R.46C2H5 = C2H4 + H1.020 × 1043−9.122,400.0
R.47H2 + CO(+M) ⇔ CH2O(+M)4.300 × 1071.579,600.0
R.482O + M ⇔ O2 + M1.200 × 1017−1.00.0
R.49H + HO2 ⇔ O2 + H24.480 × 10130.01068.0
R.50H + CH4 ⇔ CH3 + H26.600 × 10131.62010,840.0
R.51H + HCO ⇔ H2 + CO7.340 × 10130.00.0
R.52H + CH2O ⇔ HCO + H25.740 × 10171.9002742.0
R.532H + M ⇔ H2 + M1.000 × 10181.00.0
R.542H + H2 ⇔ 2H29.000 × 1016−0.60.0
R.552H + H2O ⇔ H2 + H2O6.000 × 1019−1.250.0
R.562H + CO2 ⇔ H2 + CO25.500 × 1020−2.00.0
R.57O2 + CO ⇔ O + CO22.500 × 10120.047,800.0
R.58O + CO(+M) ⇔ CO2(+M)1.800 × 10100.02385.0
Table 2. Significant reactions and related rate constant expressions for propene surface reaction.
Reaction StepElementary-Step ReactionAnE
R.1CO2 + Pt(S) ⇒ CO2(S)5.000 × 10−30.00.0
R.2O + Pt(S) +Pt(S) ⇒ O(S) + O(S)7.000 × 10−20.00.0
R.3C3H6 + Pt(S) + Pt(S) ⇒ C3H6(S)9.800 × 10−10.00.0
R.4C3H6 + O(S) + Pt(S) ⇒ C3H5(S) + OH(S)5.000 × 10−20.00.0
R.5H2O + Pt(S) ⇒ H2O(S)4.600 × 10−20.00.0
R.6CO + Pt(S) ⇒ CO(S)8.400 × 10−10.00.0
R.7H2 + Pt(S) + Pt(S) ⇒ H(S) + H(S)4.600 × 10−20.00.0
R.8O(S) + O(S) ⇒ Pt(S) + Pt(S) + O23.700 × 10210.0232.2
R.9C3H6(S) ⇒ C3H6 + Pt(S) + Pt(S)1.000 × 10130.072.7
R.10C3H5(S) + OH(S) ⇒ C3H6 O(S) + Pt(S)3.700 × 10210.031.0
R.11H(S) + H(S) ⇒ H2 + Pt(S) + Pt(S)3.700 × 10210.067.4
R.12H2O(S) ⇒ Pt(S) + H2O1.000 × 10130.040.3
R.13CO(S) ⇒ CO + Pt(S)1.000 × 10130.0136.4
R.14CO2(S) ⇒ CO2 + Pt(S)1.000 × 10130.027.1
R.15C3H5(S) + 5O(S) + 2Pt(S) ⇒ 5OH(S) + 3C(S)3.700 × 10210.095.0
R.16C3H6(S) ⇒ CC2H5(S) + H(S)1.000 × 10130.075.4
R.17CC2H5(S) + H(S) ⇒ C3H6(S)3.700 × 10210.048.8
R.18CC2H5(S) + Pt(S) ⇒ C2H3(S) + CH2(S)3.700 × 10210.0108.2
R.19C2H3(S) + CH2(S) ⇒ CC2H5(S) + Pt(S)3.700 × 10210.03.2
R.20C2H3(S) + Pt(S) ⇒ CH3(S) + C(S)3.700 × 10210.046.0
R.21CH3(S) + C(S) ⇒ C2H3(S) + Pt(S)3.700 × 10210.046.9
R.22CH3(S) + Pt(S) ⇒ CH2(S) + H(S)1.260 × 10210.070.4
R.23CH2(S) + H(S) ⇒ CH3(S) + Pt(S)3.090 × 10210.00.0
R.24CH2(S) + Pt(S) ⇒ CH(S) + H(S)7.000 × 10210.059.2
R.25CH(S) + H(S) ⇒ CH2(S) + Pt(S)3.090 × 10210.00.0
R.26CH(S) + Pt(S) ⇒ C(S) + H(S)3.090 × 10210.00.0
R.27C(S) + H(S) ⇒ CH(S) + Pt(S)1.250 × 10210.0138.0
R.28C2H3(S) + O(S) ⇒ Pt(S) + CH3CO(S)3.700 × 10190.062.3
R.29CH3CO(S) + Pt(S) ⇒ C2H3(S) + O(S)3.700 × 10210.0196.7
R.30CH3(S) + CO(S) ⇒ Pt(S) + CH3CO(S)3.700 × 10210.082.9
R.31CH3CO(S) + Pt(S) ⇒ CH3(S) + CO(S)3.700 × 10210.00.0
R.32CH3(S) + O(S) ⇒ CH2(S) + OH(S)3.700 × 10210.036.6
R.33CH2(S) + OH(S) ⇒ CH3(S) + O(S)3.700 × 10210.025.1
R.34CH2(S) + O(S) ⇒ CH(S) + OH(S)3.700 × 10210.025.1
R.35CH(S) + OH(S) ⇒ CH2(S) + O(S)3.700 × 10210.025.2
R.36CH(S) + O(S) ⇒ C(S) + OH(S)3.700 × 10210.025.1
R.37C(S) + OH(S) ⇒ CH(S) + O(S)3.700 × 10210.0224.8
R.38O(S) + H(S) ⇒ OH(S) + Pt(S)3.700 × 10210.011.5
R.39OH(S) + Pt(S) ⇒ O(S) + H(S)5.770 × 10220.074.9
R.40H(S) + OH(S) ⇒ H2O(S) + Pt(S)3.700 × 10210.017.4
R.41H2O(S) + Pt(S) ⇒ H(S) + OH(S)3.660 × 10210.073.6
R.42OH(S) + OH(S) ⇒ H2O(S) + O(S)3.700 × 10210.048.2
R.43H2O(S) + O(S) ⇒ OH(S) + OH(S)2.350 × 10210.041.0
R.44CO2(S) + Pt(S) ⇒ CO(S) + O(S)3.700 × 10210.0165.1
R.45OH + Pt(S) ⇒ OH(S)1.0000.00.0
R.46OH(S) ⇒ OH + Pt(S)1.000 × 10130.0192.8
R.47CH4 + 2Pt(S) ⇒ CH3(S) + H(S)4.6334 × 10200.50.0

