Article

Effect of LaNi3 Amorphous Alloy Nanopowders on the Performance and Hydrogen Storage Properties of MgH2

Nanotechnology and Advanced Materials Program, Energy and Building Research, Center, Kuwait Institute for Scientific Research, Safat 13109, Kuwait
*
Authors to whom correspondence should be addressed.
Energies 2019, 12(6), 1005; https://doi.org/10.3390/en12061005
Submission received: 22 February 2019 / Revised: 11 March 2019 / Accepted: 12 March 2019 / Published: 14 March 2019
(This article belongs to the Section A5: Hydrogen Energy)

Abstract

:
Due to its affordable price, abundance, high storage capacity, low recycling coast, and easy processing, Mg metal is considered as a promising hydrogen storage material. However, the poor de/rehydrogenation kinetics and strong stability of MgH2 must be improved before proposing this material for applications. Doping MgH2 powders with one or more catalytic agents is one common approach leading to obvious improving on the behavior of MgH2. The present study was undertaken to investigate the effect of doping MgH2 with 7 wt% of amorphous(a)-LaNi3 nanopowders on hydrogenation/dehydrogenation behavior of the metal hydride powders. The results have shown that rod milling MgH2 with a-LaNi3 abrasive nanopowders led to disintegrate microscale-MgH2 powders to nanolevel. The final nanocomposite product obtained after 50 h–100 h of rod milling revealed superior hydrogenation kinetics, indexed by short time (8 min) required to absorb 6 wt% of H2 at 200 °C/10 bar. At 225 °C/200 mbar, nanocomposite powders revealed outstanding dehydrogenation kinetics, characterized by very short time (2 min) needed to release 6 wt% of H2. This new tailored solid-hydrogen storage system experienced long cycle-life-time (2000 h) at 225 °C without obeying to sever degradation on its kinetics and/or storage capacity.

1. Introduction

Hydrogen, which is a major energy carrier has received great attention due to its unique properties. In contrast to fossil fuels, hydrogen does not emit carbon dioxide and other harmful air pollutants upon burning [1]. Hydrogen storage is a major issue that governs utilization of hydrogen daily life applications. Reference to environmental and health point of view, fossil fuels, which emit carbon dioxide and other harmful air pollutants when burned have led to wide range of public health and environmental costs at the global levels [2]. Since the last decade, hydrogen has been widely proposed as promising future alternative for replacing fossil fuels and delivering clean energy required almost for all sectors [3,4,5]. In addition, hydrogen has become a favorite energy carrier [6] because it has a very high calorimetric value, with a lower heating of 120 MJ kg−1, compared to petrol, which is approximately a third of this at 43 MJ/kg [7].
The idea of hydrogen economy is based on the possibility of generating hydrogen gas by water decomposing, using primary sources of renewable energy, such as solar energy, wind energy, tidal energy, or biomass decomposition [8]. Recent studies have pointed out that hydrogen fuel costs are reasonable and are therefore can be considered as an ideal candidate to replace fossil fuels as an energy carrier [9]. In fact, hydrogen storage is considered to be one of the most crucial factors of hydrogen economy that governs the future of utilization of hydrogen energy for real applications [10]. Metallic Mg and its-based materials have been considered as the most candidate solid-state hydrogen storage materials. Mg has become a desired hydrogen storage material because of its natural abundance, low cost, light weight, high gravimetric (7.60 wt%) and volumetric (110 g/L) hydrogen storage capacities. Recently, it has been reported that waste Mg-based alloys such as Mg-Al [11] and Mg-Gd [12] were successfully used as feedstock materials to produce good quality MgH2. More recently, the formation of Mg2FeH6 powders, starting from MgH2 and plain carbon steel powders, used as precursors has been demonstrated by Polanski et al. [13]. They claimed that magnesium iron hydride can be industrially manufactured at high yields using steel scrap, which can lower the cost of the manufacturing process.
In spite of these attractive properties of MgH2 there are major drawback restricting its implementation such its high stablity, possessing a large negative heat of formation (∆Hfor = −75 kJ/mol.H2) [14]. It possessed very slow kinetics of dehydrogenation at temperatures less than 350 °C [15]. In addition, Mg metal is very sensitive to the surrounded atmosphere, particularly to oxygen. Furthermore, the low thermal conductivity of MgH2 system (0.4 W/mK [16]) is considered to be a serious problem since heat transfer is a very important factor required for both hydrogenation and dehydrogenation processes. Within the last two decades, great efforts have been achieved to enhance the hydrogenation/dehydrogenation kinetics of MgH2, using long term of ball milling [17], sever plastic deformation [18], alloying Mg with metallic elements [19], and doping MgH2 powders with different types of catalytic agents, including pure metals [20], metal alloys [21,22,23], metal oxides [24], carbides [25], hydrides [26,27,28,29], fluorides [30,31], and chlorides [32]. These efforts and their corresponding achievements were summarized and recently published in many useful review articles (see for example [33,34]).
Apart from this long list of traditional catalysts with their beneficial effect of enhancing the behavior of MgH2, a new category of metastable phases of big-cube Zr2Ni [6], high-thermal stable metallic glassy powders of Zr70Ni20Pd10 [35], V45Zr20Ni20Cu10Al3Pd2 [36], Ti2Ni [37] systems, Al–Cu–Fe quasicrystal [38], Zr2Ni [39] amorphous alloy, have been recently used as modifier additives for MgH2 binary system. These additives changed the behavior of MgH2 to have superior kinetics at low temperature, in the range between 175 °C to 250 °C [35,38,39]. Moreover, the noncrystalline structure of amorphous catalytic alloys as well as other metastable systems maintained their short-range and medium-range order structures without obeying to any phase transformations during cyclic process for several hundred hours [6].
The present study has been addressed in part to investigate the influence of doping mechanically-reacted MgH2 powders with 7 wt% of amorphous-LaNi3 powder on four major performance characteristics of MgH2, i.e., (i) storage capacity, (ii) thermal stability, (iii) de/rehydrogenation kinetics, and (iv) cycle-life-time. Moreover, this work elucidates the effect of doping time on the homogeneity of composite MgH2/7 wt% amorphous-LaNi3 and their influences on the kinetics behavior of MgH2. As far as the authors know, this new solid-hydrogen storage system has never been reported before.

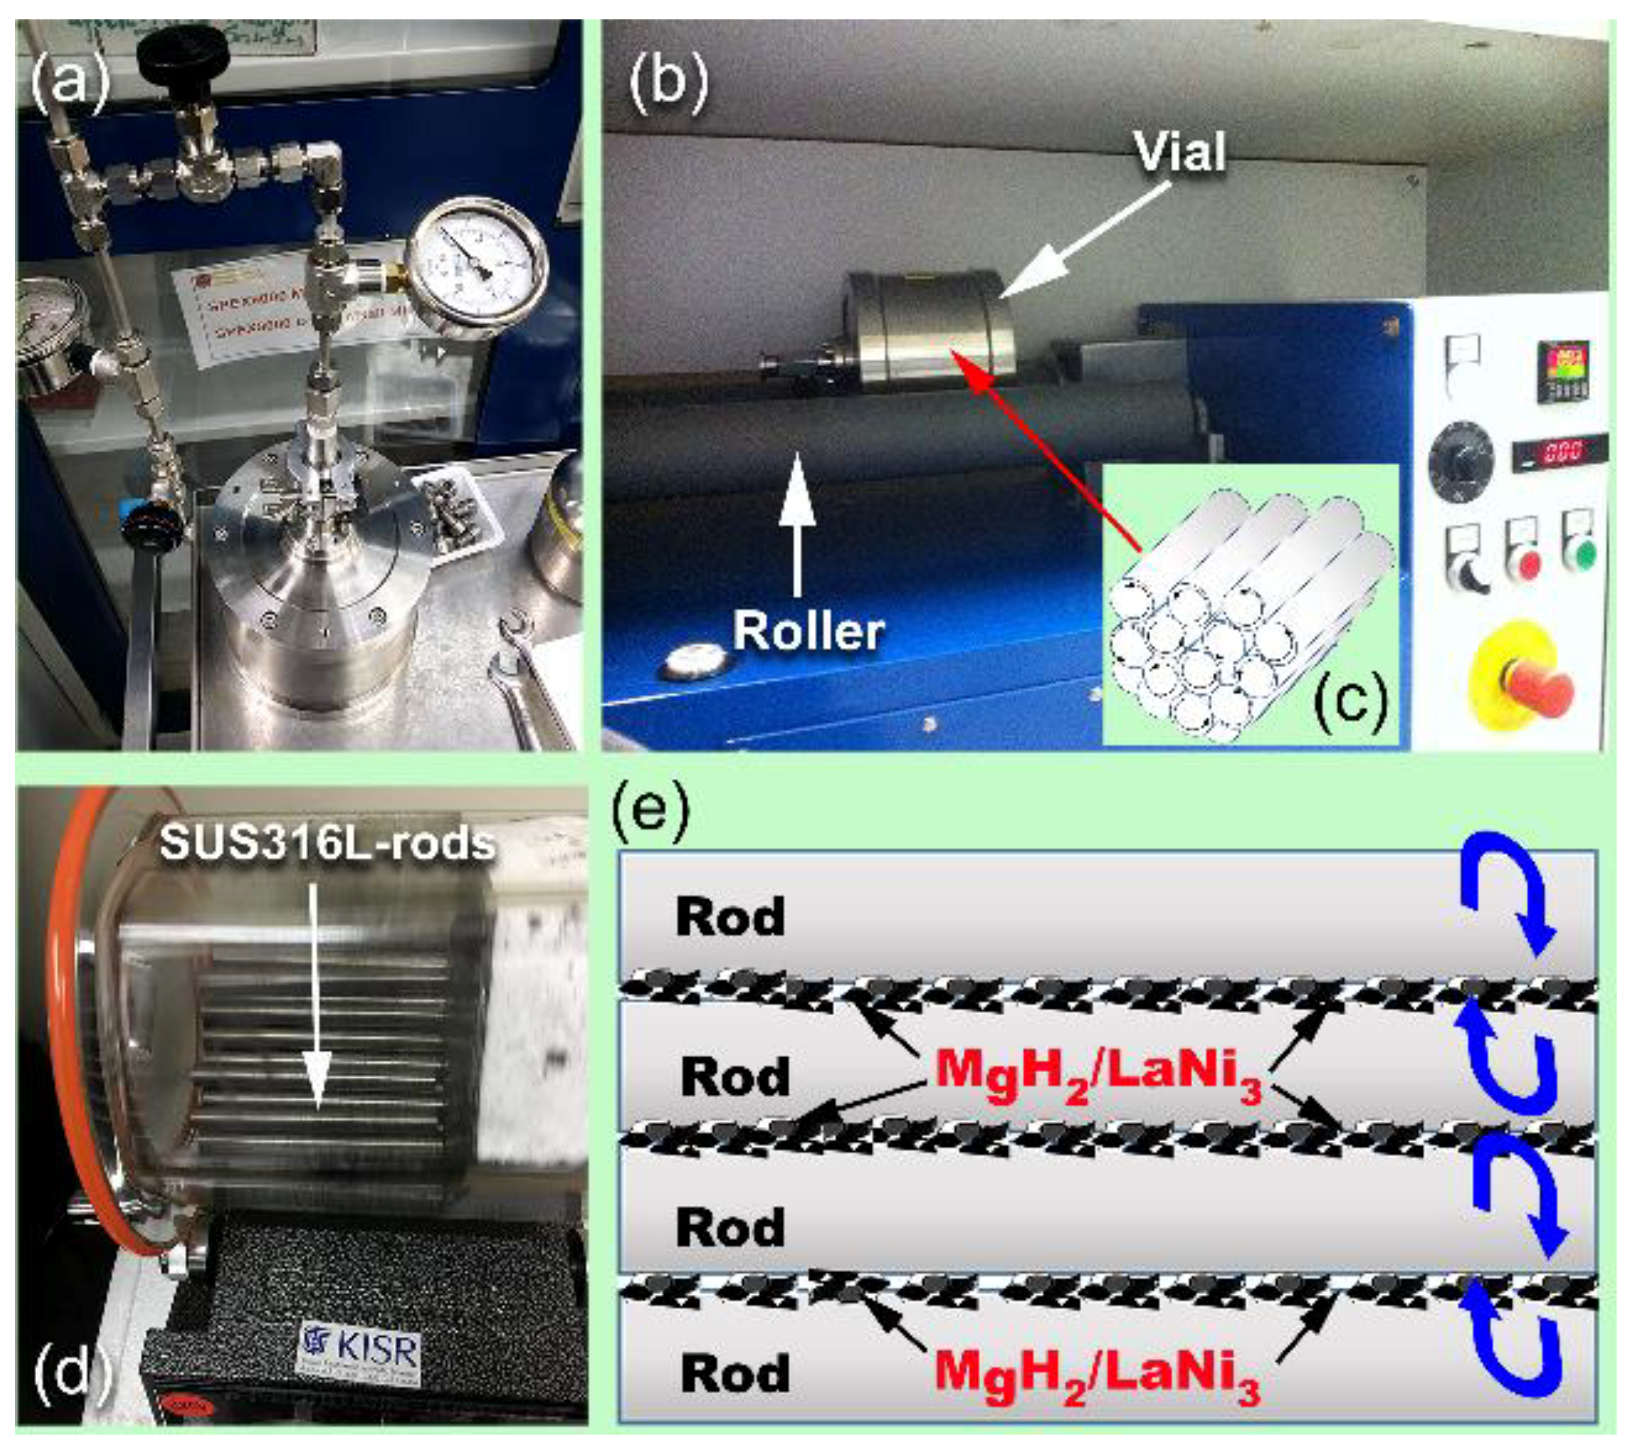
2. Materials and Methods

Bulk LaNi3 (atomic %) was fabricated by arc melting of La (99.9 wt%, #261130, supplied by Sigma-Aldrich, New York, NY, USA), and Ni foil (thickness 0.5 mm, 99.98 wt%, #357553, Sigma-Aldrich). The starting materials were balanced to give nominal composition of La44.1Ni55.9 (wt%), etched with 70% H2O + 30% HCl, rinsed by ethanol and then dried at 200 °C for 3 h. An arc melter (AM 200, provided by Edmund Bühler GmbH, Bodelshausen, Germany) was employed in Zr-gettered Ar atmosphere to fabricate the desired LaNi3 alloy. A total weight of 100 g (44.1 g La and 55.9 g Ni) were placed in a circular-shaped groove of water-cooled Cu crucible. The process was started by melting Zr balanced and then melting the mixture of La and Ni. The metallic button obtained after melting was turned over and re-melted for 5 times to ensure the homogeneity of fabricated alloy. The master alloy was then removed out from the arc melter, washed by acetone, ethanol and crushed down into small pieces (~10 mm), using 60 ton cold press. The structure and composition of the fabricated intermetallic compound were examined by X-ray diffraction and inductively coupled plasma mass spectrometry (ICP-MS), respectively. The chemical composition of the examined sample was found to be 44.5 wt% La and 55.5 wt% Ni with a crystal structure typical to PDF #01-090-5121.
On the other hand, MgH2 powders were prepared starting from Mg metal powders (~80 m, 99.8% provided by Alfa Aesar, New York, NY, USA), and hydrogen gas (99.999 wt%). An amount of 5 g Mg was balanced inside a He gas atmosphere (99.99 wt%)—glove box. The powders were then sealed together with 50 hardened steel balls in a hardened steel vial (220 mL in volume), using a gas-temperature-monitoring system (GST; supplied by evico magnetic, Germany). The ball-to-powder weight ratio was 40:1. The vial was then evacuated to the level of 10−3 bar before introducing H2 gas to fill the vial with a pressure of 50 bar. The reactive ball milling (RBM) process was carried out at room temperature, using a high energy ball mill (Planetary Ball Mill, model PM 400, Retsch, Germany). The powders were discharged from the vial inside the glove box after selected RBM time. The as-synthesized MgH2 powders were then mixed in the glove with 7 wt% of a-LaNi3 powders, using an agate mortar and pestle. The mixed powders were then charged together with 50 Cr-steel bars into Cr-steel vial and sealed under hydrogen gas pressure of 10 bar. The system was then mounted on a low-energy rod mill (Figure 1).
The preliminary experiments conducted to investigate the most suitable molar fraction a-LaNi3 additives implied that doping MgH2 with 5 wt% a-LaNi3 did not reveal pronounced improvement if the hydrogenation/dehydrogenation kinetics. In contrast, adding 10 wt% of a-LaNi3 maintained the good kinetics of MgH2 but with lower hydrogen storage capacity (~4.5 wt% H2). This was attributed to high molecular weight of the additives.
The metallic pieces were then disintegrated into coarse particles (~195 m–220 m in diameter), using vibratory disc mill provided by Retsch-Germany (model RS 200). The powders were then charged into Cr-steel vial (225 mL in volume) inside a glove box and sealed under He-atmosphere with 50 Cr-steel balls (12 mm in diameter). The system was then mountained high energy ball mill (Planetary Mono Mill PULVERISETTE 6, Fritsch, Germany) and continuously milled for 6 h, 36 h and 50 h at an ambient temperature. The apparent activation energy for the synthesized MgH2-composites was investigated, using Arrhenius approach with different heating rates of 10, 20, 30, and 40 °C/min. The hydrogen absorption/desorption kinetics were investigated via Sievert’s method, using PCTPro-2000, provided by Setaram Instrumentation, France, under pressurized hydrogen, in the range between 200 mbar (desorption) to 10 bar (absorption). The samples were examined at different temperatures of 125, 150, 175, 200, and 225 °C.

3. Results

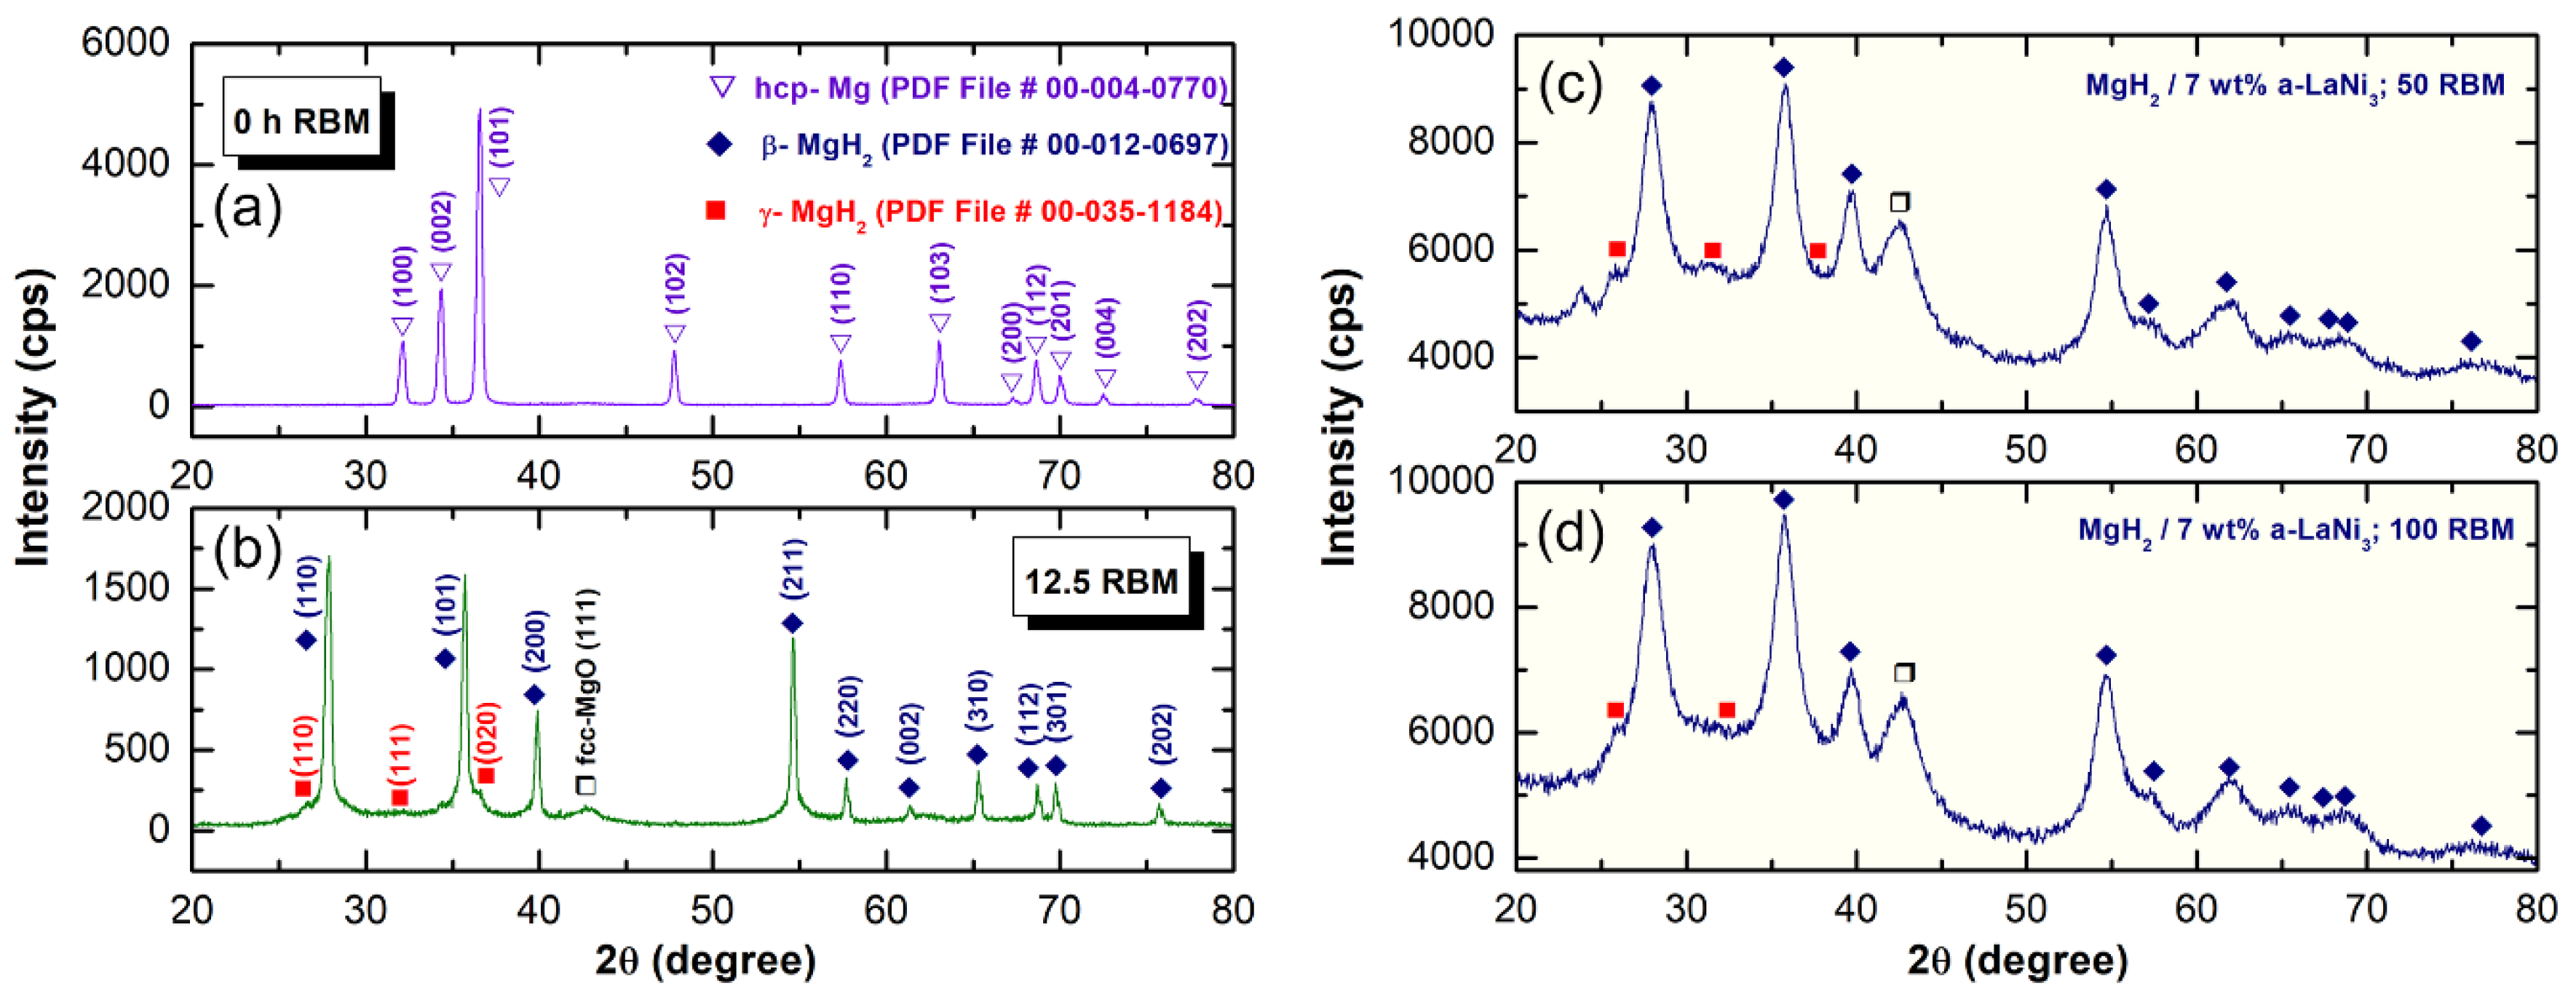
3.1. Crystal Structure

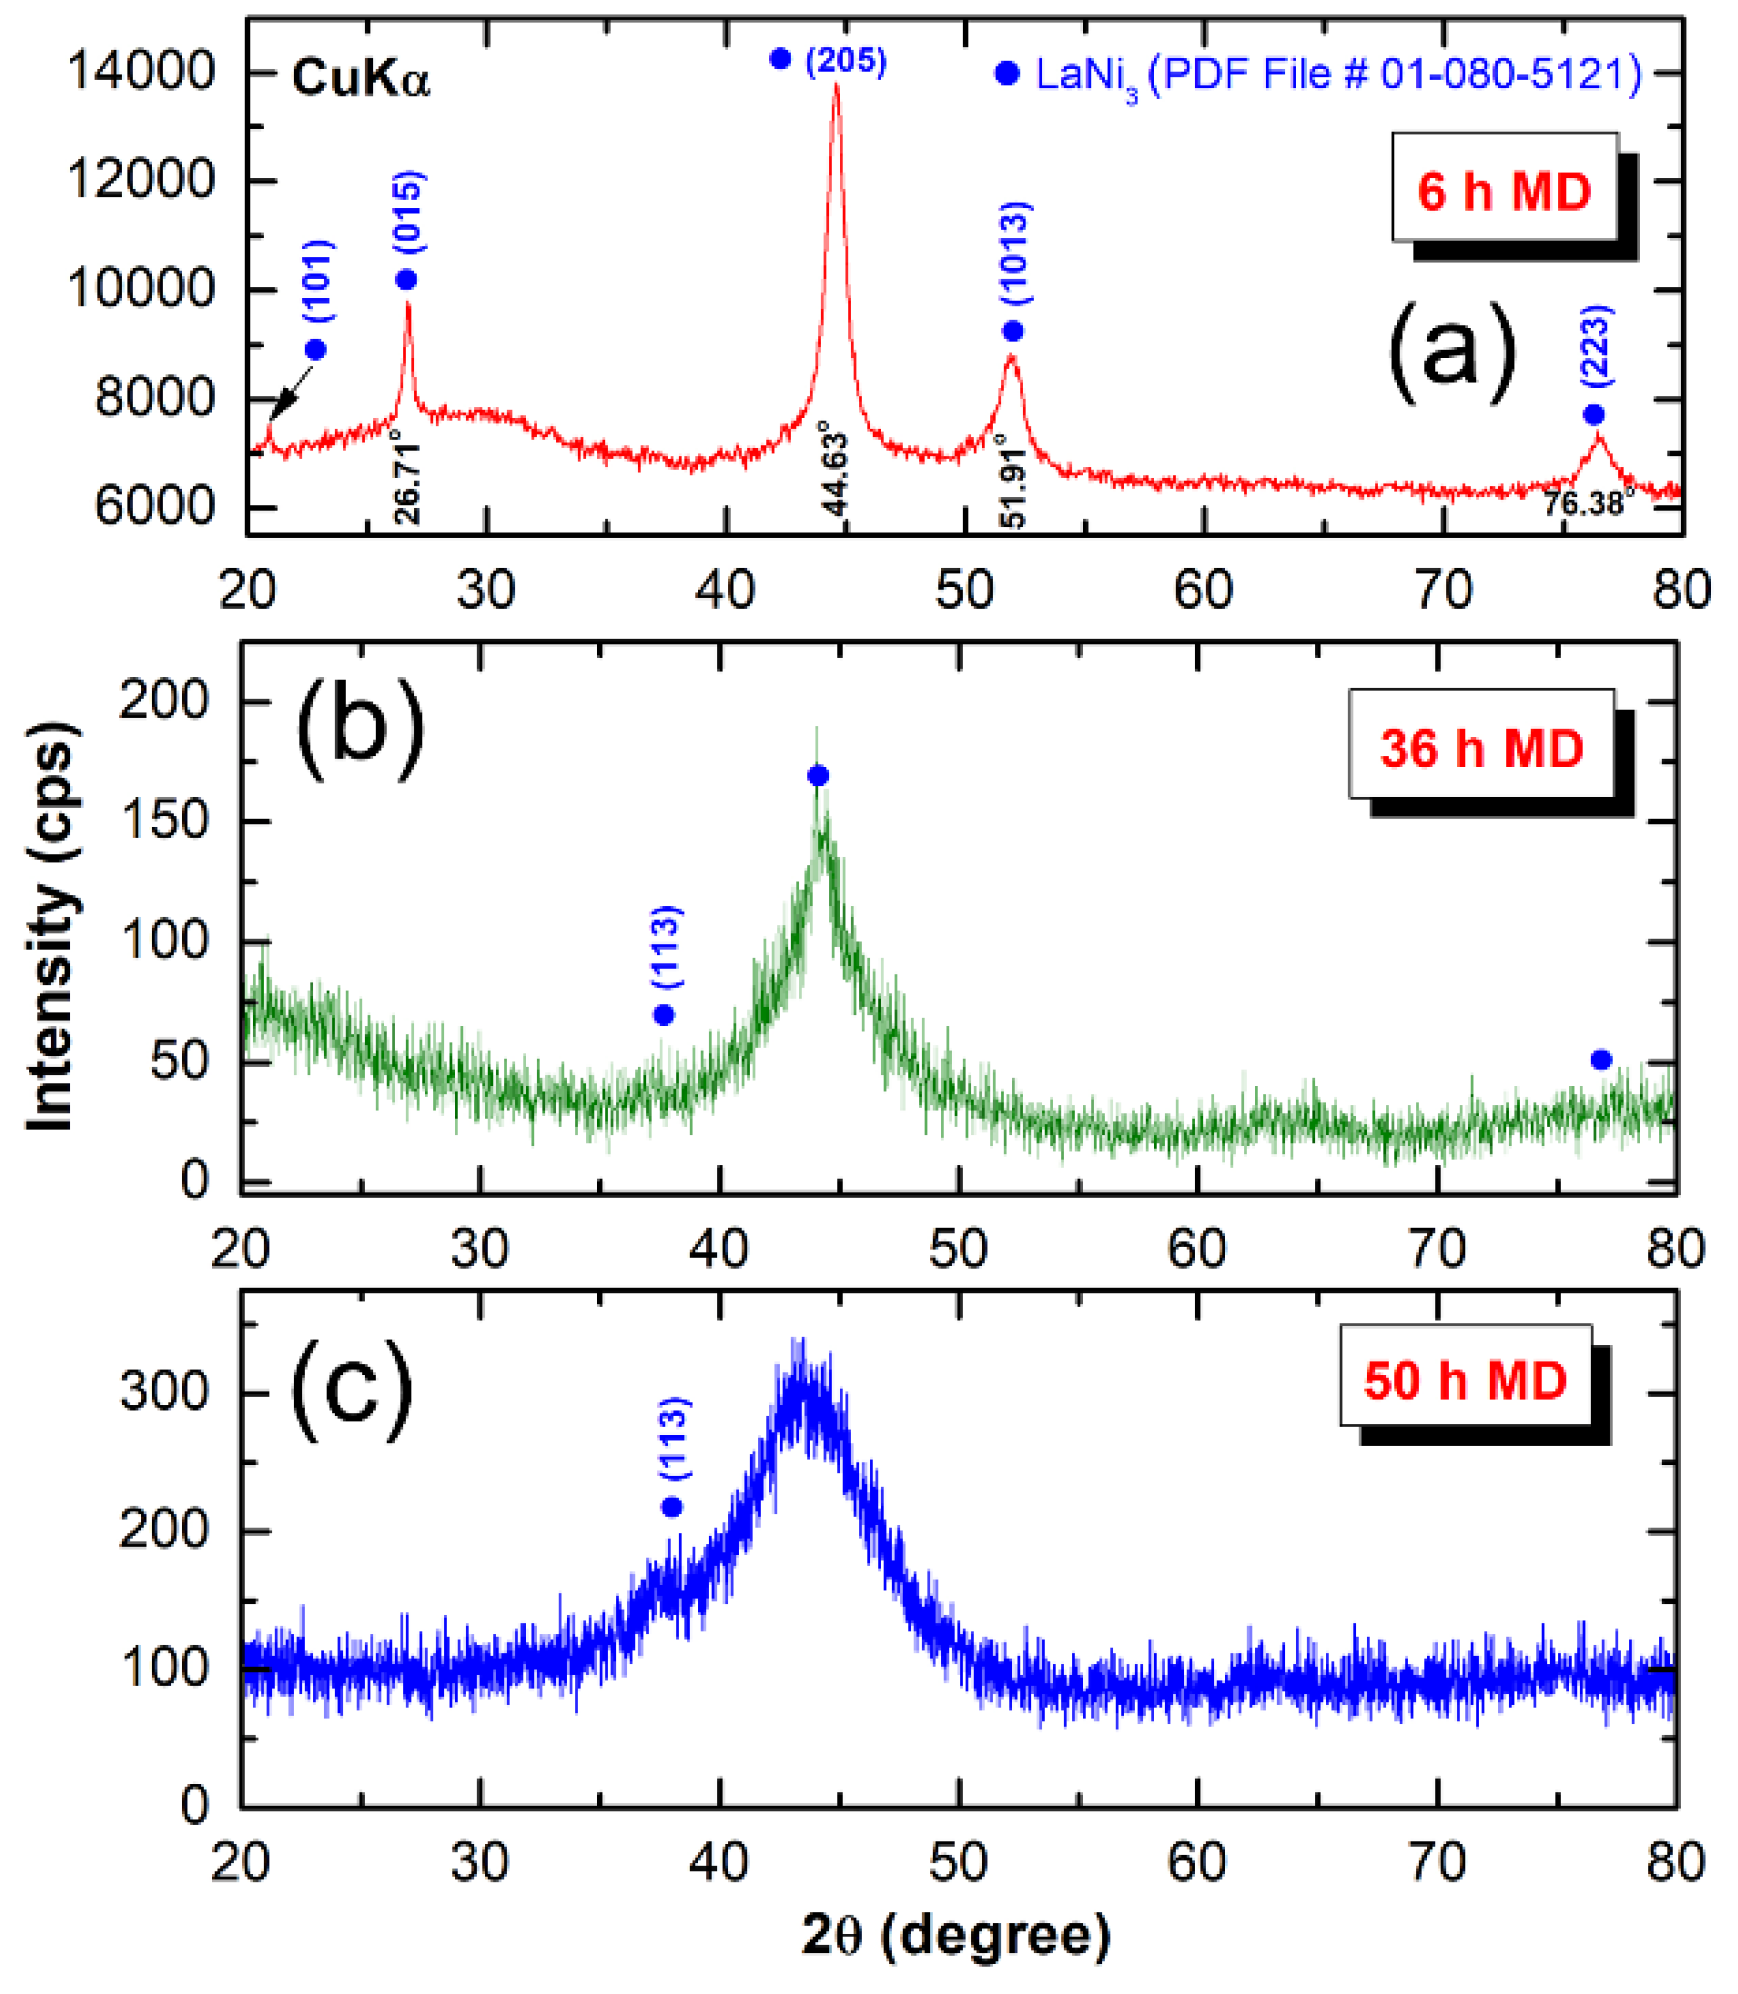
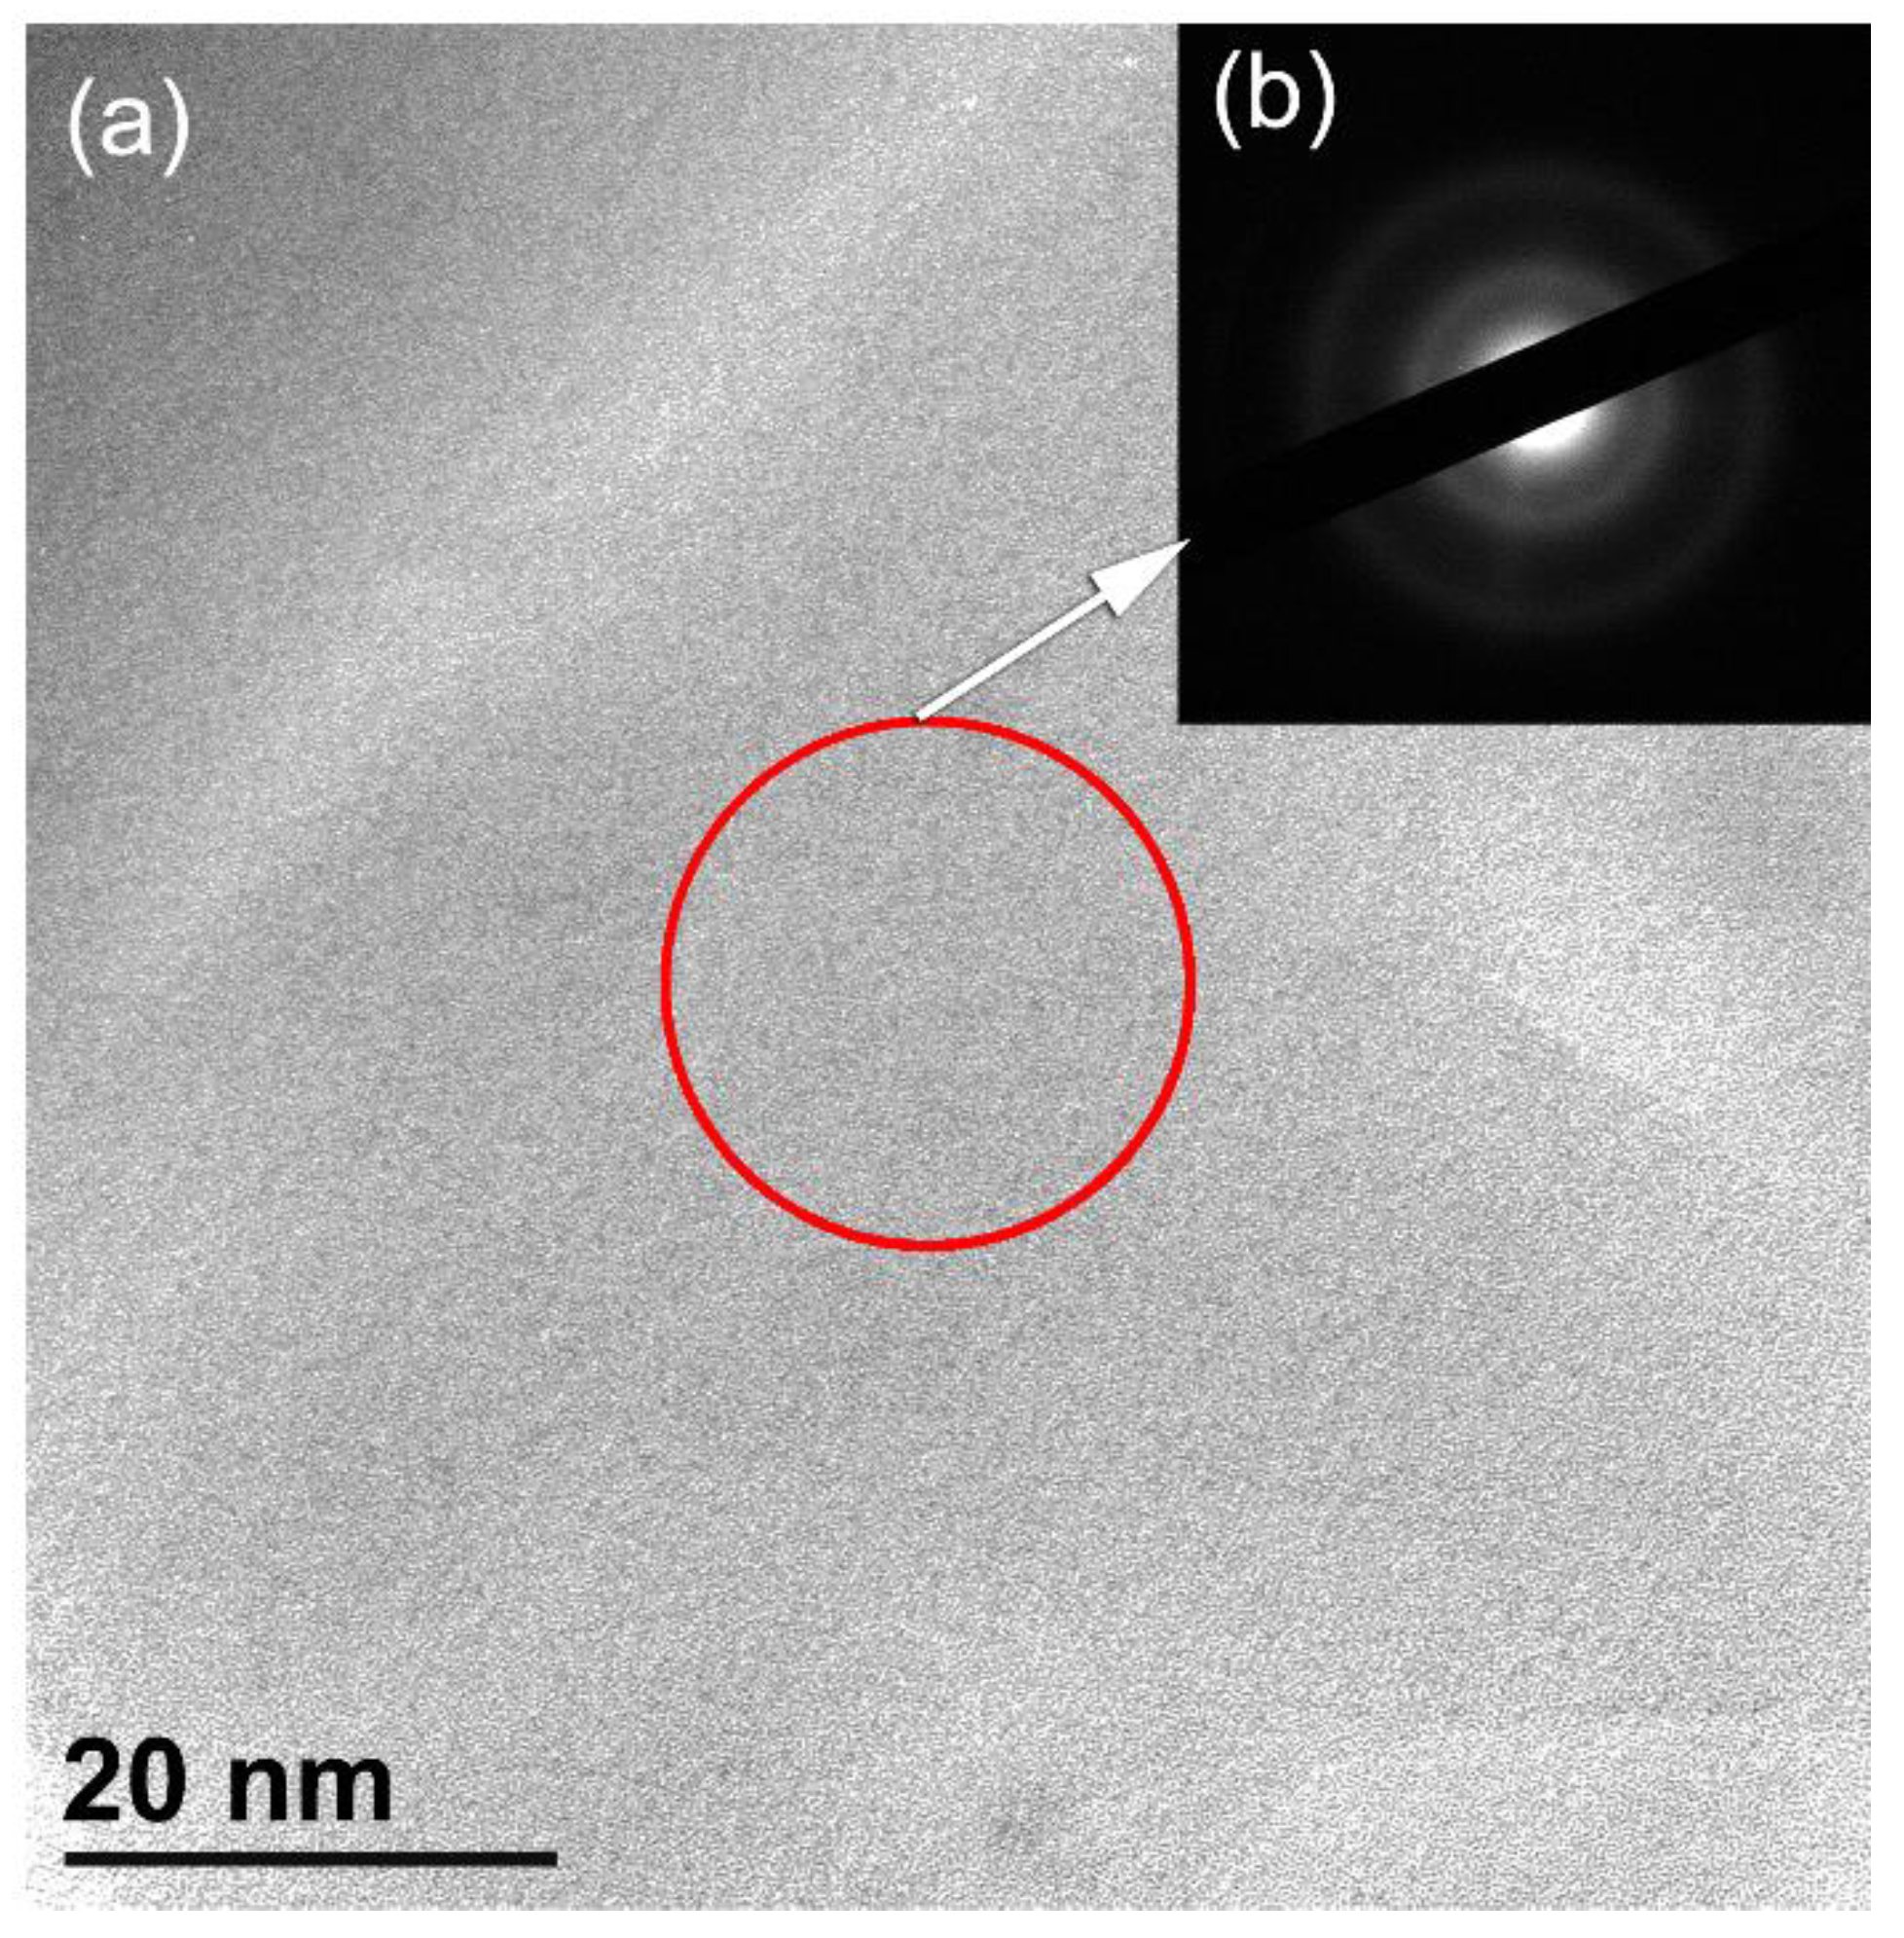
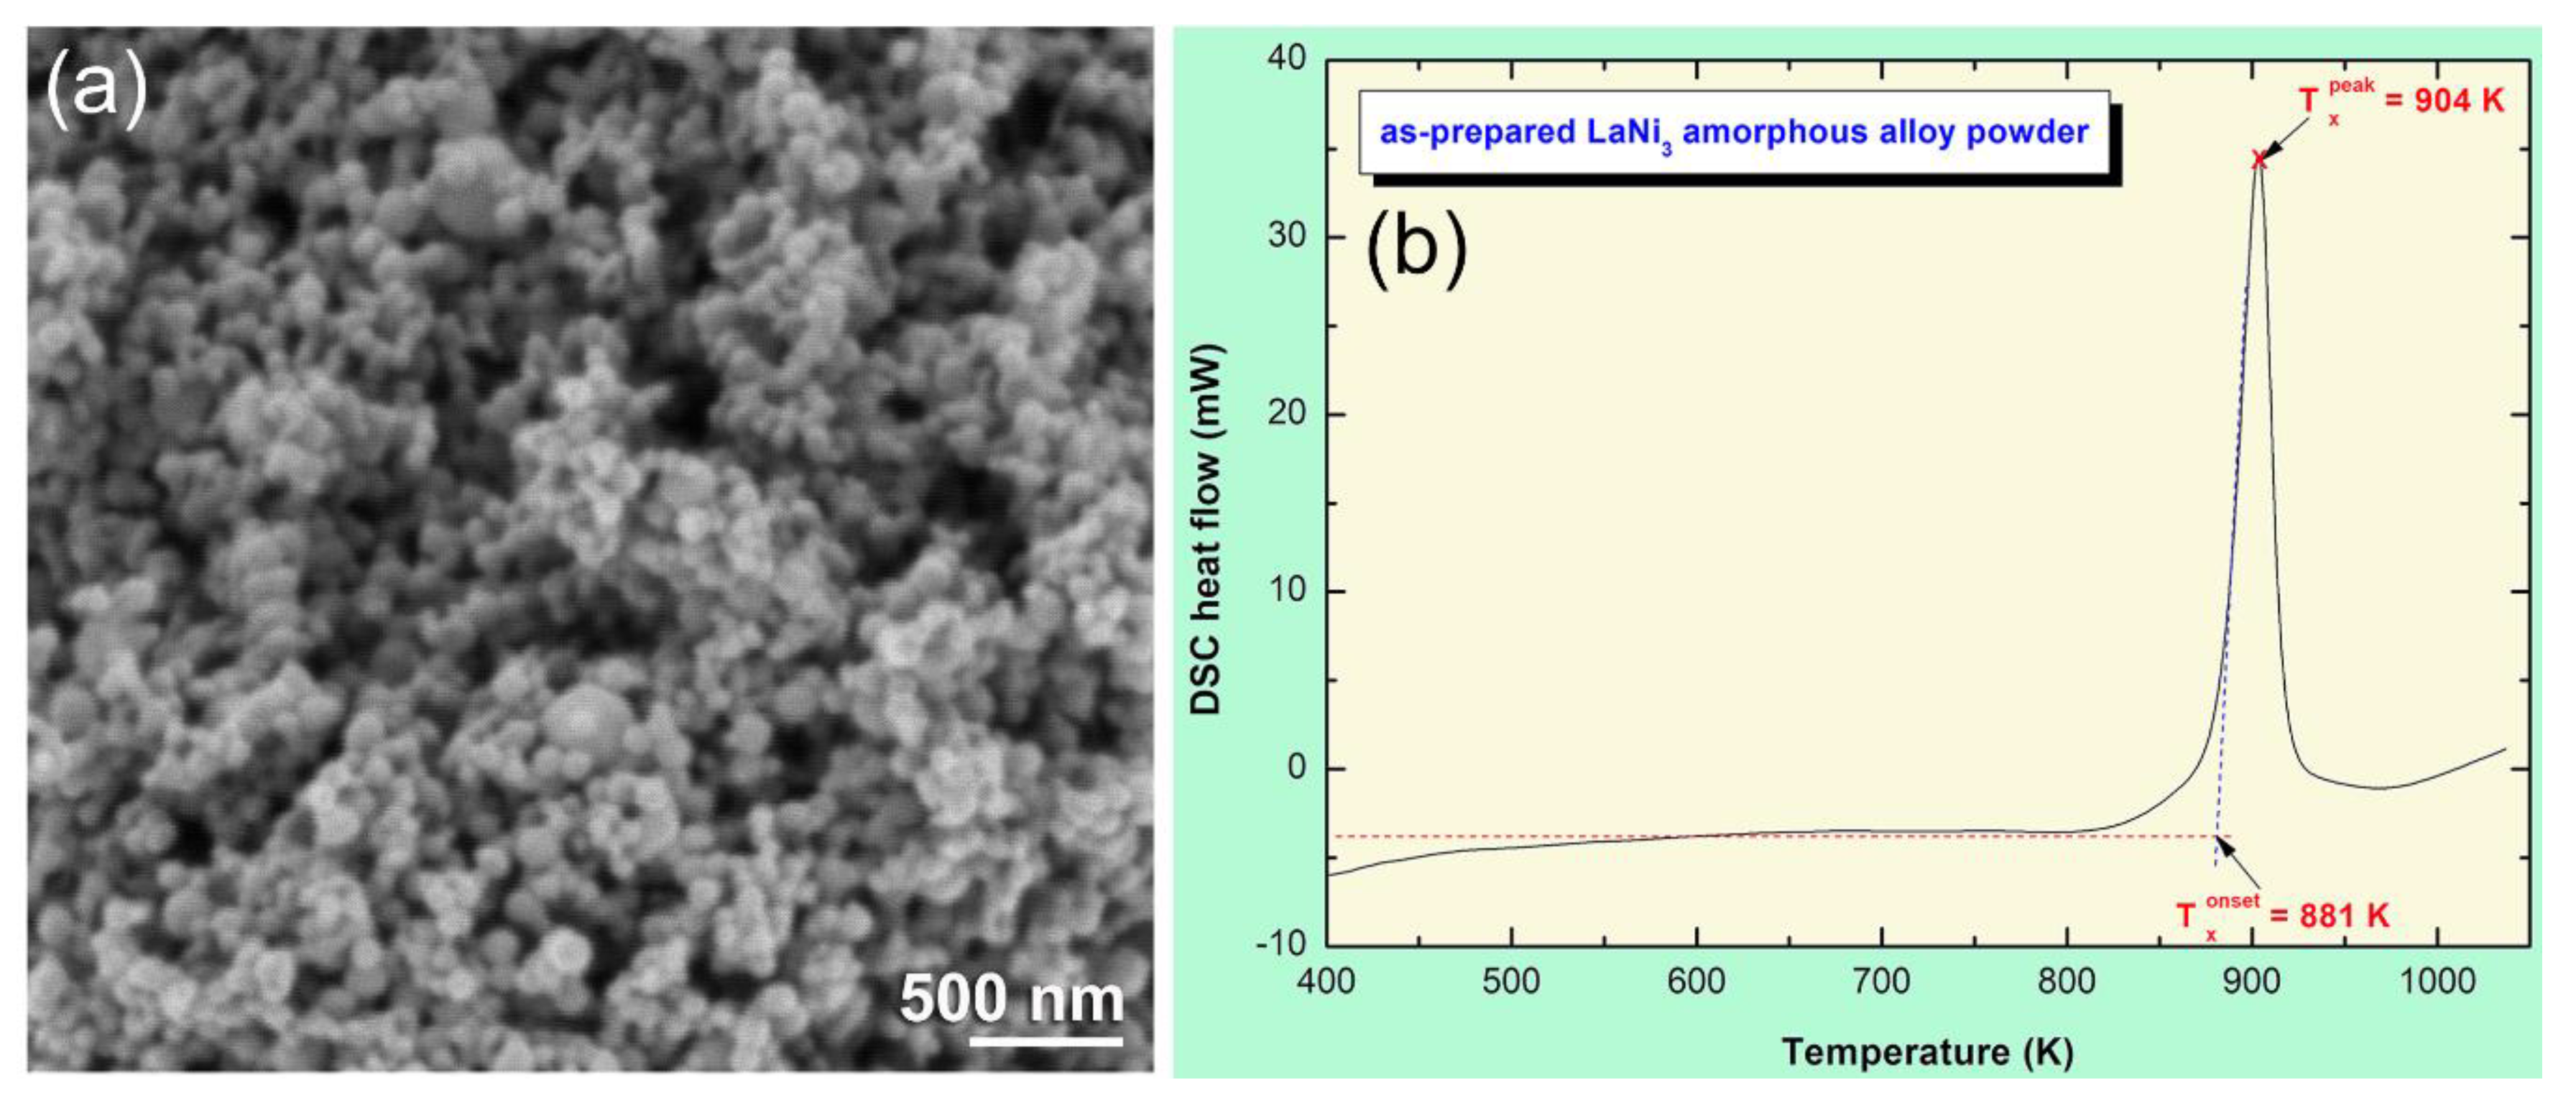
3.1.1. Amorphous-LaNi3 Powders

Figure 2 presents XRD patterns of arc-melted LaNi3 powders obtained after mechanical disordering (MD) for 6 h (a), 36 h (b) and 50 h (c), using a high-energy ball mill. The powders milled for 6 h revealed Bragg peaks corresponding to intermetallic compound of LaNi3 (PDF File # 01-090-5121), as shown in Figure 2a.
The broadening seen in the diffracted lines were attributed to the grain refinement and lattice strain achieved during high-energy ball milling. After 36 h of MD time the Bragg peaks related to (110), (015), (1013) and (223) were completely disappeared, where a diffuse halo peak centralized at 44.63 degree appeared, as shown in Figure 2b. This indicates crystalline-to-non-crystalline phase transformation, where a single a-LaNi3 was obtained. The synthesized amorphous phase was coexisted with fine crystallites corresponding to LaNi3 (113) and (205) crystals, as indexed in Figure 2b. Further MD time (50 h) was required to enhance the crystalline-amorphous-phase transformation. Formation of a full amorphous phase after 50 h of milling is implied by the appearance of abroad diffuse halos and disappearance of (205) Bragg-peak (Figure 2c).
The bright field image (BFI) and the corresponding selected area diffraction pattern (SADP) of the powders obtained after 100 h of MD are shown in Figure 3a,b, respectively. After this stage of milling, the powders had fine structure with no contrast related to precipitated crystalline phase, implying the formation of a single amorphous phase. The SADP that revealed a diffuse halo related to a-LaNi3 (Figure 3b), indicating the formation of non-crystalline phase.
The FE-SEM micrograph of a-LaNi3 powders obtained after 100 h of MD time is presented in Figure 4a. After this stage of milling, a-LaNi3 powders had spherical like morphology with very narrow particle size distribution, ranged between 83 nm to 96 nm in diameter, as shown in Figure 4a. The as-prepared a-LaNi3 powders crystallized into order phase through a single sharp exothermic peak, as displayed in Figure 4b.
This amorphous phase possessed outstanding high thermal stability, suggested by high onset (881 K) and peak (904 K) temperatures, with a heating rate of 20 °C/min (Figure 4b).

3.1.2. MgH2 and Nanocomposite Powders

XRD pattern of starting Mg powders is displayed in Figure 5a. The powders revealed sharp Bragg-peaks corresponding to hcp-Mg metal (PDF# 00-004-0770). After 12.5 h of reactive ball milling under 50 bar of hydrogen, all the Bragg-peaks corresponding to Mg-phase were replaced by two sets of diffracted lines related to —and -MgH2 phases, as elucidated in Figure 5b. XRD pattern of MgH2 doped with 7 wt% a-LaNi3 powders and then rod-milled for 50 h and 100 h are shown in Figure 5c,d, respectively. In both figure the halo diffuse pattern seen in the base line was corresponding to a-LaNi3 powders. After 50 h of milling, the Bragg peaks related to MgH2 revealed significant broadening due to grain refining and lattice strain (Figure 5c). Increasing the milling time (100 h) led to further broadening in the Bragg lines, implying a drastic decreasing in grain size.
In order to understand the mechanism of mechanically induced doping of MgH2 with a-LaNi3 powders, detailed morphological examination of the powders obtained after different stage of milling were performed. Figure 6 presents FE-SEM and EDS mapping of the as-prepared nanocomposite powders after milling for selected times. The as-prepared MgH2 powders (12.5 h of RBM) had rugby-ball like morphology with an apparent particle size ranged between ~2 m to 8 m in diameter, as displayed in Figure 6a. Spherical a-LaNi3 powder particles, which had large surface area tended to penetrate the powder’s surface of MgH2 upon milling for 1 h (Figure 6b). These hard amorphous particles scratched MgH2 powder’s outermost surface to create cracks, leading to disintegrate the aggregated powders into smaller particles. Under the dynamic motion of the rods (milling media), which generated shear forces, a-LaNi3 powders were enforced to penetrate the surface of MgH2 deeply and created numerous pores and cavities, as indexed in Figure 6b. These created cracks and cavities led to successful disintegration of MgH2 powders to obtain finer particles. The scanning transmission electron microscope (STEM) image of the powders obtained after 3 h is displayed in Figure 6c. After this stage of milling, MgH2 powders had become fine in size (~4 m in diameter), as presented in Figure 5c. The a-LaNi3 particles tended to be agglomerated due to Van der Waals attractions to form aggregates embedded into MgH2 matrix (Figure 6c). The powder of this milling stage were heterogeneous in chemical composition and showed significant variations in the concentration of a-LaNi3.
The composite powders obtained after this stage consisted of large aggregates with apparent particle size of ~90 m in diameter upon milling for 6 h, as shown in Figure 6d. Increasing the milling time led to 6 h enhanced the micro-milling media (a-LaNi3 particles) to be adhered onto the surfaces of MgH2 powders (Figure 6d). The EDS mapping taken for Mg (Figure 6e), La (Figure 6f) and Ni (Figure 6g) indicated a homogeneous elemental distribution within the microscale.
The intimate distribution of a-LaNi3 hard particles (micro-milling media) in MgH2 powder matrix increased the efficiency of milling to fabricate finer MgH2 powders (~5 m in diameter), as displayed in Figure 6h,i. After 13 h, the distribution of a-LaNi3 powders (Figure 6j,k) were homogeneously distributed, having very closed compositional value to the desired composition of 7 wt%. Toward the end of rod-milling (50 h), nanocomposite powders became ultrafine in size (~1.2 m in diameter), as shown in Figure 6l. The elemental EDS mapping elucidated that MgH2 powders (Figure 6m) were encapsulated into a cloud of a-LaNi3 (Figure 6n,o) aggregates to form homogeneous nanocomposite powders.
The FE-HRTEM image of nanocomposite MgH2/7 wt% of a-LaNi3 powders and then rod-milled for 100 h is shown in Figure 7a together with corresponding SADP (Figure 7b). Ultrafine nano-lenses of MgH2 powders with an average grain size of 5 nm in diameter were encapsulated in the core of featureless a-LaNi3 matrix, as shown in Figure 7a. The SADP (Figure 7b) revealed halo-diffuse rings related to a-LaNi3 matrix coexisted with spots diffractions related to nanocrystalline MgH2 phase. The local analysis of the nanocomposite powders obtained after 100 h of milling were conducted for 20 individual particles with FE-HRTEM/EDS, as indexed in Figure 7c. Obviously, MgH2 particles were encapsulated in the amorphous matrix of LaNi3 powders (Figure 7c). These crystallites were very closed in sizes (~5 nm in diameter) and had narrow particle size distribution. The selected particles were classified into 17 individual zones for achieving EDS analysis, as indexed by the open circular symbols shown in Figure 7c. The corresponding results related to each zone are listed in Table 1. The results, which showed closed values in composition (Table 1). This suggests the formation of homogeneous nanocomposite MgH2/7 wt% a-LaNi3 powders obtained after 100 h of rod-milling time.
Thermal analysis of nanocomposite powders obtained after the early (12.5 h) and final (100 h) stages of rod milling time was conducted to realize the effect of milling on the stability of MgH2 powders. Moreover, DSC results obtained upon heating both samples at different heating rates, k (10, 20, 30, and 40 degree/min) were necessary to calculated the apparent activation energy (Ea) of decomposition, using Arrhenius approach thermograms obtained for pure MgH2 powders doped with 7 wt% a-LaNi3 and rod-milled for 12.5 h and 100 h are displayed in Figure 8a,b, respectively. The measurements were achieved in temperature range (373 k to 850 k), being below to the Tx (881 K) of a-LaNi3 additive. Thus, the amorphous phase maintained its short-range order without any phase transformations. For each k, both samples revealed single sharp endothermic event that were related to decomposition of MgH2, as presented in Figure 8. The decomposition peak temperature measured at 20 degree/min for the sample milled for 12.5 h was 750 K, as displayed in Figure 8a. The decomposition peak temperature, which was developed at 20 degree/min for the final product (100 h of milling) showed dramatic deduction of the peak temperature (579 K), as displayed in Figure 8b. This drastic reduction of the decomposition temperature is believed to be attributed to the effect of micro/nano milling media (a-LaNi3 nanopowders), leading to disintegrate the metal hydride powders into ultrafine nano-lenses. The Ea of dehydrogenation were calculated for the samples obtained after 12.5 h of rod milling and found to be 179.47 kJ/mol. This value was drastically decreased to 73.26 kJ/mol upon increasing the rod milling time to 100 h, as indexed in Figure 8b.
The Ea value of this system is closed to previously reported value of MgH2 powders doped with 10 wt% Fe nanoparticles (86 kJ/mol)38, 4 wt% Ni nanofibers (81 kJ/mol)39, 10 wt% Cu nanoparticles (76 kJ/mol)40, MgH2/5 wt% metallic glassy Zr70Ni20Pd10 (51 kJ/mol)35 and 20 wt% Ti0.4Cr0.15Mn0.15 V0.3 (71 kJ/mol)41 systems. However, it is significantly better than MgH2/10 wt% metallic glassy Ti2Ni (87.3 kJ/mol)37, MgH2/5 wt% TiMn2 (117 kJ/mol)42, and MgH2/5.3 wt% TiC (97.74 kJ/mol)42 systems. Contrary to this, Ea of the present system is above those reported values for, MgH2/14 wt% TiAl (65 kJ/mol)43 and MgH2/5 wt% quasicrystal-AlCuFe (64.25 kJ/mol)40 systems.
The kinetic of hydrogen gas uptake/release is crucial characteristics that should be characterized to realize the potential employment of solid-hydrogen-storage materials in real applications. The hydrogenation/dehydrogenation kinetics of MgH2 doped with 7 wt% a-LaNi3 were measured at different temperatures for the samples obtained after rod-milling for 3 h (Figure 9), 25 h (Figure 10) and 50 h (Figure 11). The absorption and desorption for all measurements were achieved under hydrogen gas pressure of 10 bar and 200 mbar, respectively.
The sample obtained after the early stage of rod-milling (3 h) was able to absorb 3.8 wt% H2 within 40 min at low temperature of 125 °C (Figure 9a). As expected, increasing the temperature to 150 °C and 175 °C and fixing the time at 40 min led to enhance the absorption kinetic behavior. This is suggested by increasing the hydrogen capacity to 5 wt% and 5.5 wt%, respectively. Further improvement of the hydrogenation reaction was achieved upon increasing the temperature to 200 °C, implied by the large hydrogen capacity, which was reached to 5.4 wt% H2 after 40 min (Figure 9a). However, the hydrogenation kinetics of the powders obtained after 3 h of milling was better when compared with pure MgH2 powders [17], the sample still suffers from slow dehydrogenation kinetic, as displayed in Figure 9b. At 150 °C, the sample desorbed not more than 5.5 wt% H2 after a very long time (600 min), as shown in Figure 9b. Considerable improving in desorption kinetic was achieved with increasing the temperature. At 200 °C and 225 °C, the powders released their storage capacity (5.6 wt% H2) within 141 min and 37 min, respectively (Figure 9b).
The hydrogenation/dehydrogenation kinetic behavior of the powders obtained after 25 h of rod-milling is shown in Figure 10. Increasing the milling time (25 h), led to improve the absorption kinetics, as characterized by the short time (25 min) required to uptake 5.6 wt% H2 at 125 °C (Figure 11a). At this temperature the powders reached to its maximum storage capacity of 6.7 wt% H2 after 80 min, as displayed in Figure 10a. Significant improvement on the hydrogenation kinetics was attained upon increasing the temperature to 150 °C and 175 °C, where the powders absorbed 6.5 wt% H2, as elucidated in Figure 10a. Outstanding hydrogenation kinetic behavior was obtained for the sample examined at 200 °C. At this temperature, the sample absorbed about 6 wt% H2 within 10 min, where it tended to approach a saturated value of 6.8 wt% H2 after 30 min, as shown in Figure 10a.
The absorption and desorption kinetics of the final product obtained after 50 h of milling are presented in Figure 11. Likewise the good hydrogenation behavior shown of this system, outstanding dehydrogenation characteristics were realized. The powders after this stage of milling showed excellent absorption behavior, indexed by the short time (2 min) required to absorb 4.6 wt% H2 at 125 °C and 150 °C respectively, as shown in Figure 11a. At 175 °C and 200 °C, the sample reached to about 5.3 wt% after 2 min (Figure 11b). The hydrogen capacity of the sample measured at 125 °C reached to 5.8 wt% H2 after 25 min (Figure 11a). At relatively higher temperatures (150 °C, 175 °C and 200 °C), the storage capacity of the powders tended to be saturated at 6 wt% H2 after 18 min, as displayed in Figure 11a. At this temperature, the powders desorbed about 67% of its storage capacity, which corresponding to 4 wt% H2 after 30 min, as displayed in Figure 11c. Better desorption kinetic was attained upon increasing the temperature to 175 °C, when the powders desorbed its full storage capacity (−6 wt% H2) within only 10 min, as elucidated in Figure 11c. Increasing the applied temperature to 200 °C, accelerated the desorption kinetic, as implied by the short time needed for the sample to discharge it full hydrogen storage capacity within 3 min (Figure 11d). Finally, the sample measured at 225 °C revealed superior dehydrogenation kinetics, characterized by releasing its full hydrogen charged (−6 wt% H2) within only 2 min, as presented in Figure 11c.
We should emphasise that the degradation seen in the storage capacity upon increasing the milling time from 25 h (Figure 10a) to 50 h (Figure 11a) is attributed to powder refining process that led to the formation of ultrafine nanoparticles with large surface area. Handling such ultrafine powders during sample preparation for kinetics measurements, led to the formation of MgO coat one the outermost surfaces of MgH2 powders. Accordingly, this led to increase the weight fraction of MgO against MgH2.
For applications as solid-hydrogen storage materials, MgH2 based systems must reveal excellent cyclability with great number of hydrogen charging/discharging cycles of at least 1000 cycles. The system should not obey to any serious degradation related to storage capacity and kinetics upon stress fluctuations happened during hydrogenation/dehydrogenation pressure. The cycle-life-time test was achieved continuously in the present study at 225 °C under hydrogen pressure of 10 bar (gas uptake) and 200 mbar (gas release) for 2000 h, as displayed in Figure 12a. In order to reduce the MgO layer formed upon handling the materials outside the glove box, the powders had to be activated at 300 °C for 20 h (activation stage, Figure 12a). During this stage, fresh Mg surfaces were created and were capable to react simultaneously with the pressurized hydrogen. Removal of MgO layer led to enhance the powders so that the storage capacity (6.5 wt%), as presented in Figure 12a. The results showed that 20 h were not enough to activate the powders perfectly, as indexed by the obvious storage degradation started after 20 h (Figure 12a). Thus, a second stage so-called enhancement-stage started from 20 h for about 280 h to ensure decreasing of MgO molar fraction.
After 300 h, the storage capacity tended to be improved to reach again to its maximum capacity of 6.5 wt%, as shown in Figure 12a. This system shows excellent capability of maintaining its superior hydrogenation/dehydrogenation properties even after 2000 h without dramatic changes in storage capacity or the corresponding kinetics (Figure 12a). The a-LaNi3 nanoparticles played crucial role as grain-growth inhibitors, prevented the soft Mg metallic grain from growing under temperature application during the cycle-life-time test. In order to understand the kinetics behavior of nanocomposite MgH2/7 wt% a-LaNi3 powders beyond 2000 cycles, two continuous sorption/desorption cycles were conducted (Figure 12b). The results showed that the sample maintained its high hydrogen storage capacity (~6.4 wt%), however, both hydrogenation and dehydrogenation reactions took longer absorption/desorption time (13 min/18 min) when compared with the powders before cycle test (Figure 11). This can be attributed to slight growth of the powder particles upon subjecting to the repetition the cyclic process at 225 °C. Under the application of pressure during hydrogenation process, the spherical hard a-LaNi3 particles tended to penetrate the outermost shell of soft Mg powders to develop artificial pores and cavities, as presented in Figure 13. Such porous morphology became pronounced after 300 continuous cycles, where most of the amorphous particles were located either on the gate of the pores or into Mg powders. This porous structure assisted fast hydrogen diffusion as well as decomposition pathway of the system and ensured sustainable storage capacity of the system. The present system has better cyclability when compared with graphene-wrapped 2LiBH4-MgH2, which showed 25 cycles/350 °C for absorption/ desorption of 8.9 wt% H2 [40].

4. Conclusions

The role of amorphous LaNi3 modifier additive on the de/rehydrogenation kinetics, thermal stability, hydrogen storage capacity and cyclability of MgH2 powders has been investigated. The results have shown that the decomposition temperature of MgH2 powders dropped to 579 K upon doping with 7 wt% a-LaNi3 and rod-milling for 100 h. After this stage of milling the apparent activation energy was dramatically reduced to 73.26 kJ/mol. Increasing the rod-milling time led the ultrafine a-LaNi3 powders to be embedded and uniformly distributed into MgH2 matrix. These abrasive amorphous particles played micro/nano-milling media, leading to drastic deduction of MgH2 particle size. In addition, a-LaNi3 hard nanopowders were capable to penetrate the MgO layer, coated the powder matrix of MgH2 to create numerous pores. Such fine LaNi3 powders facilitated excellent gateway for uptake/release ~6 wt% hydrogen within 8/2 min at 200 °C and 225 °C, respectively. This new fabricated solid-hydrogen storage system possessed an extraordinary long cycle-life-time (2000 h) at 225 °C without obeying to obvious degradation on its kinetics and/or storage capacity.

Author Contributions

M.S.E.-E. designed the experimental work, shared in sample preparation, TEM, SEM characterizations and wrote the manuscript; M.S. shared in sample preparations and SEM analysis; E.A.-N. shared in sample parathion and did the XRD measurements. Both of F.A.-A. and M.B. were equally contributed in this work by achieving the thermal analysis and kinetics measurements.

Funding

This work has been partially funded by Kuwait Foundation for the Advancement of Sciences (KFAS) related to the Project EA078C under a contract number: PR1814SP12.

Acknowledgments

The financial support received by the Kuwait Government through the Kuwait Institute for Scientific Research for purchasing the equipment used in the present work, using the budget dedicated for the project led by the first author (P-KISR-06-04) of Establishing Nanotechnology Center in KISR is highly appreciated.

Conflicts of Interest

The authors declare no competing financial interests.

References

  1. Key World Energy Statistics; Int. Energy Agency: Paris, France, 2017.
  2. Jackson, R.B.; Le Quéré, C.; Andrew, R.M.; Canadell, J.G.; Peters, G.P.; Roy, J.; Wu, L. Warning signs for stabilizing global CO2 emissions. Environ. Res. Lett. 2017, 12, 110202. [Google Scholar] [CrossRef]
  3. Marbán, G.; Valdés-Solís, T. Towards the hydrogen economy? Int. J. Hydrogen Energy 2007, 32, 1625–1637. [Google Scholar] [CrossRef]
  4. Lanzia, E.; Verdolinia, E.; Haščič, I. Efficiency-improving fossil fuel technologies for electricity generation: Data selection and trends. Energy Policy 2011, 39, 7000–7014. [Google Scholar] [CrossRef]
  5. Shashikala, K. Hydrogen storage materials. Functional Materials Preparation. Process. Appl. 2012, 15, 607–637. [Google Scholar]
  6. El-Eskandarany, M.S.; Al-Matrouk, H.; Shaban, E.; Al-Duweesh, A. Superior catalytic effect of nanocrystalline big-cube Zr2Ni metastable phase for improving the hydrogen sorption/desorption kinetics and cyclability of MgH2 powders. Energy 2015, 91, 274–282. [Google Scholar]
  7. Walker, G. Solid-State Hydrogen Storage: Materials and Chemistry, 1st ed.; Woodhead Publishing Limited: New York, NY, USA, 2008; Chapter 1. [Google Scholar]
  8. Jain, I.P.; Lal, C.; Jain, A. Hydrogen storage in Mg: A most promising material. Int. J. Hydrogen Energy 2010, 35, 5133–5144. [Google Scholar] [CrossRef]
  9. Moriarty, P.; Honnery, D. A hydrogen standard for future energy accounting? Int. J. Hydrogen Energy 2010, 35, 12374–12380. [Google Scholar] [CrossRef]
  10. Stetson, N.T.; McWhorter, S.; Ahn, C.C. Compendium of Hydrogen Energy; Gupta, R.B., Basile, A., Veziroğlu, T.N., Eds.; Elsevier: Oxford, UK, 2016; Volume 2, Chapter 1. [Google Scholar]
  11. Pistidda, C.; Bergemann, N.; Wurr, J.; Rzeszutek, A.; Møller, K.T.; Hansen, B.R.; Garroni, S.; Horstmann, C.; Milanese, C.; Girella, A.; et al. Hydrogen storage systems from waste Mg alloys. J. Power Sources 2014, 270, 554–563. [Google Scholar] [CrossRef]
  12. Hardian, R.; Pistidda, C.; Chaudhary, A.L.; Capurso, G.; Gizer, G.; Cao, H.; Milanese, C.; Girella, A.; Santoru, A.; Yigit, D.; et al. Waste Mg-Al based alloys for hydrogen storage. Int. J. Hydrogen Energy 2018, 43, 16738–16748. [Google Scholar] [CrossRef]
  13. Polanski, M.; Nawra, D.; Zasada, D. Mg2FeH6 synthesized from plain steel and magnesium hydride. J. Alloys Compd. 2019, 776, 1029–1040. [Google Scholar] [CrossRef]
  14. Moretto, P.; Zlotea, C.; Dolci, F.; Amieiro, A.; Bobet, J.L.; Borgschulte, A.; Chandra, D.; Enoki, H.; De Rango, P.; Fruchart, D.; et al. A Round Robin Test exercise on hydrogen absorption/desorption properties of a magnesium hydride based material. Int. J. Hydrogen Energy 2013, 38, 6704–6717. [Google Scholar] [CrossRef]
  15. Schlapbach, L.; Zuttel, A. Hydrogen-storage materials for mobile applications. Nature 2001, 414, 353−358. [Google Scholar] [CrossRef]
  16. Camirand, C.P. Measurement of thermal conductivity by differential scanning calorimetry. Thermochim. Acta 2004, 417, 1–4. [Google Scholar] [CrossRef]
  17. El-Eskandarany, M.S.; Shaban, E.; Al-Halaili, B. Nanocrystalline β-γ-β cyclic phase transformation in reacted ball milled MgH2 powders. Int. J. Hydrogen Energy 2014, 39, 12727–12740. [Google Scholar] [CrossRef]
  18. Amira, S.; Huot, J. Effect of cold rolling on hydrogen sorption properties of die-cast and as-cast magnesium alloys. J. Alloy Compd. 2012, 520, 287–294. [Google Scholar] [CrossRef]
  19. Yamada, T.; Yin, J.; Tanaka, K. Hydrogen storage properties and phase structures of Mg-rich Mg-Pd, Mg-Nd and Mg-Pd-Nd alloys. Mater. Trans. 2001, 42, 2415–2421. [Google Scholar] [CrossRef]
  20. Zaluska, A.; Zaluski, L.; Ström-Olsen, J.O. Nanocrystalline magnesium for hydrogen storage. J Alloys Compd. 1999, 288, 217–225. [Google Scholar] [CrossRef]
  21. Zhou, C.; Fang, Z.Z.; Ren, C.; Li, J.; Lu, J. Effect of Ti intermetallic catalysts on hydrogen storage properties of magnesium hydride. J. Phys. Chem. C 2013, 117, 12973–12980. [Google Scholar] [CrossRef]
  22. Ren, C.; Fang, Z.Z.; Zhou, C.; Lu, J.; Ren, Y.; Zhang, X. Hydrogen storage properties of magnesium hydride with V-Based additives. J. Phys. Chem. C 2014, 118, 21784–21790. [Google Scholar] [CrossRef]
  23. El-Eskandarany, M.S.; Al-Matrouk, H.; Shaban, E. Effect of mechanically-induced solid-state doping time on the morphology and hydrogenation cyclability of MgH2/7 Mn3.6Ti2.4 nanocomposite powders. Int. J. Hydrogen Energy 2015, 40, 10139–10149. [Google Scholar] [CrossRef]
  24. Ma, T.; Isobe, S.; Wang, Y.; Hashimoto, N.; Somei, O. Nb-gateway for hydrogen desorption in Nb2O5 catalyzed MgH2 nanocomposite. J. Phys. Chem. C 2013, 117, 10302–10307. [Google Scholar] [CrossRef]
  25. El-Eskandarany, M.S.; Shaban, E.; Alsairafi, A. Synergistic dosing effect of TiC/FeCr nanocatalysts on the hydrogenation/dehydrogenation kinetics of nanocrystalline MgH2 powders. Energy 2016, 104, 158–170. [Google Scholar] [CrossRef]
  26. Liu, H.; Wang, X.; Liu, Y.; Dong, Z.; Ge, H.; Li, S.; Yan, M. Hydrogen Desorption Properties of the MgH2–AlH3 Composites. J. Phys. Chem. C 2014, 118, 37–45. [Google Scholar] [CrossRef]
  27. Zhang, L.; Xiao, X.; Xu, C.; Zheng, J.; Fan, X.; Shao, J.; Li, S.; Ge, H.; Wang, Q.; Chen, L. Remarkably Improved Hydrogen Storage Performance of MgH2 Catalyzed by Multivalence NbHx Nanoparticles. J. Phys. Chem. C 2015, 119, 8554–8562. [Google Scholar] [CrossRef]
  28. El-Eskandarany, M.S.; Alkandary, A.; Aldakheel, F.; Al-Saidi, M.; Al-Ajmi, F.; Banyan, M. Performance and fuel cell applications of reacted ball-milled MgH2/5.3 wt% TiH2 nanocomposite powders. RSC Adv. 2018, 8, 38175–38185. [Google Scholar]
  29. Hao, S.; Sholl, D.S. Effect of TiH2-Induced strain on thermodynamics of hydrogen release from MgH2. J. Phys. Chem. C 2012, 116, 8554–8562. [Google Scholar] [CrossRef]
  30. Grzech, A.; Lafont, U.; Magusin, P.C.M.M.; Mulder, F.M. Microscopic study of TiF3 as hydrogen storage catalyst for MgH2. J. Phys. Chem. C 2012, 116, 26027−26035. [Google Scholar] [CrossRef]
  31. Yahya, M.S.; Ismail, M. Improvement of Hydrogen Storage Properties of MgH2 catalysed by K2NbF7 and multiwall carbon nanotube. J. Phys. Chem. C 2018, 122, 11222–11233. [Google Scholar] [CrossRef]
  32. Ismail, M.; Juahir, N.; Mustafa, N.S. Improved hydrogen storage properties of MgH2 co-doped with FeCl3 and carbon nanotubes. J. Phys. Chem. C 2014, 118, 18878−18883. [Google Scholar] [CrossRef]
  33. Rusman, N.A.A.; Dahari, M. A review on the current progress of metal hydrides material for solid-state hydrogen storage applications. Int. J. Hydrogen Energy 2016, 411, 12108–12126. [Google Scholar] [CrossRef]
  34. Yartys, V.A.; Lototskyy, M.V.; Akiba, E.; Albert, R.; Antonov, V.E.; Ares, J.R.; Baricco, M.; Bourgeois, N.; Buckley, C.E.; von Colbe, J.B.; et al. Magnesium based materials for hydrogen based energy storage: Past, present and future. Int. J. Hydrogen Energy 2019, 44, 7809–7859. [Google Scholar] [CrossRef]
  35. El-Eskandarany, M.S. Metallic glassy Zr70Ni20Pd10 powders for improving the hydrogenation/dehydrogenation behavior of MgH2. Sci. Rep. 2016, 6, 26936. [Google Scholar] [CrossRef]
  36. El-Eskandarany, M.S.; Ahmed, S.A.; Shaban, E. Metallic Glassy V45Zr20Ni20Cu10Al3Pd2 Alloy Powders for Superior Hydrogenation/Dehydrogenation Kinetics of MgH2. Mater. Today Proc. 2018, 5, 13718–13725. [Google Scholar] [CrossRef]
  37. El-Eskandarany, M.S. Metallic glassy Ti2Ni grain-growth inhibitor powder for enhancing the hydrogenation/dehydrogenation kinetics of MgH2. RSC Adv. 2019, 9, 1036–1046. [Google Scholar] [CrossRef]
  38. Sun, Y.; Shen, C.; Lai, Q.; Liu, W.; Wang, D.-W.; Francois, K.; Zinsou, A. Tailoring magnesium based materials for hydrogen storage through synthesis: Current state of the art. Energy Storage Mater. 2018, 10, 168–198. [Google Scholar] [CrossRef]
  39. Chen, J.; Xia, G.; Guo, Z.; Huang, Z.; Liu, H.; Yu, X. Porous Ni Nanofibers with Enhanced Catalytic Effect on the Hydrogen Storage Performance of MgH2. J. Mater. Chem. A 2015, 3, 15843–15848. [Google Scholar] [CrossRef]
  40. Xia, G.; Tan, Y.; Wu, F.; Fang, F.; Sun, D.; Guo, Z.; Huang, Z.; Yu, X. Graphene-wrapped reversible reaction for advanced hydrogen storage. Nano Energy 2016, 26, 488–495. [Google Scholar] [CrossRef]
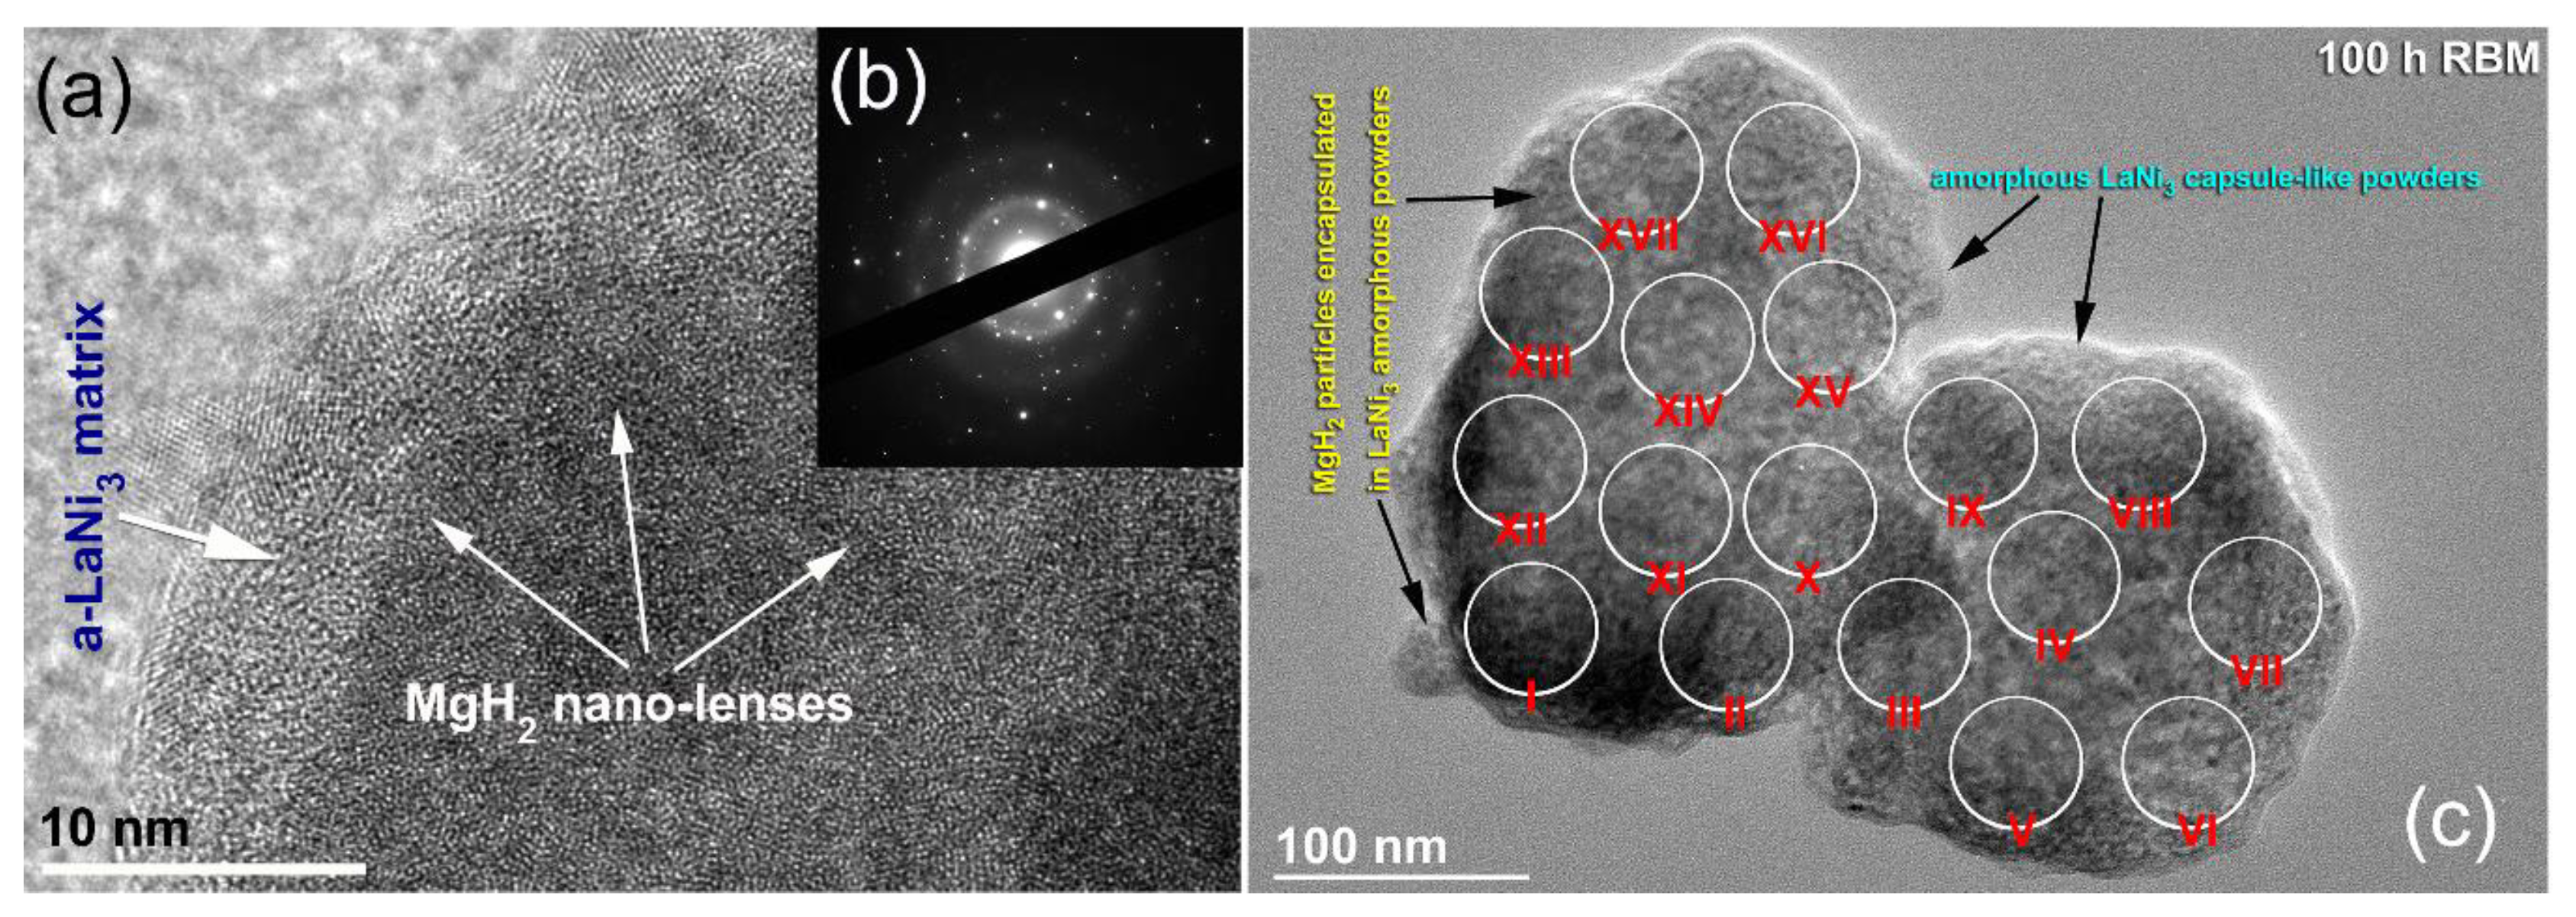
Figure 1. Nanocomposite powders were prepared by doping MgH2 with 7 wt% amorphous-LaNi3 powders, using rod milling technique. The mixed powders were sealed into Cr steel vial (a,b) with 50 Cr-steel bars (c). The system was pressurized with 10 bar of H2 pressure (a) before it mountained on a low-energy roller mill (b). A transparent vial filled with 50 Cr-steel bars and the mixed powders was designed to monitor the rods movement and doping mechanism (d). A schematic illustration presented in (e) elucidates the rolled-rods inside the vial during the milling process. The mixed powders trapped between the rods were mainly subjected to sever plastic deformation, leading to disintegrate the materials charge into fine composite powders.
Energies 12 01005 g001
Figure 2. XRD patterns of arc-melted LaNi3 intermetallic compound obtained after high-energy ball milling under He-gas atmosphere for (a) 6 h, (b) 36 h and (c) 50 h.
Energies 12 01005 g002
Figure 3. (a) BFI and (b) SADP of MD LaNi3 powders obtained after high energy ball milling for 100 h. The circular symbol indexed in (a) denotes to the selected zone used to get the electron diffraction shown in (b).
Energies 12 01005 g003
Figure 4. (a) FE-SEM micrograph and (b) DSC thermogram of a-LaNi3 powders obtained after 100 h of MD time.
Energies 12 01005 g004
Figure 5. XRD patterns of pure hcp-Mg metal after (a) 0 h and (b) 12.5 h of RBM under 50 bar of hydrogen, using a high-energy ball mill. The XRD patterns of MgH2 obtained after 12.5 h of RBM and then rod-milled with 7 wt% a-LaNi3 powders for 50 h and 100 h are displayed in (c) and (d), respectively.
Energies 12 01005 g005
Figure 6. FE-SEM micrographs of (a) MgH2 powders obtained after 12.5 of RBM, and (b) MgH2 powders doped with a-LaNi3 powders and ball milled for 1 h. The STEM image of MgH2/7 wt% a-LaNi3 composite powders obtained after 3 h of milling is displayed in (c). Scanning electron (SE) images of the composite powders obtained after 6 h, 13 h and 50 h are presented in (d,h,l), respectively, where the corresponding EDS elemental mapping of Mg are shown in (e,i,m). The EDS elemental mapping images displayed in (f,j,n) are corresponding to elemental La, however, those images presented in (g,k,o) are related to elemental Ni.
Energies 12 01005 g006
Figure 7. (a) FE-HRTEM image and (b) SADP of nanocomposite MgH2/7 wt% a-LaNi3 powders obtained after 100 h of rod milling. The BFI of powders obtained after 100 h of rod milling, undertaken for EDS elemental analysis is presented in (c), where the analysis are listed in Table 1.
Energies 12 01005 g007
Figure 8. DSC curves obtained with different heating rates, k (10, 20, 30, and 40 °C/min) of nanocomposite MgH2/7 wt% a-LaNi3 powders, rod milled for (a) 12.5 h and (b) 100 h.
Energies 12 01005 g008
Figure 9. Kinetics of (a) hydrogenation and (b) dehydrogenation measured at different temperatures under hydrogen pressure of 10 bar and 200 mbar, respectively of rod-milled MgH2/7 wt% a-LaNi3 for 3 h.
Energies 12 01005 g009
Figure 10. Kinetics of (a) hydrogenation and (b) dehydrogenation measured at different temperatures under hydrogen pressure of 10 bar and 200 mbar, respectively of rod-milled MgH2/7 wt% a-LaNi3 for 25 h.
Energies 12 01005 g010
Figure 11. Kinetics of (a,b) hydrogenation and (c,d) dehydrogenation of rod-milled MgH2/7 wt% a-LaNi3 for 50 h. The measurements were conducted at different temperature under hydrogen pressure of 10 bar and 200 mbar, respectively.
Energies 12 01005 g011
Figure 12. (a) Cycle-life-time of nanocomposite MgH2/7 wt% a-LaNi3 powders obtained after rod-milling for 100 h. The results shown in the figure may be classified into (i) activation, (ii) enhancement and (iii) final stages. This system revealed superior cycling behavior, indexed by the long cycle time (2000 h) processed without obvious degradation or failure. The hydrogenation/dehydrogenation kinetics for the sample subjected to 1000 cycles is shown in (b). All measurements were conducted at 225 °C under hydrogen pressure of 10 bar and 200 mbar, respectively.
Energies 12 01005 g012
Figure 13. FE-SEM micrograph of nanocomposite MgH2/7 wt% a-LaNi3 powders obtained after subjected to cycle-life-time of 2000 h. The arrows in yellow indexed in the figure denote to the artificial pores formed at the outermost shell of Mg aggregated powders upon penetration of a-LaNi3 nanoparticles (indexed by red arrows) during the cyclic test. The red arrows refer to a-LaNi3 powders.
Energies 12 01005 g013
Table 1. Elemental Analysis Corresponding to the Indexed Zones Shown in Figure 8.
ZoneContent (wt%)
MgLaNi3Total
I93.46.6100
II93.56.5100
III92.87.2100
IV92.77.3100
V92.97.1100
VI92.77.3100
VII92.77.3100
VIII92.87.2100
IX92.67.4100
X92.77.3100
XI92.67.4100
XII93.26.8100
XIII93.16.9100
XIV93.07.0100
XV92.87.2100
XVI92.97.1100
XVII92.87.2100

