Article

Determinants of the Willingness to Energy Monitoring by Residential Consumers: A Case Study in the City of Wroclaw in Poland

by
Anna Kowalska-Pyzalska
1,*,† and
Katarzyna Byrka
2
1
Faculty of Computer Science and Management, Wrocław University of Science and Technology, Wyb. Wyspianskiego 27, 50-370 Wrocław, Poland
2
Wrocław Faculty of Psychology, SWPS University of Social Science and Humanities, Ostrowskiego 30b, 53-238 Wrocław, Poland
*
Author to whom correspondence should be addressed.
Current address: Wyb. Wyspianskiego 27, 50-370 Wrocław, Poland.
Energies 2019, 12(5), 907; https://doi.org/10.3390/en12050907
Submission received: 1 February 2019 / Revised: 4 March 2019 / Accepted: 5 March 2019 / Published: 8 March 2019
(This article belongs to the Special Issue Economics of Sustainable and Renewable Energy Systems)

Abstract

:
This paper analyses attitudinal and socio-economic determinants of the householders’ willingness to monitor their energy consumption. Residential consumers can monitor their energy consumption by means of traditional (electricity bill) and modern tools (smart metering information platforms, SMP). Within this empirical study we test the effect of environmental attitudes, knowledge and perceived possibilities on consumers’ stages of readiness to adopt SMP based the stage model of self-regulated behavioral change (SSCB). Perceived possibilities to monitor energy consumption on a regular basis was found to be the predictor of adoption in every examined stage of readiness. General knowledge predicted adoption of the stage in which consumers declared willingness to learn know-how of using SMP. The results suggest that an effectiveness of educational campaigns may be restricted to only some consumers.

1. Introduction

Nowadays, many countries due to the ecological and political reasons aim to increase the efficiency of energy production, distribution and consumption (see, e.g., Climate Policy 3x20, Directive 2012/27/EC, Winter Package [1,2,3]). One of the ways to achieve this goal is the enrollment of smart meters in all EU countries. These devices will enable direct communication between end-users and distribution system operators (DSO). At the same time, consumers will have an access to web-platforms (SM software, SM platforms, e-platforms) or other smart tools that will let them find easily information about their current energy consumption and electricity prices. Many authors emphasize that direct or indirect feedback regarding energy consumption may have a tremendous effect on the consumers’ awareness, and motivation to monitor and reduce energy usage [4,5].
Although the prospect appears optimistic, survey research has recurrently shown that energy consumers are hesitant to accept novelties in the energy market. Firstly, consumers contribute to the effectiveness and safety of the power systems only if their engagement bears little efforts or financial costs [6,7,8,9,10]. Secondly, the discrepancy (so called intention-behavior gap) between positive attitudes and corresponding behaviors is a common observation among energy consumers [11,12,13,14]. In other words, consumers are willing to accept new enabling technologies (smart meters, in-home displays, e-platforms) and other innovative energy services (IES) as long as they do not have to change their daily routines and habits [15,16,17]. For example, in Germany even if more than 50% of residents regularly report to be willing to save electricity, the electricity consumption of the German households has not significantly changed over the last years [18].
Kahma and Matschoss [7] distinguished following reasons of why consumers do not use innovative energy services: lagging adoption (i.e., temporary non-use that will disappear over time), disinterest (non-use explained by lack of interest in or ignorance of new technology), disenfranchisement (i.e., non-use explained by lack of physical or cognitive availability) and active resistance (i.e., refusal to adopt the technology because of concern over privacy, lack of time, preference for other forms of technology or varied moral considerations; see also [15] for a review). Facilitators as well as barriers of consumers’ engagement in using smart grid (SG) solutions could be divided into a few categories, such as: comfort, control, environment, finance, knowledge and information, security and social influence, see [6,19]. Each of them may contribute to consumers’ final acceptance or refusal of the proposed goods and services in the energy market.
Within our study, we assume that installation of SM at households and getting access to SMP could be an incentive to raise awareness, willingness to gain knowledge about energy consumption and ways of better control over it and its conservation. We are aware, at the same time, that in most cases consumers may have a very low educational level about energy market, as well as a low level of awareness regarding smart metering, and they may need additional help or incentive to change their attitudes and behaviors.
In the literature exploring determinants of SMP adoption, still not enough attention has been paid to knowledge about smart meters, attitudes towards monitoring behaviors and the perceived accessibility to modern energy monitoring by the SMP. At the same time, these variables have been found to determine various behaviors [12,13,20] and may also play a great role in explaining consumers’ readiness to adopt those novel technologies. The literature shows consistently that consumers’ environmental behavior is strongly connected not only with general environmental beliefs and attitudes, but also with environmental norms, drivers and barriers of environmental behaviors, social and community influence and government policy [12,21,22,23,24].
We also assume that acceptance and usage of this software may be a phase-process as many other adoption of eco-innovation examples such as using green public transportation [25] or green energy [13]. Hence, the theoretical background for this study is motivated by the comprehensive stage model of self-regulated behavioral change (SSCB) [26]. We have chosen the SSCB model (so far mainly used for promotion of healthy and mobility behaviors) as it will allow us to verify consumers’ stage of adoption of the SMP. The SSCB model reproduces the steps of innovation diffusion of Roger’s model [27], but it pays more attention to the individual decisions of the consumers and takes into account differences in peoples’ attitudes and opinions by reference to the well-known theory of planned behavior (TPB) [20].
The general aim of this paper is to explore the socio-economic, attitudinal factors and knowledge as potential predictors of consumers’ willingness to monitor energy consumption, both in traditional and modern ways. We have formulated the following research questions: (1) How will consumers’ environmental attitudes, knowledge, experience with monitoring of energy usage, and demographics influence their willingness to monitor energy usage? (2) Which of variables such as knowledge, attitudes and perceived possibilities affect the endorsement of each stage of readiness to adopt innovative smart metering platforms (SMP)?
The results of our study may allow for drawing research-based market recommendations to enterprises responsible for the introduction of smart technologies into the energy market, as well as for the central and local governments in terms of proposing campaigns and policies aiming in changing consumers’ preferences and activities in the energy market.
The structure of the article is as follows: In Section 2 the concept of smart grids is introduced and the main findings from the research studies regarding consumers’ engagement towards monitoring of energy usage are discussed. In Section 3 the geographical and theoretical background of the study, as well as methods and the empirical setup of the survey are presented. Next, Section 4 describes a statistical analysis of the results and discusses the main findings. Finally, in Section 5, conclusions and policy implications are provided.

2. Smart Metering Information Systems—Literature Review

2.1. Smart Grids

The goal to increase energy efficiency is strongly correlated with the new approach towards the power system, namely the solution of smart grids (SG). SG use modern communication technologies to exchange information between market agents (generators, market operators and end-users) in order to improve the efficiency of energy production and consumption [18,19,28,29,30,31]. Successful introduction of SG requires support of end-users [30]. If accepted by consumers, SG may have a positive impact on the environment protection, by enabling households to balance their supply and demand of energy and by increasing energy efficiency, and saving money [32].
One of the mile steps of transformation of the traditional power system into the SG, is the broad implementation of so called smart meters (SM) among end-users. The information gathered by the SM can provide feedback about current energy consumption and energy efficiency to the electricity consumers via SM information systems (e.g., via webpage, smartphone or smart appliances) and the system operators [8,18]. The next step is to offer the consumers dynamic electricity tariffs, whose role is to flatten the demand curve for electricity and to shift the demand from on-peak to off-peak hours [33,34]. Dynamic electricity tariffs are an example of Demand Side Management/Demand Response (DSM/DR) tools that range from education (e.g., encouraging efficient usage of energy), through time-based pricing (e.g., dynamic electricity tariffs) to incentive-based demand response (e.g., direct load control, emergency demand response programs, etc.) (see, e.g., [5,28,35]. In most cases, a so-called enabling technology is needed to increase the positive impact of a smart meter on the energy demand and energy efficiency. Such an enabling technology is an equipment that enables customer to automate control of the load consumption according to the specific price and time ranges. Moreover, it ensures transparency of electricity prices. Enabling technologies include in-home displays, smart thermostats, web-based consumer portals, such as SMP, smart plugs/appliances or home area networks (HAN) (see, e.g., [33,34])
The popularity of SG concept and possibility of broader implementation of DSM/DR tools induces discussion on the role of consumers in the power system. The increase of energy efficiency will not be achieved without consumers’ acceptance, engagement and effort. Therefore, as mentioned by Ellabban and Abu-Rub, it is necessary to ensure customers’ acceptance of SG products and services to successfully build a SG [19]. Rising awareness of the new possibilities for consumers and their active role in the energy market is one of the major challenges [19,36,37].

2.2. Feedback as a Learning Tool

Nowadays, customers in the energy market can be seen as one of the main pillars of the SG. A so called smart customer, among smart utilities and smart market, may benefit from a set of technologies which empower him or her to monitor and control his or her energy consumption [7,19]. Recently, a large number of surveys across the world have been conducted to investigate the readiness of energy consumers for the SG [8,9,21,30]. In general, it was found that most of the consumers are not familiar with the term “smart grid” or “smart metering”. At the same time most of them claim to be willing to reduce their energy usage if they had the information needed to do so and to see and control their electricity consumption [9,10,19]. Apart from delivering information to the customers about their energy consumption in the real-time manner, many studies suggest that supporting consumers with some encouraging energy interventions may have a great impact on consumers’ behaviors [38,39,40].
The effects of providing consumers with the information and feedback regarding their energy consumption and its impact on behavioral change have been widely investigated [18,41,42,43,44,45,46,47,48]. Various forms of feedback, such as: direct, indirect and inadvertent, were defined dependent on how information is spread, on its type, and on the quality and quantity of data presented [21,49]. In case of energy consumption and its conservation, it has been proved that consumers should be provided with information in both: the indirect (traditional) ways via e.g., billing and by direct (modern) ways via e.g., SMP and in-home displays [5,15,49]. Moreover to obtain better results in terms of reduced energy consumption and energy savings also other sorts of interventions should be used, such as educational trainings [49] or modification of price policies and legislation [50].
Recently, by means of empirical research and literature review, the effectiveness of three main elements of so called eco-feedback design, such as: its display, timing and information provided, were analyzed [45,47,51]. Buchanan et al. [51] indicate that feedback my increase physical and conscious visibility of consumption and knowledge about it. Nachreiner et al. [18] remind also that as electricity itself is “abstract, invisible and untouchable”, especially computerized feedback (i.e., delivered to the customer via modern IT technologies) can be a powerful intervention capable of motivating consumption reduction. This is because it usually offers some multiple options for analysis, including historical comparisons and electricity saving-related information [44].
Computerized feedback, including: SM devices [48], mobile applications [45] or SMP [18,52] have gained a lot of attention. It was found out that feedback provided by SM devices (i.e., SM combined with web-page or in-home display) can be effective, leading to even 5% of reduction in the energy usage [48]. At the same time, such a feedback on energy consumption is likely to prompt investments in more energy efficient technologies (e.g., refrigerators or freezers) or lead to permanent habitual changes (e.g., turning off the lights) [48]. In a study by Ma et al. [45], the authors have noticed the positive impact of feedback on the energy consumption behavior. The impact was significantly more positive in the short term, and faded away to insignificant in the long term. They have also suggested that the design of feedback matters. It should increase user’s engagement to achieve long term durability of the effects, see [45]. In case of computerized feedback, its perceived accessibility plays a great role. The consumers adopt more eagerly, if they believe to have physical access to the information provided by eco-feedback [45,53]. The consumers’ engagement raises if the information can be achieved with relatively low effort and cost.
Foulds et al. [52] emphasize that most of the energy feedback initiatives assume that consumers are rational decision makers and that, on the basis of available information, they will make a cost-benefit analysis of their particular actions (e.g., turning on the air-conditioning or a washing-machine) in order to maximize their own personal utility. But at the same time, the authors pay attention to the feedback related studies, having its origin in sociology and psychology, focusing more on the internalized and dynamic nature of social and cultural context within which digital feedback technologies are provided.
Finally, many studies have shown a relatively low level of consumers’ knowledge and interest about smart metering [53,54]. It was found out that only consumers who were already interested or involved in energy savings were willing to use SMP and learn from them [54,55]. Even if consumers have the initial interest in SMP, it is uncertain whether such engagement will persist over the longer period of time [45,56].
Taking all studies into consideration, one may conclude that the success and effectiveness of feedback is not as easy as it might seem. Both rational (e.g., financial) and irrational (e.g., emotional) arguments should be integrated in order to design feedback tools in a proper way.

2.3. Energy Monitoring

So far, very few studies have examined the determinants of willingness to monitor energy consumption [42,52]. Energy monitoring has been found a distinct practice that focuses on measuring and identifying energy use trends and requires specific knowledge how to perroceed [52]. Measuring is a first step in monitoring energy usage. As already mentioned, it can be achieved in traditional (based on electricity bills) or modern (smart technology-based, e.g., via SMP manners). Identifying starts with observation of the measurements collected, followed by a subsequent cross-checking and comparative analysis. The process of both measuring and identifying facilitates learning about energy use, which is what monitoring is really about [52]. Energy monitoring may lead to an increased awareness of consumers’ energy usage, reflection about energy consumption, realizations about the relevance of one’s own behavior, and an ability to link consumption to specific home appliances [51]. In particular, contextualized consumption feedback and household specific awareness campaigns may raise consumers’ awareness and interest [46].
Most of the research that has already been done focused on the interpretation of the outcomes of energy monitoring activities and real-time feedback on e.g., energy savings (see e.g., [33,46,51]). In the work of Buchanan et al. [51], the authors showed that energy monitoring neither empower consumers with an increased sense of personal control nor prompt them to be confronted with an environmental problem or to activate specific motives. Rather, consumers had previously encountered various problems (e.g., high electricity bills) which had already activated certain motives and goals (e.g., desire to save money) and prompted them to purchase an energy monitoring equipment (e.g., smart plugs or in-home displays). The same authors emphasize that while feedback may enable households to associate energy savings with their behaviors, there is still a substantial period of time between engaging in an eco-actions and being rewarded for doing so where consumers pay for electricity in arrears and/or via fixed monthly payments [51]. In the study of Podgornik et al. [46], the authors have shown that customized consumption feedback is needed to influence on the energy savings and the change in energy-behavior patterns. Finally, Foulds et al. [52] couldn’t prove any connection between monitoring and other household practices. So monitoring does not necessarily enhance reorganization of other household practices to induce e.g., household energy saving. Monitoring may rather follow decisions to make energy-related changes, rather than prompt them [52].

3. Survey Design of the Current Study

3.1. Geographical Background

We focus on determinants to monitor energy usage among citizens of Wroclaw—the capital city of the Lower Silesia Province in the southwest part of Poland. We have chosen Wroclaw, because in years 2015–2017 the local distribution system operator (Tauron Dystrubucja) within the project AMIPlus Smart City Wroclaw aimed at installation of smart meters for all the households. In the end of year 2018, 97% of smart meters have been already installed. Apart from the smart meters, the households have received access to the information about their energy consumption via web-platform TAURON eLicznik (SM platform, SMP) for smartphones or tablets and may obtain alerts when the aimed energy consumption level is exceeded. Households may also activate the connection between their home area network (HAN) and the SMP. All of the proposed solutions are very innovative and they are still not very popular among consumers.
One must be aware that Polish energy sector experiences currently several severe problems such as capacity problem (due to the decommissioning of old generation units), weak transformation network, fossil-fuel-based energy generation (over 80% of the energy mix depends on hard coal and lignite), upward trend in electricity consumption, as well as the obligation to increase the share of RES in the total energy production (only approx. 8% in 2014) and to increase energy efficiency in generation, transmission and consumption while limiting the CO 2 emissions (due to the Climate Policy Agreements) [57,58,59,60,61]. Taken all the current issues into account, the main challenges are related to the infrastructure, economic and political ones.
Smart grids belong to one of the remedies proposed in the Polish Energy Policy 2050 (PEP 2050) to the current problems of the Polish power sector. Introduction of smart grids and smart metering systems should be considered while developing the transmission and distribution systems [60]. Among many potential benefits, first of all smart grids should allow for better communication between end-users and energy suppliers. Secondly, real time price signals should also raise the potential of demand side management and demand response tools (DSM/DR). Thirdly, the development of smart grids would optimize the management of the grid, which could result in increasing of its security and reducing the costs of exploitation [60].
Wroclaw is the fourth largest Polish city with currently approx. 636,000 inhabitants covering an area of 293 km 2 and forming the most important Polish urban center near the border with Germany and the Czech Republic. It is also the capital of Lower Silesia and the hub of Wrocław’s agglomeration with around 1 million inhabitants [62,63]. In terms of social-economic issues, the city experiences similar problems and challenges as the rest of the Polish major agglomerations such as: society aging, development of the service sector, together with deindustrialization and urban spread [62]. Demographic problems in Wroclaw are very significant. Let’s just mention that several people belonging to retirement age group (in Poland: women above 60 years old and men above 65 years old) have increased recently from 11.4% to 22.7% of Wrocław’s inhabitants [62]. At the same time Wroclaw serves as the administrative, socio-economic and cultural hub, with a high level of all manufacturing activities such as production of buses, trams, railroad cars, home appliances, chemicals and electronics, IT and financial services, and retail and real estates [63]. It is also one of the largest academic and cultural centers. The official slogan of Wroclaw, which is “Wroclaw—the meeting place”, emphasizes the multiculturalism of the city [62]. Finally, the city can show off its increasing economic growth with a very low unemployment rate in comparison to the whole Poland and Lower Silesia Province. In 2015 the calculation of GDP per capita was 61% higher than the national average and about 44% higher than the average for the province of Lower Silesia (for more economic data, see https://invest-in-wroclaw.pl/en/dane-ekonomiczne/).
Also the energy sector in Lower Silesia faces similar problems as the rest of the Polish power generation system. The old generation units and weak transmission network belong to the most significant ones. The energy is mainly produced from coal but the increase of share of renewables such as water, wind and solid-biomass power plants can be observed. The region, and Wroclaw in particular, has a great problem with the with overproduction of greenhouse gas (GHG) emissions. According to Baseline Emission Inventory in Wroclaw Low Emission Economy Plan, over 85% of total GHG emissions in Wroclaw municipality in last years resulted from energy consumption. Settlements (energy use in buildings) are responsible for 63% of citywide GHG emissions through the consumption of electricity, heating and district heating, using coal and natural gas in individual heating systems, see [63] for further details.
The demographic, cultural and economic attributes of Wroclaw indicate this city might be quite open to the various novelties, smart-products and technologies available in the market. In the field of energy, as the local energy provider has decided to run a project aiming in the implementation of smart metering, it could be a good opportunity to explore the Wroclaw citizens’ attitudes and willingness to monitor energy consumption, which is assumed to be a first step in adopting smart metering technologies. It could be also a good occasion to suggest some effective ways of proposing the marketing strategies for enterprises (e.g., energy sellers and suppliers of various enabling technologies and others) to increase the potential interest of the electricity customers.

3.2. Stages of Behavioral Change

Many theories explain how attitudes affect behaviors related to energy consumption. Among these models, let us mention the Theory of Planned Behavior, Values Belief Norm, the Technology Acceptance Model, Norm Activation Model, Value Identity Personal Norm Model or The Cultural Model of household energy consumption [18,19,32,64].
Among available models our approach has been motivated by the self-regulated behavioral change model (SSCB) developed by Bamberg [26] and mainly used for promotion of healthy and mobility behaviors [25,65], but also for examination of the effectiveness of the intervention related to energy saving behaviors [66] and adoption of SMPs in Germany [18]. The SSCB model allows to verify consumers’ stage of SMP adoption. It corresponds to the steps of innovation diffusion of Roger’s model [27], but it focuses more on individual decisions and takes into account differences in peoples’ attitudes and intentions. Nachreiner et al. [18] indicate that the central assumption of the model is that under certain conditions, people are willing and able to change their behavior and that the process of intended behavioral change occurs in a time ordered sequence of four distinct stages. Combining classic stage models (see e.g., [67]) and the theory of planned behavior (TPB) [20], the SSCB model takes into account psychological variables such as: attitudes towards a certain behavior, subjective and social norms, and perceived behavioral control (e.g., difficulty of adoption) that affect different stages.
We assume that to adopt monitoring behavior via SMP, the person needs to have positive attitudes towards monitoring, and must believe that he or she has some impact on the energy efficiency through his or her actions. This person should also have some basic knowledge regarding energy market. Such general positive opinions and experience with monitoring behaviors may lead to creation of so-called goal intention. Furthermore, the goal intention can be transformed into behavioral intention under fulfillment of some conditions regarding perceived behavioral control. As in the TPB model, the behavioral intention is influenced by positive attitudes towards monitoring, subjective and social norms regarding monitoring and perceived behavioral control (such as: feasibility to regular monitoring of energy). Once a behavioral intention is established a person can be motivated to engage in a given behavior. Finally, the new behavior can be adopted - in our case - regular usage of SMP to monitor and control energy consumption.

3.3. Data Collection and the Sample

In March 2018 residential consumers in Wroclaw (N = 500) were interviewed by a professional polling agency by means of a telephone survey. The questionnaire consisted of a few blocks of questions regarding respondents’ environmental attitudes and behaviors, knowledge about energy market, ways of monitoring energy usage at their households, consumers’ attitudes towards SM platform and socio-demographic variables. The inclusion criteria to the study were whether a respondent was responsible for paying household’s electricity bills and above 18 years of age. The definition of the variables and their coding are presented in Table 1 and the frequencies of the demographic variables in Table 2.
A total of 62.6% of the participants are female. As for age, 25.5% of the sample is between 25–34 years old, 11.2% between 35–44 and 15.5% between 45–59. The rest of the sample is over 60 years old. Such a demographic corresponds to the current demographic situation in Wroclaw. According to the data from the Polish Central Statistical Office, 22% of Wroclaw citizens are already retired. Most of the respondents 61.2% declared higher education. Around 25% of participants reported living in a house (detached, semi-detached or a terrace house) and 51.8% in a block of flats or apartments. Less than half of respondents, 43.6%, perceive the financial situation of their household (i.e., average income) to be on the moderate level (but even 20.4% believe that their incomes are higher than average). Mean of respondents’ monthly electricity bill equals M = 143 PLN (=33 Euro), SD = 125. All together women, older people and people with higher education level are marginally over-represented in our study.

3.4. Methods

We believe that the installation of a smart meter at home potentially involves two main behaviors of electricity consumers. First, they can interact with an SM device itself. This is, however, rather unlikely, as the device is not user-friendly and quite complex to handle. Second, consumers can use SM platform that allows them to follow their energy consumption patterns. We believe that monitoring of energy consumption patterns is the first step to raise awareness and interest among consumers towards more sophisticated DSM/DR tools, like dynamic electricity tariffs, in-home displays, smart-plugs, smart appliances or even home area networks (HAN). Therefore, within the study, we aim to identify what are the main determinants of monitoring energy usage and, in particular, using the SM platform by energy consumers. Based on the literature review, we have identified a set of individual variables that may account for adoption and non-adoption of SM solutions (see, e.g., [13,22,53,54,68,69,70]. As presented in Figure 1 to these variables belong:
  • environmental engagement: people’s propensity to engage in conservation behaviors from different subdomains (both: environmental attitudes and behaviors)
  • knowledge: basic knowledge regarding the energy market
  • experience in monitoring energy usage: what methods and behaviors have been already applied
  • attitudes and behaviors towards monitoring of energy usage by means of SM platform: items derived from SSCB model
  • demographic variables: e.g., income, gender, age, education.
The main attention within this study was paid to the current and potential ways of monitoring respondents’ energy usage. Hence, the respondents were asked about their current energy monitoring behaviors (questions E1–E6), attitudes towards monitoring in general (M1–M9) and attitudes towards monitoring by means of SM platform (M10–M15). The respondents were also asked to report endorsement of four stages of readiness towards monitoring of energy consumption (F1–F4). To all items participants responded on a 5-point Likert scale, where: (1) denotes no, (2) rather no, (3) hard to say, (4) rather yes, (5) yes. The questions M1-M9 regarding general attitudes towards monitoring were asked to all the respondents (N = 500), and questions M10–M15 (focusing on the attitudes and usage of SMP) were asked to only those respondents who have declared to use SMP at least once (n = 33).
Then, all of the respondents were asked to make a stand towards four possible stages regarding usage of SMP for monitoring aims (F1–F4). Four stages of readiness were measured with four following statements:
  • pre-decisional stage F1: “I am not interested whether I have a SM installed and I never use a SM platform. I feel content with this behavior and I do not see any reason to change it”;
  • pre-actional stage F2: “I would like to monitor energy consumption more frequently, but I am not sure whether and how I can achieve this goal”;
  • actional stage F3: “It is my firm goal to organize my everyday activities so that I monitor energy consumption at my household e.g., via SM platform. I intend to find out whether my SM has already been installed and whether I already have an access to SM platform”;
  • post-actional stage F4: “I often monitor energy consumption in my household via e.g., SM platform. I will maintain this behavior throughout the next months and might even intensify my efforts”.
In the pre-decisional stage the main goal is to raise people’s awareness, enhance positive attitudes and extend knowledge of the promoted behavior. In the pre-actional stage the focus is on incentives and cues that would make people actually engage in behavior. In actional stage consumers visit the SM platform on a regular basis and express willingness to get more knowledge about ways of energy conservation and optimal energy consumption. In this phase we would also expect them to express interest in having additional electronic equipment, which is necessary for real demand management and demand response. For example they may express interest in having in-home displays, smart-plugs, smart-appliances or even HAN applications. In post-actional stage we expect that consumers will either continue the adoption to SMP or will discontinue because of e.g., dissatisfaction or disappointment.

4. The Results and Discussion

To explore the determinants of the willingness to monitor energy usage, in general and via SMP, we performed following statistical analyses. First, in order to describe the sample and show relations between the chosen variables, descriptive statistics and pairwise analysis of correlation were used. Then, to explore the predictors of the endorsement of the stages of readiness to adopt SMP (F1–F4) the logistic regression models were performed. All calculations have been performed in SPSS statistical program.

4.1. Monitoring of Energy Usage

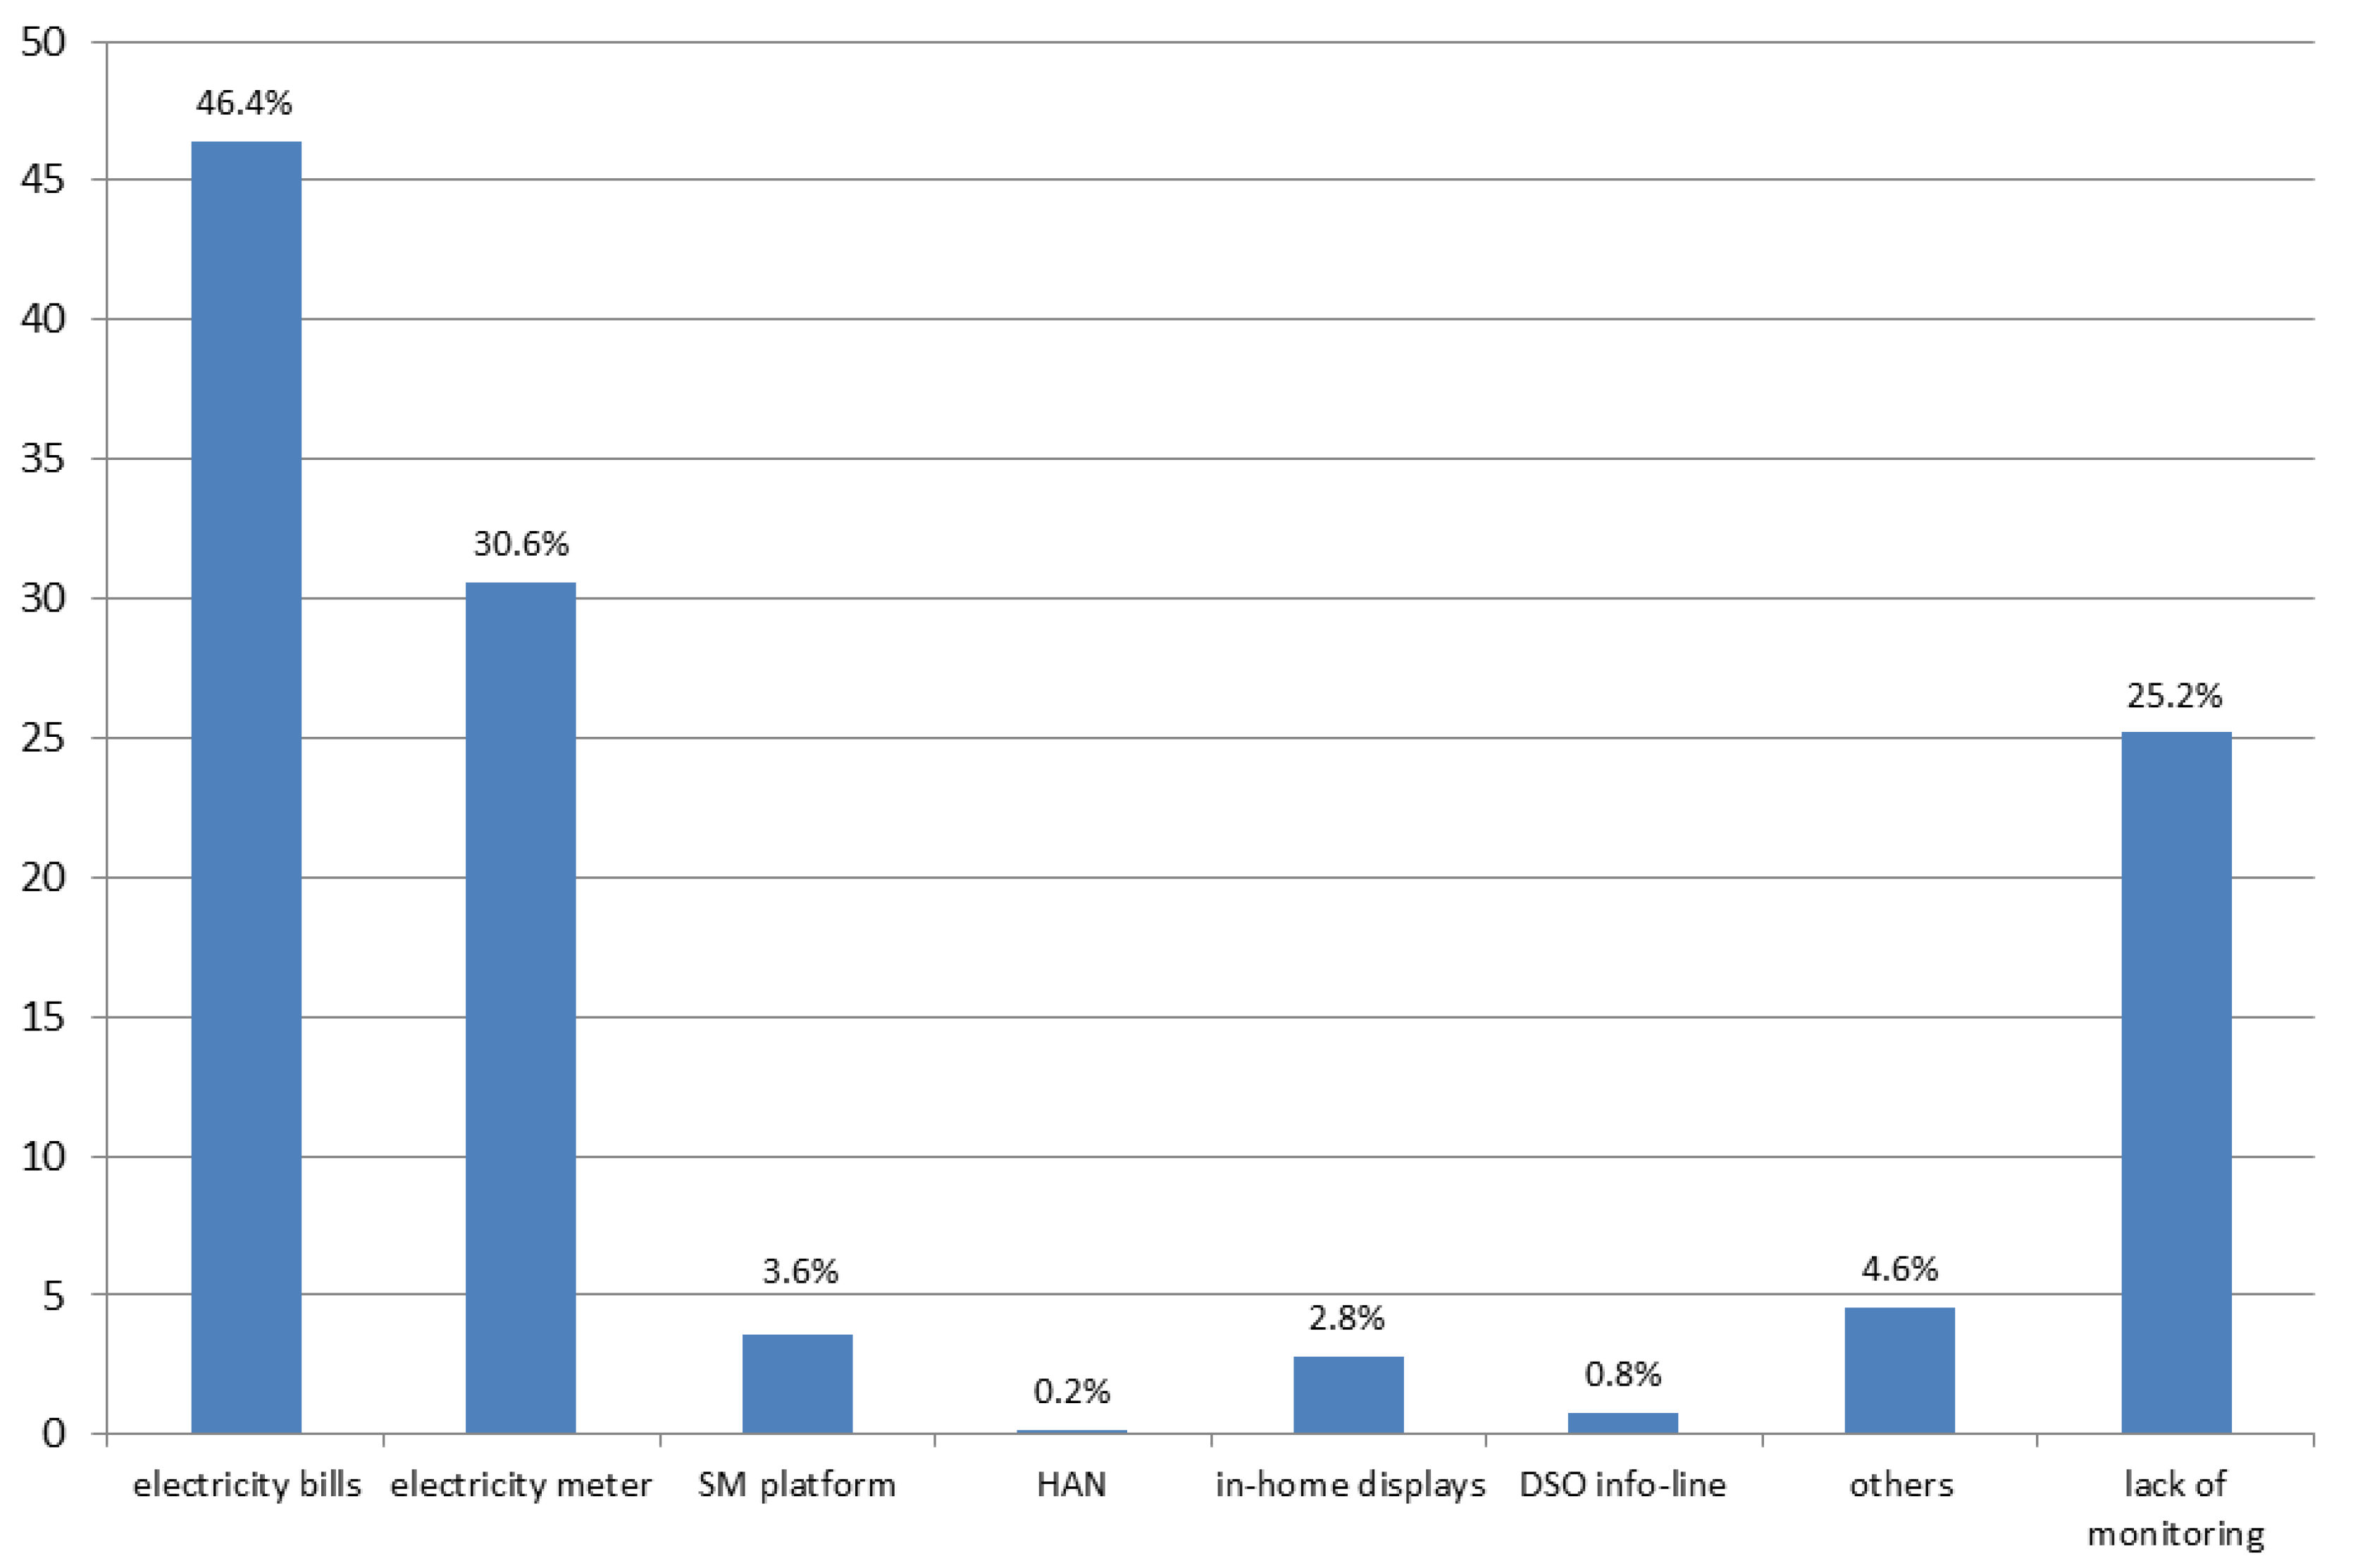
First, based on the questions regarding monitoring behaviors, it was found that almost one quarter of the respondents do not monitor their energy consumption at all (see Figure 2). Out of those who reported to monitor energy consumption, 46.4% monitors their consumption by the means of the electricity bills. One third, (30.6%) uses information from traditional and smart electricity meters. Very few of the respondents have already used SM platform (3.6%), home area network (HAN) (0.2%) or in-home displays (2.8%). The monitoring activities mentioned by the respondents in the category “others” included: turning off the lights, avoiding keeping home appliances in stand-by mode, using a washing-machine and a washer when they are fully loaded, or investments in energy efficient home appliances. As one may notice these reported activities aim rather at energy reduction than at monitoring by itself.
Second, to investigate respondents’ attitudes regarding energy monitoring in general and by means of SMP we asked 15 questions, inspired by other studies [26,
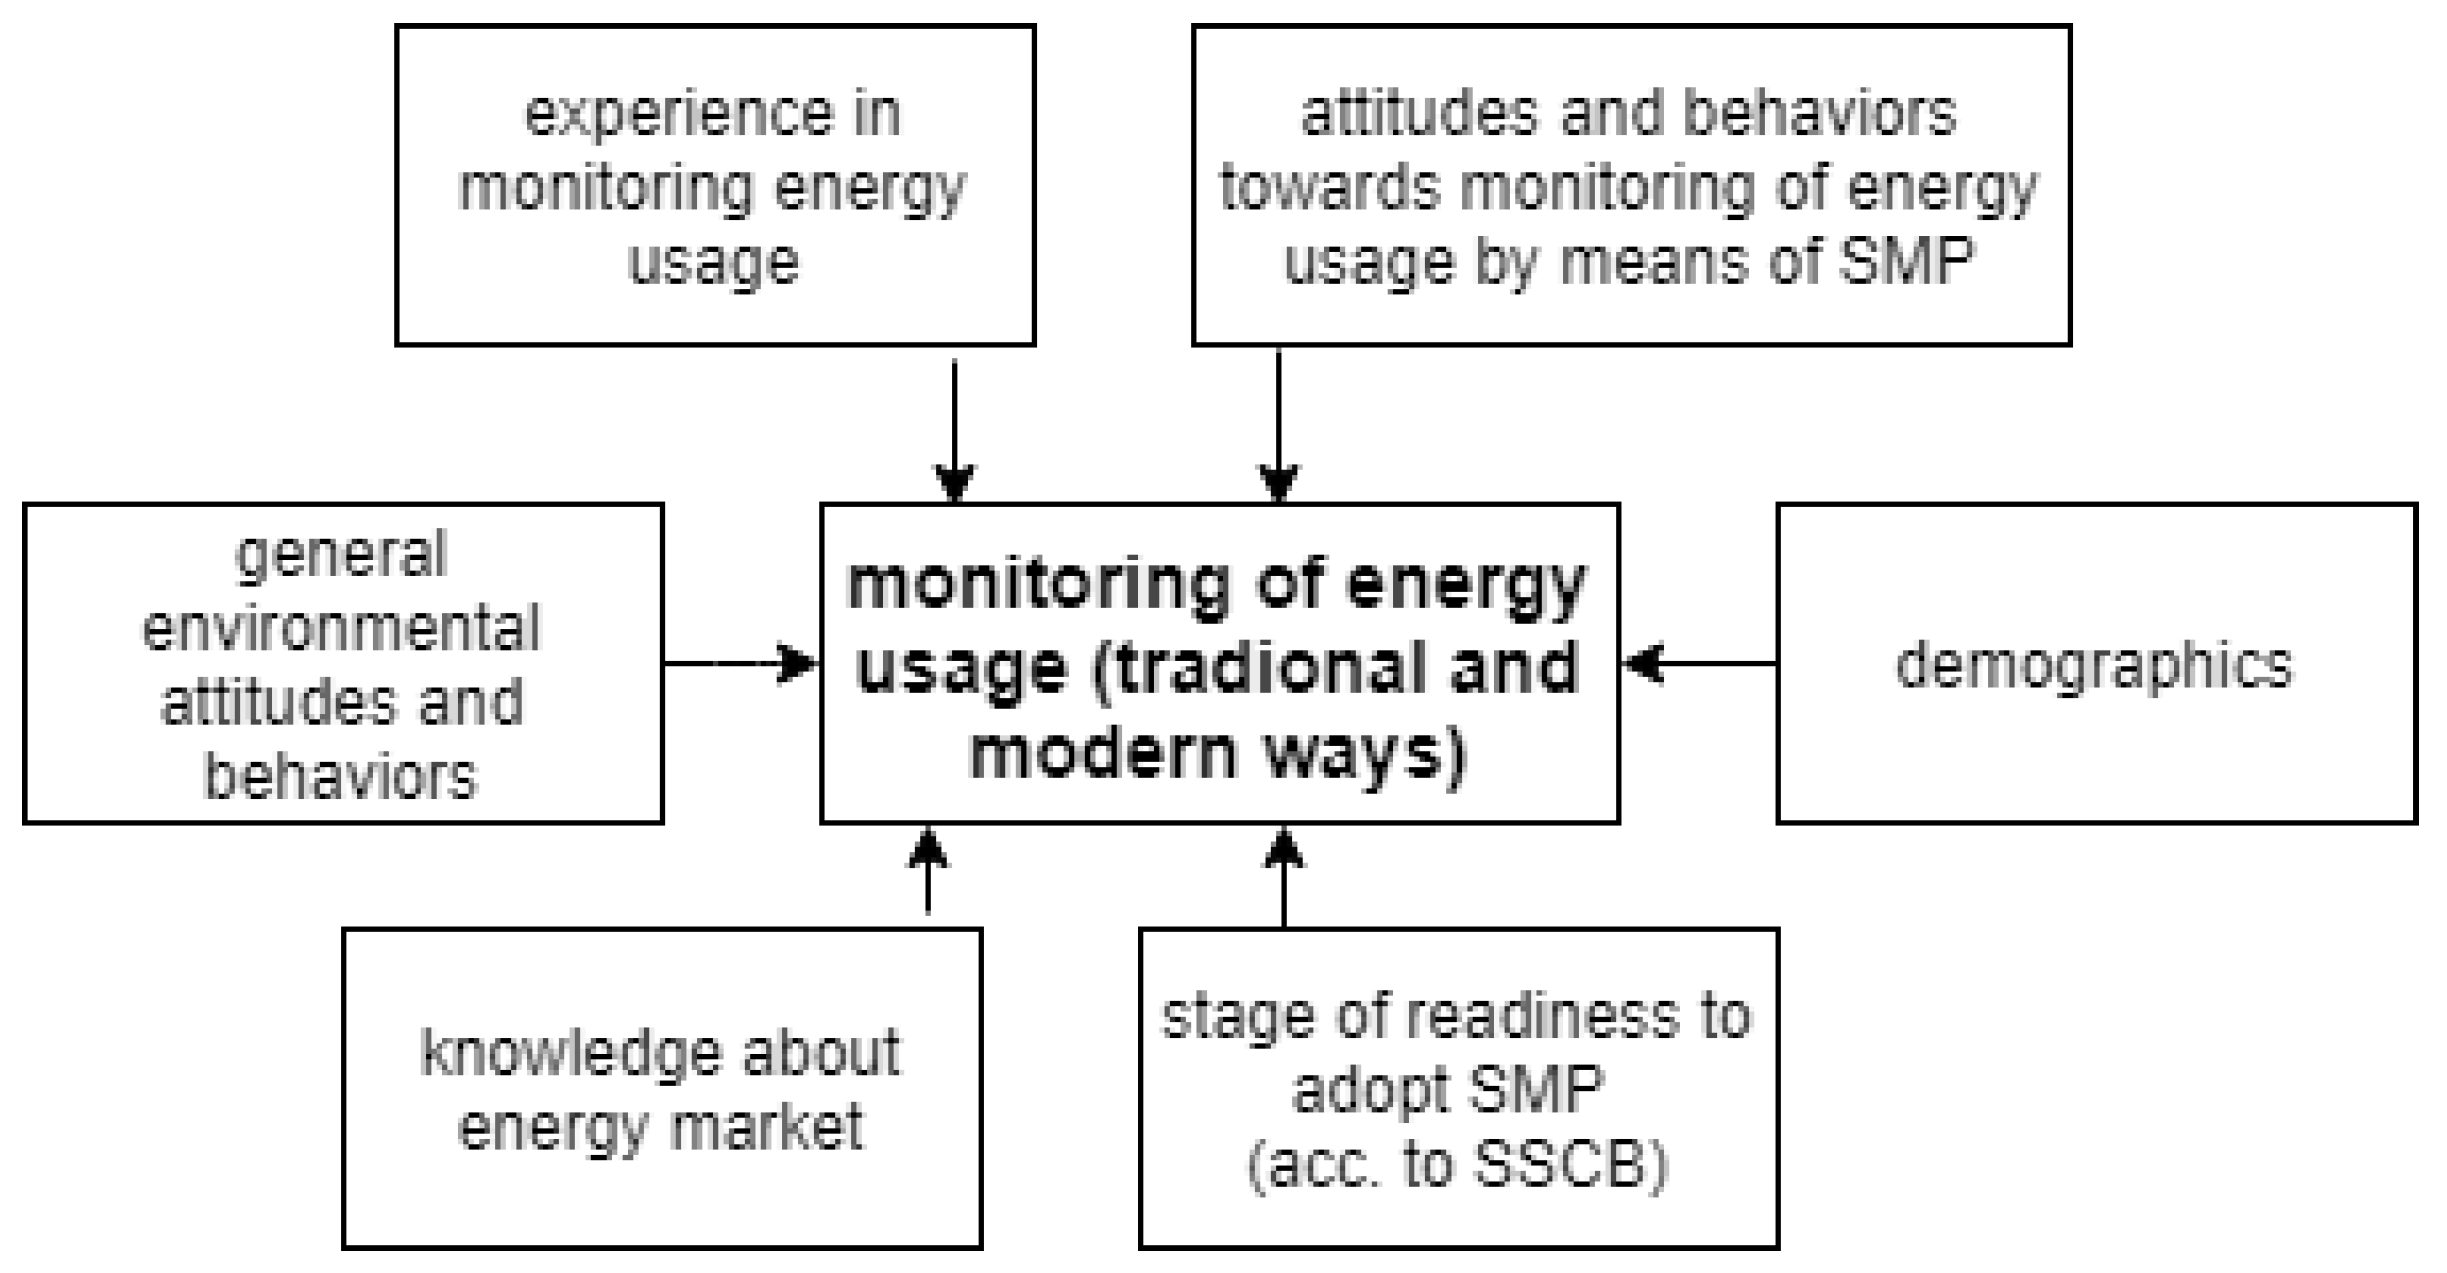
65]. In particular we wanted to explore: (M1) problem awareness, (M2) personal responsibility, (M3) personal norms, (M4) social norm, (M5) positive emotions, (M6) negative emotions, (M7) perceived behavioral control or goal feasibility, (M8) goal intention, (M9) attitudes, (M10) behavioral intention, (M11) action plan, (M12) coping plan, (M13) maintenance efficacy, (M14) implementation intention, (M15) recovery efficacy, see Table 3.
Most of the respondents revealed rather positive attitudes and emotions towards monitoring (M1–M3, M5) with the mean value above M = 4.0. Most of the respondents (66%) declared to have intention to contribute to environmental protection by regular monitoring of energy usage (M9). At the same time 37% of them have not started any monitoring energy consumption (E6).
In case when the respondents already had an experience with SMP, 72% had an intention to use SMP in their households (M10). At the same time 57.5% of the respondents have not got an exact plan when and how to use SMP to monitor energy usage (M11). Even more of them (70%) have not anticipated potential problems that can occur and hinder regular usage of SMP (M12) and have not developed ways to overcome those obstacles (M13).
Following, we report the endorsement of four stages of readiness. For stage F1 the reverse coding was used. The mean value and standard deviations for all the stages are as follows: for stage 1 the mean value is M = 2.58 (SD = 1.56), for stage 2 the mean value is M = 2.62 (SD = 1.68), for stage 3 the mean value is M = 2.85 (SD = 1.67), and for stage 4 the mean value is M = 1.69 (SD = 1.32).
In 
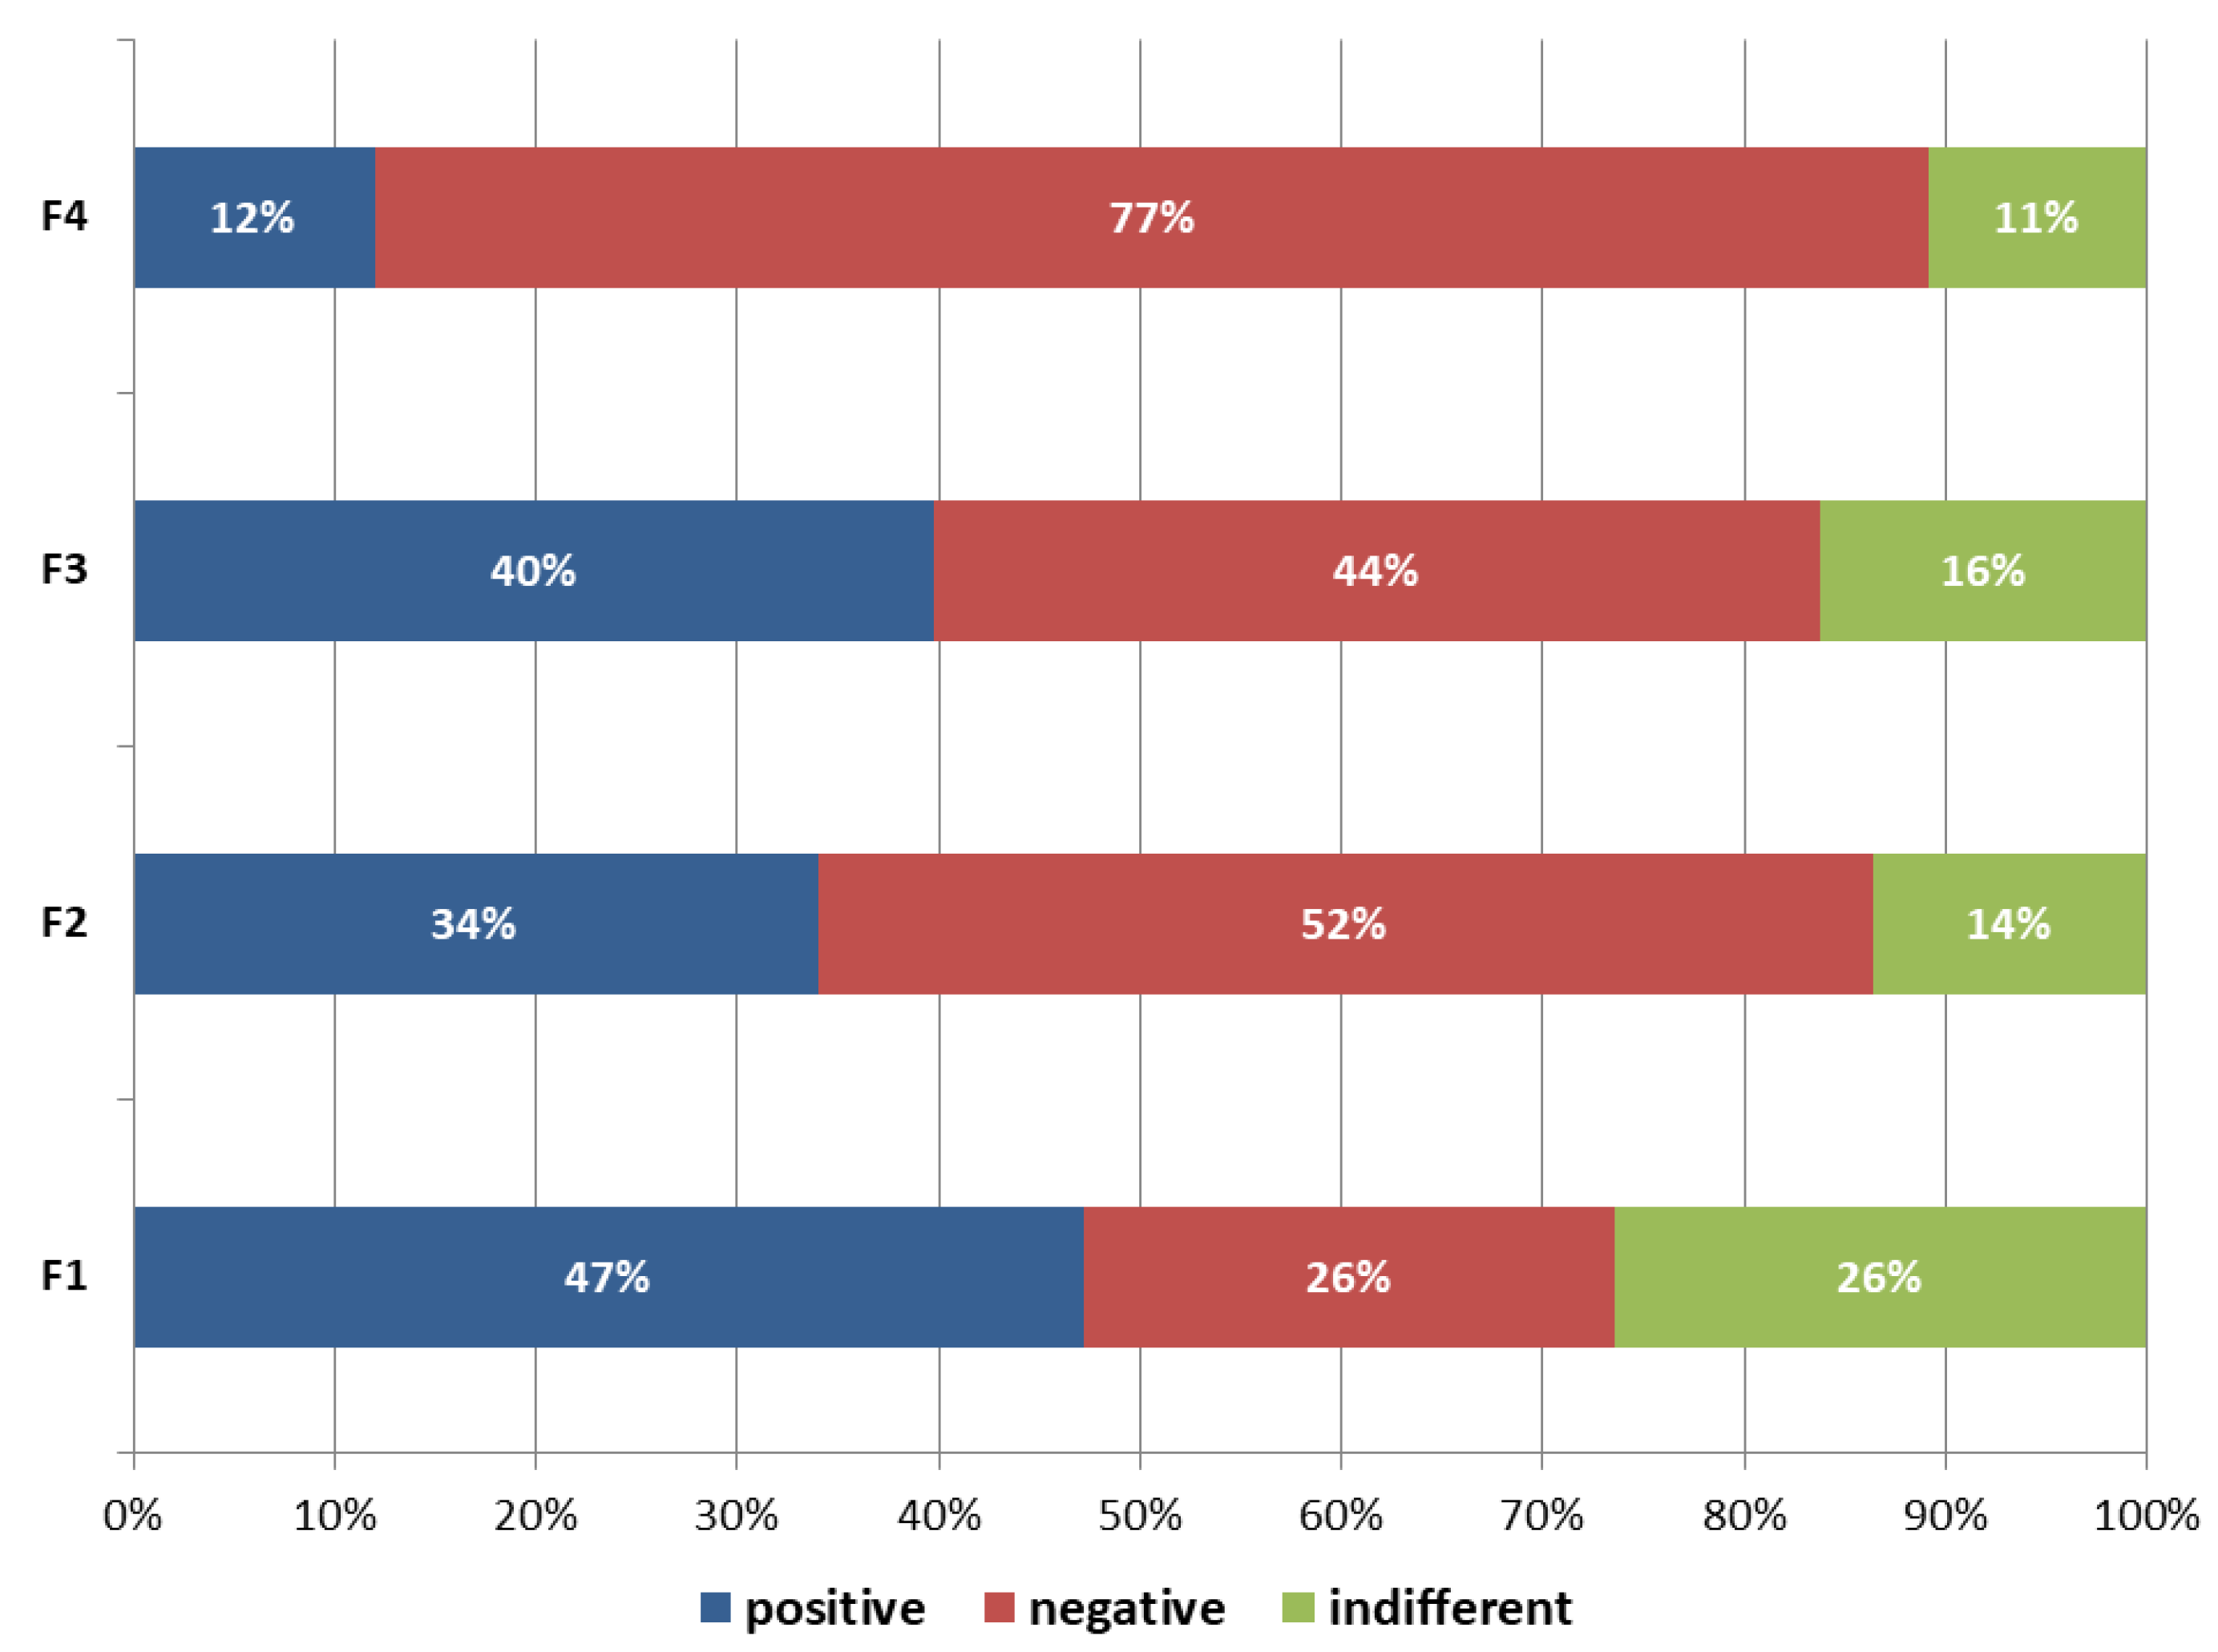
Figure 3 the negative answers (“no” and “rather no”) as well as positive answers (“yes” and “rather yes”) were aggregated. In stage F1 47% of respondents declined and 26% of respondents confirmed that they do not know and that they are not interested whether they have SM installed or how to use SMP, and another 26% of respondents were indifferent. Also stage F3 had relatively large share of affirmative answers (40%). It included those of the respondents who declared willingness to monitor energy usage and were ready to check whether they have had smart meter already installed at their household together with the free access to the SMP. At the same time 44% of respondents were negative about this statement and 16% were indifferent. Those proportions look even worse for the stages F2 and F4. In case of F2, most of the respondents (52%) did not want to monitor energy usage. In stage F4 only 12% of respondents admitted to regular monitoring of energy usage by means of SMP and wanted to continue such a behavior in the future.

4.2. Knowledge: As a Premise of SMP Adoption

Within the questionnaire the respondents were asked 6 questions measuring their level of knowledge, see Table 4. Apart from question K4, where the answer = (1) was a correct one, in the rest of the questions K1–K3 and K5–K6 the answer = (2) was correct. Most of the respondents were able to choose a proper answer in case of questions K3 (71.8%) and K4 (even 88.8%). Around half of the respondents were able to show the correct answer for questions K2 and K6 (each 57%). The questions K1 and K5 were the most difficult for the respondents. In case of question K1 even 65% of respondents choose the answer “hard to say” and only 14.4% knew the correct answer and in case of question K5 77.8% and 16.6% respectively.

4.3. Preliminary Results: Association between Relevant Variables

To observe some initial information regarding the relations between readiness to adopt SMP (stages F1–F4) and eco-attitudes, knowledge and attitudes towards monitoring, Kendall’s test of correlation was conducted, see Table 5. As education, housing, electricity bill and pro-environmental behaviors occurred to be insignificant in terms of SMP adoption (p-value p > 0.1 ), they were excluded in further analysis and discussion.
We found that pre-actional stage (F1) correlates positively with: eco-attitudes and stage F2 and negatively with: knowledge, stage F4, as well as, with two statements regarding monitoring: M7 (“It is possible for me to regularly monitor of energy usage”) and M8 (“I think that monitoring of energy usage is good”). It shows that respondents who are not interested in new, innovative technologies, like SM or SMP, can still have positive environmental attitudes. Moreover, they can believe that monitoring of energy usage is good (M8) and they see a possibility of regular monitoring (M7), but not via the SMP. Moreover, we even see that people who are not interested in monitoring via the SMP, would like to monitor their energy usage, but they just do not know how to do this (F2).
Then, in case of stage F2, there is a weak positive correlation with positive attitude about monitoring (M8). It shows that once respondents claim that they would like to monitor energy usage, but they do not know how (F2), they are ready to check whether they have SM installed together with an access to the SMP (F3). At the same time, they are not ready to monitor energy usage via SMP regularly (F4).
Stage F3 is correlated with knowledge and phase F2. Among all the phases, stage F3 reveals the strongest correlation to knowledge. Those who are sure that they want to monitor energy usage and are ready to check whether they have proper infrastructure (SM, SMP), have the largest level of knowledge regarding modern energy market. This phase correlates also with M7 and M8, which is quite obvious.
Finally stage F4 is negatively correlated with F1, F2 and F3. Stage F4 presents endorsement of regular monitoring of energy usage via SMP and a willingness to continue this behavior in the future, so it must be negatively correlated with all the previous stages: F1–F3 and positively with M7 and M8.

4.4. Determinants of the Readiness to Monitor Energy with SMP

To further investigate the relation between the stage of readiness to monitor energy in four stages of adoption (F1-F4) and a set of variables, we performed four binary logistic regressions. One for each stage. Readiness to monitor energy via SMP was treated as a dependent variable ( Y i ), and independent variables were: demographics (inc. gender, age and material situation), eco-attitudes, knowledge and a variable describing the perceived behavioral control regarding regular monitoring of energy usage.
Before the regression analysis, responses were transformed into dichotomous variables (0/1) as the distribution of the data showed that middle responses were extremely rare. The reference category for dichotomous responses was the positive response ”yes” and ”rather yes” coded as: (1) and the negative response ”no” and ”rather no” were coded as (0). The item in stage F1 was negatively coded and was reversed before the analysis.
In each analysis we performed a step-wise procedure. For each stage, in the step 0 only a constant variable was included in the initial model. Then, in the step 1 in block 1 we added demographic variables: gender (D1), age (D2) and income (D5). In step 1 in block 2 we added the variable (Am), which is the mean value of pro-environmental attitudes (A1–A6) and the variable (Ks), which is the sum of correct responses regarding knowledge (K1–K6). Finally, in step 1 in block 3 we added the variable M7: ”I see a possibility of regular monitoring of energy in my household”. The same procedure was repeated for all the stages of readiness to adopt SMP.
A general description of the logistic regression model is given in Equation (1) below,
P r o b ( Y i = 1 ) = e x i β ( 1 + e x i β )
where β stands for a vector of the model coefficients and x i denotes a vector of the explanatory variables. Dependent variable Y i = 1 denotes that a respondent is in a given stage and Y i = 0 indicates that a respondent is not in a given stage. The aim of this model is to relate the probability of belonging to the certain stage of readiness ( Y i = 1 ) with a set of the explanatory variables ( x i ).
In stage F1, in step 1 the analysis yielded no significant results for demographic variables. That is, neither gender, nor age, nor income predicted whether participants were interested in monitoring energy using the SMP platform. In step 2 we introduced pro-environmental attitudes and knowledge. The analysis showed that pro-environmental attitudes were negatively related with the lack of interest in SMP (Wald = 10.25, p < 0.001). Knowledge was not a significant predictor. In the step 3, we introduced the possibility to monitor energy using SMP as a predictor and we found that higher perceived possibility was negatively related with lack of interest in monitoring (Wald = 10.14, p < 001). The effect of attitudes remained significant (Wald = 9.14, p < 001). The final logit model prediction capabilities were as follows: 68.5% with Log likelihood: 416.20, Nagelkerke R Square: 0.112, and Chi-square 10.209(1) with p = 0.001;
In stage F2, from all variables, we found that only the perceived possibility of monitoring energy using SMP and age predicted willingness to monitor energy consumption more frequently (Wald = 3.89, p < 0.001). The final model prediction capabilities were 58.9% with Log likelihood 527.34, Nagelkerke R Square: 0.028, and Chi-square 3.893(1) with p = 0.048;
In stage F3, age predicted responses that a participant had a firm goal to organize his or her everyday activities so that he or she will monitor energy consumption at a household e.g., via SM platform (Wald = 5.0, p < 0.001). In the step 2, knowledge (Wald = 6.22, p < 0.001) was a significant predictor, but age stopped to be. In the step 3, the possibility of monitoring (Wald = 14.42, p < 0.001) and knowledge (Wald = 5.53, p < 0.001) predicted the goal of monitoring. The whole model’s predictive capability was 57.6% with Log likelihood 508.24, Nagelkerke R Square: 0.093, and Chi-square 15.232(1) with p < 0.001;
In stage F4, only the possibility of monitoring energy (Wald = 20.25, p < 001), introduced in step 3, was a significant predictor of whether somebody responded that he or she often monitors energy using SMP and would like to maintain this behavior. The model’s predictive capability was 86% with Log likelihood: 299.04, Nagelkerke R Square: 0.153, and Chi-square 33.980(1) with p = 0.000.
The final results for each stage (step 3, block 3) are presented in Table 6 and consists of: the model coefficients ( β ), standard errors and the odds ratio ( E x p ( β ) ), which are the exponentiation of the coefficients, showing the marginal probabilities for the predictors.
In sum, in all stages the perceived possibility of monitoring energy predicted engagement in monitoring behaviors, even if demographic variables, attitude and knowledge were controlled for. Knowledge played a role only in stage F3, in which the motivation to find out how to monitor energy matters. In other words, knowledge predicted motivation to gain more knowledge. In stage F3, age predicted the engagement in the first step, but it was insignificant when introducing attitudes and knowledge. These results are in line with previous intuitive findings that people’s knowledge and positive attitudes towards the environment develop with maturation. The consistent results in all stages regarding the possibility to monitor energy as a significant predictor suggest that external facilitation and accessibility of SMP platforms might play a role in people’s willingness to use them.

5. Conclusions

Within our study we have managed to show how consumers’ environmental attitudes, knowledge and experience with monitoring of energy usage and demographics affect their willingness to monitor energy consumption, both in traditional and modern ways. Even if our study has been conducted for one city, it allows for drawing some general conclusions regarding the consumers’ attitudes and behaviors in the energy market.
The main attention within this study was payed to the current and potential ways of monitoring energy usage by the residential consumers. Among traditional ways of monitoring, our respondents mainly mentioned electricity bills as their major source of information. So far, SMP are rather unknown and very rarely used (ca. 4% of our sample), even if they are available for free for all the clients who have already been connected with the energy supplier via a smart meter (more than 90% of the Wroclaw citizens). As some other studies have proved, the consumers still prefer traditional ways of energy monitoring to the SMP. It is mainly due to their lack of knowledge, experience and perceived accessibility to the web-based application combined with SM.
As in the mainstream literature regarding eco-feedback and consumers’ responsiveness to smart energy monitors, see for example [18,41,42,45,46,47,48,51,52,53,54,56], we have shown that positive environmental attitudes and positive thinking about monitoring (“energy monitoring is good”) is not enough to induce consumers’ long-term monitoring behaviors and to engage them to use SMP on a regular basis. Even if most of the consumers have revealed positive attitudes towards monitoring in general, and many of them have intended to contribute to environmental protection by monitoring their energy usage, at the same time, approx. 25% of them do not monitor energy consumption at all. It is a typical example of the intention-behavior gap, when the intentions and positive attitudes are not followed by actions. The same problems have been also revealed in other studies conducted by [11,12,13,14,18]. One of the possible explanations of such a gap is the people’s lack of knowledge how to achieve their goals and how to transform their positive attitudes and intentions into real actions.
Within this study we also wanted to shed some light on consumers’ willingness to monitor energy usage via SMP. As our study was inspired by the SSCB model, the readiness to adopt SMP was divided into four possible stages (F1–F4), starting from the pre-decisional stage F1 in which consumers are not interested in modern technologies like SM and SMP, through pre-actional stage F2 in which consumers would like to monitor energy consumption but do not know how, actional stage F3 in which they aim to monitor energy consumption and to check their access to SMP towards post-actional stage F4 in which consumers declare regular usage of SMP.
Based on the literature [6,19,36,51,52,54], we have expected to see that knowledge is one of the major predictors of the SMP adoption. However, among all the stages, only stage F3 has revealed strong correlation to knowledge. Those respondents who were sure that they wanted to monitor energy usage and were ready to check whether they had proper infrastructure (SM, SMP), had the highest level of knowledge regarding modern energy market. On the other hand, knowledge occurred to be negatively correlated with stage F1. Consumers who were less familiar with the energy market, were also less willing to monitor energy consumption via smart technologies. An important role of knowledge in explaining stage F3 has been also revealed in the regression model. Whereas in the rest of stages (F1, F2, F4) knowledge has not been found to be a statistically significant explanatory variable.
Surprisingly, the perceived possibility to monitor energy occurred to be a significant predictor in all four stages. Those consumers who were convinced by having the possibility of regular energy monitoring were more eager to get to know the SMP and to start using it on a regular basis (stages F3 and F4). It indicates that external facilitation and accessibility of SMP platforms might play a role in people’s willingness to use them. Without increasing awareness of SMP existence and its availability via smart phones, tablets or a personal computer, the consumers will not even start thinking about potential benefits of it in energy conservation. Those consumers who are already aware of SMP, need some clear guidelines how to use this source of information in a right, most effective way.
As general attitudes towards monitoring of energy usage are positive, it would be now recommended to encourage consumers to transfer their intentions into real action. It could be achieved by spreading the information via a social educational campaign about the reasons of enrollment from traditional into smart meters, its advantages for end-users of electricity as well as presenting SMP as a great source of information and control over one’s energy consumption.
From the point of view of enterprises in the energy market, such as energy suppliers but also producers of enabling technologies, our research gives some important hints. As the perceived possibility to monitor energy consumption both in traditional and modern ways has occurred to be the most important predictor in all stages of readiness of adoption, the suppliers of SMP, as well as other enabling technologies (e.g., smart plugs or smart appliances) need to find a way to convince consumers that first, monitoring of energy consumption is beneficial, and second that the usage of SMP or other smart technologies is not difficult. Our results indicate that the SMP suppliers should pay attention to the simplicity of the proposed solutions and its user-friendliness. Moreover, they have to spread the information about the advantages of SMP among the consumers, in order to raise their interest and engagement. Finally, as the willingness to energy monitoring is correlated to the environmental attitudes, knowledge about energy market and perceived behavioral control, the enterprises should use this information, while designing the innovations and marketing strategies aiming in launching the smart solutions into the energy market.

Limitations of the Study and Future Work

A conducted survey has some limitations. Firstly, the study was limited to the citizens of one city. Choosing the telephone survey instead of a web-based one, has lead to a very low response rate (1.8%). The sample is over represented in terms of age, gender and education, but this restriction seems not to have significant impact on the final results, as the readiness to adopt is not explained by any of the demographics variables (except negative impact of age on stage F2). The positive correlation between the stages F2 and F3 indicate the statements were too similar to each other and should be revised in the further studies.
We want to emphasize that within this paper the results of a preliminary study are presented. Future research will show the dynamics of readiness to adopt SMP in a longitudinal design. The future web-based study will benefit from the experience of the preliminary one and will get rid of most of the current limitations.

Author Contributions

Conceptualization, A.K.-P. and K.B.; methodology, K.B.; formal analysis, A.K.-P. and K.B.; investigation, A.K.-P. and K.B.; data curation, A.K.-P; data analysis, A.K.-P. and K.B.; writing—original draft preparation, A.K.-P.; writing—review and editing, A.K.-P. and K.B.; visualization, A.K.-P.; supervision, A.K.-P.; project administration, A.K.-P.

Funding

This work was funded by the National Science Center (NCN, Poland) by grant no. 2016/23/B/HS4/00650.

Acknowledgments

The authors are grateful to the Reviewers for their constructive and insightful remarks and suggestions.

Conflicts of Interest

The authors declare no conflict of interest.

Abbreviations

The following abbreviations are used in this manuscript:
RESRenewable Energy Sources
IESInnovative energy services
HANhome area network
SGsmart grids
SMsmart metering
SMPsmart metering platform
DSOdistribution system operator
SSCBself-regulated behavioral change model
TPBtheory of planned behavior

References

  1. European Commission. EU Climate Policy 3x20. 2007. Available online: http://ec.europa.eu/clima/policies/package/index en.htm (accessed on 2 March 2019).
  2. European Commission. Directive 2012/27/EU of the European Parliament and of the Council of 25 October 2012 on energy efficiency, amending directives 2009/125/EC and 2010/30/EC and repealing directives 2004/8/EC and 2006/32/EC. Off. J. Eur. Union 2012, L315, 1–56. [Google Scholar]
  3. European Commission. European Commission: Accelerating Clean Energy Innovation: COM(2016) 763 Final: Winter Package. Available online: https://ec.europa.eu/energy/sites/ener/files/documents/1_en_act_part1_v6_0.pdf (accessed on 15 April 2018).
  4. Vassileva, I.N.; Odlare, M.; Wallin, F.; Dahlquist, E. The impact of consumers’ feedback preferences on domestic electricity consumption. Appl. Energy 2012, 93, 575–582. [Google Scholar] [CrossRef]
  5. Darby, S. Smart metering: What potential for household engagement? Build. Res. Inf. 2010, 38, 442–457. [Google Scholar] [CrossRef]
  6. Good, N.; Ellis, K.; Mancarella, P. Review and classification of barriers and enablers of demand response in the smart grid. Renew. Sustain. Energy Rev. 2017, 16, 57–72. [Google Scholar] [CrossRef]
  7. Kahma, N.; Matschoss, K. The rejection of innovations? rethinking technology diffusion and the non-use of smart energy services in Finland. Energy Resour. Soc. Sci. 2017, 34, 27–36. [Google Scholar] [CrossRef]
  8. Krishnamutri, T.; Schwartz, D.; Davis, A.; Fischof, B.; de Bruin, W.B.; Lave, L.; Wang, J. Preparing for smart grid technologies: A behavioral decision research approach to understanding consumer expectations about smart meters. Energy Policy 2012, 41, 790–797. [Google Scholar] [CrossRef]
  9. Paetz, A.-G.; Duetschke, E.; Fichtner, W. Smart homes as a means to sustainable energy consumption: A study of consumer perceptions. J. Consum. Policy 2012, 35, 23–41. [Google Scholar] [CrossRef]
  10. RWE Report. What Poles Think about the Energy Market? The Report for RWE Polska S.A.. 2014. Available online: https://www.innogy.pl/en/about/about-group (accessed on 2 March 2018). (In Polish).
  11. Diaz-Rainey, I.; Tzavara, D. Financing the decarbonized energy system through green electricity tariffs: A diffusion model of an induced consumer environmental market. Technol. Forecast. Soc. Chang. 2012, 79, 1693–1704. [Google Scholar] [CrossRef]
  12. Gadenne, D.; Sharma, B.; Kerr, D.; Smith, T. The influence of consumers environmental beliefs and attitudes on energy saving behaviors. Energy Policy 2011, 39, 7684–7694. [Google Scholar] [CrossRef]
  13. Ozaki, R. Adopting sustainable innovation: What makes consumers sign up to green electricity? Bus. Strateg. Environ. 2011, 20, 1–17. [Google Scholar] [CrossRef]
  14. Valkila, N.; Saari, A. Attitude-behavior gap in energy issues: Case study of three different Finnish residential areas. Energy Sustain. Dev. 2013, 17, 24–34. [Google Scholar] [CrossRef]
  15. Kowalska-Pyzalska, A. What makes consumers adopt to innovative energy sources in the energy market? A review of incentives and barriers. Renew. Sustain. Energy Rev. 2018, 82, 3570–3581. [Google Scholar] [CrossRef]
  16. Huang, Q.; Lu, C.; Chen, K. Smart Building Applications and Information Systems Hardware Co-design. Big Data Anal. Sens. Netw. Collect. Intell. 2017, 225–240. [Google Scholar] [CrossRef]
  17. Huang, Q. Review: Energy-efficient smart building driven by emerging sensing, communication, and machine learning technologies. Eng. Lett. 2018, 26, 320–332. [Google Scholar]
  18. Nachreiner, M.; Mack, B.; Matthies, E.; Tampe-Mai, K. An analysis of smart metering information systems: A psychological model of self-regulated behavioral change. Energy Res. Soc. Sci. 2015, 9, 85–97. [Google Scholar] [CrossRef]
  19. Ellabban, O.; Abu-Rub, H. Smart grid customers’ acceptance and engagement: An overview. Renew. Sustain. Energy Rev. 2016, 65, 1285–1298. [Google Scholar] [CrossRef]
  20. Ajzen, I.; Fishbein, M. The influence of attitudes on behavior. In The Handbook of Attitudes; Albarracin, D., Johnson, B.T., Zanna, M.P., Eds.; Erlbaum: Mahwah, NJ, USA, 2005; pp. 173–221. [Google Scholar]
  21. Gans, W.; Alberini, A.; Longo, A. Smart meter devices and the effect of feedback on residential electricity consumption: Evidence from a natural experiment in Northern Ireland. Energy Econ. 2013, 36, 729–743. [Google Scholar] [CrossRef] [Green Version]
  22. Allcott, H. Social norms and energy conservation. J. Public Econ. 2011, 95, 1082–1095. [Google Scholar] [CrossRef] [Green Version]
  23. Nolan, J.; Schultz, P.; Cialdini, R.; Goldstein, N.; Griskevicius, V. Normative social influence is underdetected. Personal. Soc. Psychol. Bull. 2008, 34, 913–923. [Google Scholar] [CrossRef] [PubMed]
  24. Perlaviciute, G.; Steg, L. Contextual and psychological factors shaping evaluations and acceptability of energy alternatives: Integrated review and research agenda. Renew. Sustain. Energy Rev. 2014, 35, 361–381. [Google Scholar] [CrossRef]
  25. Bamberg, S. Applying the stage model of self-regulated behavioral change in a car use reduction intervention. J. Environ. Psychol. 2013, 33, 68–75. [Google Scholar] [CrossRef]
  26. Bamberg, S. Changing environmentally harmful behaviors: A stage model of self-regulated behavioral change. J. Environ. Psychol. 2013, 34, 151–159. [Google Scholar] [CrossRef]
  27. Rogers, E.M. Diffusion of Innovations; The Free Press: New York, NY, USA, 2003. [Google Scholar]
  28. Strbac, G. Demand-side management: Benefits and challenges. Energy Policy 2008, 36, 4419–4426. [Google Scholar] [CrossRef]
  29. Rixen, M.; Weigand, J. Agent-based simulation of policy induced diffusion of smart meters. Technol. Forecast. Soc. Chang. 2014, 85, 153–167. [Google Scholar] [CrossRef]
  30. Verbong, G.P.J.; Beemsterboer, S.; Sengers, F. Smart grids or smart users? Involving users in developing a low carbon electricity economy. Energy Policy 2013, 52, 117–125. [Google Scholar] [CrossRef]
  31. Zhang, T.; Nuttall, W.J. Evaluating government’s policies on promoting smart metering diffusion in retail electricity markets via agent-based simulation. J. Prod. Innov. Manag. 2011, 28, 169–186. [Google Scholar] [CrossRef]
  32. Van der Werff, E.; Steg, L. The psychology of participation and interest in smart energy systems: Comparing the value-belief-norm theory and the value-identity-personal norm mode. Energy Res. Soc. Sci. 2016, 22, 107–114. [Google Scholar] [CrossRef]
  33. Faruqui, A.; Sergici, S. Household response to dynamic pricing of electricity—A survey of the experimental evidence. J. Regul. Econ. 2010, 38, 193–225. [Google Scholar] [CrossRef]
  34. Star, A.; Isaacson, M.; Haeg, D.; Kotewa, L. The dynamic pricing mousetrap: Why isn’t the world beating down our door? In Proceedings of the ACEEE Summer Study on Energy Efficiency in Buildings, Pacific Grove, CA, USA, 15–20 August 2010; pp. 257–268. [Google Scholar]
  35. Hu, Z.; Kim, J.-H.; Wang, J.-H.; Byrne, J. Review of dynamic pricing programs in the U.S. and Europe: Status quo and policy recommendations. Renew. Sustain. Energy Rev. 2015, 42, 743–751. [Google Scholar] [CrossRef]
  36. Claudy, M.C.; Michelsen, C.; ODriscoll, A.; Mullen, M.R. Consumer awareness in the adoption of microgeneration technologies. An empirical investigation in the Republic of Ireland. Renew. Sustain. Energy Rev. 2010, 14, 2154–2160. [Google Scholar] [CrossRef]
  37. Frederiks, E.; Stenner, K.; Hobman, E. Household energy use: Applying behavioral economics to understand consumer decision making and behavior. Renew. Sustain. Energy Rev. 2014, 41, 1385–1394. [Google Scholar] [CrossRef]
  38. Erell, E.; Portnov, B.A.; Assif, M. Modifying behaviour to save energy at home is harder than we think... Energy Build. 2018, 179, 384–398. [Google Scholar] [CrossRef]
  39. Scepanovic, S.; Warnier, M.; Nurminen, J.K. The role of context in residential energy interventions: A meta review. Renew. Sustain. Energy Rev. 2017, 77, 1146–1168. [Google Scholar] [CrossRef]
  40. Andor, M.A.; Fels, K.M. Behavioral Economics and Energy Conservation—A Systematic Review of Non-price Interventions and Their Causal Effects. Ecol. Econ. 2018, 148, 178–210. [Google Scholar] [CrossRef]
  41. Bonino, D.; Corno, F.; De Russis, L. Home energy consumption feedback: A user survey. Energy Build. 2012, 47, 383–393. [Google Scholar] [CrossRef] [Green Version]
  42. Burchell, K.; Rettie, R.; Roberts, T. Householder engagement with energy consumption feedback: the role of community action and communications. Energy Policy 2016, 88, 178–186. [Google Scholar] [CrossRef] [Green Version]
  43. Darby, S.; McKenna, E. Social implications of residential demand response in cool temperature climates. Energy Policy 2012, 49, 759–769. [Google Scholar] [CrossRef]
  44. Fisher, C. Feedback on household electricity consumption: A tool for saving energy? Energy Effic. 2008, 1, 79–104. [Google Scholar] [CrossRef]
  45. Ma, G.; Lin, J.; Li, N. Longitudinal assessment of the behavior-changing effect of app-based eco-feedback in residential buildings. Energy Build. 2018, 159, 486–494. [Google Scholar] [CrossRef]
  46. Podgornik, A.; Sucic, B.; Blazic, B. Effects of customized consumption feedback on energy efficient behavior in low-income households. J. Clean. Prod. 2016, 130, 25–34. [Google Scholar] [CrossRef]
  47. Sanguinetti, A.; Dombrovski, K.; Sikand, S. Information, timing, and display: A design-behavior framework for improving the effectiveness of eco-feedback. Energy Res. Soc. Sci. 2018, 29, 55–68. [Google Scholar] [CrossRef]
  48. Schleich, J.; Faure, C.; Klobasa, M. Persistence of the effects of providing feedback alongside smart metering devices on household electricity demand. Energy Policy 2017, 107, 225–233. [Google Scholar] [CrossRef]
  49. Weron, T.; Kowalska-Pyzalska, A.; Weron, R. The role of educational trainings in the diffusion of smart metering platforms: An agent-based modeling approach. Phys. A Stat. Mech. Its Appl. 2018, 505, 591–600. [Google Scholar] [CrossRef]
  50. Lopes, M.; Antunes, C.; Martins, N. Energy behaviors as promoters of energy efficiency: A 21st century review. Renew. Sustain. Energy Rev. 2012, 16, 4095–4104. [Google Scholar] [CrossRef]
  51. Buchanan, K.; Russo, R.; Anderson, B. Feeding back about eco-feedback: How do consumers use and respond to energy monitors? Energy Policy 2014, 73, 138–146. [Google Scholar] [CrossRef] [Green Version]
  52. Foulds, C.; Robison, R.; Macrorie, R. Energy monitoring as a practice: Investigating use of the i-measure online energy feedback tool. Energy Policy 2017, 104, 194–202. [Google Scholar] [CrossRef]
  53. Buchanan, K.; Banks, N.; Preston, I.; Russo, R. The British public’s perception of the UK smart metering initiative: Threats and opportunities. Energy Policy 2016, 91, 87–97. [Google Scholar] [CrossRef] [Green Version]
  54. Buchanan, K.; Russo, R.; Anderson, B. The question of energy reduction: The problem(s) with feedback. Energy Policy 2015, 77, 89–96. [Google Scholar] [CrossRef] [Green Version]
  55. Wallenborn, G.; Orsini, M.; Vanhaverbeke, J. Household appropriation of electricity monitors. Int. J. Consum. Stud. 2011, 35, 146–152. [Google Scholar] [CrossRef] [Green Version]
  56. Hargreeaves, T.; Nye, M.; Burgess, J. Keeping energy visible? Exploring how households interact with feedback from smart energy monitors in the longer term. Energy Policy 2013, 52, 126–134. [Google Scholar] [CrossRef]
  57. Gawlik, L. The Polish power industry in energy transformation process. Miner. Econ. 2017, 31, 229–237. [Google Scholar] [CrossRef] [Green Version]
  58. Rosicki, R. Poland’s energy policy: Main problems and forecasts. Srodkowoeur. Stud. Polit. 2017, 2, 59–87. [Google Scholar] [CrossRef]
  59. Antosiewicz, M.; Nikas, A.; Szpor, A.; Witajewski-Baltvilks, J.; Doukas, H. Pathways for the transition of the Polish power sector and associated risks. Environ. Innov. Soc. Transit. 2019. [Google Scholar] [CrossRef]
  60. Wierzbowski, M.; Filipak, I.; Lyzwa, W. Polish energy policy 2050. An instrument to develop a diversified and sustainable electricity generation mix in coal-based energy system. Renew. Sustain. Energy Rev. 2017, 74, 51–70. [Google Scholar] [CrossRef]
  61. Manowska, A.; Tobor-Osadnik, K.; Wyganowska, M. Economic and social aspects of restructuring Polish coal mining: Focusing on Poland and the EU. Resour. Policy 2017, 52, 192–200. [Google Scholar] [CrossRef]
  62. Ksiazek, S.; Suszczewicz, M. City profile: Wroclaw. Cities 2017, 65, 51–65. [Google Scholar] [CrossRef]
  63. Sowka, I.; Bezyk, Y. Greenhouse gas emission accounting at urban level: A case study of the city of Wroclaw (Poland). Atmos. Pollut. Res. 2018, 9, 289–298. [Google Scholar] [CrossRef]
  64. Stern, P. Individual and household interactions with energy systems: Toward integrated understanding. Energy Res. Soc. Sci. 2014, 1, 41–48. [Google Scholar] [CrossRef]
  65. Varsolo, S.; Schmoecker, J.; Junghwa, K. Understanding the stages and pathways of travel behavior change induced by technology-based interventions among university students. Transp. Res. Part F Traffic Psychol. Behav. 2018, 59, 98–114. [Google Scholar]
  66. Ohnmacht, T.; Schaffner, D.; Weibel, C.; Schad, H. Rethinking social psychology and intervention design: A model of energy savings and human behavior. Energy Res. Soc. Sci. 2017, 26, 40–53. [Google Scholar] [CrossRef]
  67. Gollwitzer, P.M. The mindset theory of action phases. In Theories of Social Psychology; van Lange, P.A., Ed.; Los Angeles Sage: Thousand Oaks, CA, USA, 2012; pp. 526–545. [Google Scholar]
  68. Buryk, S.; Mead, D.; Mourato, S.; Torriti, J. Investigating preferences for dynamic electricity tariffs: The effect of environmental and system benefit disclosure. Energy Policy 2015, 80, 190–195. [Google Scholar] [CrossRef] [Green Version]
  69. Duetschke, E.; Paetz, A. Dynamic electricity pricing which programs do consumers prefer? Energy Policy 2013, 59, 226–234. [Google Scholar] [CrossRef]
  70. Gerpott, T.; Paukert, M. Determinants of willingness to pay for smart meters: An empirical analysis of household customers in Germany. Energy Policy 2013, 61, 483–495. [Google Scholar] [CrossRef]
Figure 1. Main determinants of monitoring the energy usage in general and by means of SM platform.
Energies 12 00907 g001
Figure 2. Respondents’ experience with energy monitoring (note: respondents were allowed to choose more than one answer).
Energies 12 00907 g002
Figure 3. The distribution of positive and negative statements regarding four phases of adoption towards SMP (note: for stage F1 positive answers mean lack of agreement to the statement).
Energies 12 00907 g003
Table 1. Definitions of the variables and coding (N = 500).
VariableCodeDescription
GenderD1nominal variable
AgeD2ordinal variable
EducationD3ordinal variable
HousingD4nominal variable
Material situationD5interval variable
Electricity bill (in PLN per month)D6interval variable
Pro-environmental behaviorsB1-B19yes/no/no answer
Pro-environmental attitudesA1-A6scale from 1 to 5
Energy monitoring behaviorsE1-E6yes/no
Attitudes towards monitoringM1-M15scale from 1 to 5
Stages acc. to SSCB modelF1-F4scale from 1 to 5
Knowledge about energy marketK1-K7possible answers from 1 to 4
Table 2. Frequencies of the demographic variable (D1–D6).
VariableFrequencies
Gender (D1)female 62.6%
male 37.4%
18–24 years old 1.2%
25–34 years old 25.5%
Age (D2)35–44 years old 11.2%
45–59 years old 15.5%
over 60 years old 46.6%
Education (D3)primary 1.0%
vocational 4.6%
secondary 33.2%
higher 61.2%
single-family house 14.4%
semi-detached house 11.0%
Housing (D4)block of flats 51.8%
old tenement house 14.4%
modern apartment 7.8%
others 0.6%
Material situation (D5)M = 2.88; SD = 1.221
Electricity bill (in PLN per month) (D6)M = 143; SD = 125 (min = 30; max = 1200)
Table 3. Attitudes and behaviors towards monitoring of energy usage by means of SMP.
CodeDescriptionMeanSd. Dev.
M1To protect the environment and to increase the energy efficiency, everybody should be involved by monitoring energy usage at his or her household.4.310.997
M2Everybody can contribute to environmental protection by monitoring energy usage.4.530.907
M3No matter what other people think, my private norms obligate me to monitor energy usage.4.191.316
M4I know that some of my friends or neighbours reduce energy consumption by regular monitoring their energy usage.2.811.449
M5I feel good when I know that I am controlling the energy usage by its regular monitoring.4.001.360
M6I feel bad if I do not control my energy usage.3.721.456
M7It is possible for me to regularly monitor my energy usage.3.751.442
M8I think that monitoring of energy usage is good.4.620.815
M9I intend to contribute to environmental protection by regular monitoring of my energy usage.3.781.470
M10I have decided yo use SM platform to monitor energy consumption. I intend to make a plan at what time of day I will log into the platform and what aims concerning the energy consumption I will set up in the platform.3.791.616
M11I have an exact plan when and how to use SM platform to monitor the energy.2.421.714
M12I have anticipated all the possible problems that can occur and hinder me as I put my plan of regular usage of SM platform into practice.2.181.550
M13I have already mentally developed ways to overcome problems and obstacles to my plan to be flexible depending on the situation.2.091.400
M14Within the next 7 days, I indent to monitor my energy usage via SM platform.2.821.758
M15I will continue using SM platform to monitor my energy consumption, even though this may be inconvenient.2.911.809
Table 4. Knowledge regarding electricity market.
CodeDescriptionMeanSt. Dev.
K1How do we call the power system that integrates the activities of all market participants involved in generation, transition and distribution and consumption, in order to deliver energy in reliable, safety, economic and pro-environmental way? (1) smart metering, (2) smart grids, (3) advanced metering infrastructure (4) hard to say3.311.044
K2The end-users who have a smart meter installed in their household, have a possibility of: (1) making an individual appointment with the controller who comes to read the current energy consumption, (2) automatic reading of energy consumption by the energy provider and monitoring of energy consumption via an Internet web page or an mobile application, (3) paying for electricity based on forecasts of energy consumption delivered by the energy provided based on the historical data, (4) hard to say2.690.933
K3To the green energy belong those energy sources which use in the process of transition: (1) wind energy, nuclear energy, natural gas, biomass energy, (2) wind energy, biomass energy, solar energy, (3) nuclear energy, natural gas, solar energy, (4) hard to say2.360.983
K4Which sentence is true? (1) In Poland every consumer has a right to change the energy supplier, (2) In Poland only industrial consumers have the right to change the energy supplier, (3) In Poland the change of the energy supplier requires the approval of the Head of the Energy Regulatory Office (4) hard to say1.310.896
K5Which of the electricity tariffs are offered for the residential consumers in Poland? (1) Tariffs: G11, C11 and B21, (2) Tariffs: G11, G12 and G12w, (3) Tariffs: C11, C12a, C21, (4) hard to say3.540.900
K6Choose from the list below the most energy consuming house appliance in the average household. (1) a computer, (2) a refrigerator, (3) lightning, (4) hard to say2.270.792
Table 5. The results of tests of pairwise association between the stages (F1–F4) and determinants of willingness to energy monitoring (note: ** p < 0.01 and * p < 0.05 ).
VariablesEco-AttitudesKnowledgeF1F2F3F4
F10.133 **−0.103 *-0.128 *−0.078−0.129 *
F20.045−0.0140.128 *-0.470 **−0.136 **
F3−0.1340.139 **−0.0780.470 **-−0.129 *
F4−0.0170.056−0.129 *−0.136 **−0.129 *-
M7−0.089 *0.081 *−0.220 **−0.0840.209 **0.238 **
M8−0.169 **0.025−0.165 **0.094 *0.235 **0.123 **
Table 6. The final results of logit regression model for all stages F1–F4 (block 3 in step 3). Note: ***  p < 0.001 , ** p < 0.01 and * p < 0.05 .
StageVariableCoeff. ( β )St. Err.Exp( β )
D1−0.2360.2500.790
D20.1010.1021.106
D50.0630.1341.065
F1Am0.314 **0.1041.369
Ks−0.8900.5920.411
M7−0.257 **0.0810.773
constant−0.0490.9000.952
D1−0.372 *0.2210.690
D2−0.0700.0880.932
D5−0.0580.1160.944
F2Am0.0670.0971.069
Ks−0.2290.5240.795
M7−0.141 **0.0710.869
constant1.1490.7923.156
D1−0.2490.2220.779
D2−0.1230.0870.884
D5−0.0150.1170.985
F3Am−0.0160.0970.984
Ks1.282 **0.5453.603
M70.294 ***0.0781.342
constant−0.8500.7870.427
D10.1730.3071.189
D20.1910.1271.211
D5−0.0050.1620.995
F4Am0.0560.1341.057
Ks0.4830.7541.621
M70.837 ***0.1862.310
constant−6.868 ***1.3370.001

