Article

Performance and Efficiency Analysis of an HT-PEMFC System with an Absorption Chiller for Tri-Generation Applications

WCSL (World Class Smart Lab) of the Green Battery Lab, Department of Mechanical Engineering, Inha University, 100 Inha-ro Michuhol-gu, Incheon 22212, Korea
*
Author to whom correspondence should be addressed.
Energies 2019, 12(5), 905; https://doi.org/10.3390/en12050905
Submission received: 28 December 2018 / Revised: 28 February 2019 / Accepted: 2 March 2019 / Published: 8 March 2019
(This article belongs to the Section A5: Hydrogen Energy)

Abstract

:
An absorption chiller model for tri-generation (combined cooling, heating, and power) is developed and incorporated with the high temperature- (HT-) proton exchange membrane fuel cell (PEMFC) system model that was developed in our previous study. We employ a commercially available flow simulator, Aspen HYSYS, for solving the energy and mass balances of various system components, including an HT-PEMFC stack that is based on a phosphoric acid-doped PBI membrane, natural gas-fueled reformer, LiBr-H2O absorption chiller, balance of plant (BOP) components, and heat exchangers. Since the system’s operating strategy for tri-generation must be changed, depending on cooling or heating loads, a major focus of this study is to analyze system performance and efficiency under different requirements of electricity generation, cooling, and heating conditions. The system simulation results revealed that high-current fuel-cell operation is essential in raising the cooling capacity, but the overall system efficiency is slightly reduced as a result. Using a lower fuel-air ratio for the burner in the reforming module is one alternative that can minimize the reduction in the overall system efficiency under high-current fuel-cell operation and large cooling-capacity modes.

1. Introduction

Due to fossil-resource depletion and environmental pollution, lately the importance of renewable energy has received much attention. Moreover, technologies that can efficiently use clean-energy resources are considered to be a solution for these environmental concerns. Among the various clean-energy technologies that can potentially replace fossil fuels, fuel cells are considered to be one of the most environmentally friendly technologies. Fuel cells produce electricity by using hydrogen and oxygen, and water and waste heat are the only byproducts. Over the last several decades, considerable progress has been made regarding of fuel cell performance and durability. Developing new materials and optimizing its design and operation conditions have achieved the rapid growth of fuel cell technologies. The numerical modeling and experimental diagnostics become valuable tools for the design and operation of fuel cells [1,2,3,4]. In particular, fuel cells that operate at high temperatures are appropriate for combined heat, cooling, and power generation (CHCP), or tri-generation. Even though fuel-cell systems for tri-generation have relatively high initial capital costs, these systems offer significant benefits in terms of system-energy efficiency [5,6].
In a typical fuel cell-based CHCP system, an absorption chiller is used to generate cooling power from the heat of water that is released from a fuel-cell stack. Many efforts have been led to model and analyze the diverse types of absorption chillers [7,8,9,10,11,12,13]. Gordon et al. [7] formulated a simple thermodynamic model for an LiBr-H2O absorption chiller and then analyzed the relation among coefficients of performance (COP). Xu et al. [8] has proposed a dynamic model, which is a single-effect absorption chiller using gPROMS and analyzed the dynamic responses of the chiller under various conditions, such as thermal mass, control strategy, and operating temperatures. Martínez et al. [9] modeled a Yazaki WFC-SC 5 absorption chiller with 17.6-kW of cooling capacity and calculated it through the use of the EES software. The simulation data were compared with the manufacturer’s catalogue data and experimental data. Ochoa et al. [10] derived mass- and heat-balance equations for a single-effect LiBr-H2O absorption chiller based on the first law of thermodynamics, which were discretized by using the finite differences method and solved by the MATLAB program. These authors investigated the dynamic responses of the chiller in the step changes of temperature, concentration, and pressure. Rubio-Maya et al. [11] presented an optimization model on the single-effect absorption chiller. Based on the exergy concept, these authors formulated an objective function for the annual operating cost, while considering the temperatures of individual components and the efficiency of solution heat exchanger as design variables. The optimum operating conditions to minimize the annual operating cost were reported for various working fluids. Yin et al. [12] simulated a double-effect absorption chiller under different load conditions that can be required for micro building and district power plants. Xu and Wang [13] experimentally tested a 50-kW LiBr-H2O absorption chiller over a wide generation-temperature range.
Efforts have been expended to combine an absorption chiller with fuel-cell systems for tri-generation and analyzing the electrical power, cooling, and heating performances [14,15,16,17,18,19,20,21,22]. Among the various fuel cell types, solid oxide fuel cells (SOFCs) were the most studied for fuel cell-based tri-generation applications [14,15,16,17,18]. Takezawa et al. [14] applied a combined SOFC and gas turbine (GT) system to single and double-effect absorption chillers. Their comparison results showed similar cooling capacities between the two system designs, indicating that the use of a single-effect absorption chiller is beneficial in terms of economics. Malico et al. [15] applied a hospital load profile, which comprises heating, cooling, electricity, and hot water, to a SOFC-based tri-generation system and analyzed its economic feasibility. Yu et al. [16] presented a tri-generation system model that was based on an SOFC stack and double-effect absorption chiller and investigated the effects of air inlet temperature, fuel-utilization ratio, and fuel-flow ratio. Burer et al. [17] created a residential tri-generation system that used an SOFC stack, GT, and absorption chiller, and then optimized its operation to minimize CO2 emission. Tse et al. [18] analyzed different tri-generation configurations that are based on a hybrid SOFC and GT system for marine applications, wherein various absorption chillers were considered and compared. Besides SOFCs, other types of fuel cells have been applied to tri-generation systems [14,15,16,17]. Margalef et al. [19] considered a commercially available molten carbonate fuel-cell stack (300 kWe) and double-effect absorption chiller (40 refrigeration tons) and analyzed the effects of system-integration strategies and chiller inlet temperatures on tri-generation performance. The applicability of low-temperature (LT) proton exchange membrane fuel cells (PEMFCs) for tri-generation applications has been investigated [20,21]. Higher system efficiency was attained in the winter operating mode rather than the summer mode, because of the better waste-heat utilization [21]. Alexandros Arsalis [22] focused on a 100-kWe liquid-cooled HT-PEMFC stack that was based on a phosphoric acid (PA)-doped PBI membrane. By using 107 kW of waste heat from the HT-PEMFC stack, the author simply estimated the available cooling loads for an LiBr-H2O double-effect absorption chiller (COP = 1.2) and a H2O-NH3 single-effect chiller (COP = 0.6), i.e., approximately 128 kW and 64.5 kW, respectively.
This paper aims to analyze a tri-generation system under different operating modes as seasons change. An HT-PEMFC stack that is based on a PA-doped PBI membrane is chosen and then combined with an LiBr-H2O absorption chiller. Although several efforts have been made for modeling and simulation of various fuel cell-based tri-generation systems [23,24,25,26,27], detailed system modeling, and analysis of a combined fuel-cell stack, fuel reformer, and absorption chiller have not been reported in the literature. In this study, a HT-PEMFC system model for tri-generation is presented and numerically implemented within a commercial flow-sheet simulator, Aspen HYSYS® (V7.2, AspenTech®, Bedford, MA, USA), i.e., used to deal with the energy and mass balances of various system components. Subsequently, the system model is applied to a 5 kWe tri-generation system and the effects of key operating parameters, such as stack operating current density and burner fuel-air ratio (FAR), are investigated and discussed. Particular emphasis is placed on analyzing the cooling capacity and tri-generation efficiencies in the summer and winter operating modes. This work addresses the flexibility and operating strategy of fuel cell-based tri-generation systems under different electric, cooling, and heating loads.

2. Analytical Model

2.1. Model Assumptions

Figure 1 shows the schematic of a typical High Temperature (HT)-PEMFC system for tri-generation consisting of three aforementioned modules: an HT-PEMFC stack module, fuel-reforming module, and combined heating and cooling (CHC) module. The HT-PEMFC stack that is based on a PA-doped PBI membrane is connected with a natural gas-fueled reformer, heat-storage tank, and LiBr-H2O absorption chiller. In addition, various balance of plant (BOP) components (blowers, compressors, and pumps) and heat exchangers are used in the operation of the tri-generation system. The HT-PEMFC system model is based on the previous work of Jo et al. [28], wherein the model was experimentally validated against the test data measured under the 5 kWe HT-PEMFC system developed by Doosan Corporation Fuel Cell. Only the difference from our previous work is that an absorption chiller model is newly developed and incorporated to simulate HT-PEMFC system operations for the summer cooling mode. The main assumptions made during system modeling are as follows:
  • The natural gas constitutes 100% methane (CH4). All of the impurities in the natural gas are removed before utilization during the fuel pretreatment process. Hence, the minor components in the fuel and their properties are ignored.
  • Peng–Robinson’s equation of state is followed by the individual gases and their mixtures to facilitate the relatively simple and accurate analysis of the natural gas reacting system.
  • The operations of tri-generation system and its components are at the steady-state condition.
  • The desulphurization component is included in the HT-PEMFC system to alleviate the sulfur poisoning of metal catalysts, such as Ni and Rh, inside the steam reforming (SR) reactor. Hence, the catalyst deactivation effect can be neglected.
  • The effect of CO poisoning on the performance of HT-PEMFC stack is assumed to be negligible, which is reasonable for high operating temperatures (>160 °C) and/or the CO content range of 1~2% in the anode reformate gas [29,30].
  • The LiBr solution in the absorber and generator, and any refrigerant (water) in the condenser and evaporator are under thermodynamic equilibrium corresponding to their temperatures and pressures. The temperature, pressure, and concentration within the each component of LiBr-H2O absorption chiller are assumed to be uniform.
  • The water vapor that leaves the evaporator is assumed to be fully saturated, whereas the water leaves the condenser as saturated liquid.

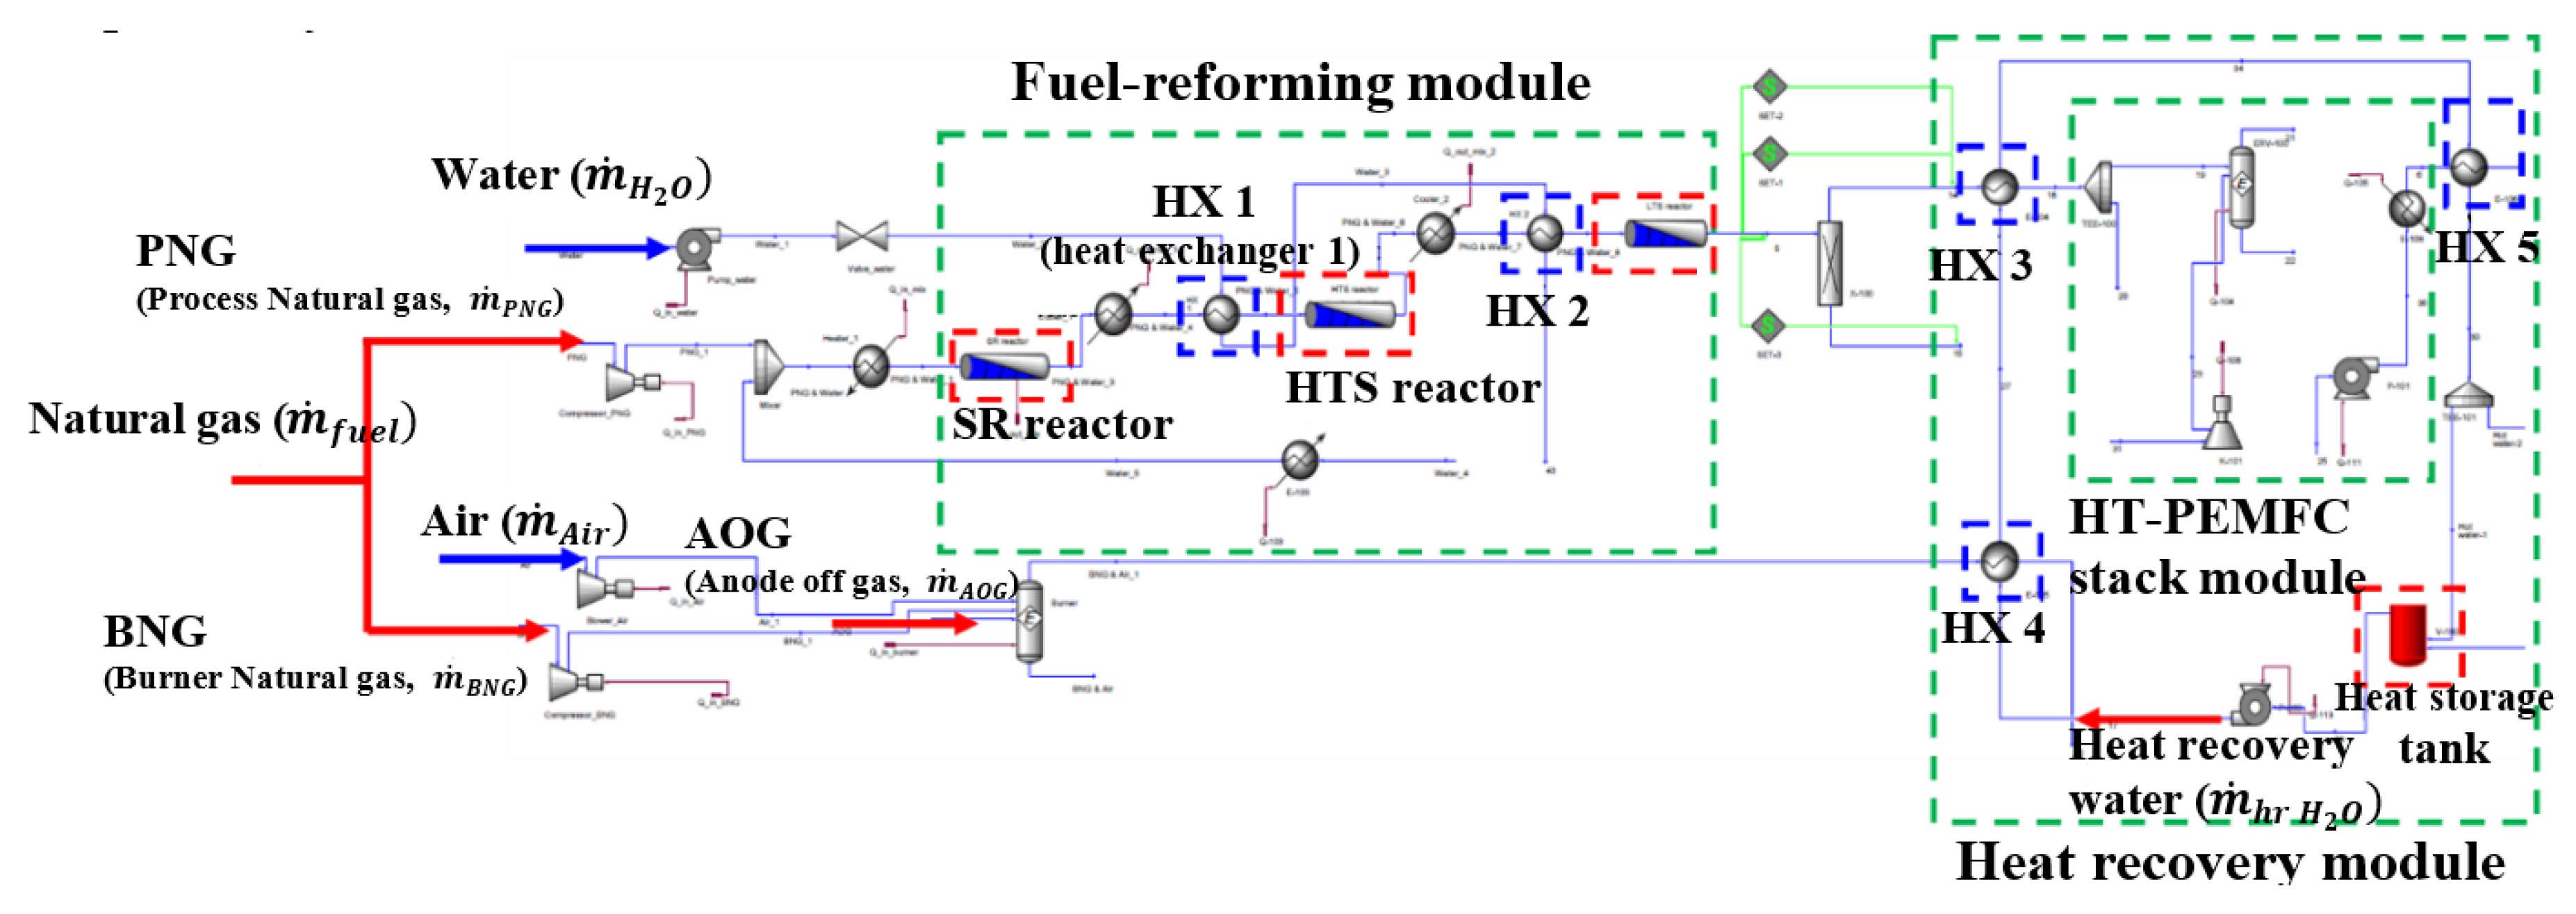
2.2. Fuel-Reforming Module

In the fuel-reforming module, we considered a SR reactor, water gas shift (WGS) reactors, and auxiliary catalytic burner along with several Balance of Plant (BOP) components and heat exchangers. As shown in Figure 1 and Figure 2, the steam and process natural gas (PNG) are fed into the SR reactor, while the anodic exhausts from the HT-PEMFC stack, air, and burner natural gas (BNG) are supplied to the burner. Despite the number of reactions that are involved in the SR process [31], the following three major chemical reactions are considered for simplicity:
Methane SR
C H 4 + H 2 O C O + 3 H 2               h 1 = 206   k J / m o l
WGS
C O + H 2 O C O 2 + H 2              h 2 = 41   k J / m o l
Direct SR
C H 4 + 2 H 2 O C O 2 + 4 H 2       h 3 = 165   k J / m o l
where, h i is the specific enthalpy change for the reaction, i (i = 1, 2, 3 denote the methane SR, WGS, and Direct SR). The kinetic equations of Equations (1)–(3) are derived regarding the plug-flow kinetic model, which was previously investigated by Xu and Froment [31]:
r 1 = A 1 e x p ( E 1 R T ) ( p C H 4 p H 2 O p H 2 3 p C O K p 1 ) / ( p H 2 2.5 · D E N 2 )
r 2 = A 2 e x p ( E 2 R T ) ( p C O p H 2 O p H 2 p C O 2 K p 2 ) / ( p H 2 · D E N 2 )
r 3 = A 3 e x p ( E 3 R T ) ( p C H 4 p H 2 O 2 p H 2 4 p C O 2 K p 3 ) / ( p H 2 3.5 · D E N 2 )
In Equations (4)–(6), K p i , A i , E i , and r i are the equilibrium constant, pre-exponential factor, the activation energy, and the net kinetic reaction rate of the reaction i, respectively. In addition, p j means the partial pressure of species and j in the mentioned reactions. The term, DEN in the denominators of Equations (4)–(6) represents the adsorption of reactants onto the active catalytic sites. Because all three reactions occur at the same sites, DEN in Equations (4)–(6) are equivalent, being expressed, as follows:
D E N = 1 + K C O p C O + K H 2 p H 2 + K C H 4 p C H 4 + K H 2 O p H 2 O / p H 2
For the given Ni/MgAl2O4 catalyst, the adsorption constant of individual species j, K j is described using Van’t Hoff expression, as below:
K j = A ( K j ) e x p ( h j R T )
where, Δ h j and A ( K j ) are the adsorption-specific enthalpy and the pre-exponential factor of K j for the species j, respectively.
Based on Equations (1)–(3), the mass balance equations for individual species in the SR reactor are derived, as follows:
m ˙ C H 4 S R , o u t = m ˙ P N G ( r 1 + r 3 ) · M W C H 4 m ˙ C O S R , o u t = ( r 1 r 2 ) · M W C O m ˙ C O 2 S R , o u t = ( r 2 + r 3 ) · M W C O 2 m ˙ H 2 O S R , o u t = m ˙ H 2 O S R , i n ( r 1 + r 2 + 2 r 3 ) · M W H 2 O m ˙ H 2 S R , o u t = ( 3 r 1 + r 2 + 4 r 3 ) · M W H 2
where, m ˙ P N G is the PNG mass flow rate fed into the SR reactor.
In the WGS reactor comprising high temperature-shifts (HTS) and low temperature-shifts (LTS) sub-reactors, only the exothermic WGS reaction, as in Equation (2), is assumed to occur. Thus, the mass balance equations for the WGS reactor are described in Equation (10).
m ˙ C H 4 L T S , o u t = m ˙ C H 4 L T S , i n = m ˙ C H 4 S R , o u t m ˙ C O L T S , o u t = m ˙ C O H T S , i n ( r 2 H T S + r 2 L T S ) · M W C O m ˙ C O 2 L T S , o u t = m ˙ C O 2 H T S , i n + ( r 2 H T S + r 2 L T S ) · M W C O 2 m ˙ H 2 O L T S , o u t = m ˙ H 2 O H T S , i n + m ˙ H 2 O S R , i n ( r 2 H T S + r 2 L T S ) · M W H 2 O m ˙ H 2 L T S , o u t = m ˙ H 2 H T S , i n + ( r 2 H T S + r 2 L T S ) · M W H 2
where, r 2 H T S and r 2 L T S represent the net WGS reaction rates of Equation (2) for the HTS and LTS processes, respectively. Table 1 summarizes all the equilibrium constants and reaction kinetics parameters for the SR, HTS, and LTS reactors. Figure 2 shows the flowsheet of fuel reforming module generated by the ASPEN HYSYS® V7.2.

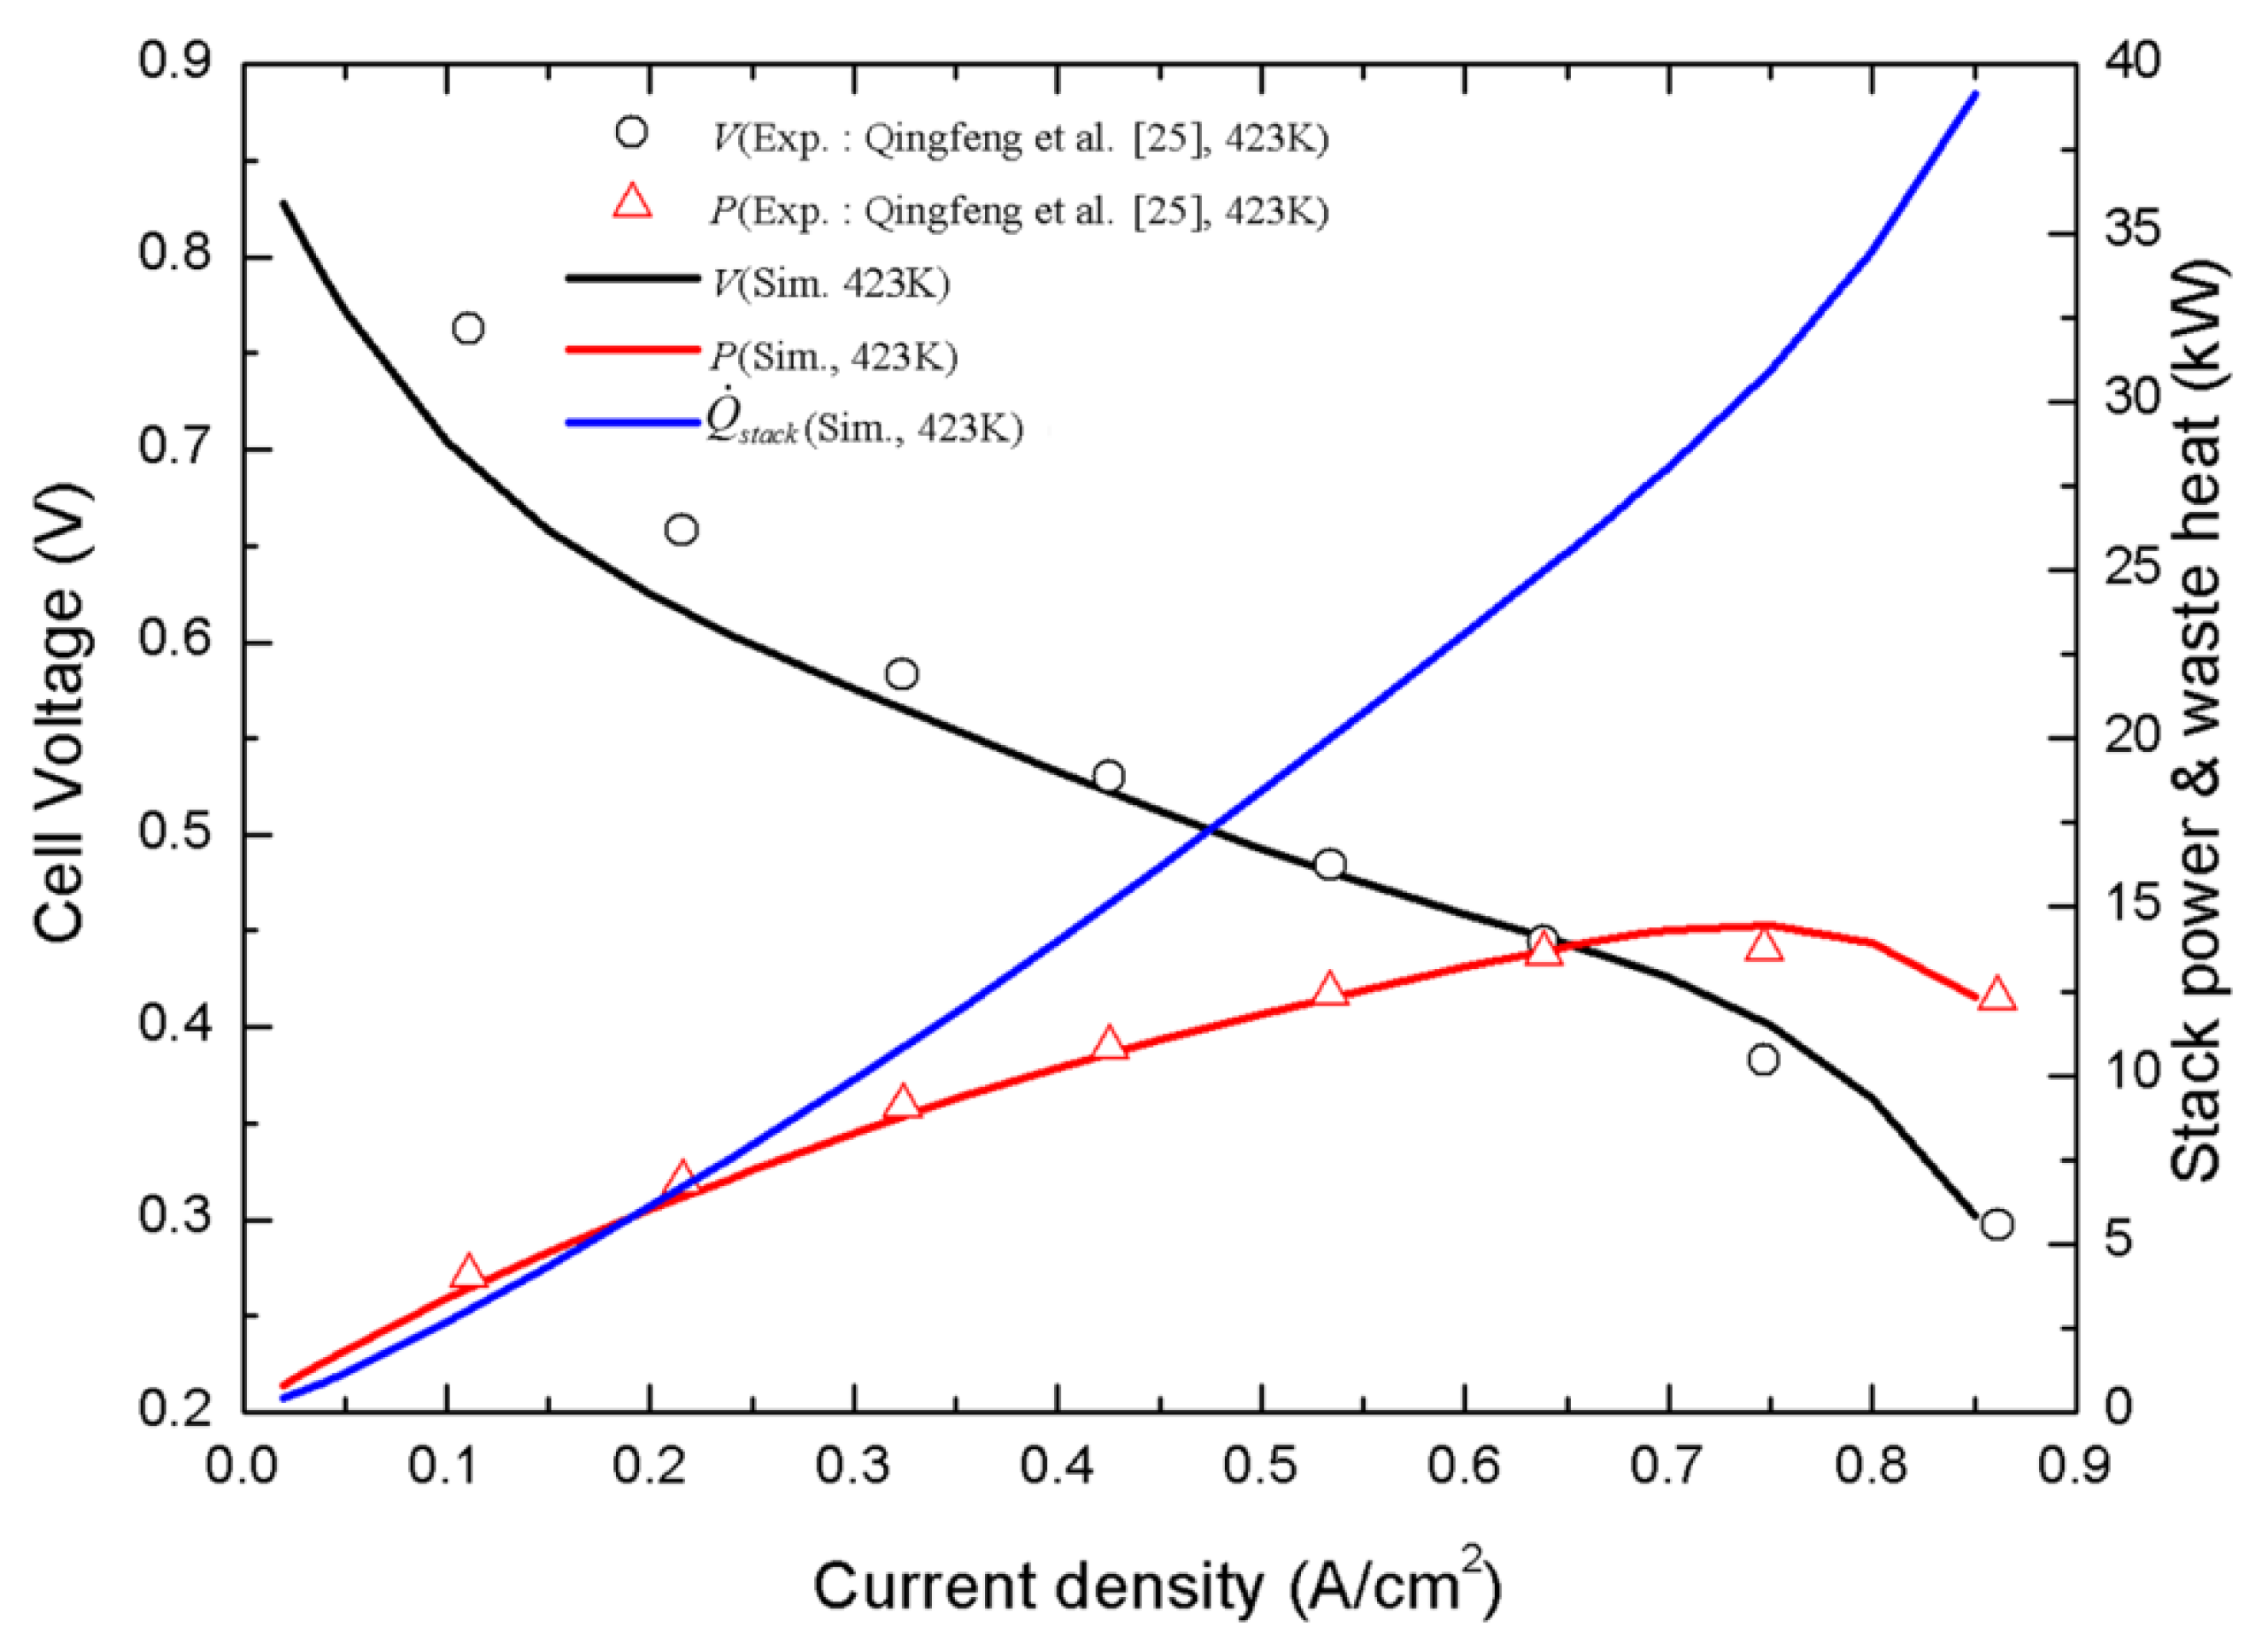
2.3. HT-PEMFC Stack Module

The HT-PEMFC stack model is simplified from the three-dimensional (3-D) high temperature (HT)-PEMFC models [29,35,36,37,38]. The cell voltage can be determined after the activation loss η a c t , ohmic loss η o h m , and concentration loss η c o n are estimated and then subtracted from the thermodynamic equilibrium potential, E n e r n s t , as follows,
V c e l l = E n e r n s t η a c t η o h m η c o n
The expression of E n e r n s t is given by Chippar and Ju [31], as follows:
E n e r n s t = 1.1669 0.24 × 10 3 ( T c e l l 373.15 )
In Equation (11), the activation overvoltage, η a c t , represents the total activation loss, i.e., the sum of the activation loss in the anode side due to the hydrogen oxidation reaction (HOR) and the activation loss in the cathode side due to the oxygen reduction reaction (ORR). The anode and cathode activation losses can be estimated from the Butler–Volmer (B-V) equations for the HOR and ORR, as follows [35]:
HOR in the anode
η a c t , a = i i 0 , a r e f R u T ( α a + α c ) F ( C H 2 , r e f C H 2 ) 1 / 2
ORR in the cathode
| η a c t , c | = R u T α c F ln [ ( C O 2 , r e f C O 2 ) 3 / 4 i i 0 , c r e f ]
η a c t = η a c t , a + | η a c t , c |
In Equation (13), C j is the molar concentration. α is the transfer coefficient. The exchange current densities for the HOR and ORR, denoted by i 0 , a r e f and i 0 , c r e f , respectively, are dependent of temperature, as follows [35]:
i 0 , a r e f ( T ) = i 0 , a r e f ( 353.15 K ) · e x p [ 1400 · ( 1 T 1 353.15 ) ]
i 0 , c r e f ( T ) = i 0 , c r e f ( 353.15 K ) · e x p [ 7900 · ( 1 T 1 353.15 ) ]
The ohmic loss, η o h m is a combined result of proton and electron transport through various components of HT-PEMFC stack.
η o h m = i ( R H + + R e l e c )
In Equation (17), R H + and R e l e c represent the area specific resistances due to proton and electron transport, respectively. R H + can be determined by the given membrane and catalyst layer (CL) properties and dimensions, as follows.
R H + = δ m e m κ + 0.5 · δ a C L ν a C L 1.5 κ + 0.5 · δ c C L ν c C L 1.5 κ
where ν a C L and ν c C L are the ionomer volume fraction in the anode and cathode CLs, respectively. It should be noted that, for proton transport through the anode and cathode CLs, half the thickness of CL (i.e., 0.5 · δ a C L and 0.5 · δ a C L ) is considered as the average proton transport path.
The expression of concentration polarization, η c o n is given by:
η c o n = R T 4 F ln ( i l i m i l i m i )
In Equation (19), i l i m is the limiting current density, i.e., a function of the oxygen concentration at the interface of the cathode gas diffusion layer (GDL) and gas channel, C O 2 , i n t , as well as the porosity ( v G D L ), tortuosity, and thickness ( δ G D L ) of the cathode GDL. The expression is given by:
i l i m = ν G D L 1.5 D O 2 C O 2 , i n t δ G D L
Based on a typical HT-PEMFC stack configuration where the single cells are connected in series, the stack voltage V s t a c k and stack power P s t a c k can be estimated if the number of cells in the stack, n c e l l and the area of membrane electrode assembly (MEA), A M E A , are given.
V s t a c k = n c e l l V c e l l
P s t a c k = n c e l l V c e l l · i · A M E A
When considering the stack power that was obtained by Equation (22) and the sum of power consumption of an individual BOP component i (denoted by bhpi), the electric efficiency ε e for the HT-PEMFC system can be evaluated, as follows,
ε e = P s t a c k b h p i m ˙ f u e l × L H V f u e l × 100 %
where L H V f u e l is the lower heating value of fuel. m ˙ f u e l is the total fuel mass flow rate supplied to the fuel reforming module. As shown in Figure 2, m ˙ f u e l is the sum of PNG mass flow rate for the SR reactor and BNG mass flow rate for the burner.
m ˙ f u e l = m ˙ B N G + m ˙ P N G
The waste heat generated during the HT-PEMFC stack operation is described by Equation (25):
Q ˙ s t a c k = ( U 0 T d U 0 d T V c e l l ) × i × A M E A × n c e l l
Inside the HT-PEMFC stack, Q ˙ s t a c k in Equation (25) is mainly removed by a coolant flowing through the cooling channels [35]. Triethylene glycol is usually employed as a coolant for HT-PEMFC stacks, owing to its high boiling point around 285 °C. The coolant temperature gradient from the inlet to outlet, T c o o l can be estimated through a simple heat balance of the total waste heat generation rate from the stack and heat removal rate by the coolant.
T c o o l = Q ˙ s t a c k m ˙ c o o l c p , c o o l = ( U 0 T d U 0 d T V c e l l ) × i × A M E A × n c e l l m ˙ c o o l c p , c o o l
In Equation (26), m ˙ c o o l represents the flow rate of coolant that is supplied to the HT-PEMFC stack. The present stack model described in Figure 3a is implemented while using the flow simulator ASPEN HYSYS® V7.2 and relevant flowsheet, as seen in Figure 3b.

2.4. Single-Effect Absorption Chiller

To simulate the HT-PEMFC based tri-generation system, an absorption chiller model is newly developed and incorporated into the aforementioned HT-PEMFC system model. As schematically shown in Figure 4, this absorption chiller system operates with the LiBr-H2O solution, in which LiBr and H2O are employed as the absorbent and refrigerant, respectively. Its main components are the generator, absorber, condenser, evaporator, solution heat exchanger, expansion valve, and solution pumps. The water vapor that originates from the evaporator is absorbed in an aqueous LiBr-H2O solution in the absorber, wherein the cooling water removes the exothermic heat that is released during absorption. The diluted LiBr solution in the absorber is then pressurized by the pump (P1) and pre-heated through heat exchange with the concentrated solution before being sent to the generator. In the generator, the waste heat from the HT-PEMFC is supplied to obtain steam from the diluted solution. After the steam is further superheated, it enters the condenser and is liquefied, releasing latent heat. Finally, the water is depressurized through the expansion valve and vaporized in the evaporator, producing useful cooling. The vaporized water is recombined with a strongly concentrated LiBr solution from the absorber for completing the absorption refrigeration cycle. While assuming a steady-state operation, the following mass and energy balance equations are applied to individual components in the absorption chiller system and implemented into Aspen HYSYS® V 7.2.
i n m ˙ j = o u t m ˙ j
i n m ˙ j h j = o u t m ˙ j h j
where j represents either water or LiBr solution. To solve the energy-balance equations for the absorber and generator, the following expression for the specific enthalpy of the LiBr solution, i.e., as a function of temperature, T, and LiBr concentration, X, is used in the model [6]:
h L i B r ( T , X ) = ( a 0 + a 1 X ) T + 0.5 ( b 0 + b 1 X ) T 2 + ( c 0 + c 1 X + c 2 X 2 + c 3 X 3 )
In Equation (29), the values of the individual coefficients are listed in Table 2. The COP and cooling efficiency (defined based on the rate of the total fuel supply) can be readily determined by the following expressions:
C O P = m ˙ H 2 O · ( 1 x ) · h v a p ( m ˙ 59.96 % L i B r · h 59.96 % L i B r + m ˙ H 2 O ( v ) · h H 2 O ( v ) ) m ˙ 53.07 % L i B r · h 53.07 % L i B r × 100 %
ε c o o l i n g = m ˙ H 2 O · ( 1 x ) · h v a p m ˙ f u e l · L H V f u e l × 100 %
where m ˙ H 2 O represents the mass flow rate of water through the condenser and the evaporator. x and h v a p are the mass fraction of water vapor at the end of the expansion valve and the specific latent heat of vaporization of water, respectively.

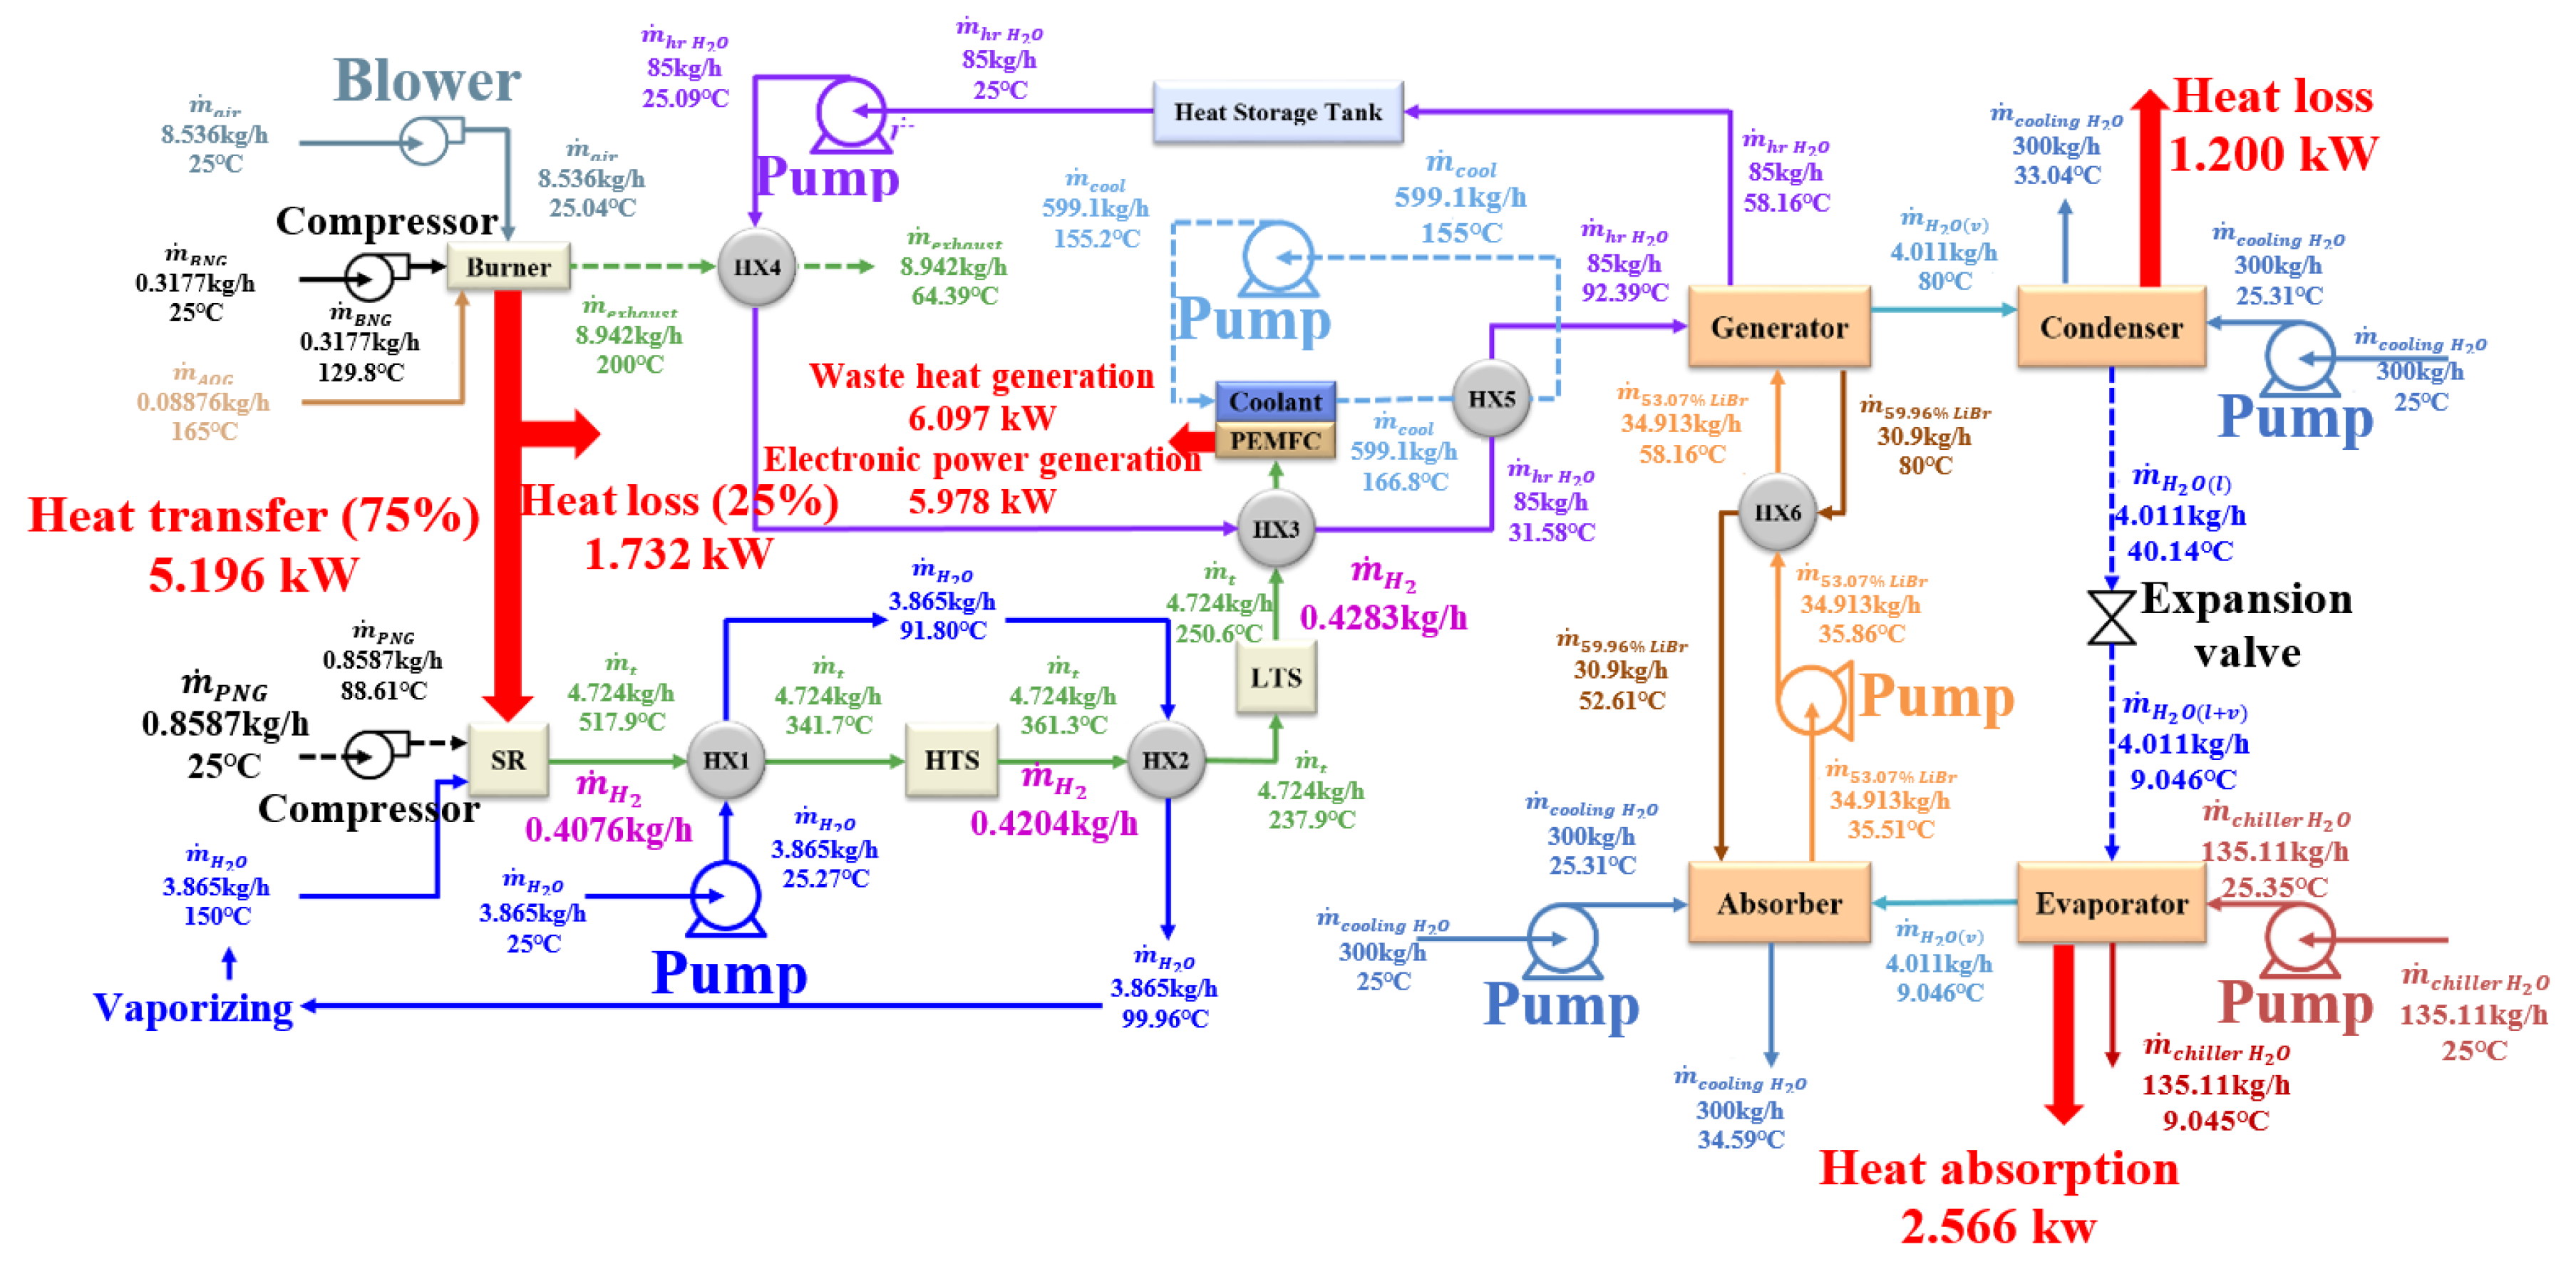
2.5. Heat-Recovery Module

Heat-recovery modules are used to collect excess heat from various system components and to store it in the storage tank. Figure 5 displays the flowsheet of the heat recovery module, in which five heat exchangers (HXs) are employed to recover the available heat. HXs 1 and 2 are placed near the ends of the SR and HTS reactors, respectively, in order to maintain optimal operating temperatures of HTS and LTS processes, as well as to preheat the stream that is supplied to the SR reactor. HXs 3, 4, and 5 are mainly to cool the burner exhaust gas, LTS downstream, and coolant flow from the HT-PEMFC stack, respectively.
To solve the heat balance equations of the individual HXs, either heat capacity or the outlet temperature is required, i.e., obtained from the following equation.
q = UA T l m
In the Equation (32), T l m , A, and U denote the logarithmic mean temperature difference (LMTD), effective heat exchanger area, and the overall heat transfer coefficient, respectively. The thermal efficiency can be estimated by calculating the total heat that is recovered from the HT-PEMFC system under the following equation.
ε t = m ˙ h r H 2 O · C p , H 2 O · ( T h r H 2 O , i n T h r H 2 O , o u t ) m ˙ f u e l · L H V f u e l × 100 %
where T h r H 2 O and m ˙ h r H 2 O are the temperature and mass flow rate of the storage tank, respectively. The overall CHCP efficiency of the tri-generation HT-PEMFC system can be estimated by the summation of electric, thermal, and cooling efficiencies.
ε C H C P = ε e + ε c o o l i n g + ε t

2.6. Operating Conditions

The key operating parameters for an HT-PEMFC system are the steam to carbon ratio (SCR) for the SR reactors and the FAR for burners, which are defined as
S C R = m ˙ H 2 O S R , i n M W H 2 O m ˙ P N G M W C H 4
F A R = m ˙ B N G / M W B N G + m ˙ A O G / M W A O G m ˙ a i r / M W a i r
where m ˙ A O G . represents anode exhaust the mass flow rate from the HT-PEMFC stack. The equivalence ratio (ER) for the burners means the actual FAR normalized by the minimum theoretic FAR for complete combustion. Under a fixed air supply, the ER can be approximated to the ratio of the actual BNG mass flow rate to the minimum BNG mass flow rate that is required for complete combustion:
E R = F A R a c t u a l F A R m i n = m ˙ B N G , a c t u a l m ˙ B N G , m i n
According to our previous study [23], the SCR has a negligible influence on the hydrogen yield and system efficiencies when this factor varies from 3.0 to 3.6. Only the CO content in the reformate gas is slightly reduced with increasing SCR, so the SCR value is fixed at 3.0 in this study. Contrarily, the burner FAR directly controls the amount of heat that is supplied for the endothermic reactions in the SR reactor and thus highly influences the system efficiencies as well as the total hydrogen yield. Therefore, we numerically assess the effect of the burner FAR on the electrical, cooling, and heating efficiencies of HT-PEMFC systems. In addition, the summer cooling and winter heating modes demand different cooling, heating, and power loads for the HT-PEMFC systems. One approach to meet these various load requirements is to adjust the operating current density of the HT-PEMFC stack. In this study, low (0.2 A/cm2), intermediate (0.4 A/cm2), and high (0.65 A/cm2) current-density HT-PEMFC operations are simulated and then compared in terms of electric-power generation and cooling capacity.

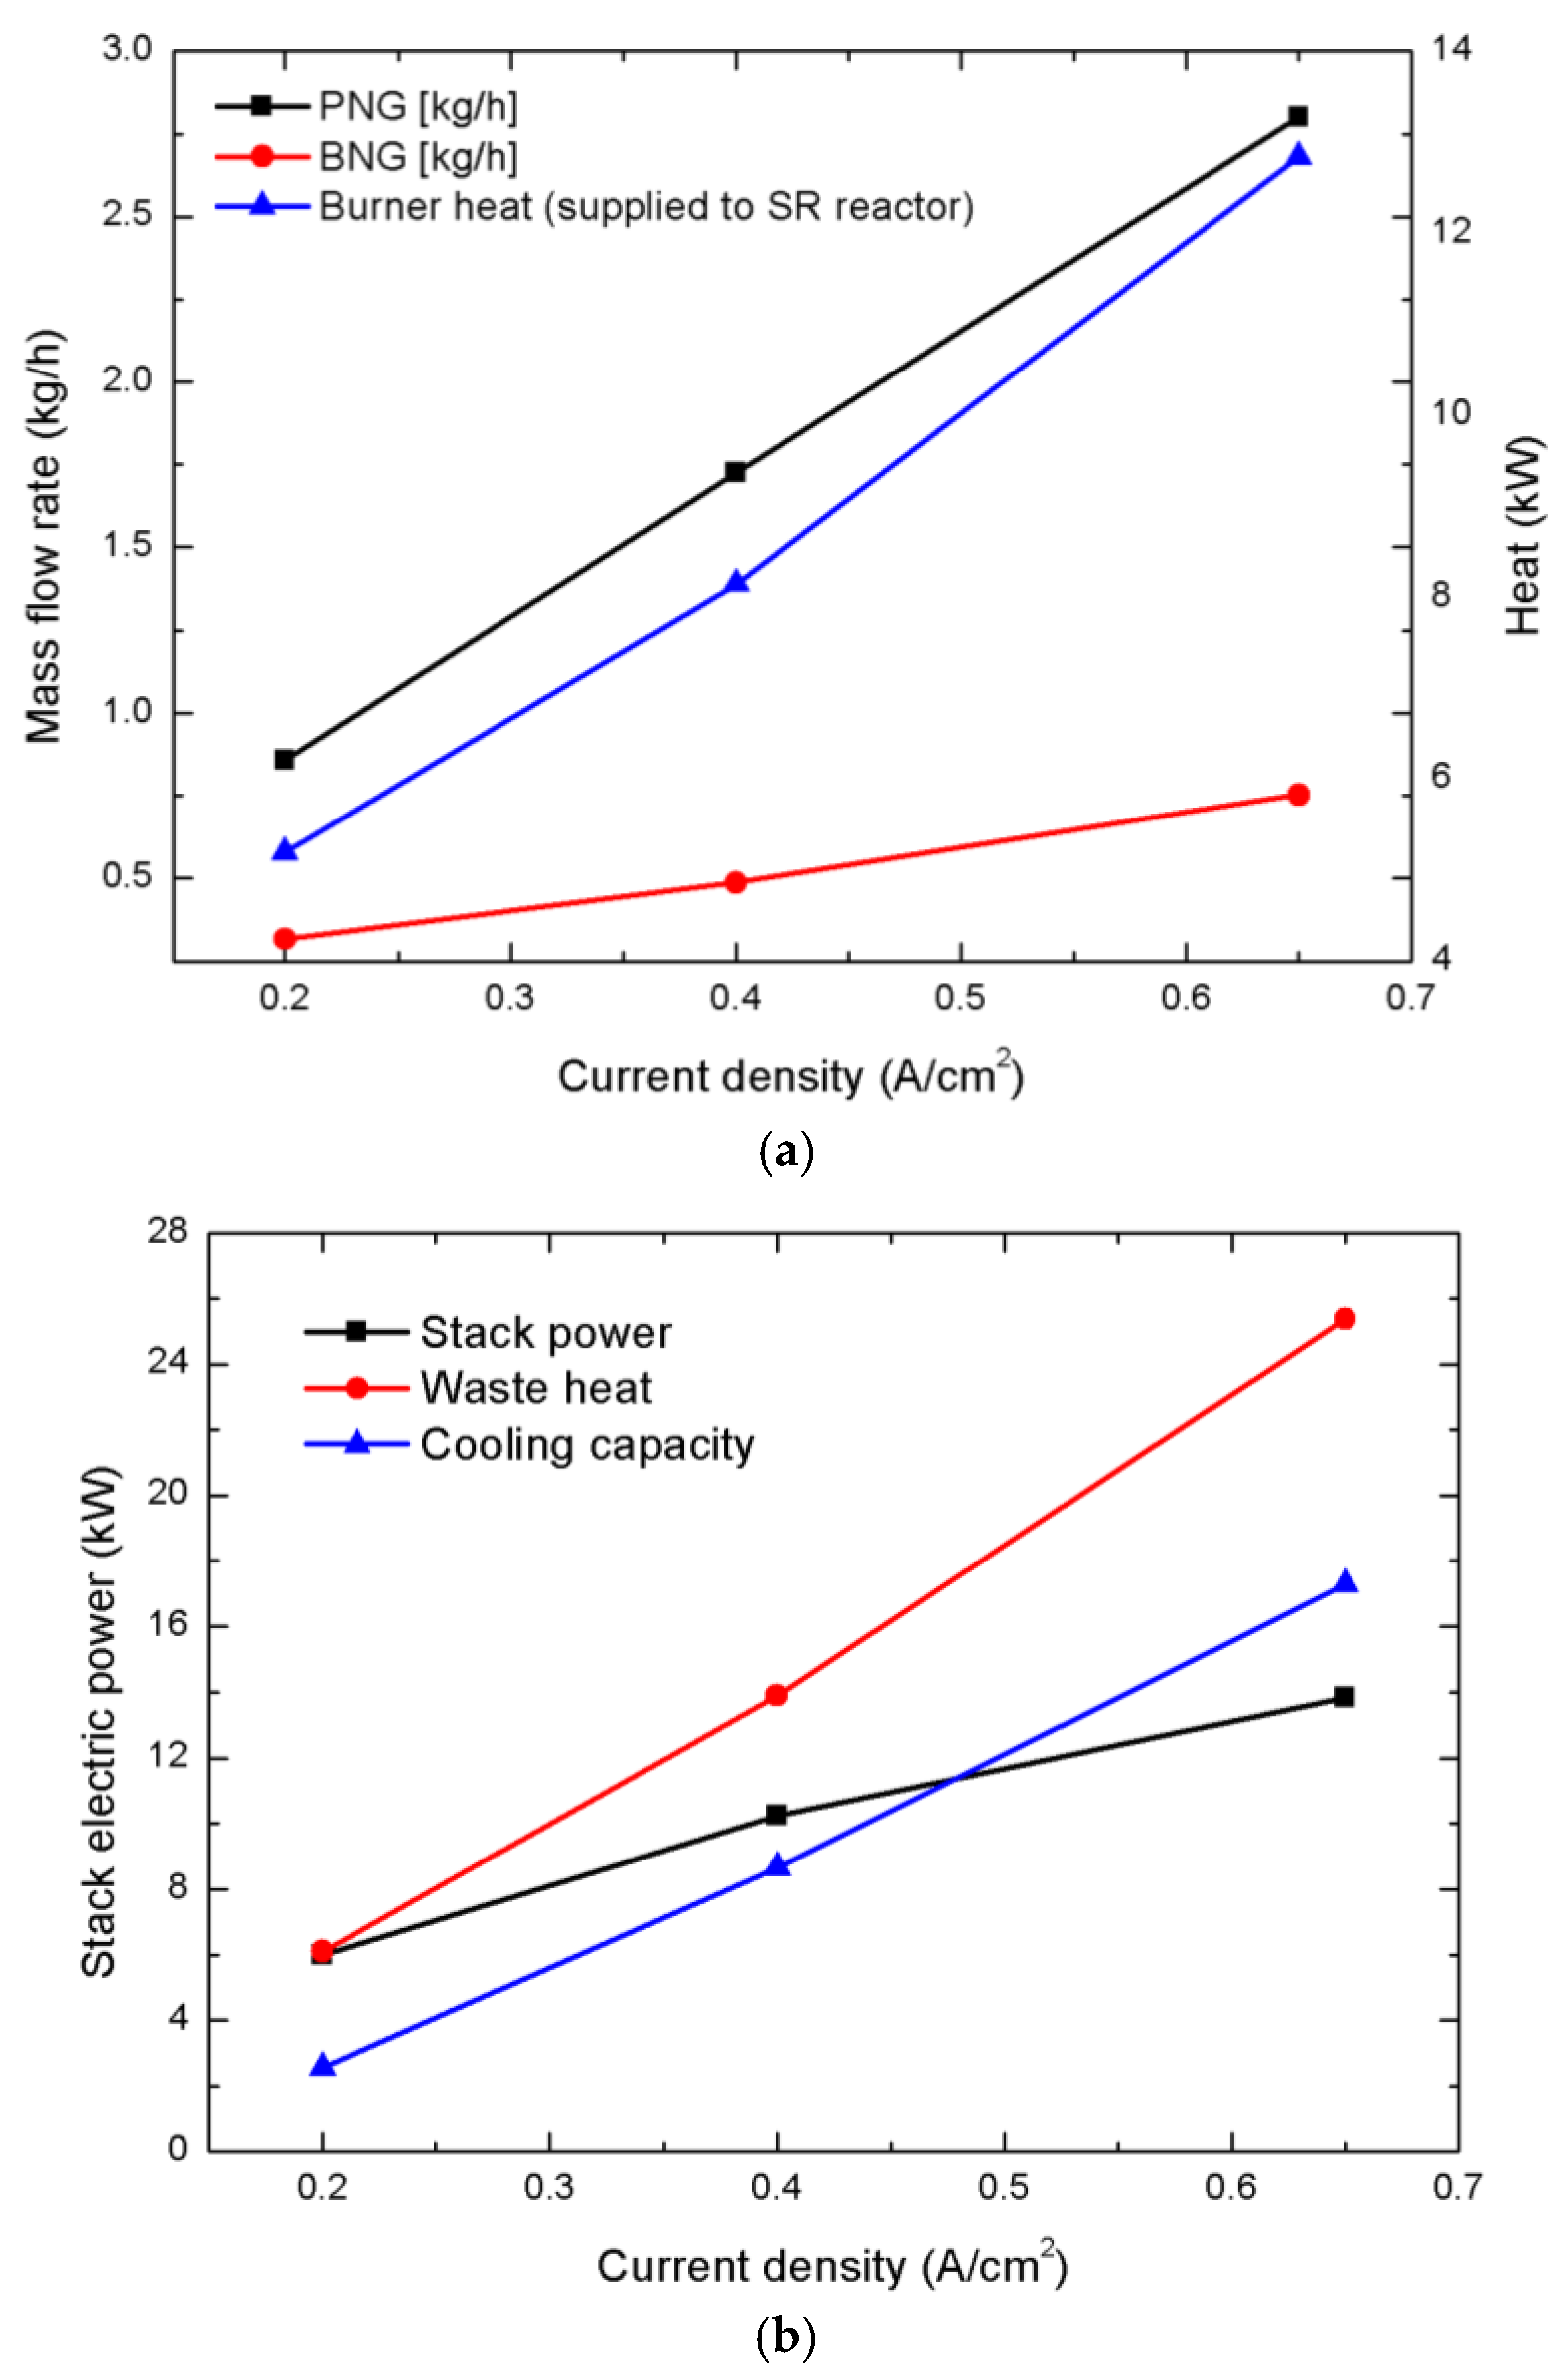
3. Results and Discussion

Figure 6 display the cell voltage, stack power, and waste heat under different operating current densities, wherein the calculated polarization curve agrees well with the experimental curve that was measured by Qingfeng [39]. In addition, the stack power and waste heat were estimated based on the stack configuration in Table 3 ( A M E A = 300 cm2, N c e l l = 160). While the cell voltage decreased with the current density, the stack power and waste heat dramatically increased with current density. Therefore, when greater cooling and electrical loads are required during summer, operating a HT-PEMFC stack at lower voltage (higher current) is needed to obtain higher stack power for more electricity use and supplying more heat to the absorption chiller. Figure 7 schematically shows the HT-PEMFC system simulation results for the lower current-density operation of the HT-PEMFC stack at 0.2 A/cm2. With a PNG flow rate of 0.8587 kg/h, 0.4283 kg/h of hydrogen was produced through the SR, HTS, and LTS processes and then fed into the HT-PEMFC stack, wherein 5.978 kW of electric power was generated with around 6.097 kW of waste heat. The heat was transferred to the LiBr-H2O solution in the absorption chiller and 4.011 kg/h of water was vaporized from the strong solution and used as refrigerant. The cooling capacity of 2.568 kW was finally delivered through 135.11 kg/h of chiller water loop ( T Chiller   H 2 O ,   in = 25.35 °C, T Chiller   H 2 O ,   out = 9.045 °C). The electric-power generation from the HT-PEMFC stack, which ranged from 5 to 6 kW, was sufficient in coping with the power consumption of five households, but the cooling capacity, which was around 2.566 kW, was less than that of one household in the summer, which implies that the HT-PEMFC stack’s operating mode must be switched to a higher power and lower efficiency mode during summer.
Therefore, higher current-density operations of an HT-PEMFC stack at 0.4 and 0.65 A/cm2 were simulated. As the stack’s operating current density increase, the BNG and PNG flow rates should accordingly increase to obtain greater hydrogen yield at the higher current density. Figure 8a shows the required BNG and PNG flow rates and the amount of heat that is transferred from the burner to SR reactor, wherein the BNG and PNG flow rates were controlled to provide a sufficient amount of heat to the SR reactor and generate hydrogen flow that corresponds to the same anode stoichiometry of 1.2 according to current density. Thus, the BNG and PNG flow rates and the amount of heat that was provided to the SR reactor almost linearly increased with the current density. In Figure 8b, the stack’s electric power, waste heat, and cooling capacity are plotted with respect to the operating current density. As the operating current density increased, the waste heat and resultant cooling capacity of the absorption chiller relatively steeply increased with the current density when compared to the stack’s electric power. The cooling capacity increased from 2.566 kW at 0.2 A/cm2 to 17.292 kW at 0.65 A/cm2, while the electric-power generation increased relatively slowly from 5.978 kW at 0.2 A/cm2 to 13.812 kW at 0.65 A/cm2.
Figure 9 shows the electrical, cooling, thermal, and overall efficiencies (expressed in Equations (23), (31), (33) and (34), respectively) at three different current densities. Absorption chillers typically perform more efficiently at higher temperature and larger heat input, so the cooling efficiency increases relatively sharply with increasing current density, which offsets the decreases in the electrical and thermal efficiencies. Thus, the overall efficiency remained almost unchanged (around 70%) as the operating current density varied. This result indicates that an HT-PEMFC system with an absorption chiller can be adapted to various electrical, cooling, and heating-load requirements as the seasons change.
The burner FAR directly controls the heat supply to the SR reactor and it thus significantly influences the resulting hydrogen conversion rate and HT-PEMFC efficiencies. Therefore, HT-PEMFC system simulations were conducted with various burner FARs, which are summarized in Table 4. For simplicity, the air supply rate for the burner was fixed for each current-density condition, and only the BNG flow rate was adjusted to vary the burner FAR and ER. As predicted, the highest heat supply rate for the SR reactor is calculated with ER = 1, i.e., corresponding to a BNG flow rate of 0.3177 kg/h at 0.2 A/cm2, 0.4877 kg/h at 0.4 A/cm2, and 0.7526 at 0.65 A/cm2. Operating with higher FARs and ERs (rich mixture for the burner) should be avoided, because these conditions significantly reduce the efficiency of HT-PEMFC systems. On the other hand, lowering the FAR and ER (lean mixture lower than ER = 1) was beneficial, thus improving the tri-generation performance and efficiency. Even slightly higher H2 yields and stack power ( P s t a c k ) were predicted with the lower ERs, owing to the reduced HTS and LTS temperatures and enhancing the CO conversion rate to CO2 for the exothermic WGS reaction. Although the cooling capacity was reduced with a lower ER, the cooling and overall CHCP efficiencies were improved because less fuel was used. However, a further decrease in the ER can produce an insufficient heat supply for the SR reactor, substantially decreasing the hydrogen yield, stack power, and cooling capacity.

4. Conclusions

In this paper, we developed the HT-PEMFC system model for tri-generation, wherein an LiBr-H2O absorption chiller model was developed and then coupled with an HT-PEMFC stack model that is based on a PA-doped PBI membrane and fuel-reforming model that comprises an SR reactor, HTS and LST reactors, and burner, which were connected with various BOPs and heat exchangers. Using the commercially available flowsheet simulator Aspen HYSYS®, the system model for tri-generation was simulated under various operating conditions. The simulation results highlighted that higher current operation in the HT-PEMFC stack was needed to achieve sufficient cooling capacity. As the stack current density was raised from 0.2 A/cm2 to 0.65 A/cm2, the electric efficiency of HT-PEMFC stack dropped from 33.4% to 26.8%, but the cooling efficiency of single-effect LiBr-H2O absorption chiller was improved from 15.7% to 35.0%, leading to a substantial increase in the cooling capacity from 2.566 to 17.292 kW. In addition, a burner ER of around 0.75–0.8 levels was suitable in achieving higher overall CHCP efficiencies ranging from 70% at 0.65 A/cm2 to 75% at 0.2 A/cm2 without any loss of cooling capacity. This numerical study clearly illustrated that an HT-PEMFC system with an absorption chiller can adequately respond to various electrical, cooling, and heating-load requirements as seasons change.

Author Contributions

Conceptualization, G.G. and M.K.; Methodology, G.G. and M.K.; Software, G.G.; Validation, H.J.; Formal Analysis, G.G.; Investigation, G.G. and M.K.; Resources, H.J.; Data Curation, K.O.; Writing-Original Draft Preparation, D.K. and M.F.; Writing-Review & Editing, H.J. and M.F.; Visualization, J.L., J.C., N.L. and K.L.; Supervision, H.J.; Project Administration, H.J.

Acknowledgments

This research was supported by the Technology Innovation Program of the Korea Evaluation Institute of Industrial Technology (KEIT) (No.10052823) and the authors also would like to thank the support of the Korea Institute of Energy Technology Evaluation and Planning (KETEP) (No. 20173010032150) under the ministry of Trade, Industry & Energy (MOTIE) of Republic of Korea.

Conflicts of Interest

The authors declare no conflict of interest.

Nomenclature

A area, m2
A i pre-exponential factor of reaction i
A ( K j ) pre-exponential factor of the adsorption constant for species j
b h p i power consumption of an individual BOP component i, W
C concentration, mol·m−3
D mass diffusivity of a species, m2∙s−1
E i activation energy of reaction i, kJ·mol−1
F Faraday constant, C·mol−1
h j specific enthalpy of species j, kJ·mol−1
Δ h i specific enthalpy change of reaction i, kJ·mol−1
Δ h j adsorption specific enthalpy of species j, kJ·mol−1
i current density, A/cm2
k i rate of reaction i
K j adsorption constant for species j
K P i equilibrium constant of reaction i
L H V lower heating value, kJ·kg−1
M volume flow rate, m3·s−1
M W molar weight, kg·kmol−1
m ˙ mass flow rate, kg·h−1
n number of the cell
p pressure, Pa
P stack power, W
Q ˙ stack total heat generation from a stack, W
r i reaction rate i, kmol∙(kg cat·h)−1
R universal gas constant, 8.314 J∙(mol⋅K)−1
R e l e c equivalent contact resistance to electron conduction, Ω
R H + area-specific resistance from proton transport, Ω
T temperature, K
U entire heat transfer coefficient, W∙m−2⋅K−1
U 0 thermodynamic equilibrium potential, V
V voltage, V
z number of electrons in the electrochemical reaction
Greek letters
α transfer coefficient
ε efficiency
ν porosity
ρ density, kg⋅m−3
η overpotential, V
κ proton conductivity, S⋅m−1
ξ stoichiometry flow ratio
Subscripts & abbreviations
a anode
a c t activation
A O G anode off gas
b backward
b u r n burner
B N G burner natural gas
B O P balance of plant
B V Butler-Volmer
c cathode
c h i l l e r chiller
c o n concentration
c o o l coolant
c o o l i n g cooling
C O P Coefficient of Performance
C H C P combined heat, cooling and power
C H C Combined Heating and Cooling
C L catalyst layer
e electric
E R Equivalence Ratio
f forward
F A R Fuel Air Ratio
G D L gas diffusion layer
G T gas turbine
h r heat recovery
H 2 O water
H X Heat Exchanger
H O R Hydrogen Oxidation Reaction
H T High temperature
H T S High temperature-shifts
i reaction number
i n in
j species
k BOP component
l i m limiting current density
l m logarithmic mean temperature difference
L T S Low temperature-shifts
L i B r Lithium bromide
L T Low temperature
L M T D logarithmic mean temperature
m e m membrane
M E A membrane electrode assembly
0 standard condition
o h m ohmic
o p t optimum
o u t out
O 2 oxygen
O R R Oxygen Reduction Reaction
P N G process natural gas
P B I Polybenzimidazole
P A Phosphoric Acid
P E M F C Polymer electrolyte membrane fuel cell
r e f reference value
s u p supply
S C R Steam to carbon ratio
S R Steam reforming
S O F C s Solid Oxide Fuel Cells
t thermal
t o t a l total
tri-gentri-generation system
W G S Water Gas Shift

References

  1. Hinaje, M.; Raël, S.; Noiying, P.; Nguyen, D.A.; Davat, B. An Equivalent Electrical Circuit Model of Proton Exchange Membrane Fuel Cells Based on Mathematical Modelling. Energies 2012, 5, 2724–2744. [Google Scholar] [CrossRef] [Green Version]
  2. Araya, S.S.; Andreasen, S.J.; Kær, S.K. Experimental Characterization of the Poisoning Effects of Methanol-Based Reformate Impurities on a PBI-Based High Temperature PEM Fuel Cell. Energies 2012, 5, 4251–4267. [Google Scholar] [CrossRef] [Green Version]
  3. Wang, F.C.; Lin, K.M. Impacts of Load Profiles on the Optimization of Power Management of a Green Building Employing Fuel Cells. Energies 2019, 12, 57. [Google Scholar] [CrossRef]
  4. Martin, I.S.; Ursua, A.; Sanchis, P. Modelling of PEM Fuel Cell Performance: Steady-State and Dynamic Experimental Validation. Energies 2014, 7, 670–700. [Google Scholar] [CrossRef] [Green Version]
  5. Wu, D.W.; Wang, R.Z. Combined cooling, heating and power: A review. Prog. Energy Combust. 2006, 32, 459–495. [Google Scholar] [CrossRef]
  6. Cozzolino, R. Thermodynamic Performance Assessment of a Novel Micro-CCHP System Based on a Low Temperature PEMFC Power Unit and a Half-Effect Li/Br Absorption Chiller. Energies 2018, 11, 315. [Google Scholar] [CrossRef]
  7. Gordon, J.M.; Ng, K.C. A general thermodynamic model for absorption chillers: Theory and experiment. Appl. Therm. Eng. 1995, 15, 73–83. [Google Scholar] [CrossRef]
  8. Xu, Y.; Zhang, S.; Xiao, Y. Modeling the dynamic simulation and control of a single effect LiBr-H2O Absorption chiller. Appl. Therm. Eng. 2016, 107, 1183–1191. [Google Scholar] [CrossRef]
  9. Martínez, J.C.; Martinez, P.J.; Bujedo, L.A. Development and experimental validation of a simulation model to reproduce the performance of a 17.6 kW LiBr-water absorption chiller. Renew. Energy 2016, 86, 473–482. [Google Scholar] [CrossRef]
  10. Ochoa, A.A.V.; Dutra, J.C.C.; Henríquez, J.R.G.; Dos Santos, C.A.C. Dynamic study of a single effect absorption chiller using the pair LiBr/H2O. Energy Convers. Manag. 2016, 108, 30–42. [Google Scholar] [CrossRef]
  11. Rubio-Maya, C.; Pacheco-Ibarra, J.J.; Belman-Flores, J.M.; Galván-González, S.R.; Mendoza-Covarrubias, C. NLP model of a LiBr-H2O absorption refrigeration system for the minimization of the annual operating cost. Appl. Therm. Eng. 2012, 37, 10–18. [Google Scholar] [CrossRef]
  12. Yin, H.; Qu, M.; Archer, D.H. Model based experimental performance analysis of a microscale LiBr-H2O steam-driven double-effect absorption Chiller. Appl. Therm. Eng. 2010, 30, 1741–1750. [Google Scholar] [CrossRef]
  13. Xu, Z.Y.; Wang, R.Z. Experimental verification of the variable effect absorption refrigeration cycle. Energy 2014, 77, 703–709. [Google Scholar] [CrossRef]
  14. Takezawa, S.; Wakahara, K.; Araki, T.; Onda, K.; Nagata, S. Cycle analysis using exhaust heat of SOFC and turbine combined cycle by absorption chiller. Electr. Eng. Jpn. 2009, 167, 49–55. [Google Scholar] [CrossRef]
  15. Malico, I.; Carvalhinho, A.P.; Tenreiro, J. Design of a trigeneration system using a high-temperature fuel cell. Int. J. Energy Res. 2009, 33, 144–151. [Google Scholar] [CrossRef] [Green Version]
  16. Yu, Z.; Han, J.; Cao, X. Investigation on performance of an integrated solid oxide fuel cell and absorption chiller tri-generation system. Int. J. Hydrog. Energy 2011, 36, 12561–12573. [Google Scholar] [CrossRef]
  17. Burer, M.; Tanaka, K.; Favrat, D.; Yamada, K. Multi-criteria optimization of a district cogeneration plant integrating a solid oxide fuel cell–gas turbine combined cycle, heat pumps and chillers. Energy 2003, 28, 497–518. [Google Scholar] [CrossRef]
  18. Tse, L.K.C.; Wilkins, S.; McGlashan, N.; Urban, B.; Martinez-Botas, R. Solid oxide fuel cell/gas turbine trigeneration system for marine applications. J. Power Sources 2011, 196, 3149–3162. [Google Scholar] [CrossRef]
  19. Margalef, P.; Samuelsen, S. Integration of a molten carbonate fuel cell with a direct exhaust absorption chiller. J. Power Sources 2010, 195, 5674–5685. [Google Scholar] [CrossRef]
  20. Intini, M.; De Antonellis, S.; Joppolo, C.M.; Casalegno, A. A trigeneration system based on polymer electrolyte fuel cell and desiccant wheel—Part B: Overall system design and energy performance analysis. Energy Convers. Manag. 2015, 106, 1460–1470. [Google Scholar] [CrossRef]
  21. Chen, X.; Gong, G.; Wan, Z.; Luo, L.; Wan, J. Performance analysis of 5 kW PEMFC-based residential micro-CCHP with absorption chiller. Int. J. Hydrog. Energy 2015, 40, 10647–10657. [Google Scholar] [CrossRef]
  22. Arsalis, A. Modeling and simulation of a 100 kWe HT-PEMFC subsystem integrated with an absorption chiller subsystem. Int. J. Hydrog. Energy 2012, 37, 13484–13490. [Google Scholar] [CrossRef]
  23. Ge, Y.; Tassou, S.; Chaer, L.; Suguartha, N. Performance evaluation of a tri-generation system with simulation and experiment. Appl. Energy 2009, 86, 2317–2326. [Google Scholar] [CrossRef]
  24. Najafi, B.; Antonellis, S.; Lntini, M.; Zago, M.; Rinaldi, F.; Casalegno, A. Atri-generation system based on plymer electrolyte fuel cell and desiccant whell—Part A: Fuel cell system modelling and parial load analysis. Energy Convers. Manag. 2015, 106, 1450–1459. [Google Scholar] [CrossRef]
  25. Al-Sulaiman, F.; Dincer, L.; Hamdullapur, F. Energy analysis of a trigeneration plant based on solid oxide fuel cell and organic Ranine cycle. Int. J. Hydrog. Energy 2010, 35, 5104–5113. [Google Scholar] [CrossRef]
  26. Tippawan, P.; Arpornwichanop, A.; Dincer, L. Energy and Exergy analyses of an ethanol-fueled solid oxide fuel cell for a trigeneration system. Energy 2015, 87, 228–339. [Google Scholar] [CrossRef]
  27. Authayanun, S.; Hacker, V. Energy and exergy analyses of a stand-alone HT-PEMFC based trigeneration system for residential applications. Energy Convers. Manag. 2018, 160, 230–242. [Google Scholar] [CrossRef]
  28. Jo, A.; Oh, K.; Lee, J.; Han, D.; Kim, D.; Kim, J.; Kim, B.; Kim, J.; Park, D.; Kim, M.; et al. Modeling and analysis of a 5 kWe HT-PEMFC system for residential heat and power generation. Int. J. Hydrog. Energy 2017, 42, 1698–1714. [Google Scholar] [CrossRef]
  29. Oh, K.; Ju, H. Temperature dependence of CO poisoning in high-temperature proton exchange membrane fuel cells with phosphoric acid-doped polybenzimidazole membranes. Int. J. Hydrog. Energy 2015, 40, 7743–7753. [Google Scholar] [CrossRef]
  30. Das, S.K.; Reis, A.; Berry, K.J. Experimental evaluation of CO poisoning on the performance of a high temperature proton exchange membrane fuel cell. J. Power Sources 2009, 193, 691–698. [Google Scholar] [CrossRef]
  31. Xu, J.; Froment, G.F. Methane steam reforming methanation and water-gas shift: I. Intrinsic kinetics. AIChE J. 1989, 35, 88–96. [Google Scholar]
  32. Oliveira, E.L.G.; Grande, C.A. Steam methane reforming in a Ni/Al2O3 catalyst: Kinetics and diffusional limitations in extrudates. Can. J. Chem. Eng. 2009, 87, 945–956. [Google Scholar] [CrossRef]
  33. Hou, K.; Hughes, R. The kinetics of methane steam reforming over a Ni/α-catalyst. Chem. Eng. J. 2001, 82, 311–328. [Google Scholar] [CrossRef]
  34. Chen, W.H.; Lin, M.R.; Jiang, T.L.; Chen, M.H. Modeling and simulation of hydrogen generation from high-temperature and low-temperature water gas shift reactions. Int. J. Hydrog. Energy 2008, 33, 6644–6656. [Google Scholar] [CrossRef]
  35. Chippar, P.; Oh, K.; Kim, W.G.; Ju, H. Numerical analysis of effects of gas crossover through membrane pinholes in high-temperature proton exchange membrane fuel cells. Int. J. Hydrog. Energy 2014, 39, 2863–2871. [Google Scholar] [CrossRef]
  36. Oh, K.; Jeong, G.; Cho, E.A.; Kim, W.; Ju, H. A CO poisoning model for high-temperature proton exchange membrane fuel cells comprising phosphoric acid-doped polybenzimidazole membranes. Int. J. Hydrog. Energy 2014, 39, 21915–21926. [Google Scholar] [CrossRef]
  37. Oh, K.; Chippar, P.; Ju, H. Numerical study of thermal stresses in high-temperature proton exchange membrane fuel cell (HT-PEMFC). Int. J. Hydrog. Energy 2014, 39, 2785–2794. [Google Scholar] [CrossRef]
  38. Won, S.; Oh, K.; Ju, H. Numerical degradation studies of high-temperature proton exchange membrane fuel cells with phosphoric acid-doped PBI membranes. Int. J. Hydrog. Energy 2016, 41, 8296–8306. [Google Scholar] [CrossRef]
  39. Qingfeng, L.; Hjuler, H.A.; Bjerrum, N.J. Phosphoric acid doped polybenzimidazole membranes: Physiochemical characterization and fuel cell applications. J. Appl. Electrochem. 2001, 31, 773–779. [Google Scholar] [CrossRef]
  40. Jiao, K.; Li, X. A three-dimensional non-isothermal model of high temperature proton exchange membrane fuel cells with phosphoric acid doped polybenizmidazole membranes. Fuel Cells 2010, 10, 351–362. [Google Scholar] [CrossRef]
Figure 1. Configuration of a high temperature-proton exchange membrane fuel cells (HT-PEMFC) system with tri-generation.
Energies 12 00905 g001
Figure 2. Fuel-reforming module flowsheet created by ASPEN HYSYS® V7.2.
Energies 12 00905 g002
Figure 3. (a) Configuration of a gas/coolant channels and membrane electrode assembly (MEA) in a HT-PEMFC stack and (b) related flowsheet created by Aspen HYSYS®.
Energies 12 00905 g003
Figure 4. (a) Configuration of the absorption chiller using LiBr –H2O solution and (b) related flowsheet created by ASPEN HYSYS®.
Energies 12 00905 g004
Figure 5. Flowsheet of the heat recovery module created by ASPEN HYSYS®, wherein the roles of five heat exchangers are schematically illustrated.
Energies 12 00905 g005
Figure 6. Simulation and experiment comparison of polarization curves for a HT-PEMFC, stack power curve, and waste heat curve as a function of current density.
Energies 12 00905 g006
Figure 7. Configuration of mass and heat-flow diagram for trigeneration system at 0.2 A/cm2.
Energies 12 00905 g007
Figure 8. (a) Required burner natural gas (BNG) and process natural gas (PNG) flow rates and amount of heat supplied to the SR reactor with the variation of operating current density, (b) electric power, waste heat, and cooling capacity of HT-PEMFC stack as a function of operating current density. As the operating current density varied, the BNG and PNG flow rates were adjusted to maintain the same anode stoichiometry of 1.2.
Energies 12 00905 g008
Figure 9. Curves for the electrical, cooling, thermal, and overall efficiencies under various current densities.
Energies 12 00905 g009
Table 1. Adsorption and equilibrium constants and kinetic parameters for Equations (1)–(3).
Arrhenius Expression
ReactionCatalyst TypeActivation Energy, Ei, kJ/molRef.Pre-Exponential Factor,
Ai
Ref.Equilibrium Constants,
Kpi
Ref.
1Ni-Al2O3217.01[32]2.084 × 10¹³
kmol∙bar0.5∙kgcat−1∙h−1
[32]1.198 × 10¹³ exp(−26830/T) bar2[33]
2SRNi-Al2O368.20[32]3.359 × 10⁷
kmol∙bar−1∙kgcat−1∙h−1
[32]1.767 × 10⁻² exp(4400/T)[33]
HTSSHT-470[34]1.78 × 1022 × (1 + 0.0097∙SCR − 1.1364∙SCR2)T−8[34]
LTSMDC-735[34]1.74 × 1017 × (1 − 0.1540∙SCR − 0.0008∙SCR2)T−8.5[34]
3Ni-Al2O3215.84[32]4.644 × 10¹³
kmol∙bar0.5∙kgcat−1∙h−1
[32]2.117 × 10¹¹ exp(−22430/T) bar2[33]
Van’t Hoff Expression
ParameterAdsorption Specific Enthalpy,
∆hj, kJ/mol
Ref.Pre-Exponential Factor,
A(Kj)
Ref.
CH4−38.28[31]6.65 × 10⁻⁴·bar−1[31]
CO−70.65[31]8.23 × 10⁻⁵·bar−1[31]
H2−82.90[31]6.12 × 10⁻⁹·bar−1[31]
H2O88.68[31]1.77 × 10⁵·bar0[31]
Table 2. Specific-enthalpy coefficients of the LiBr solution.
Specific Enthalpy of the LiBr Solution
a 0 3.462023 c 0 162.81
a 1 −2.679895 × 10⁻² c 1 −6.0418
b 0 1.3499 × 10⁻³ c 2 4.5348 × 10⁻³
b 1 −6.55 × 10⁻⁶ c 3 1.2053 × 10⁻³
Table 3. Geometric/operating conditions and input parameters for simulations of the HT-PEMFC stack.
DescriptionValueRef.
MEA area, A M E A 300 cm2-
Operating temperature, T c e l l 165 °C-
Anode/cathode stoichiometry, ξ 1.2/2.0-
Number of cells in a stack, n c e l l 160-
Thickness of anode/cathode CLs, GDLs, δ C L , δ G D L 0.015, 0.35 mm-
Thickness of anode/cathode membrane, δ M E M 0.07 mm-
Anode/Cathode inlet pressure1.0 atm-
Reference hydrogen/oxygen molar concentration, C H 2 , r e f / C O 2 , r e f 40.88 mol/m3[40]
Electronic conductivity in BP, GDL, CL14000, 1250, 300 S/m[40]
Phosphoric acid doping level18.7[40]
Anode/cathode transfer coefficient0.5, 0.65[40]
Reference exchange current density in anode/cathode, i 0 , a r e f , i 0 , c r e f 1.0 × 10⁹, 1.0 × 10⁴ A/m2[35]
Volume fraction of ionomers in CLs0.3[40]
Porosity of GDL, CL0.6, 0.4[40]
Proton conductivity of the membrane, κ 36.22 S/m[39]
Table 4. Effects of fuel-air ratio (FAR) for the burner on the performance of the tri-generation system.
Operating ConditionER
( m ˙ B N G )
[ k g / h ]
FARCO Fraction
[ % ]
H2 Fraction
[ % ]
W B u r n , s u p
[ k W ]
H2
yield
[ k g / h ]
T H T S
[ ° C ]
T L T S
[ ° C ]
P s t a c k
[ k W ]
W c o o l i n g
[ k W ]
COP ε e
[ % ]
ε c o o l i n g
[ % ]
ε t
[ % ]
ε C H C P
[ % ]
I = 0.2 A/cm2
m ˙ a i r = 8.536   k g / h
m ˙ P N G = 0.8587   k g / h
m ˙ B N G = 0.3177   k g / h
m ˙ S R , w = 3.865   k g / h
1.33
(0.4236)
5.0520.528779.885.1770.4284358.3248.65.9802.5580.49430.67914.35118.95063.981
1
(0.3177)
4.6100.555379.875.2050.4283362.7251.65.9782.5660.49333.42915.69220.65669.777
0.76
(0.2421)
4.2000.119779.954.4280.4303226.0165.66.0072.4940.56335.91616.30022.07574.291
0.4 A/cm2
m ˙ a i r = 13.27   k g / h
m ˙ P N G = 1.725   k g / h
m ˙ B N G = 0.4877   k g / h
m ˙ S R , w = 7.755   k g / h
1.33
(0.6503)
4.8670.563179.898.0850.8608304.3250.810.2288.7291.08028.87026.43910.23065.538
1
(0.4877)
4.5070.606079.888.1450.8604310.4255.910.2238.6571.06230.97428.14710.98270.103
0.80
(0.3902)
4.1940.158179.977.1350.8656202.0166.010.2858.3381.16932.61428.36011.48872.462
0.65 A/cm2
m ˙ a i r = 20.91   k g / h
m ˙ P N G = 2.801   k g / h
m ˙ B N G = 0.7526   k g / h
m ˙ S R , w = 12.60   k g / h
1.33
(1.0035)
4.7800.634979.8712.7731.3967302.7265.213.81917.2701.35225.00932.6586.38764.054
1
(0.7526)
4.4390.675279.8612.8401.3960307.1269.213.81217.2921.34726.76135.0086.83868.606
0.80
(0.6021)
4.1420.238979.9711.2801.4051196.4171.613.90216.7371.48428.13535.3837.14070.658

