Abstract
Battery electric vehicles (BEVs) and plug-in hybrid electric vehicles (PHEVs) are seen as the most promising alternatives to internal combustion vehicles, as a means to reduce the energy consumption and greenhouse gas (GHG) emissions in the transportation sector. To provide the basis for preferable decisions among these vehicle technologies, an environmental benefit evaluation should be conducted. Lithium iron phosphate (LFP) and lithium nickel manganese cobalt oxide (NMC) are two most often applied batteries to power these vehicles. Given this context, this study aims to compare life cycle energy consumption and GHG emissions of BEVs and PHEVs, both of which are powered by LFP and NMC batteries. Furthermore, sensitivity analyses are conducted, concerning electricity generation mix, lifetime mileage, utility factor, and battery recycling. BEVs are found to be less emission-intensive than PHEVs given the existing and near-future electricity generation mix in China, and the energy consumption and GHG emissions of a BEV are about 3.04% (NMC) to 9.57% (LFP) and 15.95% (NMC) to 26.32% (LFP) lower, respectively, than those of a PHEV.
1. Introduction
Currently, China is the world’s largest vehicle producer and sales market. However, the rapid growth of car ownership in recent years has raised grave concerns about national energy security, traffic safety, and climate change. According to statistics, China’s reliance on oil importation exceeded 65 percent by the end of 2017 [1]. At the same time, the transport sector contributes to a significant share of the country’s total greenhouse gas (GHG) emissions. Recently, the Chinese government has regarded electric vehicles (EVs) as the alternative to internal combustion engine vehicles (ICEVs) to diminish GHG emissions and to alleviate the dependence on gasoline. Since 2015, China has already become the largest EV market globally and the accumulated number of EVs exceeded 1 million at the end of 2017. Besides, in the energy saving and new energy automotive industry development plan 2012–2020 [2], it is estimated that the total production and sales of pure battery electric vehicles (BEVs) and plug-in electric vehicles (PHEVs) will amount to 5 million vehicles by 2020, 5 times more than the current ownership.
BEVs and PHEVs are two main types of EVs and are already commercially available. Noticeably, hybrid electric vehicles are seen as an extended model of ICEVs because they do not take electricity from the grid [3]. The choice of vehicle technologies depends on multi-aspect factors, including affordability, engineering performance, policy guidance, and environmental benefits. The differences surrounding the economic viability and electrochemistry performance of BEVs and PHEVs are clearly recognized. For example, the higher purchase cost is required for BEVs, relative to comparable PHEVs, but this additional cost can currently be compensated by higher subsidies and lower fuel costs in operation. On the other hand, the limited range of BEVs is a major challenge for the wide diffusion of BEVs. However, from the perspective of life cycle environmental performance analysis of BEVs and PHEVs, a consensus has not reached concerning which option has more energy saving and lower emissions.
Additionally, the supportive policies in current China give priority to BEVs, enhancing BEVs attractiveness for potential customers. In the early stage of deploying EVs, such government support played a determinant role to sway automakers to adjust the production strategies. Thereby, if the targets of energy conservation and emission reduction in the transportation sector are desired to be fulfilled by promoting the development of EVs, the identification of which powertrain option has larger energy and emission reduction potential is necessary.
A broad body of literature compares the energy consumption and environmental impact of BEVs, PHEVs with ICEVs in a life cycle perspective [3,4,5,6]. However, direct and detailed comparisons between BEVs and PHEVs are hardly observed. Secondly, the majority of relevant studies compare the BEVs and PHEVs by only considering the fuel cycle but disregard the vehicle cycle [7,8,9]. For example, Ke et al. (2017) [10] conducted a detailed Well-to wheels (WTW) analysis based on real-world data and found that Beijing’s BEVs can significantly reduce WTW carbon dioxide emissions compared with their conventional gasoline counterparts, even in a coal-rich region. Among these papers regarding the fuel cycle, most conclusions demonstrate that BEVs are superior to PHEVs in terms of environmental performance, but if the vehicle cycle is counted, the findings may not be warranted since a larger battery is necessary to be produced for BEVs than a class-equivalent PHEV to overcome the range limitation. Thirdly, the preceding research regarding the fuel cycle of BEVs and PHEVs was almost based on European or U.S. cases and indicates that the results depend on the electricity profile and driving conditions of each specific case. For example, Onat et al. (2015) [11] compared various vehicle options across 50 states and concluded that EVs are the least carbon-intensive option in 24 states. Casals et al. (2016) [12] calculated the EV global warming potential for different European countries under various driving conditions and concluded that the current electricity profile in some countries (e.g., France or Norway) is well suited to accommodate EV market penetration, while countries like Germany and the Netherlands do not offer immediate GHG emission reductions for the uptake of EVs. In this sense, the advantages of BEVs may not be guaranteed in China, where the electricity mix is dominated by coal. As the most crucial part of EVs, the traction battery determines the environmental and engineering performance of vehicles. In the current Chinese traction battery market, lithium iron phosphate (LFP) and lithium nickel manganese cobalt oxide (NMC) are the two dominant battery chemistries, but these two battery types have different energy requirements in their production process, along with their unique electrochemistry features, which affect the energy demand of vehicles in the use stage. Therefore, specifically considering the battery chemistries is an important part of life cycle analysis of electric vehicles.
With the above information in mind, this study aims to comprehensively compare the life cycle energy consumption and GHG emission performance of BEVs and PHEVs, where both the fuel cycle and the vehicle material cycle are involved and two mainstream battery chemistries (LFP and NMC) are considered. Here, we attempt to address two questions:
Which electric vehicle technology corresponds to lower energy consumption and GHG emissions?
Will the relative outperformance of such vehicle technology change with the variation in battery chemistries, electricity mix, driving distance, and some other important factors?
2. Materials and Methods
Life cycle assessment (LCA) is a method to assess the life cycle potential environmental performance of a product or a service [13]. The standardized methodology defines four steps, the definition of the goal and scope, the life cycle inventory, the life cycle impact assessment and the interpretation of results. In this study, a comparison between BEVs and PHEVs is discussed by using the LCA approach to help us identify the superiority of these vehicle technologies in terms of energy savings and GHG emission reductions.
2.1. Goal and Scope
In this study, four electric vehicle types representing different vehicle technologies (BEV and PHEV) and battery options (LFP and NMC) have been discussed. Qin 300 (BEV-LFP), Qin 80 (PHEV-LFP), Qin 450 (BEV-NMC), and Qin 100 (PHEV-NMC) were chosen as the representative vehicles and the related information is mainly provided by its manufacturer, BYD, a major leading electric vehicle maker in China [14]. The choice of Qin series is due to its high market share, which contributed to 7% of the total new electric vehicles in the first half year of 2018. Especially in the PHEV market, Qin PHEV models account for 23.8% in the same period. Besides, choosing the vehicles from one plant allows a comparable basis for comparison, such as the comparative size and class of vehicles, the same modeling approach of energy efficiency, and unwanted variations in the production line are greatly avoided.
2.2. System Boundary
The system boundary includes both the fuel cycle and the vehicle cycle. The functional unit is expressed as per driven distance (per kilometers; per km) and GHG emissions are reported in grams CO2 equivalents (g CO2-eq).
Fuel life cycle
- Well to pump stage (WTT): The extraction, production and transport of feedstock, and the refining, production and distribution of gasoline and electricity
- Pump to wheels stage (TTW): The fuel utilized by vehicles in the use phase
Vehicle life cycle
- The production of raw materials
- The manufacturing of vehicle components, including the vehicle body, traction battery and fluids
- The assembly stage
- The distribution and transportation stage
- The maintenance of the vehicle throughout its life time
- The disposal of the vehicle, also known as the end-of-life stage
2.3. Life Cycle Inventory
2.3.1. The Fuel Cycle
The fuel cycle consists of the well-to-tank (WTT) stage and the tank-to-wheel (TTW) stage. As for the WTT stage, the primary energy including coal, liquefied gasoline gas, and natural gas are inputted to produce the terminal energy of gasoline and electricity. In 2017, the electricity mix in China is shown in Figure 1. The conversion efficiency of primary energy, the proportion of fuel consumption in various processes and the transportation distance of primary energy can be obtained or calculated based on the data from official yearbooks and other related publications [8,15,16].
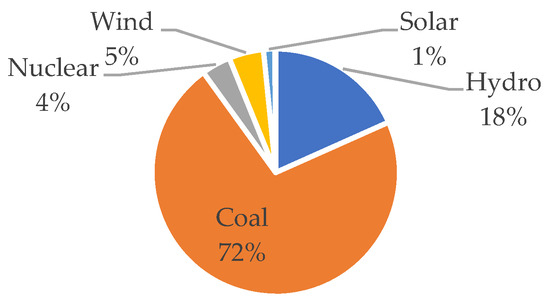
Figure 1.
The electricity profile of China in 2017.
As for the TTW stage, the fuel efficiencies of BEVs and PHEVs, as shown in Table 1, are provided by the car marker and have been verified through a fuel consumption record website, where the real-world energy efficiency data are reported by vehicle users [17]. The energy consumption and GHG emissions in the TTW stage are calculated by Equation (1).
where denotes the energy consumed per kilometer in the TTW stage, represents the upstream energy consumption of electricity, while and represent the upstream and the combustion emissions of gasoline, respectively. The utilization factor (UF) is defined as the distance fraction that is powered by electricity whereas (1-UF) represents the fraction of travel powered by gasoline [18]. For BEVs, the UF equals to 1 while that for PHEVs is assumed as 40% in this paper based on the assumption by Hou, Wang and Ouyang (2013) [18]. Similar methodology is applied to calculate GHG emissions. The Greenhouse Gases, Regulated Emissions, and Energy Use in Transportation Model (GREET) [19] is used to calculate the energy consumption and GHG emissions in the fuel cycle.

Table 1.
The fuel efficiency of each vehicle technology.
2.3.2. The Vehicle Cycle
As shown in Table 2, the vehicle and battery related parameters are provided by the car manufacturer, or assumed after personal communication with the car marker and car users.
Table 2.
The key parameters of representative vehicles.
The vehicle cycle includes five phases: material production and the vehicle production, the vehicle assembly, the transportation of the vehicle, the maintenance service and the end-of-life stage.
As for the material production and the vehicle production stage (the vehicle production, for short), the inventory of pre-manufacturing, such as the raw material extracting and processing, is based on published studies and reports [9,19,20,21,22], and GaBi software [23], which is an LCA computational platform and accommodates thousands of background processes and elementary flows. This paper splits the vehicle into three parts: the vehicle body (excluding the battery and fluids), the battery and the fluids (including engine oil, brake fluid, transmission fluid, powertrain coolant, and wiper fluid); production-related inputs and outputs of each part are specified. Table 3 contains the list of materials for each vehicle technologies, and the material breakdown of vehicle body and fluids is based on the reports given by Sullivan and Gaines (2010) [24] Mayyas, et al. (2012) [25] while that of battery packs is based on estimations given by Peters, Baumann, Zimmermann, Braun and Weil (2017) [20], Peters and Weil (2018) [21], Majeau-Bettez, Hawkins and Str Mman (2011) [22]. It is noted that the main composition difference between BEVs and PHEVs is the powertrain, where a PHEV consists of both an electric motor and internal combustion engine, while a BEV is exclusively propelled by the electric motor. In the manufacturing phase, main material transformation processes of the vehicle body are considered, including the stamping, casting, forging, extrusion, and machining, and the inventory is estimated on the basis of previous reportedly data [24,25,26,27]. In terms of the battery packs, extensive studies have focused on the cell manufacturing and pack assembly stage. Among these studies, the modelling approach of energy demand (one is to allocate the total energy demand of a plant by its output; another is to use data from theoretical considerations for specific processes) is identified as a major cause of deviated results [20]. However, this comparative analysis will not be affected much by the modelling approach when these vehicles come from the same manufacturing plant. Therefore, we estimate the values based on an LCA review study reported by Peters and Weil (2018) [21]. By following these steps, the energy and GHG emissions associated with vehicle production stage are calculated by using GaBi software.
Table 3.
The material component and the mass percentage of each vehicle technology (Unit: kg).
The assembly stage mainly includes stamping, welding, final assembly, injection molding, and painting. The production of heating, ventilation and air conditioning are not included in the comparative study since almost the same products are used for these different vehicles. In the assembly process, the energy consumption and GHG emissions are based on Mayyas, Omar, Hayajneh and Mayyas (2017) [25], J. L. Sullivan (2010) [28], Papasavva et al. (2002) [29].
The transportation of the vehicle includes two parts, from the production plant to the service shop, and from the maintenance shop to the dismantling sites [21]. The distance is set as 1600 km and 500 km, respectively, and diesel is assumed to be used in the road transportation.
Concerning the maintenance and replacement, we make assumptions based on previous studies, our communication with vehicle users and field investigation in the automobile service factory. As shown in Table 4, it is assumed that the tires and the engine oil should be replaced every 62,500 km, 6250 km, respectively and the wiper fluid, brake fluid, and powertrain coolant are completely consumed every 12,500 km, 62,500 km, and 62,500 km, respectively. In this paper, it is assumed that only one transmission oil is replaced during the life cycle of the car and the lifetime of the battery equals the lifetime of the vehicle.
Table 4.
The maintenance and replacement of vehicle materials.
For the end-of-life stage, this paper considers the energy consumption in the disassembly process and the avoided energy by recycling steel, aluminum, copper, and iron. Although batteries contain some valuable metals that need to be recycled, huge uncertainties exist when recycling activities are not conducted at a large scale. Additionally, most studies conclude that the end of life phase makes a small contribution to the whole life cycle [30,31,32]; therefore, we disregard the battery recycling in the baseline scenario but discuss it in the following sensitivity analysis. Besides, it is assumed that fluids, glasses and other non-metal materials are not recycled for their relatively cheap price. The energy consumption and regeneration rates are shown in Table 5, which are based on the recycling inventory reported by De Kleine et al. (2014) [33], Ruan et al. (2010) [34].
Table 5.
The energy consumption in the end-of-life stage.
3. Results
In this section, the performances of different vehicle technologies are presented. The results of the fuel cycle are calculated in per km, while results of the vehicle cycle are firstly presented in the unit of per vehicle and then presented as per km by dividing the lifetime mileage of vehicles.
3.1. Fuel Cycle
Based on previous studies, the energy consumption and GHG emissions for BEVs and PHEVs in the fuel cycle are found to be primarily affected by the energy conversion efficiency, carbon intensity of fuels and the fuel efficiency of vehicles.
3.1.1. WTT Stage
In the WTT stage, terminal fuels are produced after primary energy acquisition and processing, transportation, power generation, transmission and distribution. As shown in Table 6, energy consumption and GHG emissions from gasoline and electricity production in China are calculated. The energy conversion efficiency of gasoline is about 88.4% while the calculated energy conversion efficiency of electricity is about 43.3%. Fossil energy consumption accounts for 86.31% of the total energy consumption in electricity production and is dominated by coal consumption. The calculated results are similar to previous studies [35]. Notably, the electricity used to power BEVs comes from a more energy and emission intensive source than gasoline in China. The production of 1 MJ electricity is 2.04 times higher energy demand than that of gasoline, along with 9.51 times more GHG emissions.
Table 6.
The energy and emission intensities of gasoline and electricity production in 2017.
3.1.2. TTW Stage
Based on the real-world fuel efficiency of EVs and the Equation (1), the energy required for BEV is 0.648 MJ/km and 0.635 MJ/km for LFP powered and NMC powered vehicles, respectively, whereas the corresponding energy consumption is 1.409 MJ/km and 1.406 MJ/km for PHEVs, that is about 2 times more energy is required for PHEVs to drive the same distance, relative to that of BEVs. In addition, PHEVs emit 113.92 g/km GHG emissions due to the use of gasoline in the TTW stage while no tailpipe emissions are exhausted in this stage for BEVs.
3.1.3. The Entire Fuel Cycle
In the overall perspective of the fuel cycle, the energy consumption and GHG emissions of PHEVs are higher than those of BEVs, as shown in Figure 2. The total energy consumption in the fuel cycle of BEV (LFP) is 1.50 MJ/km with 128.80 g/km GHG emissions, while that of PHEV (LFP) is 1.96 MJ/km with 190.58 g/km GHG emissions. The energy consumption of BEV (NMC) and PHEV (NMC) is 1.47 MJ/km and 1.92 MJ/km, along with 120.71 g/km and 185.86 g/km GHG emissions, respectively. It can be observed that BEVs have about 30% energy reduction benefits and about 50% GHG emission mitigation benefits relative to PHEVs in the fuel cycle.
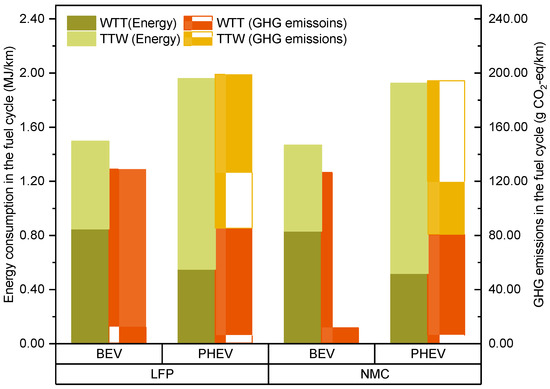
Figure 2.
The energy consumption and GHG emissions in the fuel cycle.
As for the same vehicle technology coupled with different batteries, NMC-powered vehicles have more energy and emission reduction benefits compared with LFP-powered vehicles in the fuel cycle but the difference is negligible compared with the differences associated with the vehicle technology. It is worth noting that since the rank of batteries heavily relies on the assumed fuel efficiency, which is closely related to other vehicle characteristics; more information and detail analysis are required before the general conclusion is made.
3.2. Vehicle Cycle
3.2.1. Vehicle Body Production
Specifically, the vehicle body production accounts for a large proportion in terms of energy consumption and GHG emissions. The energy consumption of the vehicle body production is 57,600 MJ/vehicle, 60,000 MJ/vehicle, 62,400 MJ/vehicle and 62,400 MJ/vehicle for BEV (LFP), BEV(NMC), PHEV (LFP) and PHEV (NMC), respectively, and the corresponding proportion in the vehicle cycle is 35.13%, 33.48%, 48.59%, and 46.16%. Similarly, the GHG emissions from the vehicle body production are 3982 kg/vehicle, 4240 kg/vehicle, 4189 kg/vehicle and 4306 kg/vehicle, accounting for 33.99%, 31.35%, 47.17% and 44.08% for the above order of vehicles. Since PHEVs are heavier than the equivalent BEVs and the extra mass mainly comes from the internal combustion engine, the higher proportion of the vehicle body production for PHEVs could be attributed to the production of the internal combustion engine.
3.2.2. Battery Production
The energy consumption and GHG emissions from the battery production process also account for a large proportion of the vehicle cycle. The energy required to produce a battery is 50,920 MJ/vehicle, 67,566 MJ/vehicle, 18,245 MJ/vehicle and 27,848 MJ/vehicle, respectively. The associated GHG emissions of 3369 kg/vehicle, 5113 kg/vehicle, 1207 kg/vehicle and 2108 kg/vehicle, accounting for 28.76%, 38.26%, 13.43% and 21.58% of the total vehicle cycle. Due to the range limitation, heavier batteries are needed for BEVs than for PHEVs, and hence more energy is required to produce the battery, leading to more GHG emissions. For BEVs, the energy and emission contribution of the battery production are similar to those of the vehicle body production while the battery production for PHEVs contributes less than that for producing the vehicle body.
For the same vehicle technology with different battery chemistries, the energy consumption of NMC battery production is 152 MJ/kg coupled with 11.52 kg/kg GHG emissions, i.e., higher than that of an LFP battery with 103 MJ/kg energy consumption and 6.82 kg/kg GHG emissions. The difference is mainly because of the energy-intensive production process of the high cobalt-containing cathode of the NMC battery.
3.2.3. Fluids Production
The energy consumption and GHG emissions in the fluids production stage account for the smallest share of the vehicle cycle. About 1492.83 MJ/vehicle energy is consumed for BEVs compared with 1769.86 MJ/vehicle for PHEVs, along with 72.82 kg/vehicle and 91.43 kg/vehicle GHG emissions for BEVs and PHEVs, respectively; only about 1% of the energy and emissions contributes to the fluid production. Besides, PHEV consumes relatively more energy to produce fluids, mainly because of the additional needed for engine oil.
3.2.4. Assembly Stage
When it comes to the vehicle assembly stage, the energy consumption ranges from 20,376 MJ/vehicle to 22,301 MJ/vehicle for BEVs and PHEVs, with the GHG emission about 1800 kg/vehicle for BEVs and 1900 kg/vehicle for PHEVs. The higher energy requirement is associated with the heavier vehicle mass of PHEVs.
3.2.5. Transportation Stage
As for the transportation stage, 4077 MJ/vehicle energy is required for BEVs, along with 292 kg/vehicle GHG emissions while an average of 3706 MJ/vehicle energy is required for PHEVs, along with about 265 kg/vehicle GHG emissions. The transportation stage accounts for about 2.5% of the vehicle cycle energy consumption for all these four vehicle technologies.
3.2.6. Maintenance Stage
In the maintenance stage, 7640.03 MJ/vehicle and 5567.87 MJ/vehicle energy are needed for BEVs and 13,353.11 MJ/vehicle and 9942.62 MJ/vehicle for PHEVs; 505.72 kg/vehicle and 356.92 kg/vehicle are emitted from BEVs and 860.44 kg/vehicle and 628.05 kg/vehicle from PHEVs. PHEVs consume more energy than BEVs, since more fluids need to be supplied for PHEVs. Besides, LFP-powered vehicles need more replacement and consequently consume more energy than the NMC counterpart due to the longer lifetime mileage.
3.2.7. End of Life Stage
In the end-of-life stage, the energy required to dispose of the vehicles is counted, as well as the avoided energy by reusing some recycled metals in the production stage. The energy and emissions in the end-of-life stage are shown in Table 7.
Table 7.
Energy consumption in the end-of-life stage.
3.2.8. Unit-Based Results in the Vehicle Cycle
In the vehicle cycle, the energy consumption of BEV (LFP), BEV (NMC), PHEV (LFP) and PHEV (NMC) is 163,941 MJ/vehicle, 179,199 MJ/vehicle, 128,433 MJ/vehicle and 135,188 MJ/vehicle, coupled with the GHG emissions of 11,712 kg/vehicle, 13,363 kg/vehicle, 8989 kg/vehicle and 9768 kg/vehicle, respectively.
As mentioned before, the lifetime mileage for LFP powered vehicles is about 160,000 km, while that for NMC powered vehicles is 120,000 km. As shown in Figure 3, LFP-powered BEVs consume 1.02 MJ/km, 27.65% higher than the LFP-powered PHEVs, with 0.80 MJ/km energy consumption. NMC-powered BEVs consume 1.49 MJ/km, 32.55% higher than NMC-powered PHEVs, whose energy consumption in the vehicle cycle is 1.13 MJ/km. The corresponding GHG emissions are 73.20 g/km, 56.18 g/km, 111.36 g/km and 81.40 g/km for BEV (LFP), BEV (NMC), PHEV (LFP) and PHEV (NMC).
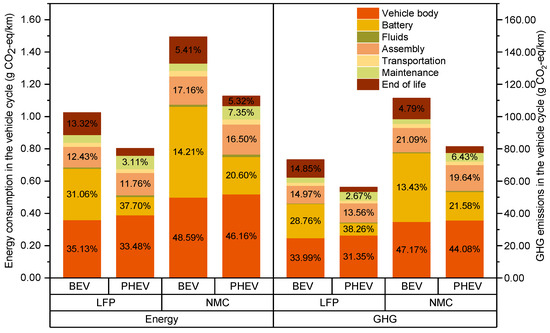
Figure 3.
Energy consumption and GHG emissions in the vehicle cycle.
3.3. The Life Cycle
The entire life cycle energy consumption of BEV (LFP), BEV (NMC), PHEV (LFP) and PHEV (NMC) is 2.52 MJ/km, 2.96 MJ/km, 2.76 MJ/km and 3.05 MJ/km, respectively, along with 201.94 g/km, 237.57 g/km, 255.08 g/km and 275.46 g/km GHG emissions. About 20% GHG saving for LFP-powered BEVs is found compared with LFP-powered PHEVs and NMC-powered BEVs have 13.75% GHG emission reduction compared with their PHEV counterparts.
According to Table 8, where the contribution analysis of various processes is presented, the fuel cycle for BEVs has a similar share compared with the vehicle cycle in the life cycle energy consumption and a slightly higher proportion in terms of the life cycle GHG emissions; the fuel cycle is the dominant stage of the life cycle energy and emissions for PHEVs.
Table 8.
Energy consumption and GHG emissions in the life cycle.
4. Sensitivity Analyses
Sensitivity analyses are conducted to explore how the life cycle energy consumption and GHG emissions will be influenced by the uncertainty of key parameters, including the electricity mix, driving distance, and the recycling activities. In addition, break-even points between BEVs and PHEVs have been analysed.
4.1. Sensitivity Analysis of Electricity Profile
To achieve higher energy and emission reduction benefits, the shares of non-fossil power in the electricity mix should increase to a higher level. China has already introduced relevant policies and measures to develop a low-carbon electricity mix. For example, “The 13th five-year plan for electric power (2016–2020)” has proposed that the installed capacity of non-fossil fuel will be about 770 million kilowatts in 2020, accounting for about 39%, and the installed capacity of natural gas accounts for more than 5% while that of coal will decrease to about 55%. Based on relevant policies and previous studies, this study projects the electricity supply structure of China in the near future (2020) and in the long-term future (2030), as shown in Figure 4.
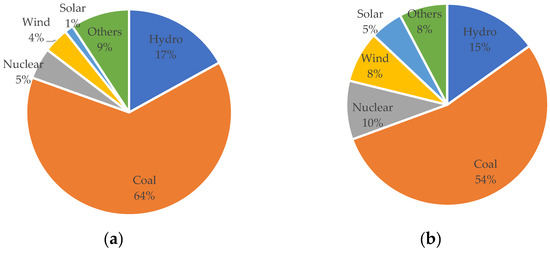
Figure 4.
(a) The electricity profile of China in 2020; (b) The electricity profile of China in 2030.
Power generation technologies in 2020 are assumed to be at the same level as in 2017, but in 2030, advanced technologies and highly efficient equipment are expected to be implemented to improve the energy conversion efficiency and control the pollution emissions. Therefore, this study assumes the energy consumption and GHG emissions would be 10% less than the predicted baseline power generation mix in 2030. The energy and emission intensities of Chinese electricity in 2020 and 2030 are calculated by using the GREET model and the results are shown in Table 9. Therefore, the GHG emissions from power generation are 19.25% and 27.32% lower in 2020 and 2030 than those in 2017. Since the gasoline production technology is relatively mature, this study assumes that the gasoline production-related GHG emissions from in 2020 and 2030 will be the same as those in 2017.
Table 9.
Energy and emission intensities of power generation in 2020 and 2030.
As shown in Table 10, BEVs will generally achieve 6% and 9% emission reduction in 2020 and 2030, compared with 2017. The reduction benefits for PHEVs are lower, which are about 2.75% in 2020 and 3.80% in 2030. Clearly, the GHG emission differences between the BEVs and PHEVs expand to 31.40% (LFP) and 19.79% (NMC) in 2020. In 2030, the attractiveness of BEVs will be more prominent in that the emission reduction benefits of BEVs are expected to be 25.76% (NMC) – 40.00% (LFP) relative to PHEVs. In fact, if the electricity generation moves to a lower-emission intensity, the advantages of BEVs would be more remarkable.
Table 10.
The life cycle energy consumptions and GHG emissions in the 2020 and 2030 scenarios.
Since China demonstrates a large amount of diversity in the electricity profiles, the conclusion may not be valid in all cities. Therefore, the break-even point is calculated to present in which cases BEVs outperform PHEVs in terms of the GHG emissions. Results obtained from break-even point analysis show that GHG emission intensity below 973.80 gCO2-eq/kWh and 815.00 gCO2-eq/kWh would make LFP- and NMC-powered BEVs, respectively, favorable options. According to Bauer et al. (2015) [36], where regional electricity profiles in China are analyzed, north, northeast, east, and northwest have about 900.00 gCO2-eq/kWh GHG emission intensities in 2012 and cities like Beijing are estimated to have over 900.00 gCO2-eq/kWh in 2020. Therefore, it is possible that PHEVs are currently preferable in parts of cities in China.
4.2. Sensitivity Analysis of Driving Distance
The driving distance in this part includes two parts: the lifetime mileage and the all-electric ranges within one charging period. Because EVs have just come onto the market, real world data of lifetime mileage are unavailable. As stated in Table 2, the parameter of lifetime mileage is assumed and thus uncertainty is inevitable. Besides, PHEVs are able to use the battery in electric mode and consume gasoline when the battery charge is depleted [11]. Since the electric mode saves more energy with a lower fuel cost, drivers are often encouraged to use electricity as often as possible within the all-electric range. Therefore, the assumption of the travel distance for single travel and the all-electric range limitation are important parameters for the energy use and GHG emission rate of PHEVs.
4.2.1. Sensitivity Analysis of Lifetime Mileage
In the baseline scenario, the lifetime mileage is assumed to be a certain value and remains the same for BEVs and PHEVs provided that they use the same battery type. To deal with the uncertainty of the lifetime mileage, this parameter is considered as any value within an interval, and the range of life cycle GHG emissions of each vehicle is calculated accordingly. The equation of life cycle GHG emissions is shown as Equation (2).
where relates to BEV-LFP, BEV-NMC, PHEV-LFP and PHEV-NMC; represents the lifetime mileage of each vehicle, with the assumed range of [120,000 km, 160,000 km]; , and represent GHG emissions of each vehicle for the life cycle, vehicle cycle and fuel cycle, respectively.
The calculated ranges of life cycle GHG emissions for each vehicle are shown in Table 11. Since the minimum emissions of PHEVs exceed the maximum values of their counterpart BEVs, it is highly likely that BEVs outperform PHEVs from the life cycle perspective.
Table 11.
The calculated range of life cycle GHG emissions for each vehicle.
4.2.2. Sensitivity Analysis of All-Electric Range
The all-electric ranges for one charging period for our representative vehicles are reported as 300 km, 400 km for BEVs and 80 km, 100 km for PHEVs. Under real-world driving conditions, 80% depth discharge is always applied. Therefore, we assume that 80% of the reported ranges are reached within each driven trip. The UF for PHEVs can be assumed as follows:
where and represent the UF of LFP-powered and NMC-powered PHEVs, respectively; and represent the travel distances for each time.
Since BEVs are only able to use electricity to propel the vehicles, the life cycle energy use and GHG emissions on the basis of per km will not change. Our results show that for LFP-powered vehicles, as long as the driven distance is below the range limitation of BEVs (300 km), the BEV has lower life cycle emissions than the PHEV. For NMC-powered vehicles, when the driven distance is below 80 km, the life cycle GHG emissions is 222.76 g CO2-eq/km for the PHEV, 6.65% less than the life cycle emissions of the BEV. When the driven distance is higher than 80 km but less than 96.34 km, the per-km-based emissions result for the PHEV increases with the distance, but is still below that of the BEV. Therefore, the break-even point for UF(NMC) is 0.83, at the point that the travel distance reaches 96.23 km. Additionally, it is highlighted that PHEVs would be the option when the travel distances exceed the range limitation of BEVs.
4.3. Sensitivity Analysis of the Recycling Process
Although battery recycling activities are still in their infancy and huge uncertainties are related to the recycling techniques, it is widely believed that traction batteries are worthy of recycling and reusing, both from the environmental perspective and the cost-benefit view. Based on previous studies, the NMC batteries, which contain high cobalt and nickel, are expected to be recycled and about 50% energy for the battery’s primary production is reported to be saved. However, the LFP batteries are hardly reused since the lithium metal is relatively abundant and cheap [37,38,39,40,41].
In this sense, we explore whether the consideration of recycling of batteries would considerably change the results. Here, we assume 30% energy saving for NMC batteries in the battery production process and 10% for LFP, as part of lithium, nickel, and aluminum are also recyclable. Considering the battery recycling, the life cycle energy consumption and GHG emissions of four vehicle types are shown in Figure 5:
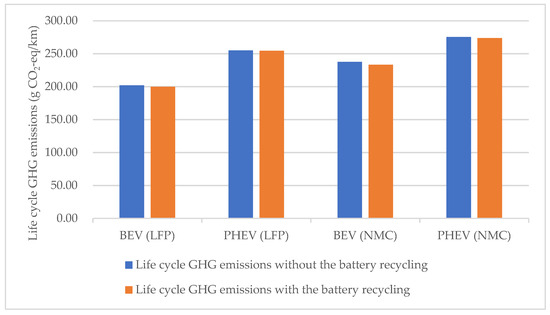
Figure 5.
Life cycle GHG emissions with battery recycling.
Notably, battery recycling offers some environmental benefits to electric vehicles, but such a contribution accounts for little in the life cycle. Since heavier batteries are installed in BEVs, relative to PHEVs, more environmental benefits could be achieved through battery recycling. Therefore, the superiority of BEVs is further confirmed. Besides, although NMC-powered vehicles have greater emission reduction, they are still not able to exceed the LFP-powered ones in terms of GHG emission performance.
In general, sensitivity analyses have been performed concerning future electricity generation pathways (2020 and 2030), lifetime mileage, travel distance and UF, and expended system boundary of the recycling stage. The main conclusions can be summarized as follows:
(1) As long as the emission intensity of the power generation is less than 815.00 g CO2-eq/kWh, BEVs are more competitive than PHEVs for both batteries in terms of GHG emissions.
(2) When the lifetime mileage is within 120,000 km to 160,000 km, which is reasonable for vehicles, BEVs emit less GHG emissions than PHEVs. In terms of the travel distance at each time, LFP-powered BEVs are superior to PHEVs, as long as the distance is below the range limitation, while NMC-powered PHEVs are better if the driven distance during single travel is under 96.23 km; at this point, the UF is 0.83.
(3) The impacts of battery recycling are found to be small from the life cycle perspective.
5. Conclusions
In this work, a comprehensive life cycle analysis is conducted to compare BEVs and PHEVs. This analysis is divided into two parts: fuel cycle and vehicle cycle, performed with two different battery chemistries cases: LFP and NMC, and framed to China. The main conclusions are drawn as follows:
(1) BEVs are currently better choices than PHEVs, in terms of energy consumption and GHG emissions. Specifically, BEVs have 3.04% (NMC) to 9.57% (LFP) energy mitigation benefits and 15.95% (NMC) to 26.32% (LFP) emission reduction benefits compared to PHEVs.
(2) The fuel cycle and vehicle cycle have similar contributions to the life cycle emissions for BEVs while the fuel cycle is the dominant emission stage for PHEVs.
(3) Through sensitivity analyses, the superiority of BEVs is further confirmed as BEVs have lower GHG emissions than PHEVs in the vast majority of cases. In this study, NMC-powered PHEVs might be preferable if the GHG emission intensity is higher than 815.00 g CO2-eq/kWh, or when the driven distance at a single travel is over 96.23 km.
While this study provides a comprehensive life cycle environmental performance comparison, some limitations remain.
(1) Although the selected vehicles are believed to be representative, a larger number of vehicles should be considered to confirm the robustness of the results.
(2) Another source of variability in the results relates to battery lifetime assumptions. Since there is no practical evidence regarding the lifetime of batteries and the uncertainty relates to use patterns, future research should pay more attention to these aspects.
(3) Since GHG emission reduction is the main purpose of developing electric vehicles, other potential environmental impacts are disregarded in this study. If a more comprehensive comparison is desired, other impacts should be included.
Author Contributions
S.X. conceived and designed the work, analyzed the data and prepared the original draft; J.J. mentored the use of the LCA software and reviewed the writing; X.M. supervised all work. Conceptualization, S.X.; Data curation, S.X.; Formal analysis, S.X.; Methodology, J.J.; Software, J.J.; Supervision, J.J. and X.M.; Validation, X.M.; Writing—original draft, S.X.; Writing—review & editing, J.J.
Funding
This research received no external funding.
Acknowledgments
We wish to thank Master Ying Duan for helping us with the GaBi software.
Conflicts of Interest
The authors declare no conflict of interest.
References
- Gov, E. China—Oil and Gas | export.gov. Available online: https://www.export.gov/article?id=China-Oil-and-Gas (accessed on 20 August 2018).
- China, I. Energy Saving and New Energy Automotive Industry Development Plan 2012–2020. Available online: https://www.iea.org/policiesandmeasures/pams/china/name-32249-en.php (accessed on 20 August 2018).
- Ma, H.; Balthasar, F.; Tait, N.; Riera-Palou, X.; Harrison, A. A new comparison between the life cycle greenhouse gas emissions of battery electric vehicles and internal combustion vehicles. Energy Policy 2012, 44, 160–173. [Google Scholar] [CrossRef]
- Noshadravan, A.; Cheah, L.; Roth, R.; Freire, F.; Dias, L. Stochastic comparative assessment of life-cycle greenhouse gas emissions from conventional and electric vehicles. Int. J. Life Cycle Assess. 2015, 20, 854–864. [Google Scholar] [CrossRef]
- Mamalis, C.I.C.K. Environmental and economic effects of widespread introduction of electric vehicles in Greece. Eur. Transp. Res. Rev. 2014, 6, 365–376. [Google Scholar]
- Messagie, M.; Boureima, F.S.; Coosemans, T.; Macharis, C.; Mierlo, J.V. A Range-Based Vehicle Life Cycle Assessment Incorporating Variability in the Environmental Assessment of Different Vehicle Technologies and Fuels. Energies 2014, 7, 1467–1482. [Google Scholar] [CrossRef]
- Hao, H.; Qiao, Q.; Liu, Z.; Zhao, F. Impact of recycling on energy consumption and greenhouse gas emissions from electric vehicle production: The China 2025 case. Resour. Conserv. Recycl. 2017, 122, 114–125. [Google Scholar] [CrossRef]
- Peng, T.; Ou, X.; Yan, X. Development and application of an electric vehicles life-cycle energy consumption and greenhouse gas emissions analysis model. Chem. Eng. Res. Des. 2018, 131, 699–708. [Google Scholar] [CrossRef]
- Qiao, Q.; Zhao, F.; Liu, Z.; Jiang, S.; Hao, H. Cradle-to-gate greenhouse gas emissions of battery electric and internal combustion engine vehicles in China. Appl. Energy 2017, 204, 1399–1411. [Google Scholar] [CrossRef]
- Ke, W.; Zhang, S.; He, X.; Wu, Y.; Hao, J. Well-to-wheels energy consumption and emissions of electric vehicles: Mid-term implications from real-world features and air pollution control progress. Appl. Energy 2017, 188, 367–377. [Google Scholar] [CrossRef]
- Onat, N.C.; Kucukvar, M.; Tatari, O. Conventional, hybrid, plug-in hybrid or electric vehicles? State-based comparative carbon and energy footprint analysis in the United States. Appl. Energy 2015, 150, 36–49. [Google Scholar] [CrossRef]
- Casals, L.C.; Martinez-Laserna, E.; García, B.A.; Nieto, N. Sustainability analysis of the electric vehicle use in Europe for CO2 emissions reduction. J. Clean. Prod. 2016, 127, 425–437. [Google Scholar] [CrossRef]
- ISO. ISO 14040: Environmental Management—Life Cycle Assessment—Requirements and Guidelines; International Organization for Standardization: Geneva, Switzerland, 2006. [Google Scholar]
- BYD BYD Europe | BYD Official Web Site. Available online: http://www.bydeurope.com/ (accessed on 26 August 2018).
- Li, X.; Ou, X.; Zhang, X.; Zhang, Q.; Zhang, X. Life-cycle fossil energy consumption and greenhouse gas emission intensity of dominant secondary energy pathways of China in 2010. Energy 2013, 50, 15–23. [Google Scholar] [CrossRef]
- Ou, X.; Yan, X.; Zhang, X. Life-cycle energy consumption and greenhouse gas emissions for electricity generation and supply in China. Appl. Energy 2011, 88, 289–297. [Google Scholar] [CrossRef]
- Xiaoxiongyouhao. Fuel Consumption Calculator_Actual Fuel Consumption Data and Statistical Reports. Available online: https://www.xiaoxiongyouhao.com/ (accessed on 26 August 2018).
- Hou, C.; Wang, H.; Ouyang, M. Survey of daily vehicle travel distance and impact factors in Beijing. IFAC Proc. Vol. 2013, 46, 35–40. [Google Scholar] [CrossRef]
- Semmens, J.; Bras, B.; Guldberg, T. Vehicle manufacturing water use and consumption: An analysis based on data in automotive manufacturers’ sustainability reports. Int. J. Life Cycle Assess. 2014, 19, 246–256. [Google Scholar] [CrossRef]
- Peters, J.F.; Baumann, M.; Zimmermann, B.; Braun, J.; Weil, M. The environmental impact of Li-Ion batteries and the role of key parameters—A review. Renew. Sustain. Energy Rev. 2017, 67, 491–506. [Google Scholar] [CrossRef]
- Peters, J.F.; Weil, M. Providing a common base for life cycle assessments of Li-Ion batteries. J. Clean. Prod. 2018, 171, 704–713. [Google Scholar] [CrossRef]
- Majeau-Bettez, G.; Hawkins, T.R.; Str Mman, A.H. Life cycle environmental assessment of lithium-ion and nickel metal hydride batteries for plug-in hybrid and battery electric vehicles. Environ. Sci. Technol. 2011, 45, 4548–4554. [Google Scholar] [CrossRef] [PubMed]
- GaBi. Life Cycle Assessment LCA Software: GaBi Software. Available online: http://www.gabi-software.com/america/index/ (accessed on 4 July 2018).
- Sullivan, J.L.; Gaines, L. A Review of Battery Life-Cycle Analysis: State of Knowledge and Critical Needs; Argonne National Laboratory: Argonne, IL, USA, 2010. [Google Scholar]
- Mayyas, A.; Qattawi, A.; Omar, M.; Shan, D. Design for sustainability in automotive industry: A comprehensive review. Renew. Sustain. Energy Rev. 2012, 16, 1845–1862. [Google Scholar] [CrossRef]
- Rydh, C.J.; Sandén, B.A. Energy analysis of batteries in photovoltaic systems. Part I: Performance and energy requirements. Energy Convers. Manag. 2005, 46, 1957–1979. [Google Scholar] [CrossRef]
- Mayyas, A.; Omar, M.; Hayajneh, M.; Mayyas, A.R. Vehicle’s lightweight design vs. electrification from life cycle assessment perspective. J. Clean. Prod. 2017, 167, 687–701. [Google Scholar] [CrossRef]
- Sullivan, J.L.; Burnham, A.; Wang, M. Energy-Consumption and Carbon-Emission Analysis of Vehicle and Component Manufacturing; Center for Transportation Research, Energy Systems Division, Argonne National Laboratory: Chicago, IL, USA, 2010. [Google Scholar]
- Papasavva, S.; Kia, S.; Claya, J.; Gunther, R. Life cycle environmental assessment of paint processes. J. Coat. Technol. 2002, 74, 65–76. [Google Scholar] [CrossRef]
- Hawkins, T.R.; Singh, B.; Majeau-Bettez, G.; Mman, A.S. Comparative Environmental Life Cycle Assessment of Conventional and Electric Vehicles. J. Ind. Ecol. 2012, 17, 53–64. [Google Scholar] [CrossRef]
- Aguirre, K.; Eisenhardt, L.; Lim, C.; Nelson, B.; Norring, A.; Slowik, P.; Tu, N. Life cycle Analysis Comparison of a Battery Electric Vehicle and a Conventional Gasoline Vehicle; California Air Resource Board: Sacramento, CA, USA, 2012. [Google Scholar]
- Amarakoon, S.; Smith, J.; Segal, B. Application of Life-Cycle Assessment to Nanoscale Technology: Lithium-Ion Batteries for Electric Vehicles; US Environmental Protection Agency: Washington, DC, USA, 2013.
- De Kleine, R.D.; Keoleian, G.A.; Miller, S.A.; Burnham, A.; Sullivan, J.L. Impact of Updated Material Production Data in the GREET Life Cycle Model. J. Ind. Ecol. 2014, 18, 356–365. [Google Scholar] [CrossRef]
- Ruan, R.; Zhong, S.; Wang, D. Life cycle assessment of copper extraction from biological and pyrometallurgical processes. Multipurp. Util. Miner. Resour. 2010, 39, 33–37. [Google Scholar]
- Liu, F.; Zhao, F.; Liu, Z.; Hao, H. China’s Electric Vehicle Deployment: Energy and Greenhouse Gas Emission Impacts. Energies 2018, 11, 3353. [Google Scholar] [CrossRef]
- Bauer, C.; Hofer, J.; Althaus, H.; Del Duce, A.; Simons, A. The environmental performance of current and future passenger vehicles: Life cycle assessment based on a novel scenario analysis framework. Appl. Energy 2015, 157, 871–883. [Google Scholar] [CrossRef]
- Dunn, J.B.; Gaines, L.; Sullivan, J.; Wang, M.Q. Impact of Recycling on Cradle-to-Gate Energy Consumption and Greenhouse Gas Emissions of Automotive Lithium-Ion Batteries. Environ. Sci. Technol. 2012, 46, 12704–12710. [Google Scholar] [CrossRef] [PubMed]
- Dewulf, J.; Van der Vorst, G.; Denturck, K.; Van Langenhove, H.; Ghyoot, W.; Tytgat, J.; Vandeputte, K. Recycling rechargeable lithium ion batteries: Critical analysis of natural resource savings. Resour. Conserv. Recycl. 2010, 54, 229–234. [Google Scholar] [CrossRef]
- Simon, B.; Weil, M. Analysis of materials and energy flows of different lithium ion traction batteries. Revue de Métallurgie 2013, 110, 65–76. [Google Scholar] [CrossRef]
- Fisher, K.; Wallén, E.; Laenen, P.P.; Collins, M. Battery Waste Management Life Cycle Assessment; Environmental Resources Management (ERM): Oxford, UK, 2006. [Google Scholar]
- Gaines, L.; Sullivan, J.; Burnham, A.; Belharouak, I. Life-Cycle Analysis for Lithium-Ion Battery Production and Recycling. In Proceedings of the Transportation Research Board 90th Annual Meeting, Washington, DC, USA, 23–27 January 2011. [Google Scholar]
© 2019 by the authors. Licensee MDPI, Basel, Switzerland. This article is an open access article distributed under the terms and conditions of the Creative Commons Attribution (CC BY) license (http://creativecommons.org/licenses/by/4.0/).