1. Introduction
Seaports are major energy consumers. The demand for energy in ports is currently covered using a variety of sources, depending on the type of consumer. For example, the existing yard machinery, involved in the handling of goods passing through the port terminals, generally uses fossil fuels such as diesel; while the remaining port consumers are mostly powered by electricity supplied by the distribution company. Energy demand at ports comes mainly from goods and passenger terminals and these terminals, especially those dedicated to the handling of containers, use a great deal of electrical machinery (ship-to-shore cranes, refrigerated container connections, etc.). However, energy demand also occurs in other places, such as the common areas of the ports (roads, public docks, and so on).
The trend in ports is towards an increasing level of automation and electrification of container terminals, which will bring a corresponding increase in energy demand in the coming years. Spanish port authorities, as promoters of policies aimed at reducing the impact of port activities on the environment, are encouraging the implementation of low carbon technologies. These initiatives include the generation of renewable energies, and, of course, energy sources of a marine origin are perfect candidates for generation in ports due to the fact that the ports are located in the interface of land and sea and sometimes with depths above 20 m.
On the other hand, the proximity of ports to cities is a nuisance when ships come to dock due to acoustic and atmospheric pollution. Ships in port will soon be required to connect to the electrical current provided by the grid (called on shore power supply (OPS), alternative maritime power (AMPS), or cold ironing, among other denominations). This technology is already implemented in several ports worldwide, including: Melilla (Spain), Livorno (Italy), Gothenburg (Sweden), Rotterdam (Holland) and Hamburg (Germany). The implementation of OPS technology will lead to a large increase in port energy demand. According to the data published in the 2016 Greenhouse Gas Verification (GHG) Report of the Port of Valencia, energy consumption associated with auxiliary engines, generally fueled by diesel oil from ships in port, accounts for 37% (156 GWh) of the total energy consumption of the site (the total energy consumption was, according to data given by Port Authority of Valencia, 425 GWh, and includes electricity and fuel consumed at the port) [
1].
According to the report published in October 2016 by the Spanish Ports State Agency (from now on, Puertos del Estado) entitled: ‘Measures for the provision of electrical supply to ships in the ports of general interest’ [
2], the potential demand from the Spanish port system is around 52 GWh per year.
Currently, few ports in the Spanish system can meet the potential energy demand that will be required in the short term, mainly due to a lack of capacity, and so it is necessary to explore alternative sources of generation that guarantee autonomy and feasibility through self-supply.
The European Commission communication ‘Clean Power for Transport: European Strategy on Alternative Fuels’, COM (2013) [
3] is promoting the use of low-carbon energy and the switching to cleaner generation sources, this enhances the importance of generation from renewable sources.
Recently last year, the European Commission, the Parliament and the Council reached a political agreement which includes a binding renewable energy target for the EU for 2030 of 32%, with a clause for an upwards revision by 2023. This agreement will be translated by issuing support schemes for renewable energies, that, as in the past for wind and solar energies, it will bring a lot of funding expectations for other sources such as wave energy. These support schemes will be essential for the development of these technologies in the coming years.
Ports have an essential role in maritime logistic chains as they are the places where the cargoes are handled. Considering the forecast of traffic increase within the next few years, one should research alternative energy sources to feed both the cargo handling machinery and the vessels. However, as previously stated, these energy sources cannot be based on oil nor coal or any other dirty source but renewable energy sources or so called “clean” energies. Therefore, the marine environment is one of the most promising sources of renewable energy for seaports.
Looking at renewable energies, there are some potential candidates whose technology is mature enough in the market, but there are others which require further research due to their available energy resource. Wave energy from the sea is considered as a strong candidate to meet part of the energy needs in ports. The location of ports is ideal for the use of this type of energy because less infrastructure is needed when energy is consumed near to where it is generated.
In
Section 2 of this paper, a review is made of the different types of marine energy resources regarding their potential use in seaports. Several wave energy-generating devices that have recently been tested in marine environments have been considered. We highlight the solutions that are most suitable for the use in or near ports and compare the energy performance of these wave energy-generating devices. In
Section 3, energy demand in port facilities is shown in detail, considering specifically, the Port of Valencia in Spain. We present data on energy resources available on the Spanish coast and evaluate wave energy converters appropriate for the Port of Valencia. Finally, the proposed solution is discussed and some conclusions regarding wave energy converters integration in seaports are presented.
2. Marine Energy Converters for Seaports
2.1. Marine Energy Resources
The sea is a source from which we can obtain different types of energy (tidal power, current power from marine currents, wave power and ocean thermal energy). The potential of some of these energy sources is shown in
Table 1.
The following is a short description of the most common marine energy resources. We discuss these resources and their suitability for seaport energy exploration. Included in this discussion is offshore wind power although not considered purely as marine energy.
2.1.1. Offshore Wind Power
Large scale wind energy production is discarded for ports, since installation, operation, and maintenance are only justified when scaled up in offshore wind farms [
5]. Some wind turbines can be integrated into the port facilities, but installation of a wind farm requires an amount of space that is not usually available in main ports. Offshore generating devices provide greater generating capacity, but involve higher installation, operation, and maintenance costs. In addition, they present disadvantages if they are installed in areas of dense maritime traffic.
2.1.2. Ocean Thermal Energy Conversion (OTEC)
The electricity is produced using the temperature difference between deep cold ocean water and warm tropical surface waters. OTEC plants pump large quantities of deep cold seawater and surface seawater to run a power cycle and produce electricity. Recently, higher electricity costs, increased concerns for global warming, and a political commitment to energy security have made initial OTEC commercialization economically attractive in tropical island communities where a high percentage of electricity production is oil based [
6]. However, large-scale production by using this technology is only suitable offshore.
2.1.3. Marine Current Energy
This consists of taking advantage of the kinetic energy of marine currents. This energy is captured through energy converters like wind turbines, although under water [
7]. However, its application to ports is very limited, because submarine currents near ports are not in general strong enough to run turbines.
2.1.4. Tidal Energy
Tidal energy involves taking advantage of the tides produced by the gravitational action of the sun and moon. It is only feasible in areas with enough difference between high and low tide. It is based on the storage of water in a reservoir with gates that allow the entrance of water for electric generation [
8]. The plants built with this technology need a lot of space to store water, and this space is not generally available in most ports, so its use in ports is inappropriate.
2.1.5. Wave Energy
Wave energy is the use of the movement produced by waves. Wave energy conversion uses both potential and kinetic energy transmitted by the waves. It is a source of renewable energy that depends on the friction between the air and the surface of the sea. The technology to extract energy from the waves is under development and has not yet reached full potential [
9].
According to the World Energy Council [
10], there is a potential of about 32,000 TWh per year, considering all areas with energy density from waves greater than 5 kW/m. Besides, a potential of 1300 TWh/year is estimated for Mediterranean Sea and Atlantic Archipelagos (Azores, Cape Verde, Canaries) [
10].
There are multiple devices that have already been tested in near shore facilities, however, at this stage, none of them have produced sustainable outcomes. Therefore, it is required further and extensive research and development considering the available energy potential is promising, particularly for use in ports [
11,
12,
13].
Among the wave power converters, the so-called shoreline devices, deserve special attention. Due to the possibility of coupling these to existing infrastructures in ports, with the consequent savings in deep water anchoring and long-distance wiring. This approach brings advantages for operation and maintenance costs when compared with installations far from the coast. Taking these considerations into account in the following section we review several wave energy converters.
2.2. Marine Wave Energy Converters (WEC) for Seaports
Wave power generation devices can be classified according to the technology used [
14,
15,
16] in Overtopping Devices (OTDs), Wave-activated Bodies (WABs) and Oscillating Water Column (OWC). In the next sections, we focus on those converters, currently being tested and whose characteristics make them most suitable for ports.
2.2.1. Devices that Use the Overtopping Principle
Overtopping Devices (OTDs) have a reservoir that is filled with water from waves running up a slope located at a higher level than the surrounding sea. The energy of water flowing back to the sea is used to power a hydraulic turbine.
One well known OTD is the Sea-wave slot-cone generator (SSG) [
17] (
Figure 1). The SSG employs several reservoirs placed one on top of the other, in which the energy of the waves is stored as potential energy. Accumulated water circulates through turbines to produce electricity. The system operates under a wide spectrum of wave conditions, and a high overall efficiency could be achieved. It can be installed along the coast, or on breakwaters, with the consequent advantages for maintenance, control, and use of the generated energy. The pilot plant for this system in Swakpmond (Norway) with a wave resource of 12 kW/m is estimated to generate 18,000 kWh/year/m.
Another OTD WEC is the Overtopping Breakwater for wave Energy Conversion (OBREC) [
18,
19]. The OBREC is integrated in a traditional breakwater and can be considered an innovative non-conventional breakwater (
Figure 2). It fulfills the same functions as traditional breakwaters with the added value of power generation. This system was installed in the Port of Naples in 2015 and its working principle is based on the results of the SSG system previously described [
20]. It is the first overtopping WEC totally integrated into an existing breakwater. As the monitoring has just begun, no definitive power matrix is available [
19].
The device was developed by a research team of the University of Campania and consists of a concrete structure with a flat front ramp, and a reservoir located immediately behind, with the bottom located above sea level. This technology captures part of the wave run-up on the slope of the device. The potential energy of the stored water in the reservoir is converted into kinetic energy, flowing through low head turbines located in an engine room behind the reservoir. The energy is thus converted into electrical energy by means of generators coupled to turbines.
According to estimates [
22], with the installation of the OBREC device along 500 m of breakwater in Chile, over 2500 MWh of the expected annual average electricity consumption could be provided. Another assessment for Madagascar [
23], considering a breakwater of 500 m, estimated a total power of 115.5 kW, corresponding up to about 1010 MWh/year.
2.2.2. Devices Working under the Oscillating Bodies Principle
Wave-activated bodies (WABs) obtain the energy from a floating body which is driven by means of a wave interaction effect. The arrangement of a WAB involves partial-floating conditions and the device is placed parallel to the predominant wave direction. This phenomenon is repeated as wave propagates through the WAB body. The effect of the body movement allows the extraction from kinetic energy to electricity using hydraulic or mechanical transmission.
An example of WAB device is the Eco Wave System [
24]. This system draws energy from wave power throughout uniquely shaped floaters, which rise and fall with the up and down motion, lifting force, change of water level, hydraulic air lock, and incident flux of waves. The floaters are attached by robust arms to any type of structure, such as (but not limited to) breakwaters, jetties, piers, poles, and floating and fixed platforms. The motion of the floaters, is transmitted to a shore located power station, which converts the energy from this motion into fluid pressure, which spins a generator, producing electricity. There are two variants of this system, the ‘Wave Clapper’ and the ‘Power Wing’ (
Figure 3).
The first wave tank tests of this WEC type were completed in December 2011 at the Institute of Hydraulic Mechanics in Kiev. In April 2012, the first power plant (10 kW) operating under real conditions was installed on two breakwaters in the Black Sea to collect data and perform voltage tests. The system operated in different wave regimes for 18 months and was then shipped to Israel and installed in the Port of Jaffa, where it has been operational to this day.
A wave power plant based on this technology was inaugurated in May 2016 at a former wharf in Gibraltar with a maximum power of 5 MW. It is estimated that this plant will provide Gibraltar with 15% of its total electricity consumption, in line to meet the EU directive requiring 20% renewable energy by 2020.
Another WAB device is the Seahorse system [
25]. The Port of Pecem, Brazil, began the commissioning of a wave power plant with an installed power of 50 kW in June 2012. The initiative promoted by the Alberto Luiz Coimbra Institute for Engineering and Research (Coppe), linked to the Federal University of Rio de Janeiro, was named Seahorse in its first version. It was composed of two large mechanical arms fixed to the pier of the port. At the end of these arms and in contact with the sea water, were circular buoys (
Figure 4).
With the movement of the waves the structure moves up and down, driving hydraulic pumps, which makes the fresh water contained in a closed circuit (in which there is no exchange with the environment), circulate in a high-pressure network. The high-pressure water is directed to a two-stage accumulator, that has compressed water and air in a hyperbaric chamber. Which is the device’s lung. Its task is to provide pressurized water to a Pelton turbine coupled to an electric generator.
The Wavestar WEC [
26] draws power with floats that rise and fall with the upward and downward movement of the waves. The floats are connected by arms to a platform that is secured to the seabed. The movement of the floats is transferred through hydraulics to the rotation of a generator, producing electricity. The waves run the length of the machine, raising 20 floats in turn. Driving the engine and the generator in this way enables continuous production of energy and smooth output. As can be seen in
Figure 5 below, the structure of the system can be easily integrated with the port structure. It is not an onshore system in the strict sense, but can be considered more like a nearshore system.
2.2.3. Oscillating Water Column Systems
Oscillating water column (OWC) devices use the oscillatory motion of a mass of water induced by a wave in a chamber to compress air to drive an air turbine. The water column thus acts as a piston on the air volume, pushing it through the turbine as the waves increase the water level in the chamber, and drawing it as the water level decreases [
27].
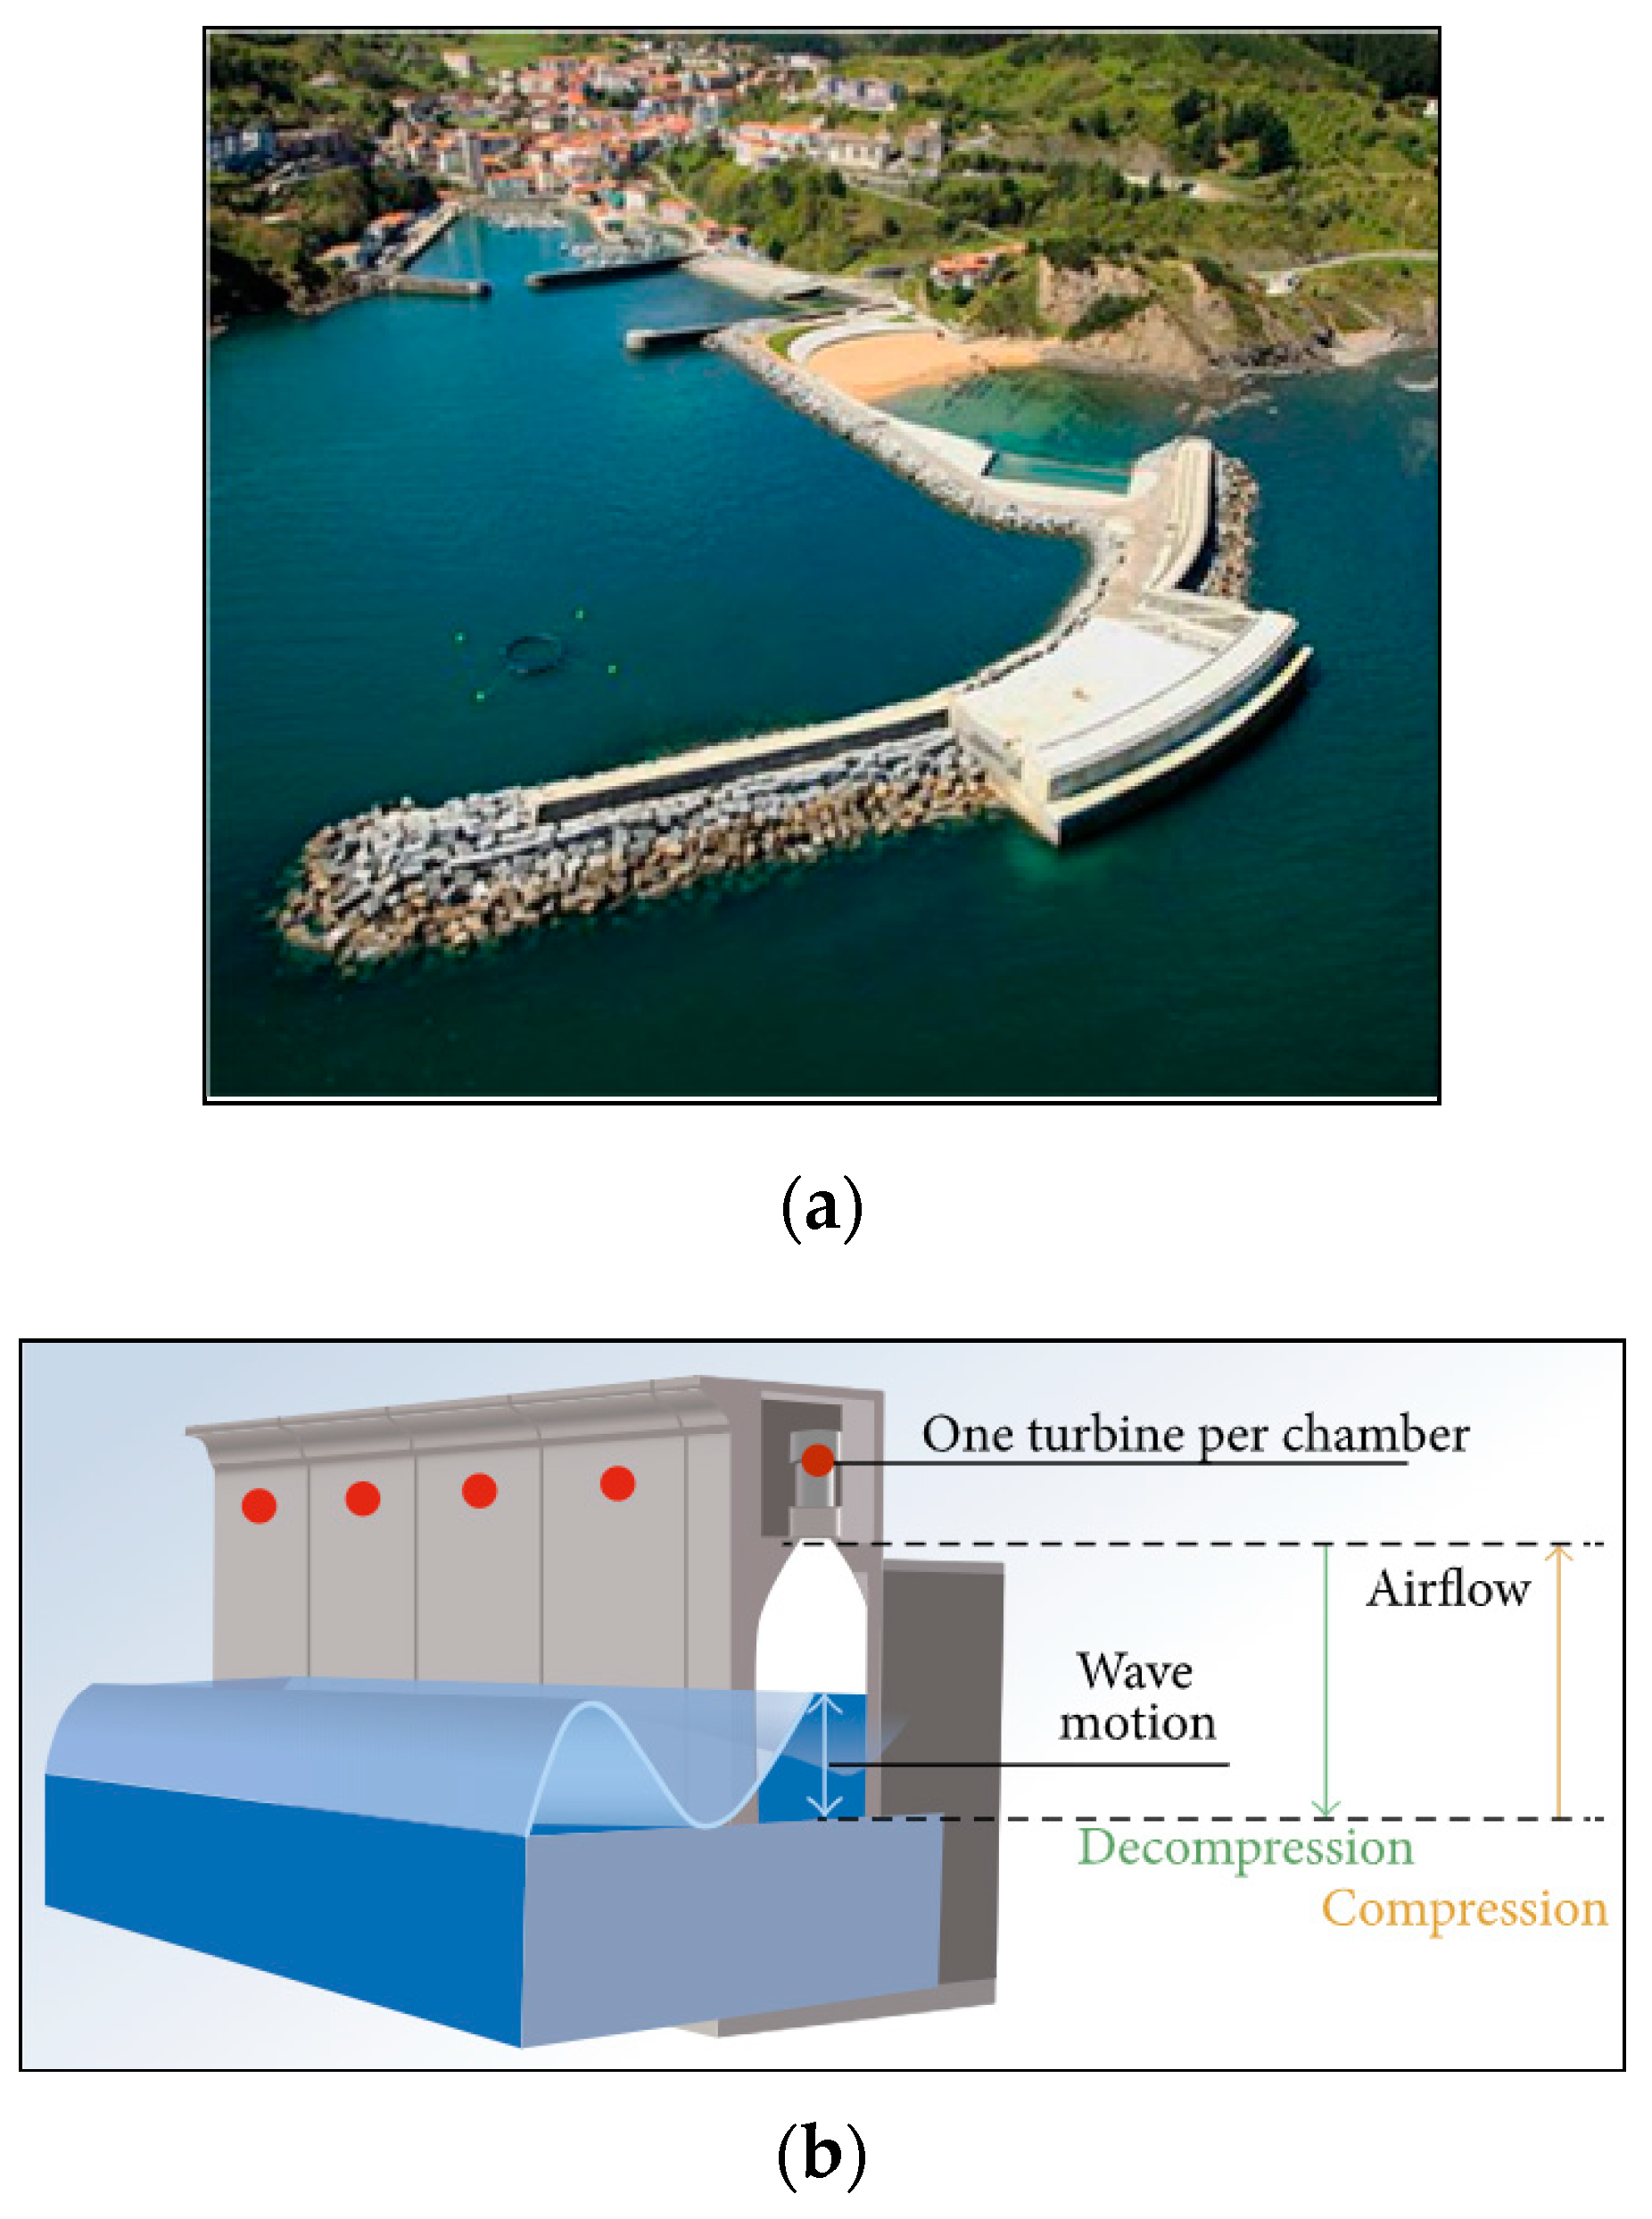
A well-known OWC system is the Mutriku power plant in Spain. The converter is 100 meters long and composed of 16 capture chambers—each of which has in the upper hole, a turbo-generator group with 18.5 KW of nominal power, producing a total power of 296 kW [
28]. When built, it was the first installation of its kind in Europe (
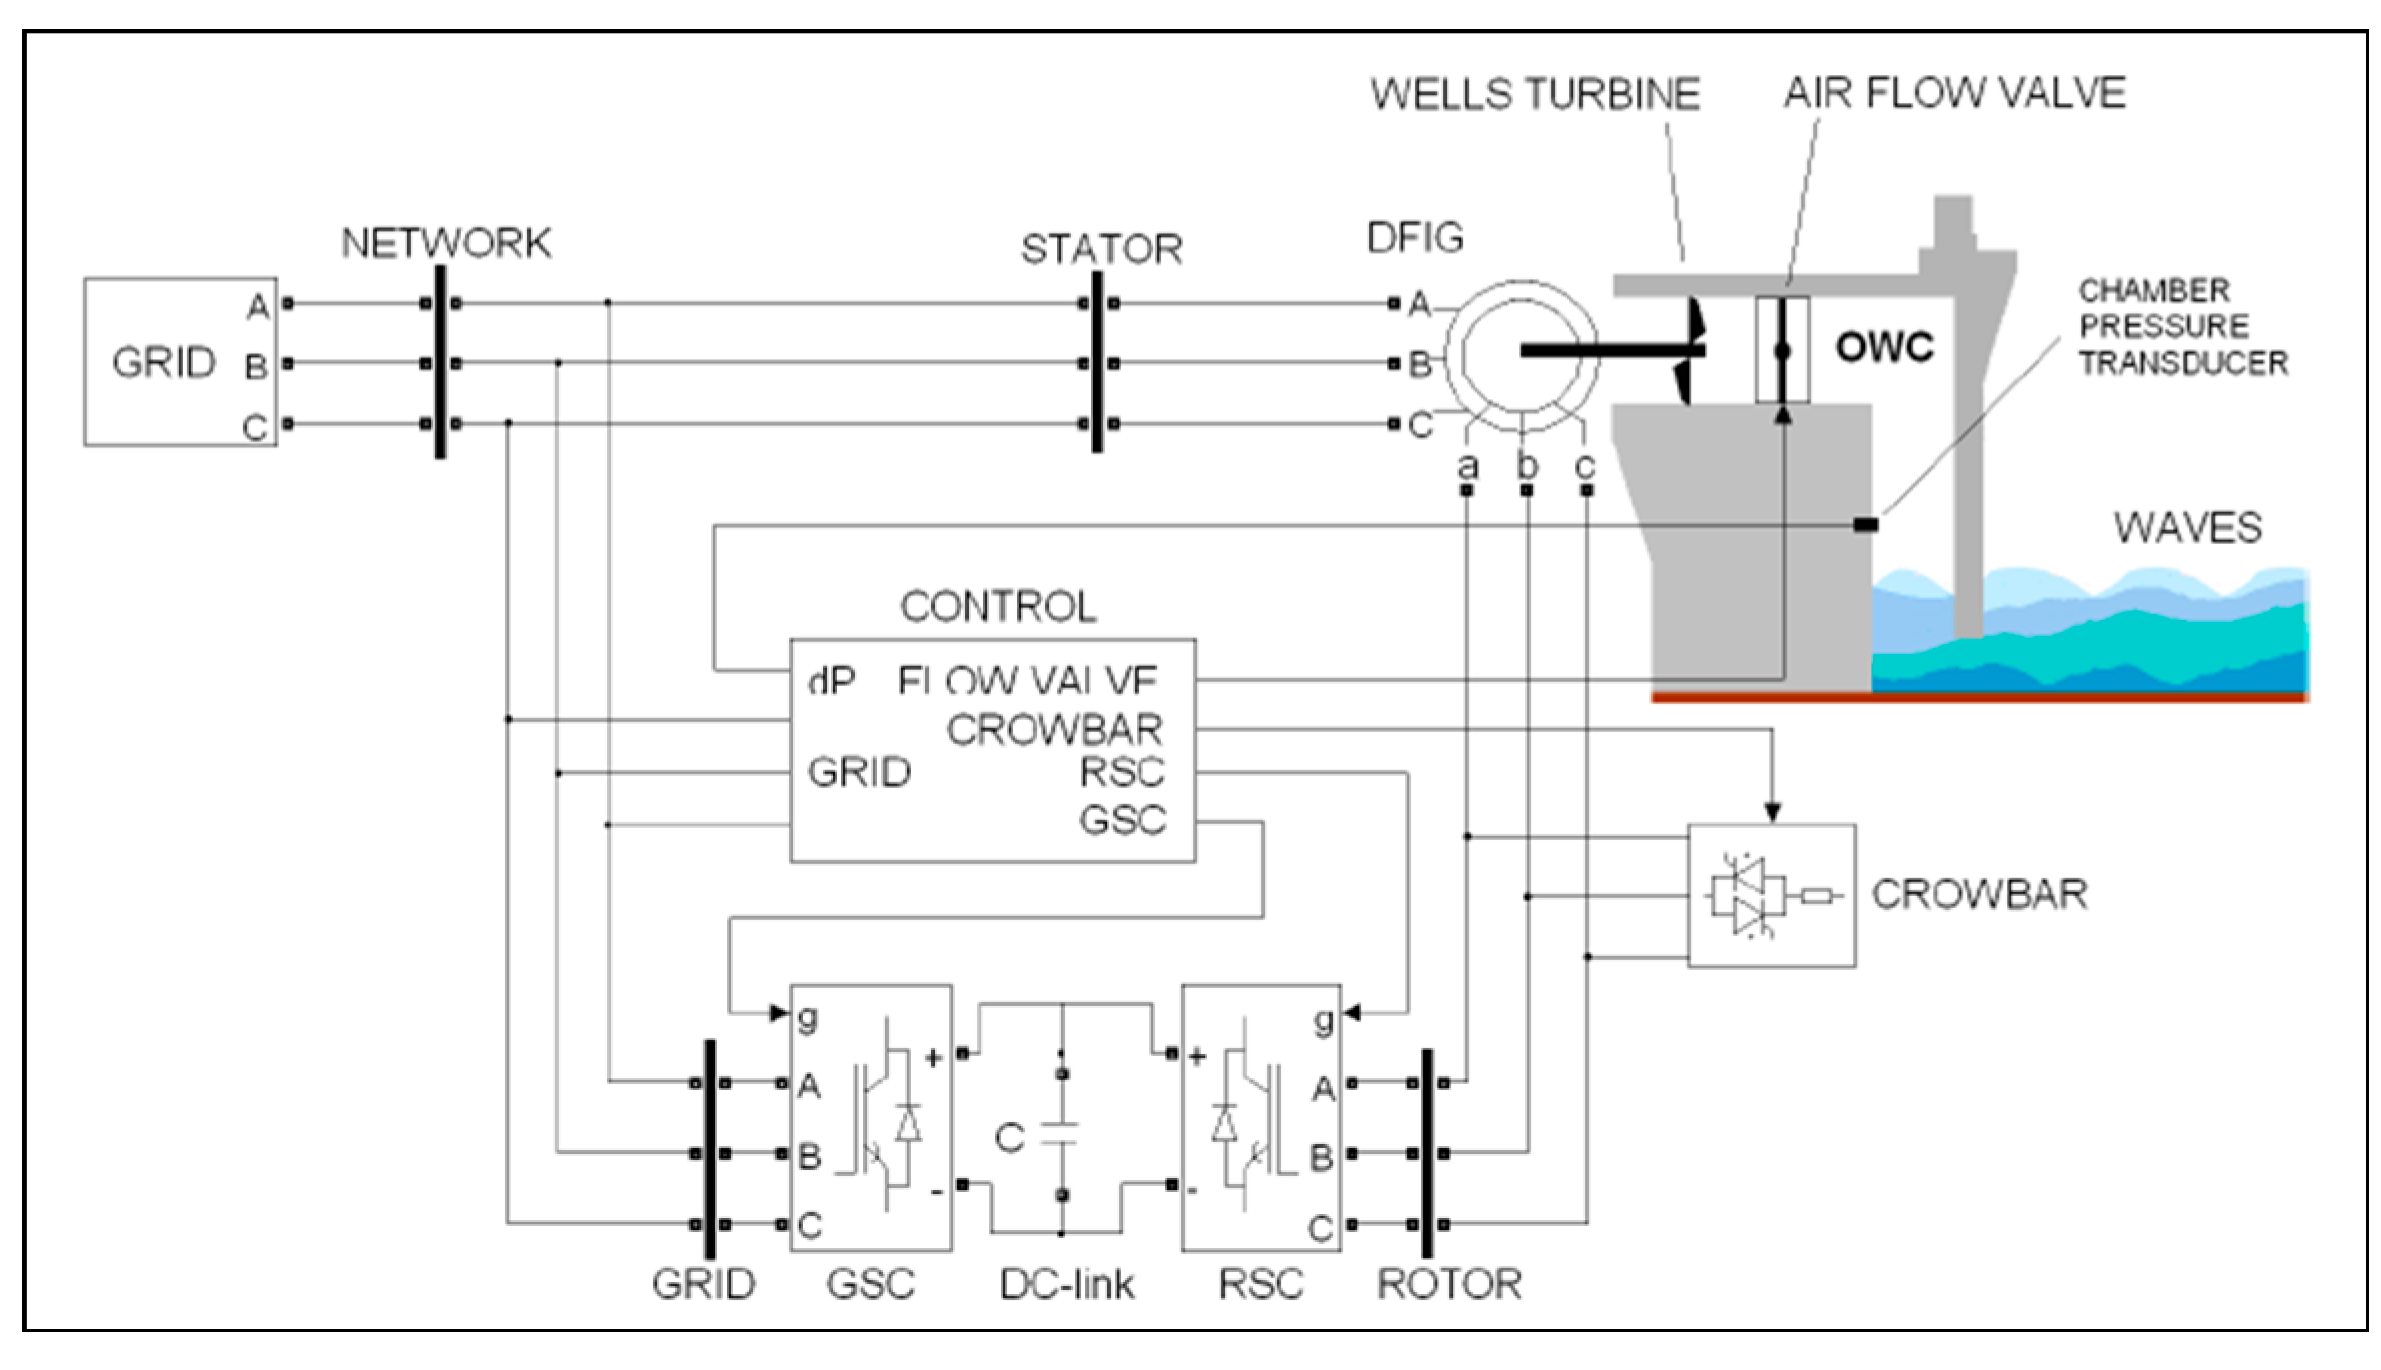
Figure 6). The installation uses fixed-pitch Wells turbines, which give it simplicity and robustness. The turbo-generator unit, installed vertically, has a butterfly valve at its bottom to isolate the chamber if necessary. The dimensions of the turbine (2.83 m high and 1.25 m wide) and its weight of approximately 1200 kg, simplify assembly and disassembly operations. In the electrical configuration of the plant, the 16 turbines are separated, for better control, into two groups of eight. As indicated in [
29], each turbine is controlled by considering the pressure inside the chamber, in order to set the speed of rotation and optimize the extracted power (
Figure 7).
LIMPET power plant in Islay Island (UK) is another OWC system (
Figure 8). This system uses the energy of the waves indirectly through the oscillations inside an onshore chamber connected to the sea [
31]. When the water level in this chamber rises with the incoming wave, the air inside the chamber is expelled through a turbine, and when the level falls again, the air is drawn through. But even if the direction of the air flow changes, the turbine always drives the generator in the same direction—thanks to the design of the Wells turbine. This system is ideal for installation in dykes and breakwaters to maximize synergies, since construction costs can be shared between the port operator and the plant manager. In almost all cases, the commissioning and maintenance can be carried out entirely on land, without incurring costs for the use of marine infrastructures or boats. The shore to grid connection to this system is simple and inexpensive, and its environmental impact is minimal or none. The nominal power of this installation is 2 × 250 kW.
The Pico OWC system consists of a concrete reinforced hollow structure—a chamber—above the water surface that communicates with the sea and the incident waves through a submerged opening on the front wall, and communicates with the outside through a fiber duct with an air turbine [
33]. Incident waves cause a vertical oscillation of the water column inside the chamber, which in turn causes a flow of air to and from the outside, driving the attached turbine and generator. An important factor in the design of these plants is that the pneumatic chamber must be correctly sized to resonate with the incident sea state [
34]. This system was implemented in Pico Island (Azores) to demonstrate that this type of plant may be of interest in remote sites, such as islands [
34]. The plant is designed to accommodate two turbine ducts of the same caliber (suitable for test equipment between 100 kW and 700 kW), although only one of these ducts has been used, and equivalent to half of the space available in the plant.
The Resonant Wave Energy Converter (REWEC3) is a system that has been installed in the Port of Civitavecchia’s breakwater as part of the REWEC3 project [
35]. Like the others OWC-based system, it consists of a chamber with water in the lower part, and air in the upper part, and the waves cause air to flow through a turbine connected to a generator. The particularity of this system is the existence of a U-shaped conduit prior to the oscillating water column chamber, aiming to cause a better generation performance. Recent work has demonstrated that resonance with the incident waves occurs without the need for phase control systems, so power generation can be improved if the design of the configuration is appropriate [
35]. During the year 2016, tests of this system were carried out along 100 m of the external dock in the Port of Civitavecchia – resulting in an average generation of 500 MWh/year. The masterplan for the Port of Civitavecchia contemplates that by 2020, some 20% of its energy needs (4 GWh/year) will be met by this system.
The Yongsoo plant is a recently completed bottom-standing OWC plant, approximately 1 km away from the south coast of Jeju Island, Republic of Korea (
Figure 9). Two horizontal-axis impulse turbines connect to a synchronous generator (250 kW, 150–400 rpm) and an induction generator (250 kW, 450 rpm), respectively. The total nominal rated power of Yongsoo plant is 500 kW. The plant is 37 m long and 31.2 m wide [
36].
2.3. Comparison and Selection Criteria of Wave Energy Converters for Seaports
The systems usually studied for obtaining energy from waves can be classified into onshore and offshore generating devices, considering whether the generating device is installed near, or off shore. However, both types have advantages and disadvantages. We could use wind power plants in order to obtain the differences of operating and maintenance (O&M) costs in both cases, onshore and offshore, then we could have an approach on what should be considered when designing those plants for wave generators. The O&M cost of a wind power plant is between 8% and 30% for offshore installations, while for onshore installations it is between 4% and 10%. In addition, ground connection costs are 15%–30% for offshore installations, and 9%–14% of the total cost for onshore installations [
37].
Onshore devices have the advantage of being close to the point of consumption, therefore the maintenance operations could be carried out quicker and cheaper. They also have few energy losses from the generator to the consumer. However, a disadvantage is that the waves lose power as they travel through shallow water. Among these types of devices are the oscillating water column, and some overtopping and oscillating floats such as the Eco Wave and the Seahorse.
Near-shore devices operate in relatively shallow waters. They are often attached to the seabed, which gives a suitable stationary base against which a swinging body can operate. Like shoreline devices, they have the disadvantage that shallow water leads to waves with reduced power, limiting the generation potential. Among these devices, we have mentioned the Wavestar.
OWC WECs can be divided into shoreline devices (like Pico and LIMPET) and breakwater devices (like Mutriku and Civitavecchia). The shoreline devices either require rocky cliffs (like LIMPET in Islay island) or a rocky gully (like in Pico island) to be able to construct the WEC structure.
OTDs or OWCs are in general more easily integrated into breakwaters than WABs, which require dedicated floating space.
Table 2 shows a comparison of some of the devices suitable for use in ports in terms of depth and mean wave power.
For the selection of the best WEC for a particular seaport the following factors should be considered:
- (1)
Energy requirements: It is essential to define the port energy requirements, present and future. It is also necessary to consider who will be the final consumers of the generated energy, in order to design the best energy supply system to cover the consumers’ needs.
- (2)
Local wave energy resources: Depending on the location of the seaport different wave energy resources will be available. This fact will condition the most convenient WEC technology.
- (3)
Port location, dimensions and layout: Port location will condition the WEC selection. An urban seaport or an isolated port will allow for different solutions. Port layout will as well condition the possible options. A natural port surrounded by rocky cliffs or an artificial port surrounded by breakwaters will favor different WEC technologies. Average ship transit, available space or port expansion plans will also condition the best WEC option.
- (4)
Environmental requirements: It must be considered if the plant will be kept isolated or in an urban/industrial environment. The WEC plant should fulfil some environmental requirements, which will be different depending on the location. A plant located close to an urban area will have stricter visual and acoustic environmental restrictions than those located on an isolated area.
- (5)
Installation and maintenance costs: It is essential to evaluate, among others, the plant installation cost. It will not be the same to build a new structure on an existing breakwater than building it mounted on a new breakwater.
These criteria will be followed by the pure technical criteria for the design and election of the most suitable WEC solution in every case.
3. Evaluation of Wave Energy Converters for the Port of Valencia
3.1. Energy Demand in the Port of Valencia
The Port of Valencia is one of the biggest ports in the Mediterranean. There has been a general increase in the volume of goods handled at the Port of Valencia (
Table 3), which is in line with trends at national and international levels.
As a consequence, electrical energy demand in the Port of Valencia has been steadily increasing in the past decade as shown in
Table 4.
The port container terminals are the main consumers of electrical power in ports, and for this reason, many projects and studies have been developed to identify and optimize these consumptions. Using the methodology established in the Climeport project [
39] the most important energy consumption in ports can be classified in four different levels:
- ○
Level 1: The port as a whole
- ○
Level 2: Type of activities
- ○
Level 3: Services and processes
- ○
Level 4: Equipment, where the above sections are broken down in detail.
Considering level 2 of this classification, the following activities account for the most important electrical consumption in a seaport:
- (1)
Business oriented activities (managed by the port operators)
- (a)
Passenger Terminals
- (b)
Cargo Terminals
- (c)
Other services (warehousing, repairs, logistics…)
- (2)
Service oriented activities (managed by the Port Authority)
- (a)
Infrastructures
- (b)
Port services
- (c)
Administrative services
- (3)
Other activities
Table 5 shows electricity consumption in the Port of Valencia for the year 2016 for the various activities mentioned above.
However, it is worth mentioning that there are other port energy consumers that do not use electricity when running. These consumers are basically trucks, yard machinery and vessels berthed at the port which presently burn fossil fuels. According to the new EU energy regulatory framework there will be a transition from fossil fuels to clean energy, therefore, and as we have mentioned in previous sections, a major share of yard machinery and vessels auxiliary engines will run on electricity.
According to the information supplied by the Valencia Port Authority (the Valencia Port Authority is the public body responsible for running and managing three state-owned ports along an 80 km stretch of the Mediterranean coast in Eastern Spain: Valencia, Sagunto and Gandia) [
1], during 2016, the total energy consumed by the Port of Valencia was 425 GWh, of which, as stated in
Table 5, 65 GWh was electricity, and the remainder, 350 GWh, came from fossil fuels.
The transition from fossil fuels to clean energy will enforce the port authorities to find suitable and reliable energy sources to cover the coming increase of electricity consumption at ports. This is the target of this paper, to prove that other clean energy sources are potentially useful in ports.
3.2. Wave Energy Resources in the Port of Valencia
3.2.1. Spanish System for the Measurement and Forecasting Marine Environment
Puertos del Estado has developed and maintains systems for measuring and forecasting of the marine environment with the main objective of providing the Spanish Port System with essential ocean and meteorological data for their design and operation. This allows for reduced costs and an increase of efficiency, sustainability and safety of port operations [
40]. The benefits of this activity are not solely limited to the port environment, but are also intended to be a service open to society and other institutions. This is provided through Puertos del Estado’s website [
www.puertos.es].
The marine environment measurement and forecasting system consists of measurement networks (buoys, tide gauges and high-frequency radars), forecasting services (waves, sea level, currents and water temperature) and climate packages, which describe both the current maritime climate and its scenarios for future change.
3.2.2. Real-Time Data System
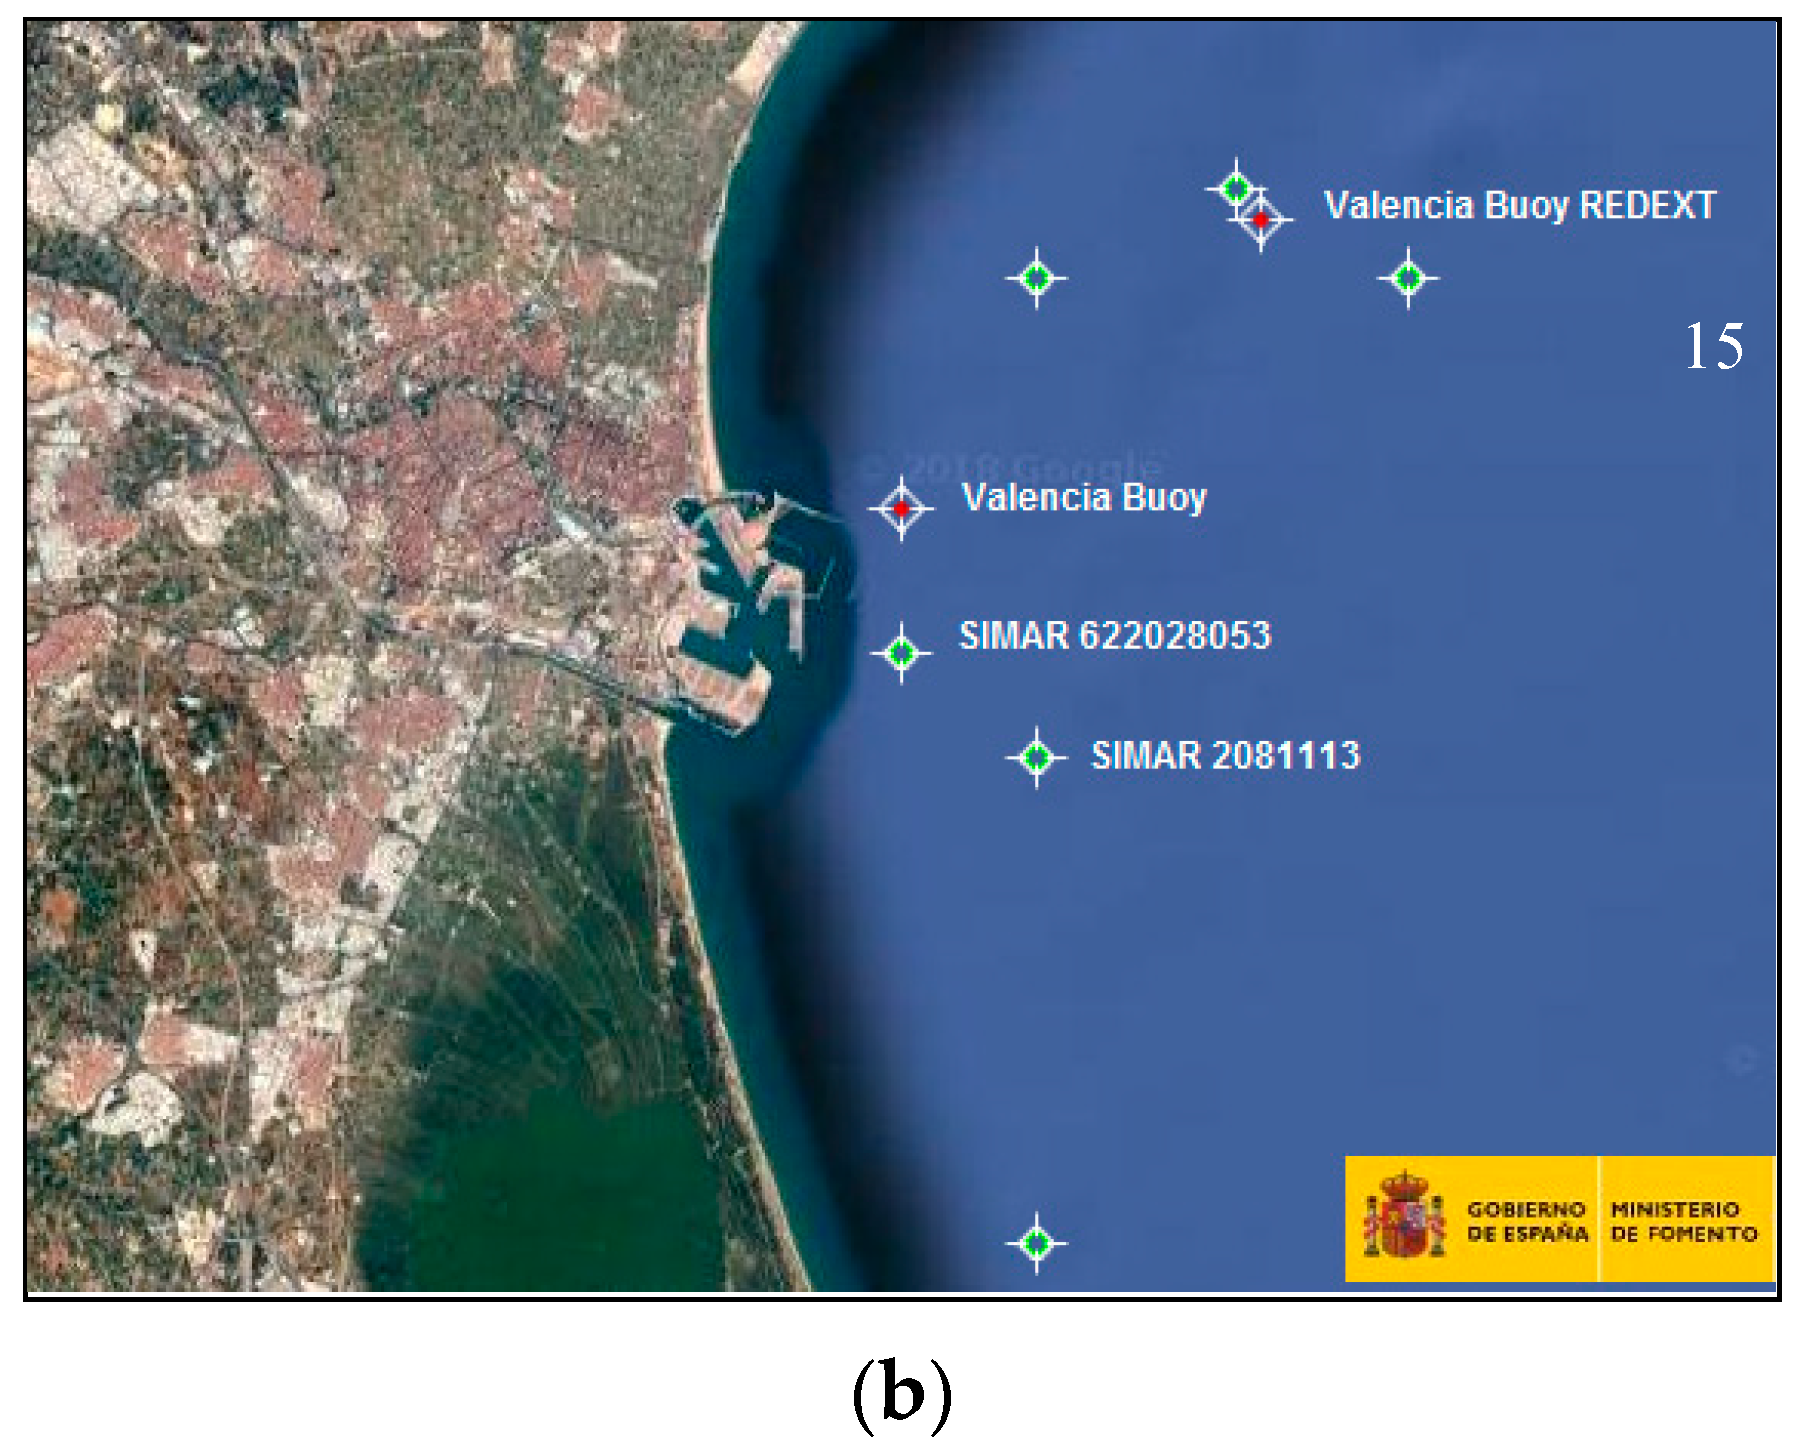
For the Real-Time Data, measurement networks (buoys, tide gauges and high frequency radars) are used. Specifically, the REDEXT Network, consisting of 15 buoys, being 12 of the Seawatch type and 3 of the Wavescan type (
Figure 10). These buoys send their real-time data of integrated parameters and the spectrum of energy density, via satellite, to the offices of Puertos del Estado.
The buoys included in this network are characterized by being anchored far from the coastline and at a great depth (more than 200 m). Therefore, the wave measurements of these sensors are not disturbed by local effects. Therefore, each buoy provides representative observations of large coastal areas away from the coast (open sea).
In general, the buoys of the REDEXT Network are equipped with various types of sensors, as well as data processing, storage and transmission units via satellite. In data processing, a set of statistical parameters characterizing each of the observed agents, such as the average wind speed, or the significant wave height is generated.
Additionally, data propagation techniques in the form of wave time series from the previous buoys are used in this context, up to certain points of interest close to the coast where physical systems of specific sensory perception are not available. The techniques of propagation to the points close to the coast take into account the changes that would occur in the waves due to the profile of the coast and the shape of the seabed.
3.2.3. Forecast Data System
This system consists of two modules: the ocean scale prediction system and the port scale prediction system, called Autonomous Wave Prediction System (AWPS). Both are fed by the wind fields of the HIRLAM model [
41] of the Spanish Meteorological Service Agency (AEMET). The system is updated twice a day and provides hourly forecasts for the next three days.
3.2.4. Historical Data System
For the evaluation of potential marine energy resources existing in the Spanish coasts, and especially in the vicinity of Spanish ports such as the Port of Valencia, a source of important temporal data series is the Historical Data System, This system was developed by Puertos del Estado and designed to provide a wave forecast for Spanish ports on the Atlantic and Mediterranean coasts of Spain, which makes it possible to predict the sea conditions at the entrance of the ports, within the continental shelf [
42].
Through the so-called SIMAR Points, the historical data system allows obtaining and assigning to these points, time series of wind and wave parameters from numerical modeling. The SIMAR series arise from the concatenation of the two large simulated wave datasets with which Puertos del Estado has traditionally counted: SIMAR-44 and WANA with the aim of offering time series that are more extensive in time and updated daily, with the peculiarity that the system offers information from 1958 to the present.
Under ideal conditions, the points of propagation that are very close to the Port of Valencia (
Figure 10) would be adequate to evaluate the existing local energy resources. In our case, in the area of the Port of Valencia there is a set of propagation points, of which those of greatest suitability to make the observations would be the points SIMAR 2081113 and SIMAR 622028053. They were located very close to the breakwaters where the installation of the energy converters is proposed in this article.
The series of propagation data obtained from the Valencia Buoy have information gaps due to various causes, such as breakdowns of the buoy, measured data arriving late, problems with the execution of propagations, etc., contribute to produce a time series of incomplete data whose correction has not been made because this service was designed from the beginning for the real-time data service.
The WAM numerical model [
43,
44] has been used to generate wave fields. This application is a third generation spectral model that solves the energy balance equation without establishing any hypothesis
a priori about the shape of the wave spectrum. The data has been generated with an hourly cadence. The decomposition of sea of wind and sea of bottom has been made. In order to describe situations with cross-seas, the possibility of two sea-floor contributions has been considered.
For the Mediterranean area a variable spacing mesh with a resolution of 15′ latitude × 15′ longitude (about 25 km × 25 km) for the eastern edge of the mesh and 7.5′ latitude × 7.5′ of longitude (approximately 12.5 km × 12.5 km) for the rest of the patterned area.
3.2.5. Available Parameters
Waves
- ○
Spectral significant height
- ○
Spectral peak period
- ○
Spectral average period (moments 0 and 2)
- ○
Average direction of the origin of the waves
- ○
Height and direction of the sea of wind
- ○
Height average period and direction of the sea of bottom
Wind
Studies using historical data obtained from a wave database of Puertos del Estado were carried out in 2008. This study provided information on the energy potential of the Spanish coast, with the results shown in
Table 6.
As might be expected [
40], there are major differences between the powers measured on the mainland Atlantic and Canary Islands with the Mediterranean. Given the current technological development of WECs, there are some limitations on the economic feasibility of their use in some Mediterranean sites.
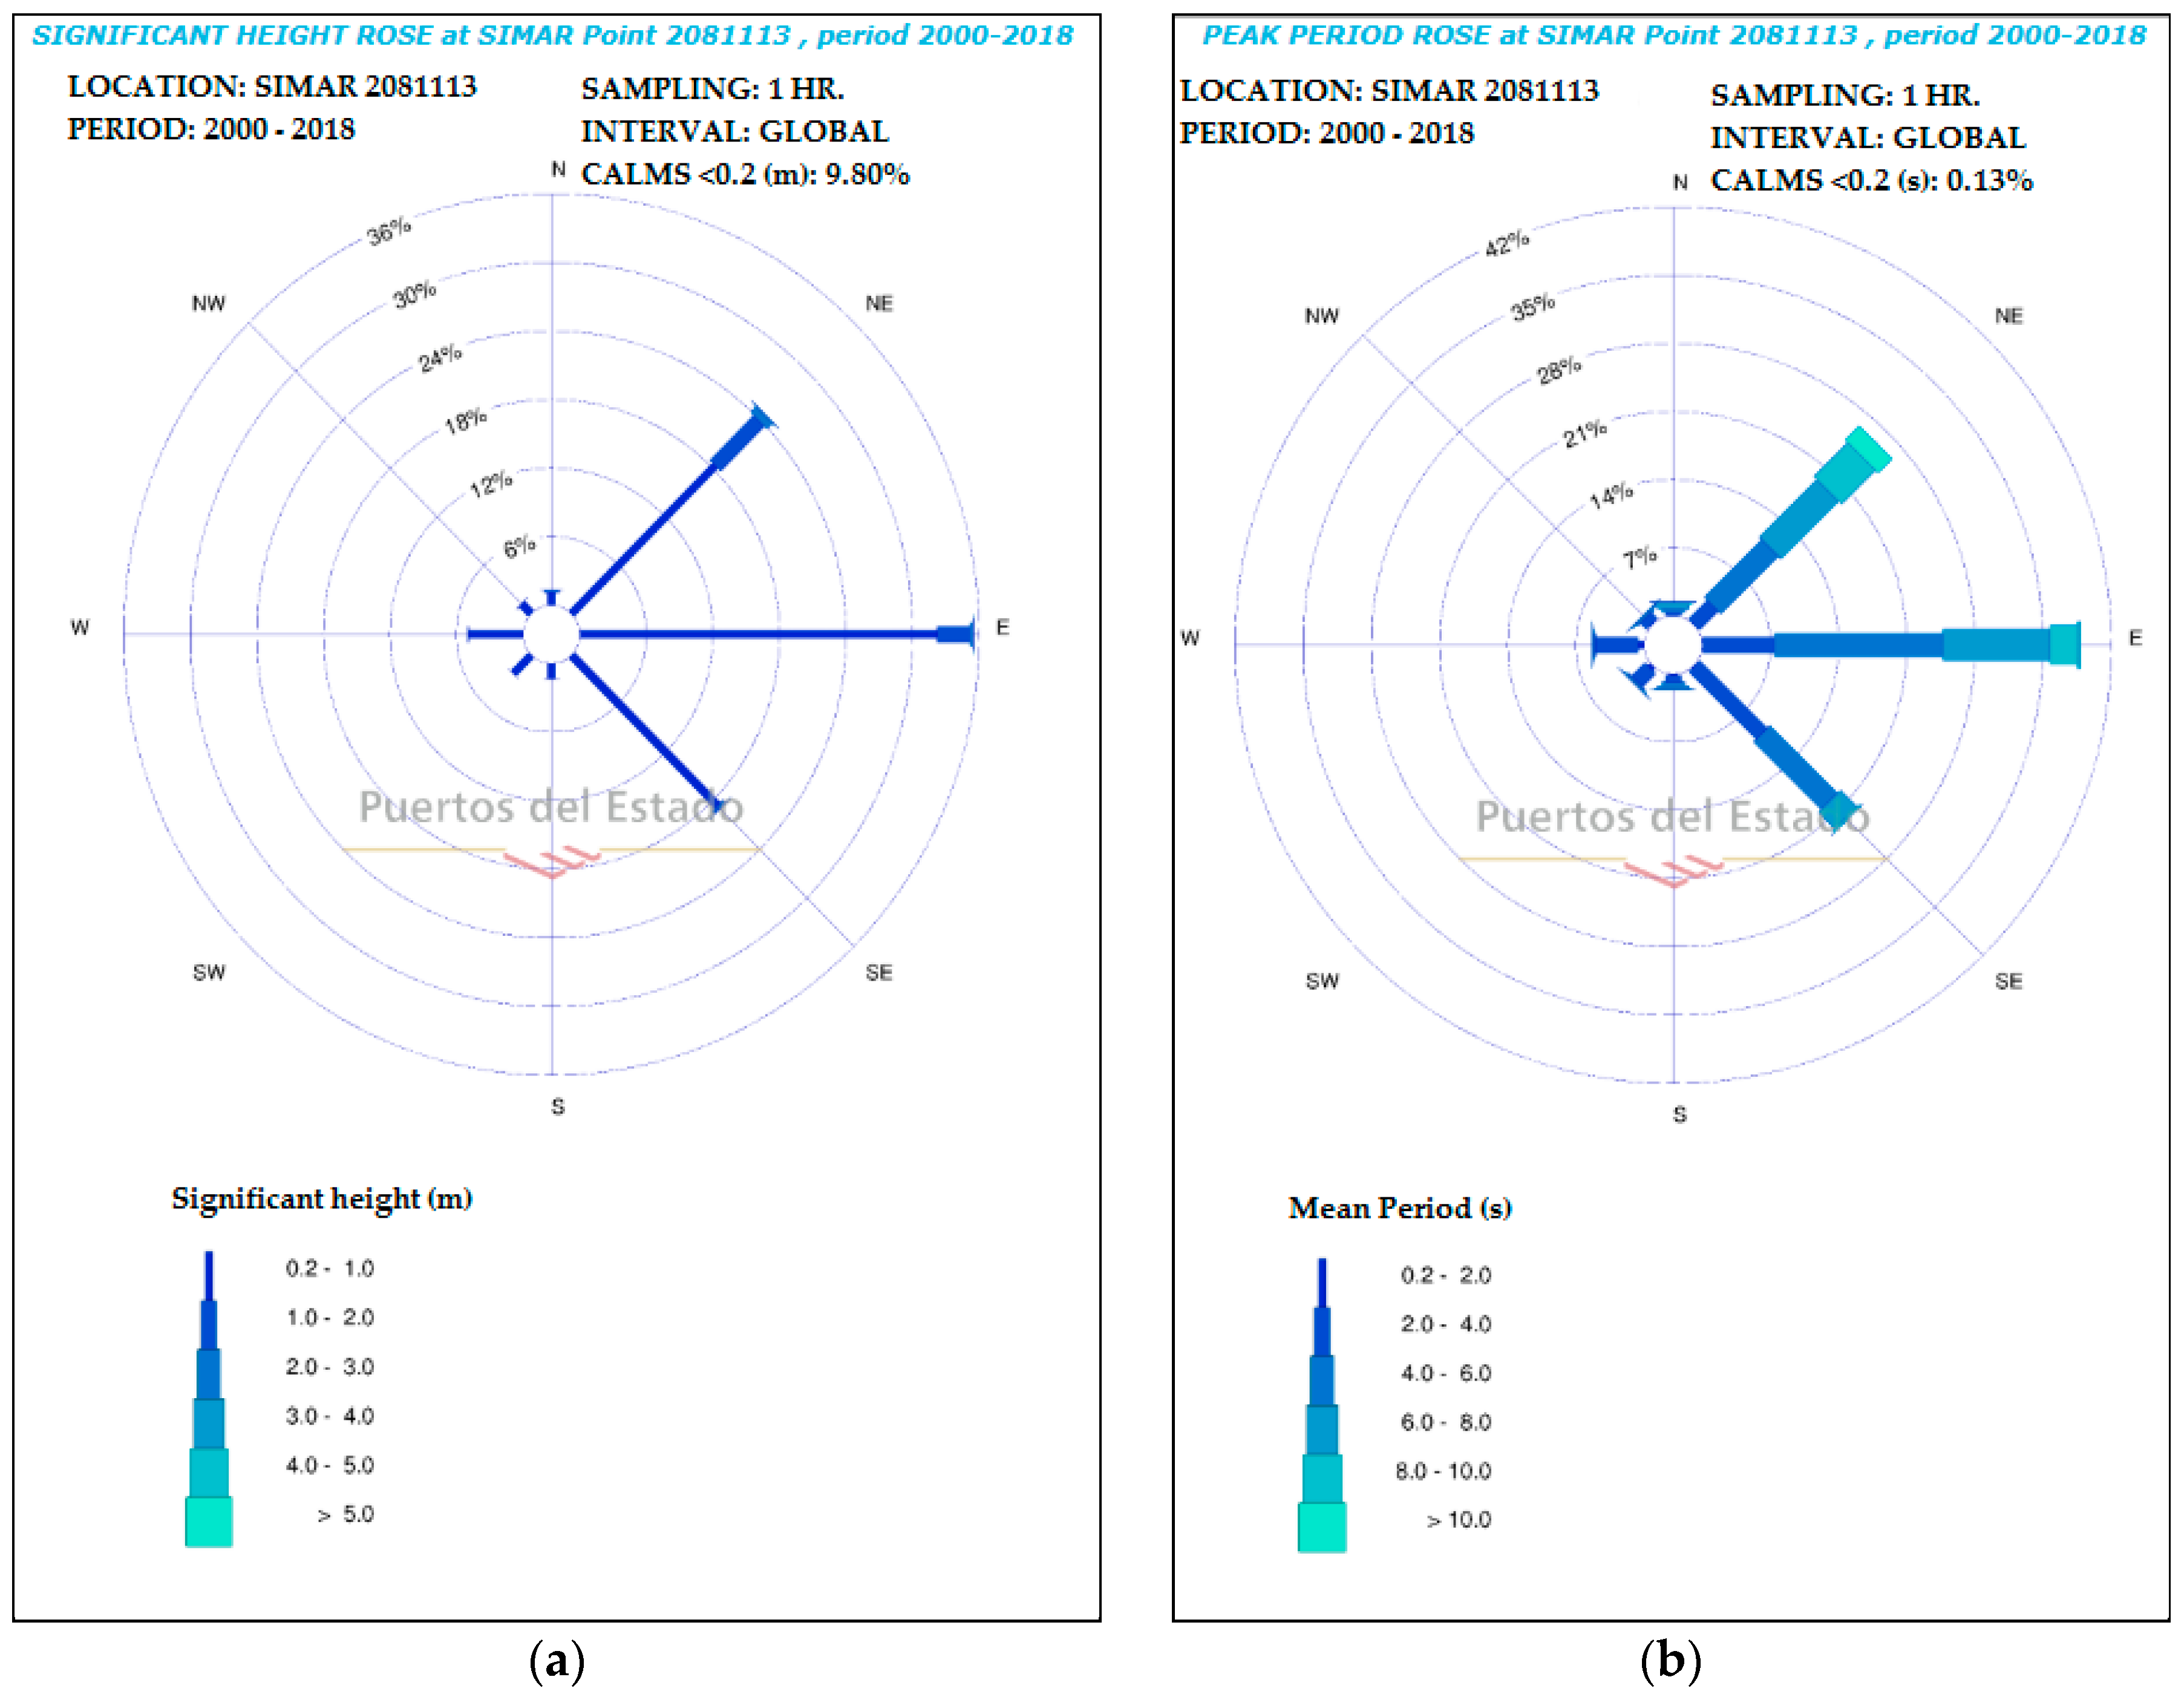
Figure 11 shows preeminent wave direction, significant wave height and mean wave period in the Port of Valencia in the last eighteen years.
We could make a first approach to the power estimation taking the historical data from Puertos del Estado [
45] for the study area.
Table 7 and
Table 8 show the probability of occurrence of different wave conditions, where Tp is the wave peak period in seconds and Hs is the wave significant height in meters.
Although the SIMAR 2081113 point is still running, the Valencia Buoy was removed from its location in 2005, however our aim was to compare both data sources in order to estimate the available power from the waves in the area. Although one could say that SIMAR 622028053 point would be more suitable than SIMAR 2081113 point for this preliminary analysis, the fact is that SIMAR 622028053 point propagates data from the REDEXT and the configuration is, according to Puertos del Estado more suitable when comparing data from the Valencia Buoy from REDEXT Network rather than the removed Valencia Buoy.
Considering the above data and the Equation (1) given by [
11,
17,
22,
46], the average power per length of wave crest in irregular waves can be given by:
where Pw is the energy flux in watts per meter of crest length; ρ = 1025 kg/m
3 is the density of seawater;
g is the acceleration of gravity, Te is the wave energy period (s) and Hs is the wave significant height (m).
This equation is valid for deep waters, and not for shallow ones. However, in the case study of Valencia, with a depth of about 25 m, the power in Equation (1) is basically conserved during wave propagation up to the onset of breaking [
17].
The average estimated wave power using the data from
Table 7 and
Table 8 and the formula given by (1), are 4.83 kW/m for the Valencia Buoy and 4.51 kW/m for the SIMAR 2081113 (2000–2005). The difference between both values is less than 7%, therefore we could use the SIMAR 2081113 point data for the energy production estimation. The above results are more optimistic than those shown in
Table 6. This difference could be due to the period of measurement as
Table 6 gives us data from 2004 to 2005 while the
Table 7 and
Table 8 give data from 2000 to 2005.
3.3. Wave Energy Converters for the Port of Valencia
The Port of Valencia is an urban port very close to the city quarters and delimited by breakwaters (
Figure 12).
The proposed WEC selection criteria are next applied to the Port of Valencia:
- (1)
Energy demand: As presented in
Section 3.1, cargo handled (
Table 3) and electricity consumption (
Table 4), the Port of Valencia has experienced a sustained increment in the recent years. In the last decade the cargo handled has increased more than 25% and the electricity consumption more than 40%. This trend is very likely going to be accentuated in the next few years.
- (2)
Energy resources: Local wave energy resources has been evaluated in
Section 3.2. An average peak wave power of 4.51 kW/m is estimated. Average significant wave height is 0.75 m and average peak wave period is 5.80 s, outputs obtained from
Table 8. The wave power is estimated both from local buoy measurements and from numerical models, being the latter validated by comparison with the former. The wave power estimation is similar to the one made in previous studies [
47], but assuming that the difference between them is due to the depth difference as the SIMAR 2081113 point estimates wave power at a depth of about 50 m.
- (3)
Port dimensions: The Port of Valencia is a very busy port, one of the biggest in the Mediterranean, therefore, any hazards to navigation must be avoided as much as possible, that is why OTD or OWC devices are more compatible with shipping traffic than WABs. In addition, the port is still expanding and it is foreseen to have a new container terminal in the northern harbor within the next three years. The enlargement works will need some new breakwaters to be built. This fact gives us the chance to customize the breakwater design in order to optimize the performance of the chosen WEC.
- (4)
Environmental requirements: The surroundings of the port are not areas with special ecologic value in terms of fisheries and considering that the breakwater where the WEC could be installed is located in an industrial area is more than 2 km away from the coastline, little or no environmental impact is expected from this point of view. According to recent experiences with the OWC devices, it seems that the turbines design is also a key point to be considered. OWC devices could not be suitable for an urban seaport due to their acoustic impact. The Mutriku wave plant is known by the locals as the Mutriku Dragon. Air turbines are quite noisy, especially the Wells turbine that equips most OWC prototypes. This can be unimportant in remote locations but has serious implications in inhabited areas such as the Port of Valencia. Acoustic impact has been a serious issue in the plants of Mutriku, Civitavecchia and LIMPET. It can be concluded that in the Port of Valencia the OTD devices would fulfill the structural and environmental criteria. Therefore, they are considered better option than the OWC devices.
- (5)
Installation and maintenance costs: The possibility to build a new breakwater of more than 500 m long, led us to consider the option of an OTD integrated into its structure. Being that the case, not much more investment is expected on the installation costs, other than the ones related to the breakwater plus the specific equipment of the WEC.
These criteria are summarized in
Table 9.
4. Discussion
The characteristics of the Port of Valencia leave as the more indicated alternative the construction of overtopping devices integrated into breakwaters like the SSG or the OBREC system [
48]. Given the low average wave height in the port (
Figure 11) and the breakwater section shown in
Figure 12b, either the SSG or the OBREC systems could be, initially, the selected WEC solutions for this case [
48]. The breakwater where the WEC could be installed has a depth of about 25 m. The estimated average yearly wave power at this area is 4.51 kW/m. Considering that the breakwater is a new build project, along with integration this study, we could consider the both the SSG and the OBREC systems as strong candidates to be implemented for the required energy generation.
However, and according to the average wave height of 0.75 m. one should focus the research on WECs able to give good performance around that figure. SSG devices give competitive energy outputs when Hs > 4.5 m and Tp > 8 s [
47], while in the case of OBREC devices, this situation comes when 0.5 < Hs < 1 and 7 < Tp < 8 [
49], which, apparently matches better with the wave resource available at the study area. This would make us choose the OBREC system instead of the SSG when comparing the performance at the typical wave regime at the study area [
46].
Discussed to this point, six key parameters make up a wave energy device, which together ultimately convert the movement or flow of the oceans into electricity [
10]: Structure and prime mover, foundations and moorings, Power Take Off (PTO), control systems, installation and connection.
Based on the above, the OTD WEC technology for the Port of Valencia could be integrated into the new breakwater structure, not representing a significant increase of the budget and acting as a real breakwater. The moorings would not be necessary but only special adjustment designs to make the structure resistant to extreme waves when necessary. Regarding the remaining parameters, the requirements of PTO and control would be much weaker than those needed offshore. The benefits obtained from a proper integration of the breakwater and an OTD WEC are basically the following [
50]:
Cost sharing benefits on construction, installation and maintenance;
Recirculation of water inside the harbour as the outlet of the turbines is on the rear part of the system;
Availability of grid connections and infrastructures;
No deep-water moorings or long lengths of underwater electrical cable;
Provides both energy extraction and coast protection abilities at a low environmental cost.
The advantages of using this type of system to cover part of a port energy demand include:
- ○
Energy is accessible from multiple locations;
- ○
Due to technological advances, reliable predictions are possible;
- ○
The environmental impact is lower than in offshore installations;
- ○
The correlation between resource and demand is excellent.
On the other hand, there are certain disadvantages (which can be reduced with further research):
- ○
Exposure to severe sea conditions (temporary);
- ○
Cost of installation and maintenance;
- ○
It is an energy source that is still in the development phase worldwide, since to date no technology has proved superior to the others.
However, for specific port applications, authors state:
- (1)
The desirability of carrying out studies with a higher level of detail, covering aspects related to the local interaction of the waves with the seabed, and the phenomena of reflection and refraction, which could favour the concentration of energy.
- (2)
Other aspects that should be investigated are those related to the alignment of the generating device with the directionality of the waves, with a view to greater energy utilization [
51].
- (3)
The application of advanced control techniques contributes significantly to the optimization of the energy performance of the converter device [
52,
53,
54].
- (4)
It is also necessary to incorporate PTO designs to increase performance in areas where resources are scarcer—such as the Mediterranean [
55]. Some authors discuss the possibility of enhancing power capture performance of WEC using bi-stable power capture mechanisms [
56,
57]. Results show that compared with linear PTO systems, nonlinear PTO systems can increase the power captured by the oscillating body WEC in irregular waves [
58].
In addition, the hydraulic and electrical performance of the shore connection must be considered, the latter being a fundamental element in the evaluation of energy cost.
To take the necessary decisions regarding the feasibility of a wave power generation project, and how the generated energy can be used in port facilities it is necessary to define indicators that integrate the main feasibility criteria for the selection of these systems, as proposed in this paper. These indicators will enable us to classify the type of facilities in accordance with the resources available in the installation area, and the potential consumers for the energy. Among the most important are the existence of sufficient local energy resources and the economic and technical criteria, the latter being classified as follows:
Economic feasibility
- ○
Initial investment
- ○
Operating costs
- ○
Predictive and corrective maintenance costs
- ○
Return on investment
Technical feasibility
- ○
Durability of the plant
- ○
Maintenance and/or repair stoppages
As ports are facilities located at sea, it is essential to have a system that monitors the main performance and generation indicators and minimizes maintenance costs for the plant. Therefore, when calculating the profitability of a wave power generation plant, we must ensure a reduction of maintenance costs by providing the necessary tools for a preventive maintenance system to improve the planning of maintenance operations.
The location of the ports can help in this cost reduction, by minimizing the distribution costs of the energy from the plant, since consumption will occur near the point where it is generated [
59]. When building a new breakwater infrastructure, the additional cost of implementation of a WEC would be lower considering that the project is designed at once, compared to the installation of a WEC in an existing breakwater.
The estimated LCOE (Levelized cost of energy) for wave energy farms (i.e., 10 MW) that is in the range of 330–630 € / MWh [
60] is higher than other renewable marine energy sources. In fact, this outcome is not surprising due to the fact that the wave technologies are still at the initial stage of development. This directly affects the economies of scale, including the assumptions considered to estimate current and projected costs. These LCOE values are in line with those achieved by other studies [
61].
The latest estimates for European wave energy projects suggest that the PTO system accounts for 22%, installation 18%, O&M 17%, foundation and mooring 6%, and grid connection 5% of the total lifetime project costs [
60].
However, the costs are expected to drop by a net amount of approximately 70% by 2030 due to learning rates and economies of scale in the sector. As we increase the level of development reached with other marine energy sources, i.e., offshore wind, there would be a knowledge transfer to other technologies and so the costs would be accordingly adjusted. This would mean an average LCOE of around € 150–180 /MWh by 2030.
Collaboration and synergetic research with the offshore wind industry to reduce the cost of common offshore grid infrastructures is essential for these projects as they use similar equipment and O&M practices, also similar project development and permitting processes are involved.
5. Conclusions
The proximity of a harbor has favorable conditions that can facilitate the exploitation of wave energy potential because it can be transferred and used easier than in offshore locations. In addition, the maintenance, monitoring and energy transport costs can be reduced due to its proximity to the consumers. The WEC installation costs can be considered as part of the breakwater construction budget.
The comparison between the performance estimates of the selected WECs for the Port of Valencia are not very optimistic in terms of energy generation from waves, however, this is the reason why one should look into other factors in order to minimize the costs involved and maximize the WEC performance.
The wave power potential has been estimated considering the data available from Puertos del Estado REDEXT network, by selecting the most interesting measurement points nearby the study area. This estimation gives a resource power of 4.51 kW/m at the study area, which is on the low side of the feasible margins. However the WEC efficiency, together with the criteria proposed in this paper will help in the selection of the most suitable WEC technology for ports.
Integration of WECs on a breakwater has several advantages such as cost savings, provides energy extraction and coast protection at the same time. These advantages could compensate the low available resource power by looking for variables that should be considered for the design of the ports’ infrastructure capable to be used as an energy generation platform and take advantage of its location to harvest the wave energy potential.
It is concluded that in terms of feasible integration with the port infrastructure, a port is an ideal location for a wave energy converter based on the overtopping principle as it can be easily integrated into the mound ruble without compromising the success of the project, however, in terms of expected energy production, we should look into other possibilities.
Given the available wave resource at the Port of Valencia and the different WECs power matrices, we consider that there is still a long way ahead of us in order to find the best suitable solution, in terms of technical and economic feasibility, to make this marine energy part of the ports’ energy pool. Public financing will play an essential role in the further development of these energy generators.


