Article

The Impact of an Electrical Mini-grid on the Development of a Rural Community in Kenya

1
Energy & Climate Change Division, Sustainable Energy Research Group (energy.soton.ac.uk), Faculty of Engineering and Physical Sciences, University of Southampton, Southampton SO17 1BJ, UK
2
Kenya Ministry of Energy and Petroleum, Nyayo House, P. O. Box 30582, Nairobi 00100, Kenya
3
Centre for Global Health, Population, Poverty and Policy, Faculty of Social and Human Sciences, University of Southampton, Southampton SO17 1BJ, UK
4
Biological and Environmental Sciences, University of Stirling, Stirling FK9 4LA, UK
5
Singapore Management University, 81 Victoria Street, Singapore 188065, Singapore
*
Author to whom correspondence should be addressed.
Energies 2019, 12(5), 778; https://doi.org/10.3390/en12050778
Submission received: 15 January 2019 / Revised: 19 February 2019 / Accepted: 23 February 2019 / Published: 26 February 2019
(This article belongs to the Section A: Sustainable Energy)

Abstract

:
Electrical mini-grids can provide electrification to rural communities far from the national network. However the benefits of such schemes are disputed. We observed changes in two matched trading-centres in Makueni County, Kenya, neither of which were initially electrified. During the study a solar photovoltaic mini-grid scheme (13.5 kWp) was constructed in one of the trading-centres. After electrification there were relative increases in the number of businesses and business income. Comparing the households in the areas around the trading centres, perceived wealth increased more around the electrified trading centre. Qualitative interviews indicated improvements in service provision by the local school and health centre. The co-operative set up to run the mini-grid was free to set its own kWh tariff and chose to reduce it to a level that covers operating costs and would recover 70% of the initial investment interest-free. However, the tariff finally agreed is higher than the national grid tariff, which would be difficult to achieve if the mini-grid was not owned by and run for the benefit of the local community. Overall, we found that the mini-grid had a positive effect over background development, recovered some of its cost and charged a higher tariff than the national rate.

1. Introduction

To date it is estimated that around 1.19 billion people, representing 16% of the global population, have no access to electricity, with many more having no reliable electricity supply [1]. Most of these people live in rural areas in sub-Saharan Africa (SSA) and south Asian countries. It has been estimated that only 34% of health facilities in sub-Saharan Africa have reliable electricity access [2]. Provision of electricity has been recognized to be important for development and alleviation of poverty by the United Nations in their Sustainable Development Goals (SDGs) [3], which are built on the previous Millennium Development Goals [4]. Sustainable Development Goal 7 stipulates a global community commitment of achieving universal access to electricity by 2030 [5]. However, achieving this commitment by grid connection poses significant challenges to some SSA countries due to the cost of extending their national grids to scattered and sparsely populated rural areas [6]. To overcome this challenge, mini-grids, which are independent of the main distribution network, can be used to provide generation, balance-of-system and distribution infrastructure to communities in scattered rural areas. However, the economics of mini-grids are tough due to high costs and limited ability of customers to pay. Many previous projects have simply been donated by institutions and governments, without a focus on productive uses of power, or engaging the community at an early stage, and have met with limited success [7]. Community-run mini-grids often fail to collect sufficient tariff income to cover long term maintenance costs and equipment falls into disrepair in a pattern identified by Tenenbaum et al. They propose measures including employing staff and taking on debt repayments, to ensure tariffs remain sufficiently high [8].

1.1. Mini-grids in the Context of Electrification Research

The World Bank usefully defined a classification of household electricity access, to distinguish between the different levels of service that are often lumped together as ‘electrification’. Tiers 1 to 2 range from small solar lanterns up to solar home systems (0–200 W); Tier 3 or 4 would typically be provided by a mini-grid or generator (200–2000 W); Tier 5 is full grid electrification [9]. Tier 1 or tier 2 services are typically low cost, can be deployed rapidly at scale and are not too dependent on where they are deployed. This makes it possible to carry out a large trial within the scope of a research project. However, such studies have not tended to show strong positive impacts of electrification. A randomized control trial in India of 81 villages, totalling 1281 households, of which 21 villages and around 128 households subscribed to a fee-for-service consisting of two lightbulbs and a mobile ‘phone charger. A significant reduction in kerosene use was observed, but no socioeconomic effects due to the intervention were found [10].
At the other end of the electrification scale, national grid connection programmes can be used as natural experiments to study benefits of energy access. Although sample sizes are large, these programmes are more difficult to study than Tier 1 or 2 projects as the intervention groups are not randomly selected and there is also self-selection due to high connection fees. Perhaps more surprisingly than the Tier 1–2 case, an extensive study in Rwanda of 974 households [11] found that, whereas there were significant decreases in kerosene use and dry-cell battery consumption, there were no strong socioeconomic effects of grid connection 3.5 years later.
What about the intermediate ‘tiers’ of electrification—200 W and up? Studies looking at these levels tend to be case studies or observational studies rather than randomized trials, due to the level of investment and time required to install the necessary infrastructure in multiple locations simultaneously. Such interventions may also be quite site-specific, depending on density of buildings and renewable resources at the site. In a systematic review of the literature on mini-grids, Knuckles [12] made a number of observations, including that community-run mini-grids tend to provide higher power capacity per user. In theory, this would mean that such mini-grids are more likely to result in new business activities requiring higher power levels, when compared to other options. The review also highlighted the effectiveness of tariffs in encouraging energy efficiency vis-a-vis charging a flat fee.
A wealth of case-study experience on mini-grids in the context of South Asia has emanated from the research project on Off-grid Access Systems in South Asia (OASYS South Asia). In a comprehensive assessment, Bhattacharya and Palit [13] reviewed a large number of mini-grid projects; a set of projects singled out as exemplary in Chhattisgarh, India had defining characteristics of (a) public-private partnership (b) regular community engagement through a village energy committee (c) well-organized maintenance support at the village cluster level. Between 2000 and 2012, over 1400 villages were electrified with solar mini-grids with a cumulative capacity of 3.5 MWp. In addition, there was a clear plan for removal of the mini-grid once grid extension occurred. Bhattacharya and Palit [14] highlighted the challenge in setting the appropriate tariff, a delicate balancing act between offsetting the higher costs than the grid, and the need supply energy at a price where customers save money versus alternatives such as kerosene and diesel.
A number of community-level benefits of mini-grid electrification have been proposed by authors; in community healthcare settings, electricity can provide twenty-four hour lighting for the provision of emergency care, refrigeration for vaccines, better conditions for highly skilled staff and IT access can improve record-keeping and organization. Evening and night hours are a time when many patients, including expectant mothers, may arrive for treatment as they do not want to lose time from their daytime jobs or if they lack child care until other household members return from work [15,16]. In India, electrification was found to increase weekly study time by more than an hour and as a result of more study hours, children from households with electricity can be expected to perform better than their peers living in households without electricity [17]. In Nepal, it was observed that school dropout rates had decreased because children had time to study at night under the light and, in fact, enrolment in the public school had increased because it provided modern IT education [18].
Whereas the provision of electricity access through mini-grids is not new in a sub-Saharan Africa context, until recently most national utilities operate such systems using diesel which requires fuel supply chain and regular maintenance [19]. In contrast, renewable energy (solar, wind, hydro, waste biomass, geothermal) driven mini-grids are relatively new and provide a more environmentally sustainable option with lower running costs and (with the exception of biomass) lower maintenance requirements than diesel, while still potentially requiring less capital investment than extending the national grid.
The work presented in this paper therefore aimed to assess whether an off-grid solar-PV-based mini-grid scheme capable of providing sufficient power for some productive uses (tiers 3 to 4), can be sustainable in terms of both operating costs, and provide measurable community benefits in terms of health, education and business income - over and above background developmental change, in a sub-Saharan African context, addressing the UN Sustainable Development Goals.

1.2. Country Context and Site Selection

The geographic scope of the project described in this paper was chosen to be Kenya. At the commencement of the project, in 2009, Kenya had a rural electrification rate of only 8% while the urban electrification rate was 65% [20]. The final surveys for this project were carried out in 2014. In the same year, Sustainable Energy for All [21] estimated that the urban and rural electrification rates in Kenya had risen to 68% and 26% respectively. The rate of connection of new customers has accelerated even further since that time, with over 1 million new connections in the 2016–2017 period alone, an increase of 28% on the previous year, leading the national power generation utility to claim an overall electrification rate of 70% in their annual report [22]. This is an impressive achievement, but the rate of installation of new generating capacity is not keeping pace, as in the same report it was stated that generating capacity grew by only 0.64% while demand grew by 4.4%.
Even where the grid distribution network is present, the upfront cost of connecting to it may be prohibitive. Taking the case of Kenya, if a transformer is within 600 m of a property, the subsidized connection fee was until recently 35,000 KES (around 350 USD) [23], compared to an annual rural household expenditure per adult of 27,000 KES (around 270 USD) [24]. Since 2017, the ‘Last Mile’ connectivity project has more than halved the cost of connecting to a transformer (to 15,000 KES or 150 USD) resulting in a huge increase in the number of grid connections [25]. However, if the property is further than 600 m from an existing transformer, the full cost of installing a new transformer will still be charged to the property owner by the network operator, which can be more than ten times the subsidized cost [26].
Beyond simply being connected to the electricity network is the importance of reliability of supply. The Kenya national grid service has significant room for improvement as planned and unplanned power outages a daily reality for many, as detailed on the national utility web site [27] and summarized in their annual report as an average of around four outages per month per customer, lasting on average six hours at a time [22]. This is an additional cost for businesses for example, who have to run standby generators. In 2013, the World Bank Enterprise Survey estimated that Kenyan businesses lost 7% of sales in electrical outages, an increase of 0.6% since the survey was previously conducted in 2007 [28]. Independent mini-grids have control over load-shedding and can respond to local priorities in demand. By contrast, customers of the national electricity network have no say over planned and unplanned outages. However, this advantage is difficult to quantify and the headline kWh tariff tends to dominate comparisons between mini-grids and the national network.

1.2.1. Site Selection

In order for the project to progress, a comprehensive assessment of Kenya was undertaken as the first step. The assessment included: (i) the development of high-level pre-selection criteria to identify suitable administrative units using available datasets, (ii) the development of a GIS (Geographical Information Systems) database of Kenya containing the necessary data for informing the project decision-making process, and (iii) initial reconnaissance visits to assess candidate sub-locations identified for suitability.
The variables used to shortlist sub-locations were population density and proximity to the electricity distribution network or existing decentralized power supply network (specifically the shortest distance of the sub-location centroid to the network). Also taken in account were the planned grid extensions in the 2009 Rural Electrification Masterplan [29]. The aim in doing this was to identify areas where there were significant clusters of population, away from the electricity network, with limited likelihood of imminent electrification. The criteria are described in more detail in Table A1 in Appendix A.
For the purpose of selecting two similar trading centres, sufficiently far apart, the selected sub-locations were spatially aggregated to district (now county) level, and ranked by total population of selected sub-locations, as listed in Table A2 in Appendix A. After ranking the districts, an initial reconnaissance visit to the top-ranking district—Makueni—was carried out, where ten trading centres were visited. Additional constraints for selecting specific sites within the sub-locations were the presence of at least one health centre, one school and a trading centre. This was to allow plausible pathways between electrification, and health and education, to be proposed and tested. Accordingly, trading centres with schools or health centres that already had some form of electrification, such as a diesel generator or PV system, were excluded at this point to prevent this from affecting the results. Finally, the trading centres of Kitonyoni and Mwania were selected, both of which fall in sub-locations with population density-distance product > 1000 people/km, representing a significant population density at a significant distance from grid connection.

1.2.2. Site characteristics

Kitonyoni and Mwania are located approximately 150 km from Nairobi by road, east and west off the Wote-Makindu highway respectively, about 44 km apart in the county of Makueni in Kenya (Figure 1). In 2015, the Kitonyoni sub-location had a population of 2590 (1284 males and 1306 females) comprising 462 households covering an area approximately 27 km2. Mwania sub-location had a population of 3239 (1569 males and 1670 females) made up of 599 households and covers an area approximately 63 km2. In both areas, businesses, health centres and schools are located in and around trading centres, whereas the majority of people live in sparse clusters of homesteads (often hundreds of meters apart), constructed in a vernacular style of mud bricks and thatched roofs. About 95% of the roads connecting the two communities are unmade [30,31]. The area is semi-arid with minimal rainfall between November and December during which the people grow maize, beans, green grams, chickpeas, cowpeas and pigeon peas for subsistence [32].

2. Materials and Methods

The overarching methodology was to study the changes in a matched pair of off-grid trading centres, one of which would receive an intervention in the form of the installation of a solar PV mini-grid, and the other as control would not be electrified for the duration of the project. A repeated cross-sectional mixed-methods study design was applied at two points in time (pre- and post-electrification) to assess livelihoods, health and wellbeing. All survey and fieldwork methodologies were subject to ethical review by University of Southampton Research Governance (reference SOC200910-35, approved 14 June 2010 & reference 8727, approved 13 August 2012) and from the Kenya Medical Research Institute (KEMRI) (reference “Non-SSC Protocol No.226”, approved 17 August 2010). The following subsections detail the methodology at the household level (quantitative survey); business level (quantitative survey); community level (key informant interviews) and mini-grid (including design aspects, business model, governance and operation). This structure is repeated in the results section.

2.1. Household Level

The household study consisted of face-to-face surveys of 1069 households (479 in Kitonyoni and 590 in Mwania). This was therefore essentially a complete census of the two sub-locations, rather than a sample. The baseline survey took place in March‒May 2012, approximately six months before the mini-grid was installed and commissioned in late September 2012. This was followed-up approximately two years later between June and August 2014 with 463 households in Kitonyoni and 520 households in Mwania. A total of 838 households could be reliably matched between the baseline and endline surveys.
In this present work for the sake of brevity and to show the range of topics covered, a few of the questions from the surveys have been selected for further analysis:
  • What is your household expenditure?
  • What is your expenditure on kerosene?
  • On a set of steps representing wealth from 1–10 (poorest to richest), on which step would you be today?
  • How many pieces of fruit do you eat on a typical day?
  • Does your household have access to electricity? (from rechargeable battery up to grid)
To understand the proportion of the observed changes that were not the result of the background development in the region, a difference-in-differences (DD) comparison was made between the intervention site and the control site. This methodology is well established in development econometrics ([33], Chap. 7), is appropriate where the intervention decision is made at the group level (in this case, sub-location) [34] and was applied recently in a study of rural electrification in Peru [35]. The general DD regression formula for a variable V is given in Equation (1):
V = β1I + β2T+ β3(I.T),
where intervention level I and time T are binary coded (0,1) for (control, intervention) and (baseline, endline) respectively. The coefficient β3 is itself the difference between the change over time of the variable in the intervention group and the change over time in the control group. A key assumption is that in the absence of the intervention, changes in variables of interest over time would be very similar. The control trading centre was chosen to be close enough to the intervention site to be starting from a similar baseline situation and likely to experience parallel background developmental changes, but far enough away in order not to be impacted by any electricity-related changes in the intervention community.

2.2. Business Level

To measure and understand the impacts of electrification on livelihoods, micro-enterprise development and sustainability, semi-structured interviews were administered to local businesses in Kitonyoni and Mwania at the same time as the baseline and endline household surveys. There were 19 matched businesses (baseline and endline) in Kitonyoni and 26 matched businesses in Mwania. There were also livelihood and entrepreneurship questions included in the household surveys (for full details, see [36,37]). In this present paper, the questions focused on are:
  • When did you open your business? (year, month)
  • What is your daily expenditure and income?
  • What are your opening hours?
  • What proportion of your customers come from outside the trading centre?

2.3. Community Level

Key informant interviews (KIIs) were undertaken with the head teacher of the school pre- and post-electrification with questions focused on enrolment, school facilities, activities and personnel. school records to enable comparative performance to other schools in the region. Visits to health facilities in the two trading centres were also carried out to assess available services and equipment. This data was supplemented by KIIs with the health facility managers the changes to healthcare provision. For full details, see [31].

2.4. Mini-Grid Level

2.4.1. Community-Based Operation and Governance

The co-operative movement is strong in Kenya and forms a significant part of the economy [38]. Therefore forming a co-operative was a natural choice when choosing an organizational structure for a locally-owned and run electricity supply project with joint business and social aims. After a co-operative was registered with the relevant ministry, the cooperative structure was established including a paid manager and a steering committee with non-paid roles including chairperson, secretary and a treasurer. The co-operative has wider community membership with subscription fees with over 150 members signed up at project inception. Initial income from membership fees provided the cooperative with a seed capital to support the appointment of a manager and a security officer. The tasks of the manager include selling/marketing of electricity to customers, keeping accounts, organizing meetings and assisting with any issues that arise with the project.

2.4.2. Design of the Solar Photovoltaics Power System

It was clear from the reconnaissance visit that, due to the sparsely distributed homesteads, often several hundred meters apart, the mini-grid would be restricted to the trading centre and its immediate environs due to the cost of electrical equipment. Therefore, the majority of connections to the mini-grid would be businesses, rather than households. No significant wind, hydropower or waste biomass resources are available in Kitonyoni (or the control trading centre, Mwania), therefore solar photovoltaics (PV) was selected as the appropriate technology to power the mini-grid project.
Following the baseline survey as well as consultation with the community through local barazas (community meetings), it was estimated that the loads could be met with 13.5 kWp solar PV system with an estimated 28 kWh per day average demand, and 3.2 kW peak load, feeding into a low voltage, single phase mini-grid network (240 VAC). The system was designed to provide a 24-hour, 3 A or 6 A connection (i.e., maximum power of 600 W or 1200 W) for all customers. The project was installed in September 2012, and power was distributed through the mini-grid to all the connected buildings within the trading centre. Power consumption was measured using a combination of pulse-counting kWh meters for accurate energy readings and clip-on current transducers to detect variations in power over time. The data outputs from the installation including, PV generation, battery condition and consumption from the loads was (and continues to be as of January 2019) logged and monitored both locally and remotely. The PV modules were installed on a canopy which provided shading for the office and plant room, a meeting space, as well as harvesting rainwater (Figure 2). A full list of the benefits and also drawbacks of the canopy is included in Table A3 in Appendix B.
For this initial project, the capital investment required for the mini-grid was covered by the grant from the funding body (see Acknowledgements). The initial investment per kW installed lies in the mid-range of the 16 mini-grids surveyed by the World Bank’s Energy Sector Management Assistance Programme [39]. The project was carried out in collaboration with both the Kenyan Ministry of Energy and the Rural Electrification Authority (REA). The co-operative was not required to pay back the investment, but notwithstanding, the financial analysis for the mini-grid did assume that the income to the co-operative would need to cover repayments, in addition to covering on-going operation and maintenance (O&M) costs. A summary of the assumptions used in the financial analysis is given in the first row of Table 2. The income to the co-operative consists of the sale of metered electricity with a kWh tariff; the sale of LED lights and batteries to households; and the sale of rainwater (stored from the canopy). The outgoings consist of operation and maintenance, and deposits to a protected battery replacement savings account. As mentioned above, there are no debt repayments in this case, but there would be in replicated projects. Any surplus may be distributed as dividends to shareholders or used for other ventures within the scope of the co-operative’s constitution. It is important to note that the co-operative is able to set its own electricity tariff that is independent of the national grid tariff structure. As part of the household survey prior to installation, respondents were asked to indicate monthly spend per household for lighting. Figure 3 shows the distribution for all households surveyed (n = 1065), with a median of 280 KES or around 2.8 USD. Over 90% of the households used kerosene as primary fuel for lighting.
To run two 3-watt LED bulbs for five hours per day consumes around 1 kWh per month, therefore an energy tariff (single rate, without a standing charge) of 200 KES/kWh (~2 USD/kWh) would enable a typical customer to save money on lighting compared to the median kerosene spend. This tariff would also provide sufficient income to the co-operative for it to repay the capital investment and cover its running costs. The co-operative initially adopted the tariff suggested by the project team, 200 KES, before the members had experienced using the metered electricity and received their first bill. What happened subsequently, and its effect on the business model, is discussed further in Section 3.4.

3. Results and Discussion

Similarly to Section 2, this section is divided into subsections dealing with the results at household-level, trading centre-level, community-level and the performance of the mini-grid.

3.1. Household-Level Results

3.1.1. Household Expenditure and Perceived Financial Wellbeing

As part of the household surveys, the household head was asked to place their household on a financial wellbeing ladder where on step 1 stood the poorest people and on step 10 stood the richest people. For Kitonyoni, the mean step increased by 0.5 between the surveys in 2011 and 2014 (mean step on the ladder increased from 3.5 to 4.0), while in Mwania the mean step increased by 0.1 (mean step on the ladder increased from 3.7 to 3.8). Perceptions of wealth improved for both groups, but the increase was higher for Kitonyoni. A ‘difference in differences’ model with linear regression on step (assuming step as interval data) gave a change in step of 0.53 following electrification significant at the 5% level (p = 0.0013, see Table 1). This represents a 6% improvement, assuming that the scale can be taken as interval data. This is a small effect, but worth reporting given that the impact on households was indirect (households not directly electrified, only businesses in the trading centre). The head of the household was also asked how satisfied they were with their current financial situation. For the intervention sub-location, a comparison of the survey results before and after electrification shows that the percentage who were ‘fully’ or ‘rather’ satisfied with their current financial situation increased by 25 percentage points, while in the control sub-location the comparative increase was only 8 percentage points. The percentage of households that thought that their income would remain the same or improve in the next 12 months increased by 33 percentage points in the intervention trading centre against only 4 percentage points in the control trading centre, compared to the baseline.
It is also interesting to compare the impact of electricity provision on kerosene use. A ‘difference in differences’ model (see Table 1 for details) indicated a decrease in household kerosene expenditure of 13% relative to the control sub-location following the intervention, but this was not significant at the 5% level (p = 0.069). Using the same model, a decrease of 20% in household expenditure following the intervention was significant (p = 0.009); some of the decrease may be due to reduced lighting costs due to increased electricity access (see Section 3.1.3). Another factor may be reduced transport costs due to improved services in the trading centre (Sections 3.2 and Sections 3.3).

3.1.2. Nutrition

From the household study, relative to Mwania, nutrition improved more in Kitonyoni between 2011 and 2014. The percentage of households with individuals consuming one or more pieces of fruit per day increased by 55 percentage points in Kitonyoni, compared with 30 percentage points in Mwania between 2011 and 2014. A ‘difference in differences’ model (see Table 1) indicated that the amount of pieces of fruit consumed per household increased by 0.52 more than the control sub-location following electrification (p < 0.001). Furthermore, the percentage of households with an adequate or more than adequate food supply increased by 42 percentage points in Kitonyoni while 17 percentage points in Mwania. This may be linked to the greater improvements in satisfaction in income described above.

3.1.3. Access to Electricity

In the household study, respondents were asked whether they had access to any sources of electricity in their household, this was interpreted broadly and could include rechargeable lanterns, deep-cycle batteries, solar home systems, generators or mini-grid connection. It should be emphasized the vast majority of connections to the mini-grid are businesses, rather than households. Household access to electricity increased significantly in both control and intervention groups, but increased more in the intervention group, by 27 percentage points as opposed to 19 percentage points. A ‘difference in differences’ model with linear probability (see Table 1) indicated an increase in probability of access to electricity of 33% following electrification (p < 0.001) and relative to the control sub-location. This can be partly explained by the sale of batteries and rechargeable lanterns by the co-operative and the reduction in cost in charging services in the trading centre.

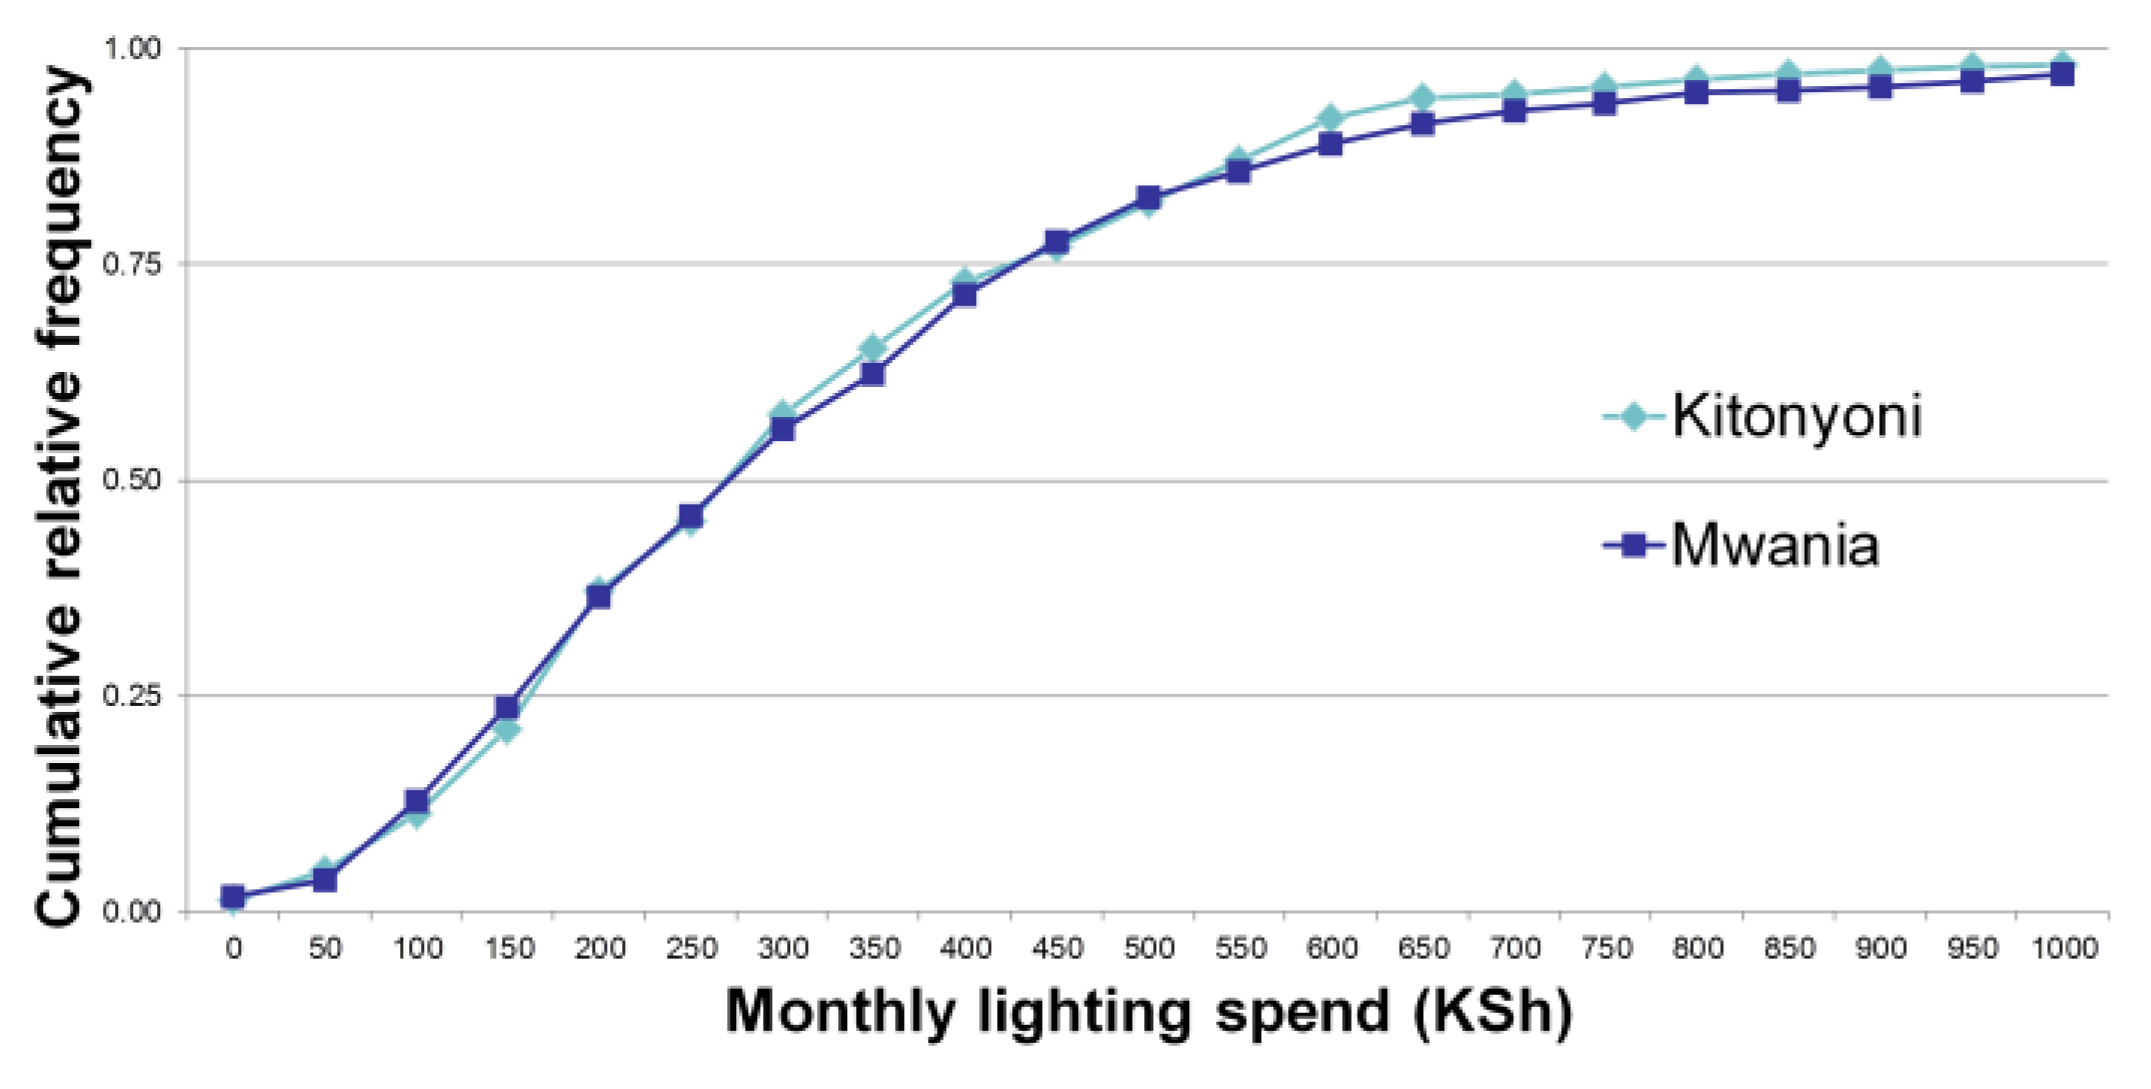
3.2. Trading Centre-Level Results

The number of businesses in Kitonyoni trading centre increased from 28 to 51 between the baseline and endline surveys, whereas in Mwania the number of businesses increased from 27 to 44. In Kitonyoni, the increase in the number of businesses corresponds with new buildings being built in the trading centre (Figure 4).
Businesses reported an increase in trading hours in both trading centres since 2012, but 68% said they opened longer in the case of Kitonyoni versus 50% in the case of Mwania. Reported median daily expenditure and income increased in both trading centres, but again businesses in Kitonyoni fared better, with reported daily expenditure and income of matched businesses increasing by 350 KES and 150 KES more than Mwania, respectively.
Following the provision of electricity, Kitonyoni trading centre has grown as a focal point for the sub-location; in Kitonyoni the percentage of business customers from outside the sub-location increased from 20% to 33% between the baseline and end line surveys, whilst in Mwania the percentage decreased from 17% to 14% between the two surveys. This may be linked to the longer opening hours and the wider range of products and services now offered in Kitonyoni (Figure 5).
It is important to consider possible what, apart from the electrification, might have caused changes in the development Kitonyoni trading centre. For example could the investment made in the project alone have caused the increase in businesses and business income? The initial investment was sunk into the generation and distribution equipment, which remain in place. As will be discussed further in Section 3.4.3, although the co-operative is not required to make debt repayments, the tariff and level of demand are such that the co-operative is not making a large profit, which otherwise might have affected the results.
Another possible cause of change could be enhanced co-operation among the community due to the process of implementing the project. However, rotating credit circles already existed in the communities before the start of the project (this is discussed in [35]). In addition, both the communities already held open meetings to discuss matters arising. So while co-operation may have increased, co-operation was already strong in both trading centres.
A third possible avenue would be the effect of the training given to members of the community as part of the development of the project. The training for the manager and technicians (which will be discussed further in Section 3.4.1) certainly benefited those involved, however the numbers were small (three people initially) and training was given to individuals who already had a higher level of education and/or skill than most people. Therefore it is unlikely that training would account for the changes in Kitonyoni.

3.3. Community-Level Results

3.3.1. Education

Compared to Mwania Primary School, there was no significant change in average attainment score observed after electrification in Kitonyoni’s primary school (Kyaka Primary) (Figure 6). This may be due to the relatively short period of time between the baseline and endline studies (two years).
Nevertheless, there have been some concrete changes due to electrification: the school day in Kyaka Primary is now one hour longer than Mwania Primary, due to lighting in six of its eight classes, which are connected to electricity supply. An interview with the Head of Kyaka Primary post-electrification gave some encouraging qualitative insights: they noted that the number of pupils at the school had increased as parents from other sub-locations were choosing to bring their children to the school:
“…at our school we have electricity. That is why so many other pupils come to this school. That is why this school has a lot of children.”
“Some of the children had not seen electricity. Now they are a step ahead of the [children at] other schools”
“But now we’re very happy because the results now; this school is coming in number one position. Now the school is in that position because of learning very early in the morning [because of electricity].”
—Key Informant Interview, Head teacher, Kyaka Primary.
Note that the ‘number one position’ refers to a ranking of eight local schools. This does not include Mwania Primary, so cannot provide a direct comparison of performance. The Head noted that children often do their homework on the school grounds using the available lighting. The endline household survey indicated that of the households that had bought LED lanterns through the co-operative, 31% said that one of their main uses for the lanterns was for the children to complete their homework.

3.3.2. Healthcare

In Kitonyoni, there have been concrete improvements in the provision of services by the health facility. Health workers are now able to provide better quality of care because of twenty-four-hour reliable artificial lighting:
“Nowadays I am able to work at night if any patient comes to the dispensary, it is easy. Before this, if I am carrying out a delivery at night, there would be no-one to help me hold the torch or lantern”.
—Key Informant Interview, Health worker, Kitonyoni dispensary
The throughput of laboratory testing has been improved with electrification (again due to lighting) meaning that fifty tests can be completed per day instead of twenty. Consistent refrigeration of vaccines is now possible (previously the absorption refrigerator would regularly run out of gas supplies which are centrally-purchased by the health authority). The ability to store vaccines has had benefits for the local community as they do not have to travel so far to access these services.
Once again, the key informant interviews provided insights into the perceived benefits of electrification. Electricity was believed to assist in the recruitment and retention of staff who valued electricity in both the health centre (enabling them to care for people more effectively) and more widely across the trading centre as it made the community more attractive to live in. They also believed that the improved accuracy of laboratory tests and a reduced waiting period for individuals to receive results.

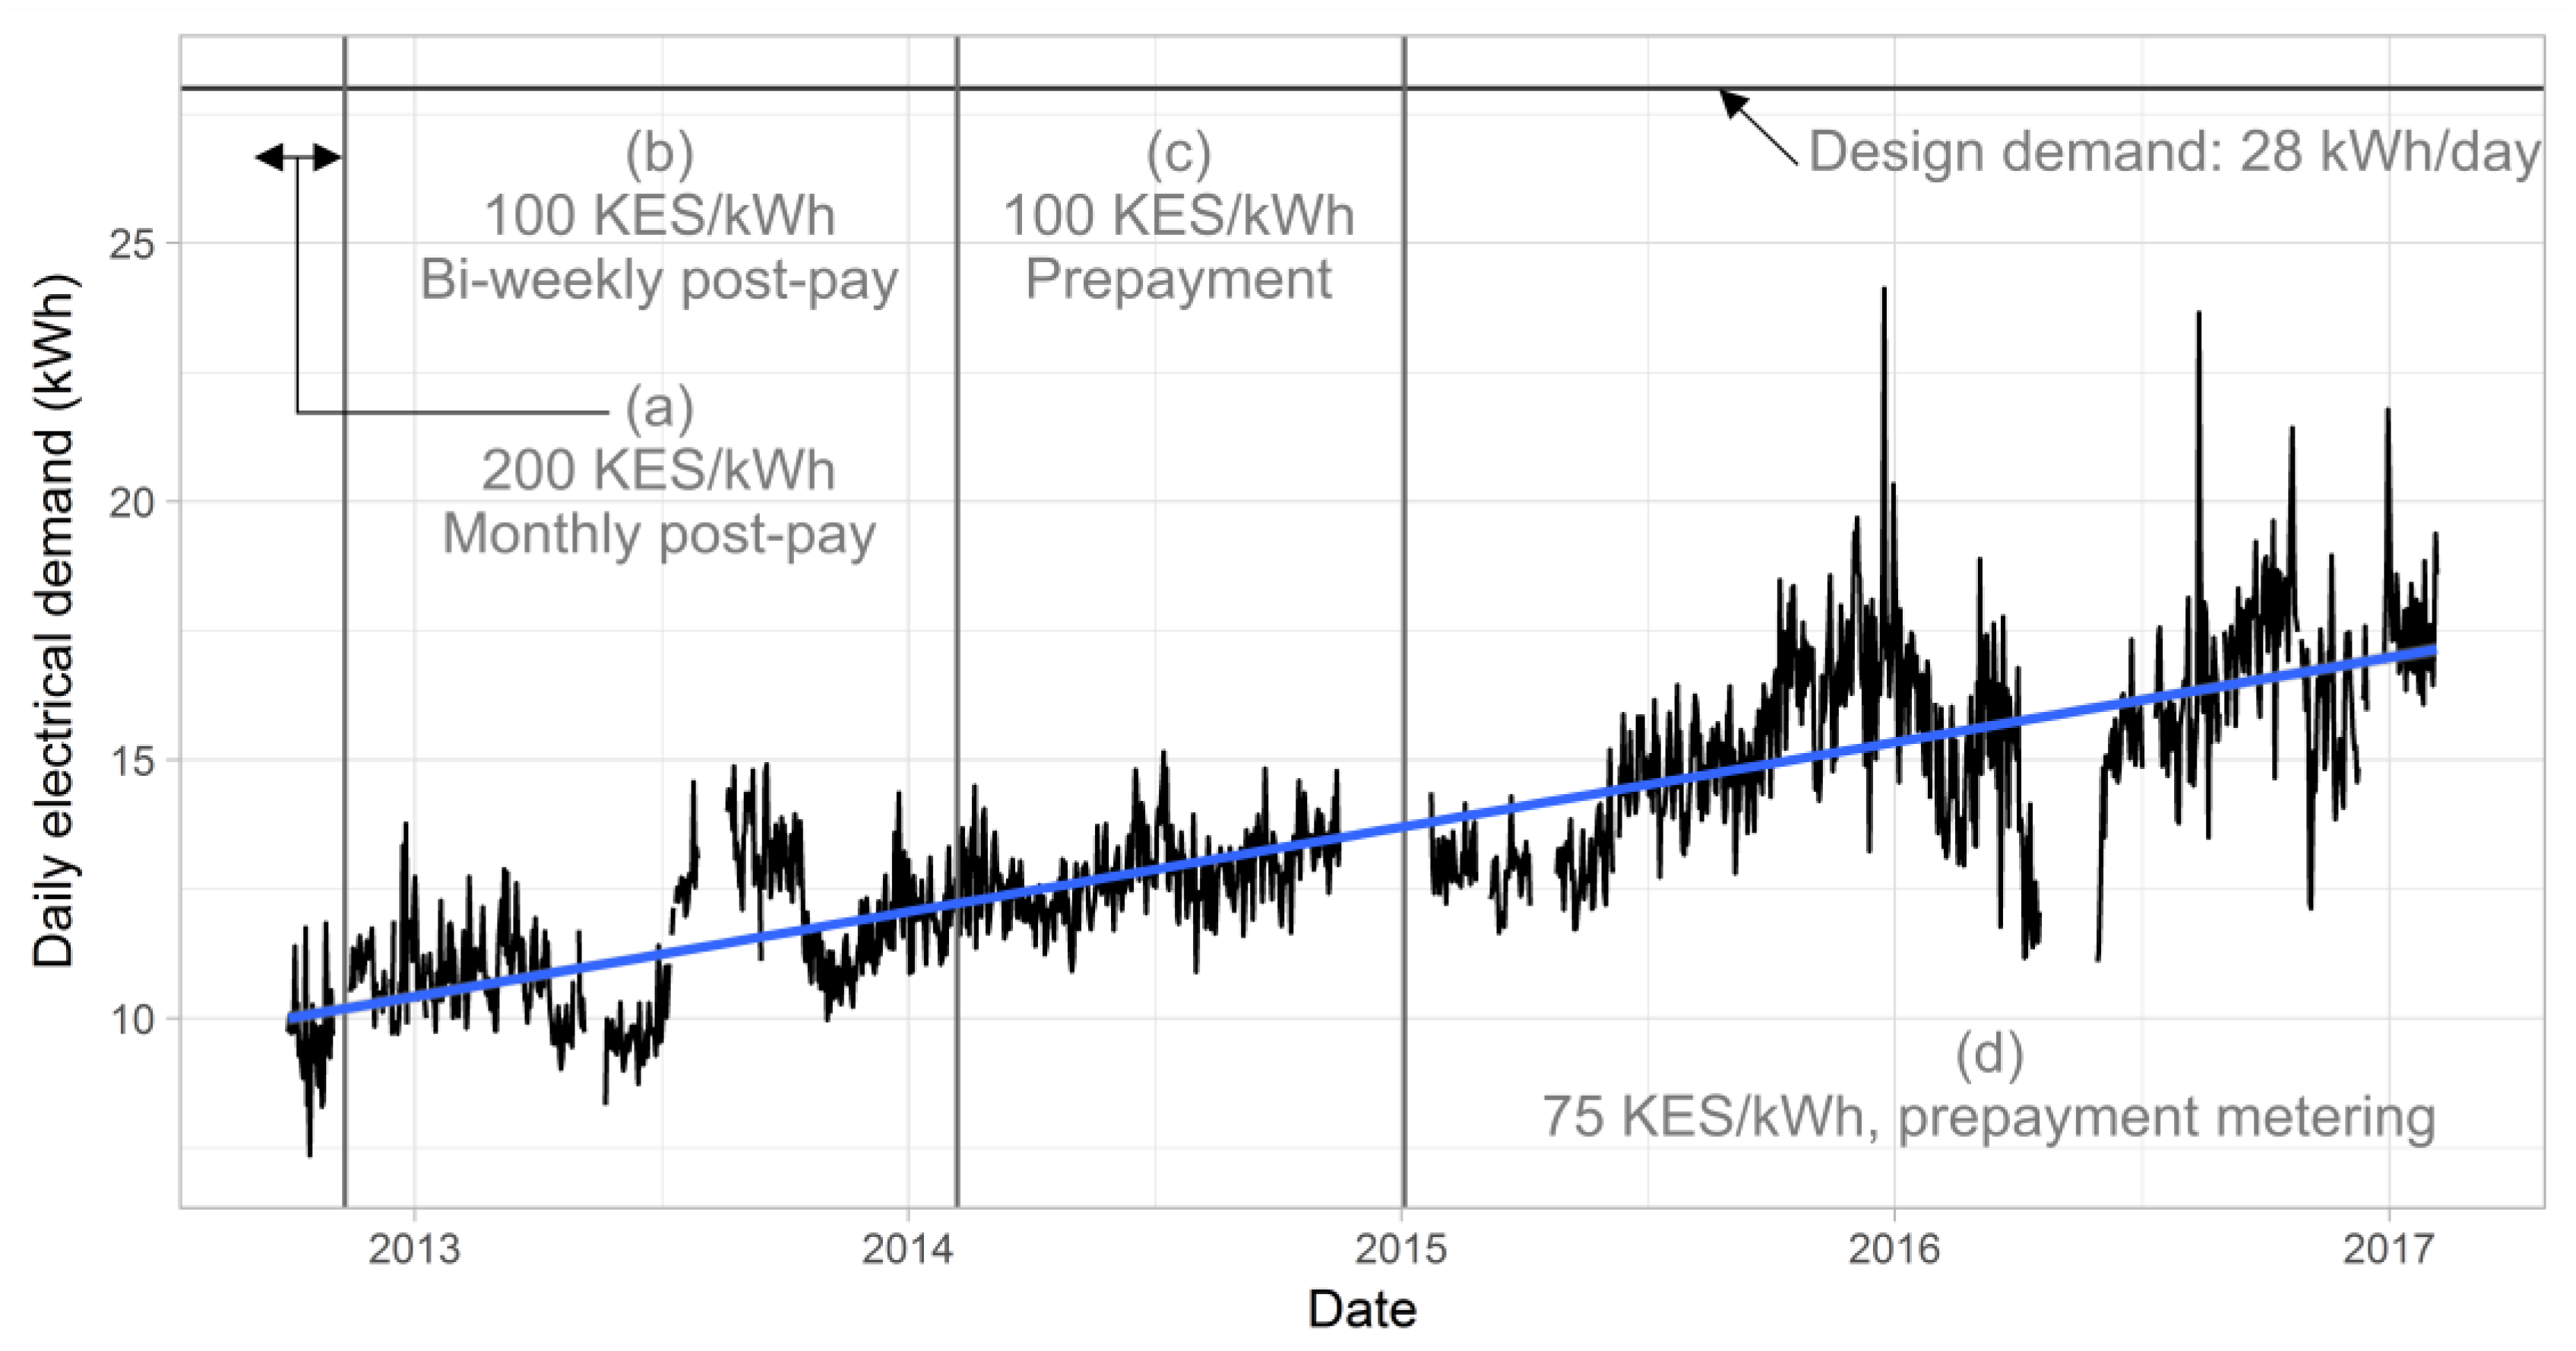
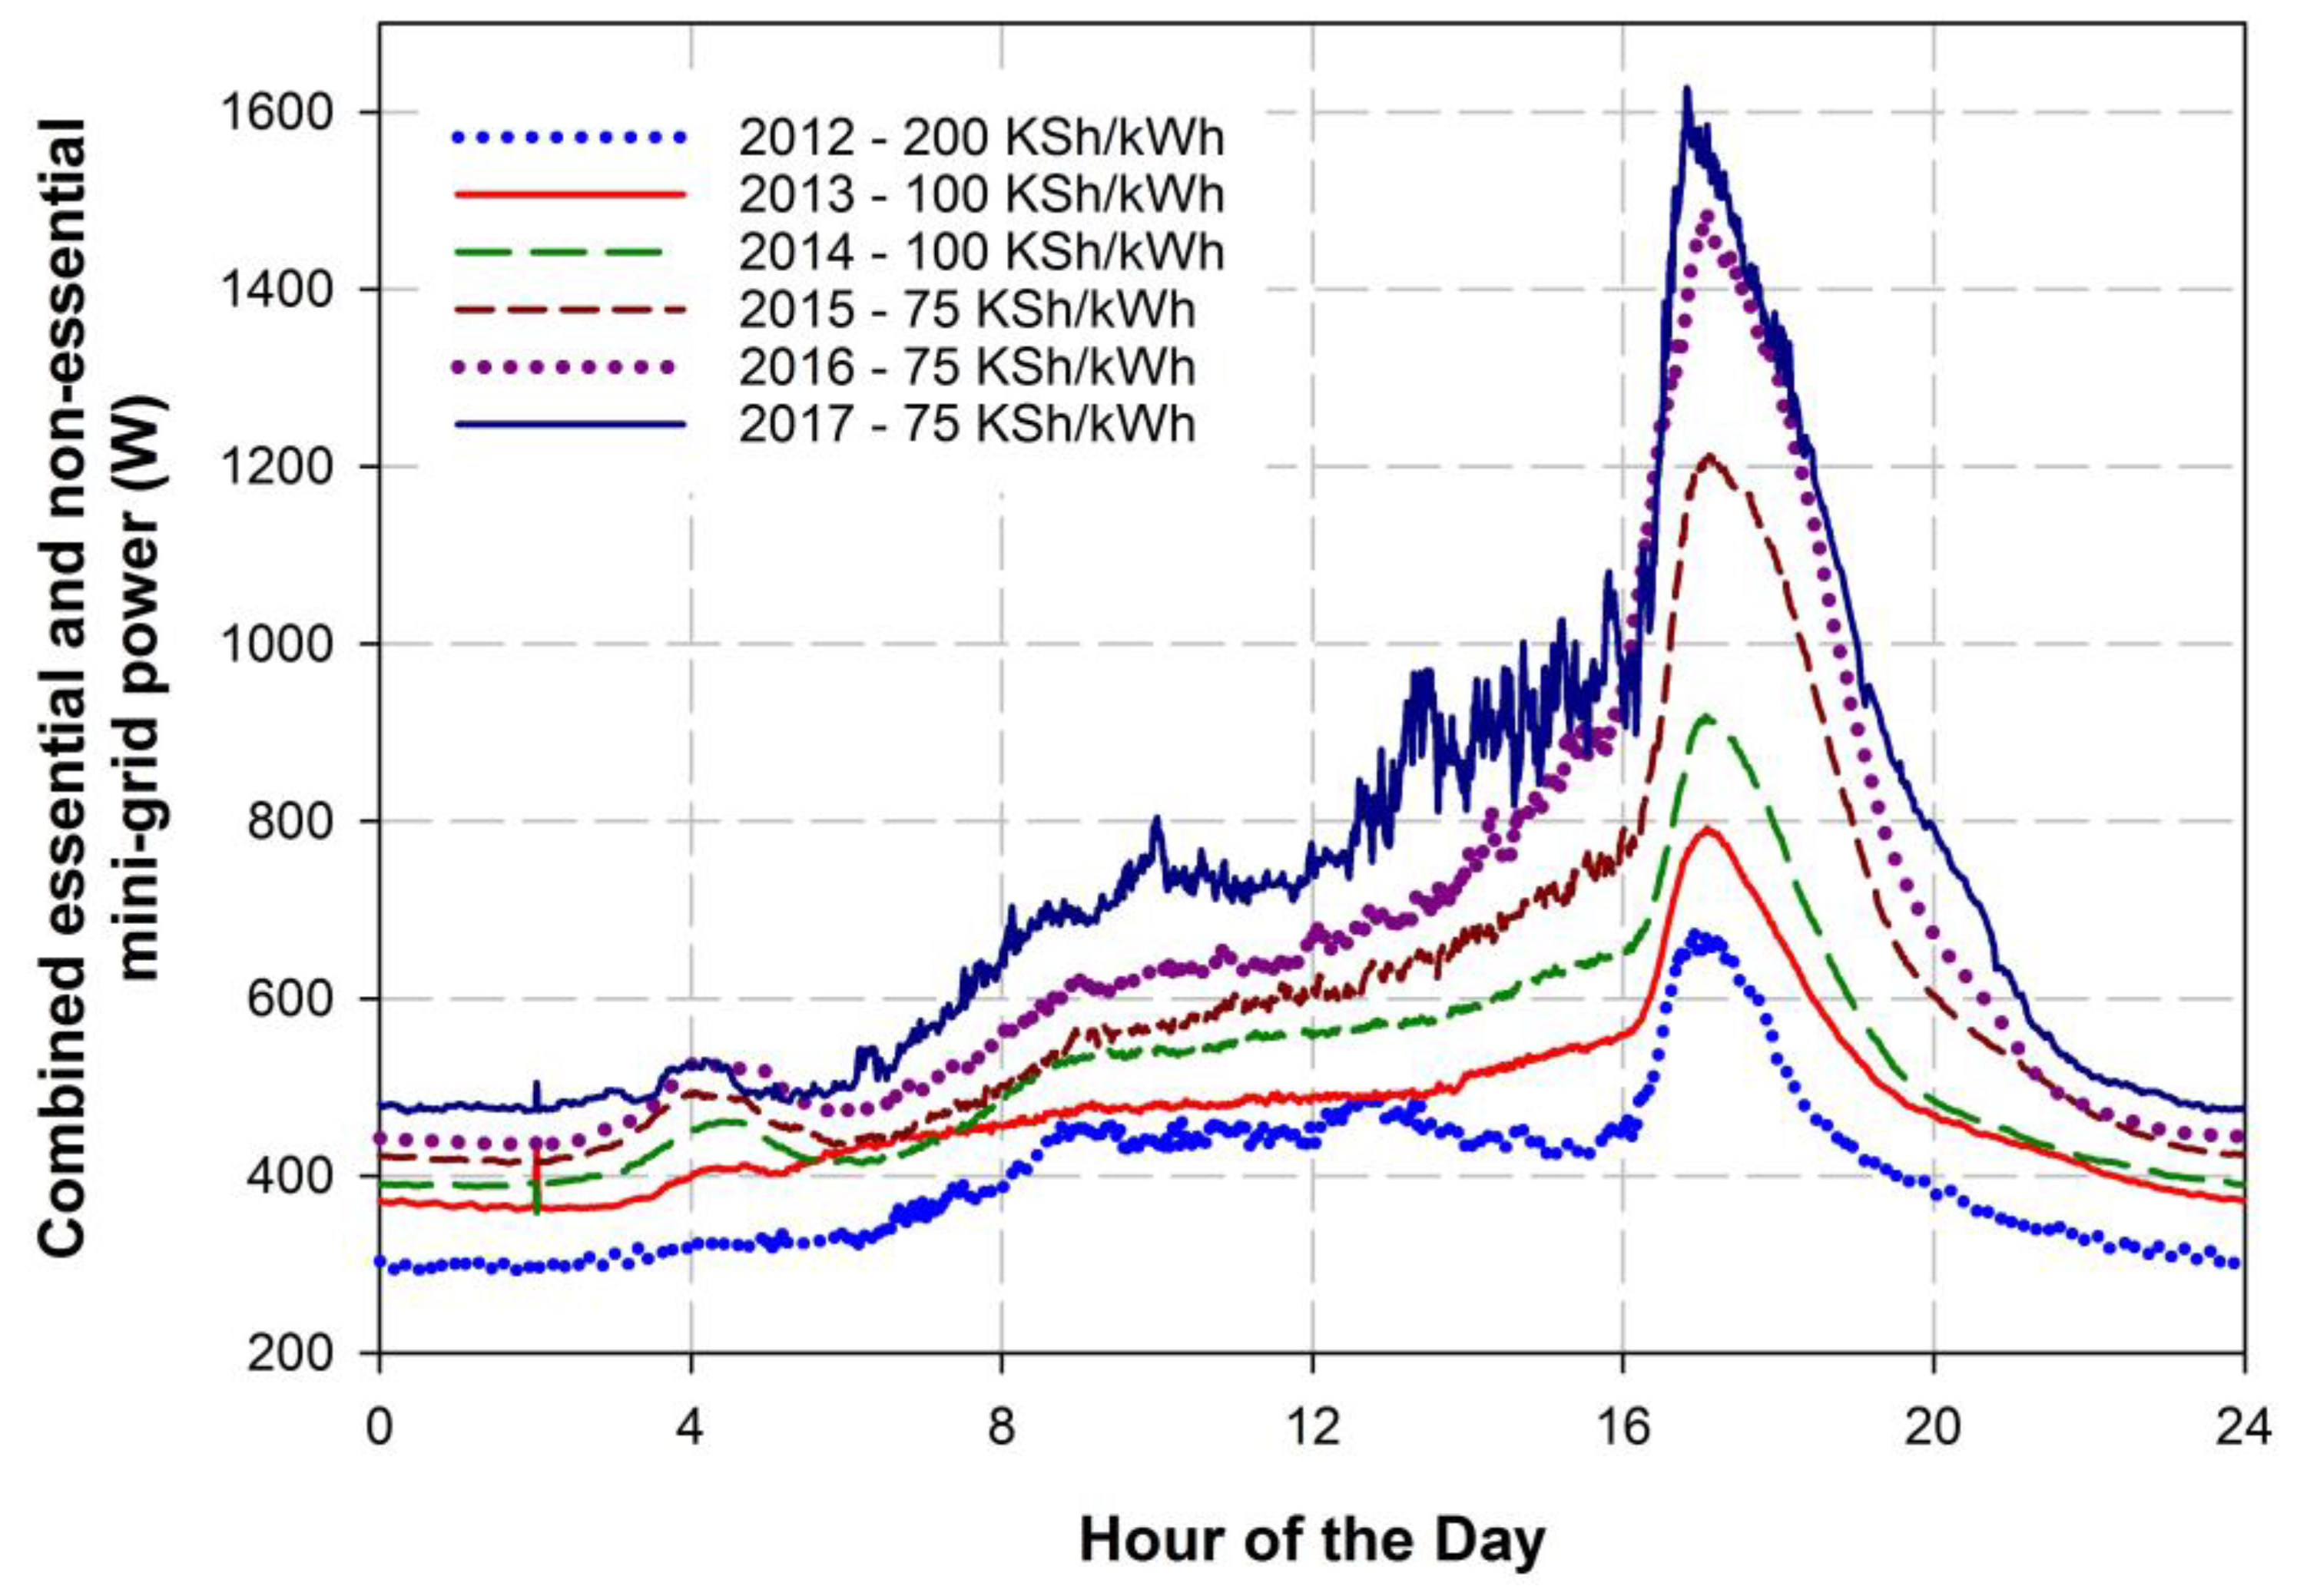
3.4. Mini-Grid Operation

3.4.1. Community-Based Operation and Governance

It was initially planned to use a monthly post-payment system to reduce costs, as it was hoped that the combination of a local manager and community peer pressure would enforce bill payment. However, this proved not to be the case and some businesses were unwilling or unable to pay their bills. Changing from monthly to bi-weekly payments reduced the problem, but did not eradicate it. Therefore, at the beginning of 2014, a pre-payment metering system was retrofitted to the mini-grid, with all transactions taking place in the cooperative office, with electricity credit loaded onto the customers’ smart card after payment This solved the non/late-payment problem and within two months, 97% of bills were paid up-to-date. The median top-up amount is 100 KES (around 1 USD).
A manager was selected by the cooperative after interviewing three applicants and trained in project management, administration, and bookkeeping. When the containers containing the PV system arrived at the trading centre, two local electrical technicians were employed and trained on the project, including the installation, commissioning and operation phases (Figure 7). Their on-going support for the project was secured through a call-out charge paid for by the co-operative. Technical issues beyond the capabilities of these technicians are handled at a secondary level—a video conference call from the manager to the project team and if not resolved, an engineer on day call out fee is sent to the project from Nairobi.
After one year of operation of the project, one of the technicians started his own business near the trading centre selling electrical goods and services. The other is still supporting the project when needs arise. This highlights the difficulty in retaining staff, who are trained as part of a mini-grid project and then—quite rightly—use their new skills to obtain improved employment opportunities elsewhere. The project also trained three managers some of whom have moved on to other jobs in the sub-location.

3.4.2. Design of the Solar Photovoltaics Power System

The first project was designed to be constructed using hand tools and minimizing the need for skilled labour. Since the first project at Kitonyoni, the canopy design has been subject to value-engineering, for examples, the containers can be used to bear the load (rather than using independent columns); local steel stockists and fabricators can provide structural members; and skilled welding on site is readily available [40]. The data from the water level in the tanks indicate that a conservative estimate of water consumption is around two full volumes per year (i.e., one volume per rainy season), leading to an annual income of around 20,000 KES (200 USD) from water sales. This will pay back the cost of the tanks at a 5% discount rate.
System outages have been minimal and only when needed to perform essential maintenance such as connecting new businesses to the mini-grid. Feedback regarding the reliability from businesses has been very positive; by contrast the electrical supply in Wote (nearest electrified large town) is from the authors’ experience subject to short outages every morning and evening.

3.4.3. Business Model

As there were no data available on electricity demand growth prior to installation, we assumed that demand would approach capacity within four years. In reality, daily demand has grown at around 1.6 kWh per annum on average from an initial demand of 10 kWh, and will reach capacity at around 11 years after installation at the current rate. The total daily measured electrical energy demand in Kitonyoni since installation is illustrated in Figure 8.
While there is variability on different time scales, the overall trend in demand appears consistent over the periods (a) to (d). It is interesting to note that variability in the load has increased over time, relative to the trend, particularly in the period (c) to (d). A time series of total daily demand from the trading centre running from November 2013 to November 2014 is included in Appendix C Table A4 and is also available as a supplementary data file (.csv) linked in the Supplementary Materials section.
The energy tariff was initially set at 200 KES/kWh to cover capital repayments at 5% annual interest rate (internal rate of return 13%). It was clear from the low consumption and the feedback of the consumers that the tariff was set too high and after deliberation by the co-operative it was agreed to reduce this to 100 KES/kWh (Figure 8, period (b) and (c)). Demand picked up by 15% in the year after the tariff reduction, but nevertheless pressure from businesses to reduce the tariff continued, and growth in demand remained lower than hoped. Therefore, in 2015 the co-operative membership agreed to reduce the tariff to 75 KES/kWh (Figure 8, period (d)). This tariff will cover ongoing costs, including battery replacement, and 70% of the initial investment at 0% interest rate. However, bearing in mind that this is a one-off prototype system built to a high specification, if the initial investment could be reduced by 50% then the mini-grid would have an internal rate of return of 3% using the actual rate of growth in electrical demand and a tariff of 75 KES. Table 2 summarizes the effect of the tariff changes and the actual growth in electrical demand on the business model as envisaged during the design process. It is important to note that businesses that consume less than 3.5 kWh/month pay less overall than if they were connected to the national grid, because there are no standing charges or other levies [41] applied in the mini-grid. In the last quarter of 2016, 70% of the businesses connected to the mini-grid fell into this category.
Figure 9 shows the mini-grid average daily load profiles corresponding to the tariff regimes given in Figure 8. The average growth in demand is superimposed with a gradual change in shape as the initially flat daytime profile is replaced with a ramp up towards the evening lighting peak. This implies that daytime usage in the trading centre is gradually increasing, which corresponds to increases in productive activities beyond simply lighting.

4. Conclusions

The results from both the household study and the business surveys indicate an overall increase in development in both the control and intervention trading centres between the baseline and endline surveys, but with greater increases in Kitonyoni, where the mini-grid was constructed. The number of businesses, opening hours, proportion of customers from outside the area and business income all increased relative to the control trading centre, as did the perceived wealth of those living in the area surrounding the trading centre. For businesses, electrification in Kitonyoni has opened up new entrepreneurial opportunities—ICT training, tailoring, hairdressing, printing and photocopying, TV and bars—and has facilitated improved productivity for existing businesses. More widely for residents, the trading centre has become a sub-location hub and is more vibrant and active. There have been definite improvements in the provision of education and health services for the population of Kitonyoni following electrification including lengthened school day and faster diagnostic tests at the health centre. There have not been household-level impacts observed in health, but nevertheless nutrition improved in the intervention surrounding area relative to control.
After the installation of the mini-grid, the tariff charged to businesses for electricity was reduced by the mini-grid co-operative, to below a level at which costs could be fully recovered within the lifetime of the project. Nevertheless, for this project the tariff is still at a level where revenue covers staff and maintenance costs and will cover battery replacement, assuming the trend in demand growth continues. The obligation of the co-operative to pay the manager acts as a pressure to maintain tariff levels. The tariff is also higher than the headline figure for the national grid, although due to standing and other charges, many of the mini-grid customers pay less than if they were connected to the grid.
Many international institutions promote the private sector to achieve energy access targets for rural communities. However, from the experience of this project, the private sector on its own is unlikely to achieve this due to its short-term return on investment requirement, and the low ability to pay of the consumers in rural areas, which precludes higher tariffs and leads to low demand for electricity. On the other hand, if the mini-grids are operated directly by national utilities, there will be strong pressure to set tariffs at highly subsidized levels to match those in urban areas.
Currently four new cost-share projects with the Rural Electrification Authorities in Kenya and Uganda have been constructed and are operating, based on the design used at Kitonyoni. These projects provide opportunities to test public-community and public-private partnerships in providing energy access, where for the latter the private sector only provides the power plant and the rest of the infrastructure is provided by the public sector. Further avenues of research being pursued include comparing the four new projects with Kitonyoni and analyzing a wider set of variables than in this present paper using a variety of statistical models including fixed effects.

Supplementary Materials

The following dataset is available with the online version of this paper: S1: Kitonyoni Electrical Demand Nov. 2013–Nov. 2014, https://www.mdpi.com/1996-1073/12/5/778/s1.

Author Contributions

Conceptualization, A.B., P.J. and Z.M.; methodology, Z.M., P.J., A.B., H.E., L.B. and G.G.; software, L.B., C.K.; validation, A.B., L.B., C.K., P.J., I.K., Z.M., H.P., H.E., J.F. and G.G.; formal analysis, L.B.; investigation, H.E., C.K., L.B. and H.P.; data curation, L.B., H.E., C.K., H.P.; resources, I.K.; writing—original draft preparation, A.B., L.B., C.K., P.J., I.K., Z.M., H.P., H.E., J.F. and G.G.; writing—review and editing, L.B., A.B. and H.P.; visualization, L.B., P.J., C.K.; supervision, A.B., J.F. and G.G.; project administration, A.B., J.F. and G.G.; funding acquisition, A.B., J.F., Z.M., P.J. and G.G.

Funding

This work was funded by the UK’s Engineering and Physical Science Research Council (EPSRC), the Research Councils UK Energy Programme and the UK’s Government Department for International Development (DFID) under grant EP/G06394X/1.

Acknowledgments

The communities of Mwania and Kitonyoni in Makueni County, Kenya for supporting the project and participating in surveys. This work is part of the research theme on Energy for Development conducted by the Sustainable Energy Research Group (SERG) and Energy and Climate Change Division at the University of Southampton (energy.soton.ac.uk).

Conflicts of Interest

The authors declare no conflict of interest. The funders had no role in the design of the study; in the collection, analyses, or interpretation of data; in the writing of the manuscript, or in the decision to publish the results.

Appendix A

Table A1. Sub-location selection criteria.
VariableCriteriaReason
Population densityP > 50 people/km2Avoid areas that have transient, semi-nomadic populations
Distance from grid or existing decentralized power system to centroid of sub-locationD > 5 kmAvoid areas where grid connection or infilling is highly likely in the future a
Population density-distance productP.D > 1000Select areas with significant population density but nevertheless far from the existing network
Surrounding constituency indicated as soon to be fully electrified in the 2009 Rural Electrification Masterplan?NoAvoid areas slated for imminent investment in grid extension or decentralized power system
a In retrospect, we would have placed a higher threshold on distance from the grid (perhaps 20 km rather than 5 km) when selecting suitable sites for mini-grids, as due to national policy changes, network expansion has been more rapid than the local officials expected. In addition, the digital maps of the Kenyan distribution network supplied to us by the network operator were out of date a few months after receiving the files, as we found during site visits that the grid had already been extended further than indicated.
Table A2. Shortlisted pre-2010 Districts.
DistrictNumber of Selected Sub-LocationsPopulation of Selected Sub-LocationsLand Area of Selected Sub-Locations (km2)Average Population Density of Selected Areas (people/km2)Indicated in REM as Fully Electrified?
Makueni163826451075No
Kitui73189346469No
Migori102435386282No
Butere/Mumias21151332364No

Appendix B

Table A3. Benefits and drawbacks of canopy-mounted PV array versus a ground-mounted array (by the authors).
CategoryBenefits/Drawbacks
SecurityPV panels and cabling are more difficult to steal and/or vandalize as the access ladder is normally locked in the plant room. In addition, the risk of accidental damage by people or animals (by digging, throwing objects, etc.) is reduced.
ShadingRaising the panels up reduces risk of shading from trees, buildings and other obstructions, which could otherwise result in loss of performance of the array.
Rainwater In a semi-arid area, water is a valuable commodity. Rainwater is stored in two 10000 litre tanks and sold by the co-operative for 10 KES per 20 litre container.
Land useBy housing the plant room and manager’s office underneath the canopy, the total amount of land taken by the facility is minimized. This helps in locations where land ownership is a sensitive issue, such as Kenya.
ShelterThe canopy provides a shaded area used for community meetings. Previously, meetings were held in the open, with limited shade from a tree. Additionally, the canopy shades the plant room, reducing the temperature of the electrical equipment.
Rain splashGround mounted panels would be likely to be exposed to soil thrown up by heavy rain from bare earth surfaces.
CleaningCleaning requires someone to climb up a ladder onto the canopy and clean with a long-handled brush. As the panels are not visible, they are ‘out of sight out of mind’ to a certain extent. Dirty panels would be more obvious and cleaning would be easier and safer on the ground, however risk is minimised by a walkway set into the canopy at a safe distance from the edge. The canopy has sufficient slope that it will self-clean during the rainy seasons.
CostThe canopy and rainwater tanks added 17% to the capital investment requirement for the mini-grid, which is discussed in Section 3.4.

Appendix C

Table A4. Daily electrical demand in kWh for Kitonyoni mini-grid, November 2013–October 2014 (part of the source data for Figure 8).
DayNovemberDecemberJanuaryFebruaryMarchAprilMayJuneJulyAugustSeptemberOctober
0111.1212.3313.0611.8111.6511.8711.2112.8912.5812.7612.5612.83
029.9712.0110.8812.5211.9011.9310.9211.7212.7810.9013.0512.95
0311.2911.1511.6612.5212.1511.7611.1812.9112.5412.0913.0112.19
0410.1311.1010.9112.1012.4412.2112.3713.1313.6912.4413.3011.79
0510.9611.8612.7512.7013.3611.4012.9913.3114.0612.3113.1312.30
0611.2911.0411.9011.8913.6012.5312.1112.4413.7812.3911.6012.82
0710.3910.8712.3111.7113.0812.4311.7312.4514.2713.0112.2912.63
0810.9511.2312.1911.6312.6612.5812.3912.1014.6512.9813.6513.29
0910.4511.0611.9212.7812.4612.1112.5612.6815.1611.7612.6613.16
1011.0012.2612.0413.6812.7711.9012.9012.4413.4712.3312.9413.20
1110.4711.2412.6712.5912.3912.3512.9212.5914.8313.5013.3211.66
1210.2811.5512.0013.2812.5811.2413.0113.0712.6412.6013.5612.59
1310.6511.6011.7811.7811.5511.3912.8813.5312.4911.7411.9213.53
1411.2012.1911.0512.2111.6612.0912.2012.6913.2912.9713.1813.43
1511.5012.7712.0211.6212.0311.9811.9412.4813.7312.3313.6813.18
1611.6111.7212.1413.3512.6812.1011.7213.7612.8111.6513.3113.64
1710.6711.4313.1113.6811.7412.2512.0113.7113.2612.2613.9414.60
1811.1611.3712.2912.8912.7611.7812.1414.8113.1712.7913.4112.70
1910.8611.3611.9214.4913.0811.5312.3214.5311.9812.9913.2213.67
2010.4212.2412.1211.3712.3512.5912.6513.1311.8413.3012.2613.36
2110.2311.3411.6813.1112.7912.1413.7212.6712.9712.9713.3114.36
2210.9813.5911.8912.6311.9912.0812.5514.1413.6012.9914.8313.80
2310.7612.1111.6112.7311.9512.7012.6514.1713.0913.0613.5113.47
2411.1013.3911.6311.9712.2812.2412.4113.8213.1512.6013.0813.52
2511.4014.3611.0513.8213.0413.0812.5113.0912.9212.8113.3413.39
2611.1912.2911.1414.0512.5011.8413.4112.0411.9612.3813.0513.55
2712.2712.0411.8113.1511.8913.0113.7613.7212.3413.3112.3113.36
2810.8711.5812.3912.5112.2712.1512.2112.7612.8712.9213.5912.88
2912.2113.2211.24 11.8812.3112.5312.9112.2912.2913.4013.00
3011.1212.0512.77 12.1511.7812.7113.0412.6112.0812.9713.78
31 12.8813.31 12.42 12.65 13.9512.49 14.04

References

  1. International Energy Agency. World Energy Outlook Energy Access Database. 2017. Available online: http://www.worldenergyoutlook.org/resources/energydevelopment/energyaccessdatabase/ (accessed on 13 January 2019).
  2. Adair-Rohani, H.; Zukor, K.; Bonjour, S.; Wilburn, S.; Kuesel, A.C.; Hebert, R.; Fletcher, E.R. Limited electricity access in health facilities of sub-Saharan Africa: A systematic review of data on electricity access, sources, and reliability. Glob. Health Sci. Pract. 2013, 1, 249–261. [Google Scholar] [CrossRef] [PubMed]
  3. United Nations. Sustainable Development Goals. 2015. Available online: http://www.un.org/sustainabledevelopment/sustainable-development-goals (accessed on 13 January 2019).
  4. Modi, V.; McDade, S.; Lallement, D.; Saghir, J. Energy and the Millennium Development Goals; Energy Sector Management Assistance Programme; United Nations Development Programme, UN Millennium Project, and World Bank: New York, NY, USA, 2006. [Google Scholar]
  5. Sustainable Energy for All. Our Mission. 2017. Available online: http://www.se4all.org/our-mission, (accessed on 13 January 2019).
  6. Szabó, S.; Bódis, K.; Huld, T.; Moner-Girona, M. Energy solutions in rural Africa: Mapping electrification costs of distributed solar and diesel generation versus grid extension. Environ. Res. Lett. 2011, 6, 34002. [Google Scholar] [CrossRef]
  7. Chaurey, A.; Krithika, P.R.; Palit, D.; Rakesh, S.; Sovacool, B.K. New partnerships and business models for facilitating energy access. Energy Policy 2012, 47, 48–55. [Google Scholar] [CrossRef]
  8. Tenenbaum, B.; Greacen, C.; Siyambalapitiya, T.; Knuckles, J. Regulatory Decisions for Small Power Producers Serving Retail Customers: Tariffs and Quality of Service. From the Bottom Up: How Small Power Producers and Mini-Grids Can Deliver Electrification and Renewable Energy in Africa, Directions in Development—Energy and Mining; The World Bank: Washington, DC, USA, 2014; pp. 239–281. [Google Scholar] [CrossRef]
  9. Beyond Connections: Energy access Redefined; ESMAP Technical Report 008/15; World Bank: Washington, DC, USA, 2015; Available online: https://www.esmap.org/node/55526 (accessed on 13 January 2019).
  10. Aklin, M.; Bayer, P.; Harish, S.P.; Urpelainen, J. Does basic energy access generate socioeconomic benefits? A field experiment with off-grid solar power in India. Sci. Adv. 2017, 3, e1602153. [Google Scholar] [CrossRef] [PubMed] [Green Version]
  11. Lenz, L.; Munyehirwe, A.; Peters, J.; Sievert, M. Does Large-Scale Infrastructure Investment Alleviate Poverty? Impacts of Rwanda’s Electricity Access Roll-Out Program. World Dev. 2017, 89, 88–110. [Google Scholar] [CrossRef] [Green Version]
  12. Knuckles, J. Business models for mini-grid electricity in base of the pyramid markets. Energy Sustain. Dev. 2016, 31, 67–82. [Google Scholar] [CrossRef]
  13. Bhattacharyya, S.C.; Palit, D. Mini-Grids for Rural Electrification of Developing Countries: Analysis and Case Studies from South Asia; Springer: Cham, Switzerland, 2014. [Google Scholar]
  14. Bhattacharyya, S.C.; Palit, D. Mini-grid based off-grid electrification to enhance electricity access in developing countries: What policies may be required? Energy Policy 2016, 94, 166–178. [Google Scholar] [CrossRef] [Green Version]
  15. Access to Modern Energy Services for Health Facilities in Resource-Constrained Settings: A Review of Status, Significance, Challenges; World Health Organization: Geneva, Switzerland, 2014; Available online: http://www.who.int/iris/handle/10665/156847 (accessed on 13 January 2019).
  16. Increasing access to Health Workers in Remote and Rural Areas through Improved Retention; World Health Organization: Geneva, Switzerland, 2010; Available online: http://www.who.int/hrh/retention/guidelines/en/ (accessed on 13 January 2019).
  17. Khandker, S.R.; Samad, H.A.; Ali, R.; Barnes, D.F. Who Benefits Most from Rural Electrification? Evidence in India; Policy Research Working Papers; The World Bank: Washington, DC, USA, 2012. [Google Scholar] [CrossRef]
  18. Legros, G.; Rijal, K.; Seyedi, B. Decentralized Energy Access and the Millennium Development Goals; Government of Nepal and UN Development Programme: Rugby, UK, 2012; Available online: http://www.np.undp.org/content/nepal/en/home/library/environment_energy/decentralized-energy-access-and-the-millennium-development-goals/ (accessed on 13 January 2019).
  19. Kirubi, C.; Jacobson, A.; Kammen, D.M.; Mills, A. Community-Based Electric Micro-Grids Can Contribute to Rural Development: Evidence from Kenya. World Dev. 2009, 37, 1208–1221. [Google Scholar] [CrossRef] [Green Version]
  20. Kenya National Bureau of Statistics—KNBS; National AIDS Control Council/Kenya; National AIDS/STD Control Programme/Kenya; Ministry of Public Health and Sanitation/Kenya; Kenya Medical Research Institute. Kenya Demographic and Health Survey 2008-09; KNBS and ICF Macro: Calverton, MD, USA, 2010; Available online: http://dhsprogram.com/pubs/pdf/FR229/FR229.pdf (accessed on 13 January 2019).
  21. Sustainable Energy for All. Urban/Rural Divide. 2014. Available online: https://www.seforall.org/heatmaps/electrification/divide (accessed on 13 January 2019).
  22. Kenya Power and Lighting Company. Kenya Power Annual Report and Financial Statements for the year ended 30 June 2017. November 2017. Available online: http://kplc.co.ke/AR2017/KPLC%202016%20-%202017%20Annual%20Report-.pdf (accessed on 13 January 2019).
  23. Adan, J. Kenya Power new connections charge lowered to Sh15,000. Business Daily. 27 May 2015. Available online: https://www.businessdailyafrica.com/news/Kenya-Power-connections-lowered-to-Sh15-000/539546-2731146-c4g8u/index.html (accessed on 13 January 2019).
  24. Njono, K.S. Pulling Apart or Pooling Together? Exploring Kenya’s Inequality; Kenya National Bureau of Statistics and Society for International Development: Nairobi, Kenya, 2013; Available online: http://inequalities.sidint.net/kenya/abridged/consumption-expenditure/ (accessed on 13 January 2019).
  25. Kenya Power and Lighting Company. Last Mile Connectivity. 2017. Available online: http://www.kplc.co.ke/content/item/1120/last-mile-connectivity (accessed on 13 January 2019).
  26. David, H.; Otuki, N. Longer wait for cheaper Sh15,000 power connection. Daily Nation. 21 February 2017. Available online: https://www.nation.co.ke/business/Longer-wait-for-cheaper-Sh15-000-power-connection/996-3821722-hx3u6s/index.html (accessed on 13 January 2019).
  27. Kenya Power and Lighting Company. Power Interruptions. Available online: http://kplc.co.ke/category/view/50/power-interruptions (accessed on 13 January 2019).
  28. Enterprise Surveys: Kenya Country Profile 2013. World Bank. Available online: http://www.enterprisesurveys.org/~/media/GIAWB/EnterpriseSurveys/Documents/CountryHighlights/Kenya-2013.pdf (accessed on 13 January 2019).
  29. Rural Electrification Masterplan; Final Report; Kenya Ministry of Energy and Kenya Rural Electrification Authority: Nairobi, Kenya, 2009; Volume 1.
  30. Essendi, H.; Nyovani, M.; Matthews, Z. Perceptions of development by residents of a rural community in Kenya: A capability issue. J. Afr. Stud. Dev. 2014, 6, 67–77. [Google Scholar] [CrossRef]
  31. Essendi, H.; Amoako Johnson, F.; Madise, N.; Matthews, Z.; Falkingham, J.; Bahaj, A.; James, P.; Blunden, L. Infrastructural challenges to better health in maternity facilities in rural Kenya: Community and health worker perceptions. Reprod. Health 2015, 12, 1–11. [Google Scholar] [CrossRef] [PubMed]
  32. Gichuki, F.; Mbogoh, S.; Tiffen, M.; Mortimore, M. Makueni District Profile: Synthesis; Drylands Research Working Paper No. 11; Drylands Research: Crewkerne, UK, 2000. [Google Scholar]
  33. Gertler, P.J.; Martinez, S.; Premand, P.; Rawlings, L.B.; Vermeersch, C.M.J. Impact Evaluation in Practice, 2nd ed.; Inter-American Development Bank and World Bank: Washington, DC, USA, 2016. [Google Scholar]
  34. Erin, C.; Strumpf, E.C.; Harper, S.; Kaufman, J.S. Fixed Effects and Difference-in-Differences. In Methods in Social Epidemiology, 2nd ed.; Oakes, J.M., Kaufman, J.S., Eds.; Jossey-Bass: San Francisco, CA, USA, 2017; pp. 341–365. [Google Scholar]
  35. Dasso, R.; Fernandez, F. The effects of electrification on employment in rural Peru. IZA J. Labor Dev. 2015, 4, 1–16. [Google Scholar] [CrossRef]
  36. George, G.; Kotha, R.; Parikh, P.; Alnuaimi, T.; Bahaj, A.S. Social structure, reasonable gain, and entrepreneurship in Africa. Strat. Manag. J. 2016, 37, 1118–1131. [Google Scholar] [CrossRef]
  37. Vernet, A.; Khayesi, J.N.O.; George, V.; George, G.; Bahaj, A.S. How does energy matter? Rural electrification, entrepreneurship, and community development in Kenya. Energy Policy 2019, 126, 88–98. [Google Scholar] [CrossRef]
  38. Kwakyewah, C. Rethinking the Role of Cooperatives in African Development. Inq. J. 2016, 8. Available online: http://www.inquiriesjournal.com/a?id=1419 (accessed on 13 January 2019).
  39. Benchmarking Study of Solar PV Mini Grids Investment Costs: Preliminary Results; Energy Sector Management Assistance Program (ESMAP). World Bank Group: Washington, DC, USA, 2017; p. 8. Available online: http://documents.worldbank.org/curated/en/569621512389752401/Benchmarking-study-of-Solar-PV-mini-grids-investment-costs-preliminary-results (accessed on 13 January 2019).
  40. Energy for Development Network. Current Projects. Available online: http://www.energyfordevelopment.net/current-projects/ (accessed on 13 January 2019).
  41. Kenya Power and Lighting Company. Know your Bill. 2014. Available online: http://kplc.co.ke/knowyourbill/ (accessed on 13 January 2019).
Figure 1. Location of control (Mwania) and intervention (Kitonyoni) sub-locations in Kenya.
Energies 12 00778 g001
Figure 2. PV system in Kitonyoni trading centre where the modules were installed on a canopy that provides shading for the community as well as harvesting rainwater (2 × 10,000 l storage tanks, front right of image).
Energies 12 00778 g002
Figure 3. Cumulative distribution of monthly kerosene spend for all households surveyed in 2012 (n = 1065) with a median of 280 KES for both sub-locations (or ~2.80 USD).
Energies 12 00778 g003
Figure 4. (a) Kitonyoni trading centre in 2012, prior to energy access intervention. Red square is the (future) location of the solar power plant; (b) Kitonyoni trading centre in October 2013, 1 year after the installation of the solar mini-grid.
Energies 12 00778 g004
Figure 5. New services provided in Kitonyoni following electrification. The sign reads “Instant photos, Instant passport [photos], Photocopy, Scanning Now Available.”.
Energies 12 00778 g005
Figure 6. Mean attainment scores at primary schools in Kitonyoni and Mwania pre and post intervention, at Kenyan standard levels 1–8. The standard levels are Kenyan primary school ‘years’ (Standard Level 1 is the first year, corresponding to age 5–7 years old, while Standard Level 8 corresponds to 12–14 years old). Note that this is under the 8-4-4 system.
Energies 12 00778 g006
Figure 7. PV system on canopy where local engineers were trained as the project installation progressed and systems were commissioned.
Energies 12 00778 g007
Figure 8. Details of the Kitonyoni kWh tariff charged by the co-operative; payment collection method and impacts on the consumption over the periods (a) to (d) end Sep 2012 to end of Jan 2017. Gaps correspond to no recorded data due to issues with data logging equipment.
Energies 12 00778 g008
Figure 9. Average daily load profile in Kitonyoni corresponding to the periods (a), (b), (c) and (d) and years of operation as shown in Figure 9.
Energies 12 00778 g009
Table 1. Summary of ‘difference in difference’ model results from household surveys in 2012 and 2014.
Dependent Variable a
ln(HH expenditure)ln(paraffin exp.)Step of wealth ladderPieces of fruit per dayAccess to Electricity
(OLS)(OLS)(OLS)(OLS)(linear probability OLS)
Intervention group (0 or 1)0.0120.135**−0.313 ***−0.0180.082 **
(−0.113, 0.137)(0.026, 0.244)(−0.539, −0.087)(−0.100, 0.063)(0.018, 0.145)
Time (0 or 1)0.388 ***0.0420.0620.309***−0.012
(0.267, 0.508)(−0.061, 0.145)(−0.156, 0.280)(0.231, 0.387)(−0.067, 0.043)
Intervention: Time−0.235 ***−0.143 *0.526***0.516***0.334 ***
(−0.412, −0.058)(−0.298, 0.011)(0.206, 0.846)(0.401, 0.631)(0.217, 0.451)
Constant8.398 ***5.328 ***3.753 ***0.113 ***0.316 ***
(8.312, 8.483)(5.256, 5.401)(3.599, 3.907)(0.058, 0.169)(0.273, 0.360)
Observations16741250167616781672
R20.0290.0050.0150.2280.043
Adjusted R20.0280.0030.0130.2270.042
Residual Std. Error0.921 (df = 1670)0.692 (df = 1246)1.667 (df = 1672)0.599 (df = 1674)0.468 (df = 1668)
F Statistic16.882 ***
(df = 3; 1670)
2.085
(df = 3; 1246)
8.316 ***
(df = 3; 1672)
165.201 ***
(df = 3; 1674)
25.226 ***
(df = 3; 1668)
Note: 95% C.I. in brackets under parameter. * p < 0.1; ** p < 0.05; *** p < 0.01; a See Equation (1) for details of DD general regression formula.
Table 2. Business model assumptions and outcomes under different scenarios
CaseCapital as Fraction of originalProject Lifetime (years)Growth in daily demand in t years (kWh)Tariff (KES)Battery life (years) aIRR (%) bNPV with 5% Discount Rate (100,000 KES) b
As designed, predicted growth and tariff100%20min(7t, 28)20010 1394.6
As designed, lower tariff100%20min(7t, 28)7510 0(−50.0)
Actual demand and tariff100%20min(7.5 + 1.5t, 28)75 15 (expected)(−2)(−64.0)
As above, no canopy83% 20min(7.5 + 1.5t, 28)7515 (expected)(−1)(−47.0)
Aggressive cost reductions50% 20min(7.5 + 1.5t, 28)7515 (expected)3(−13.0)
As above, higher tariff50%20min(7.5 + 1.5t, 28)10015 (expected)710.0
a The analysis assumes a proportion of income is saved each year at an interest rate of 2% up to the year where battery replacement is required. b OMM costs (excluding battery replacement) are assumed to be 2% of initial capital investment. This is conservative from the experience of the Kitonyoni project.

