Nanofluid-Powered Dual-Fluid Photovoltaic/Thermal (PV/T) System: Comparative Numerical Study


Abstract
:1. Introduction
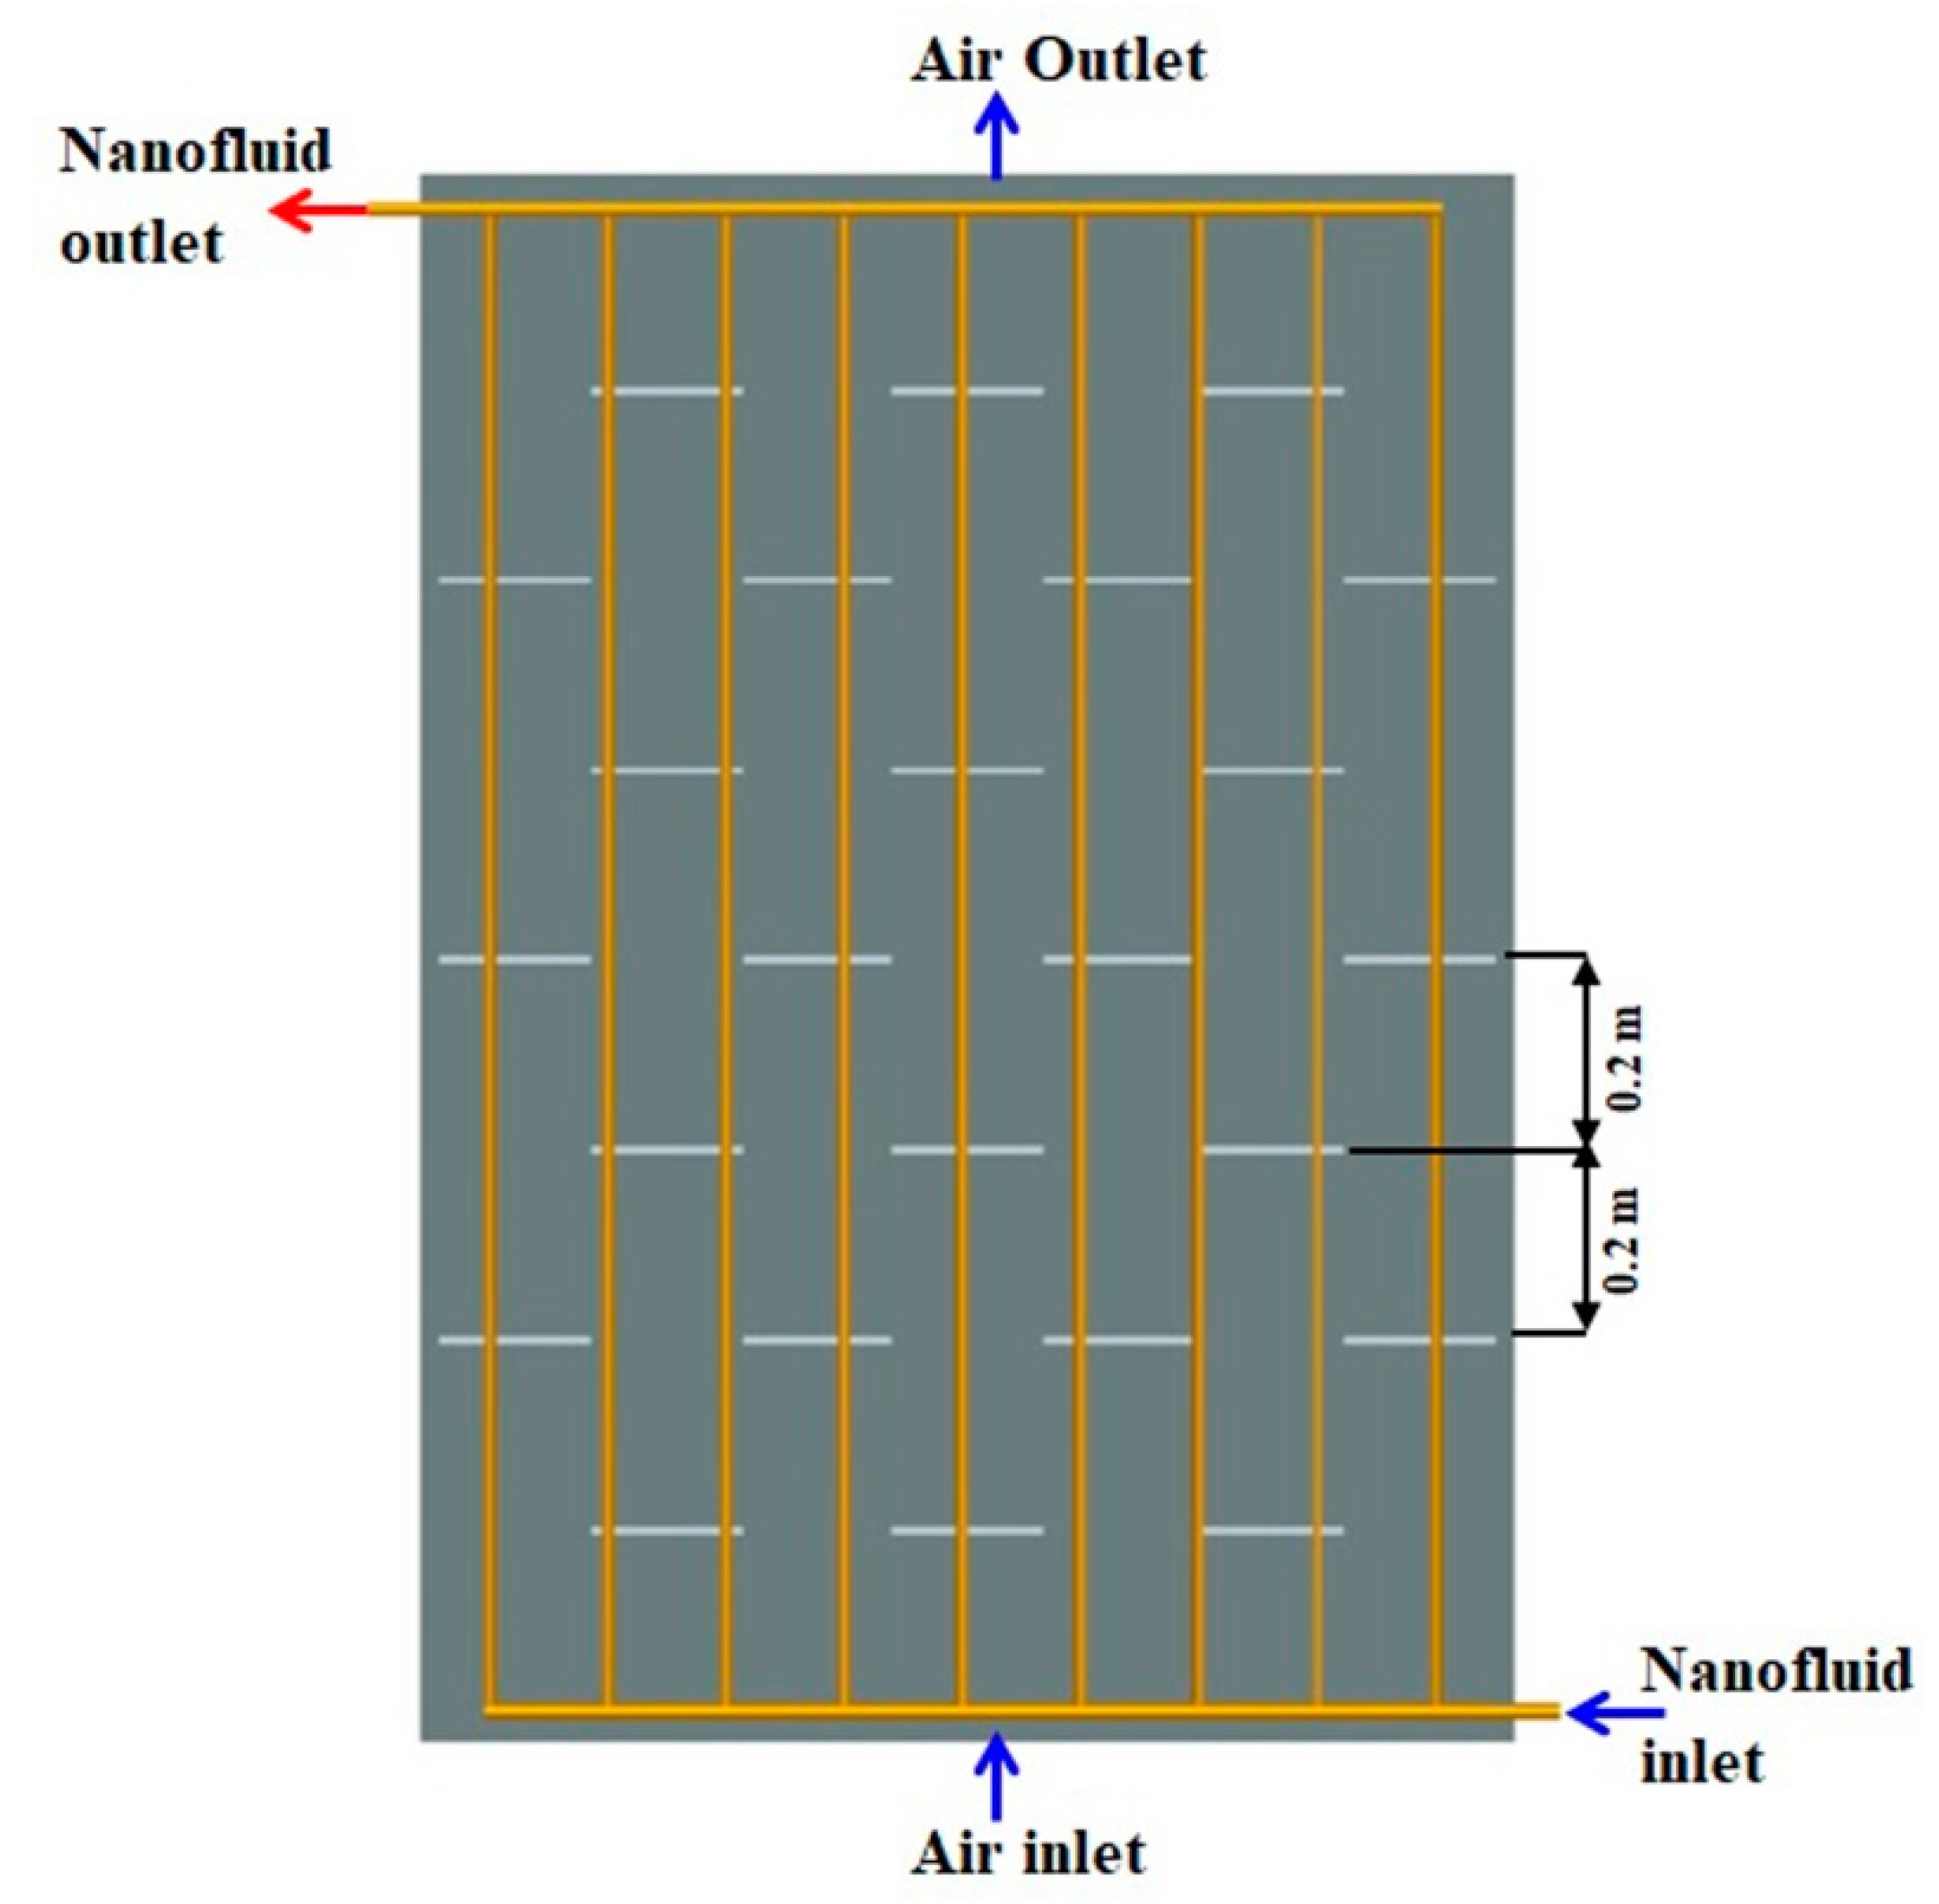
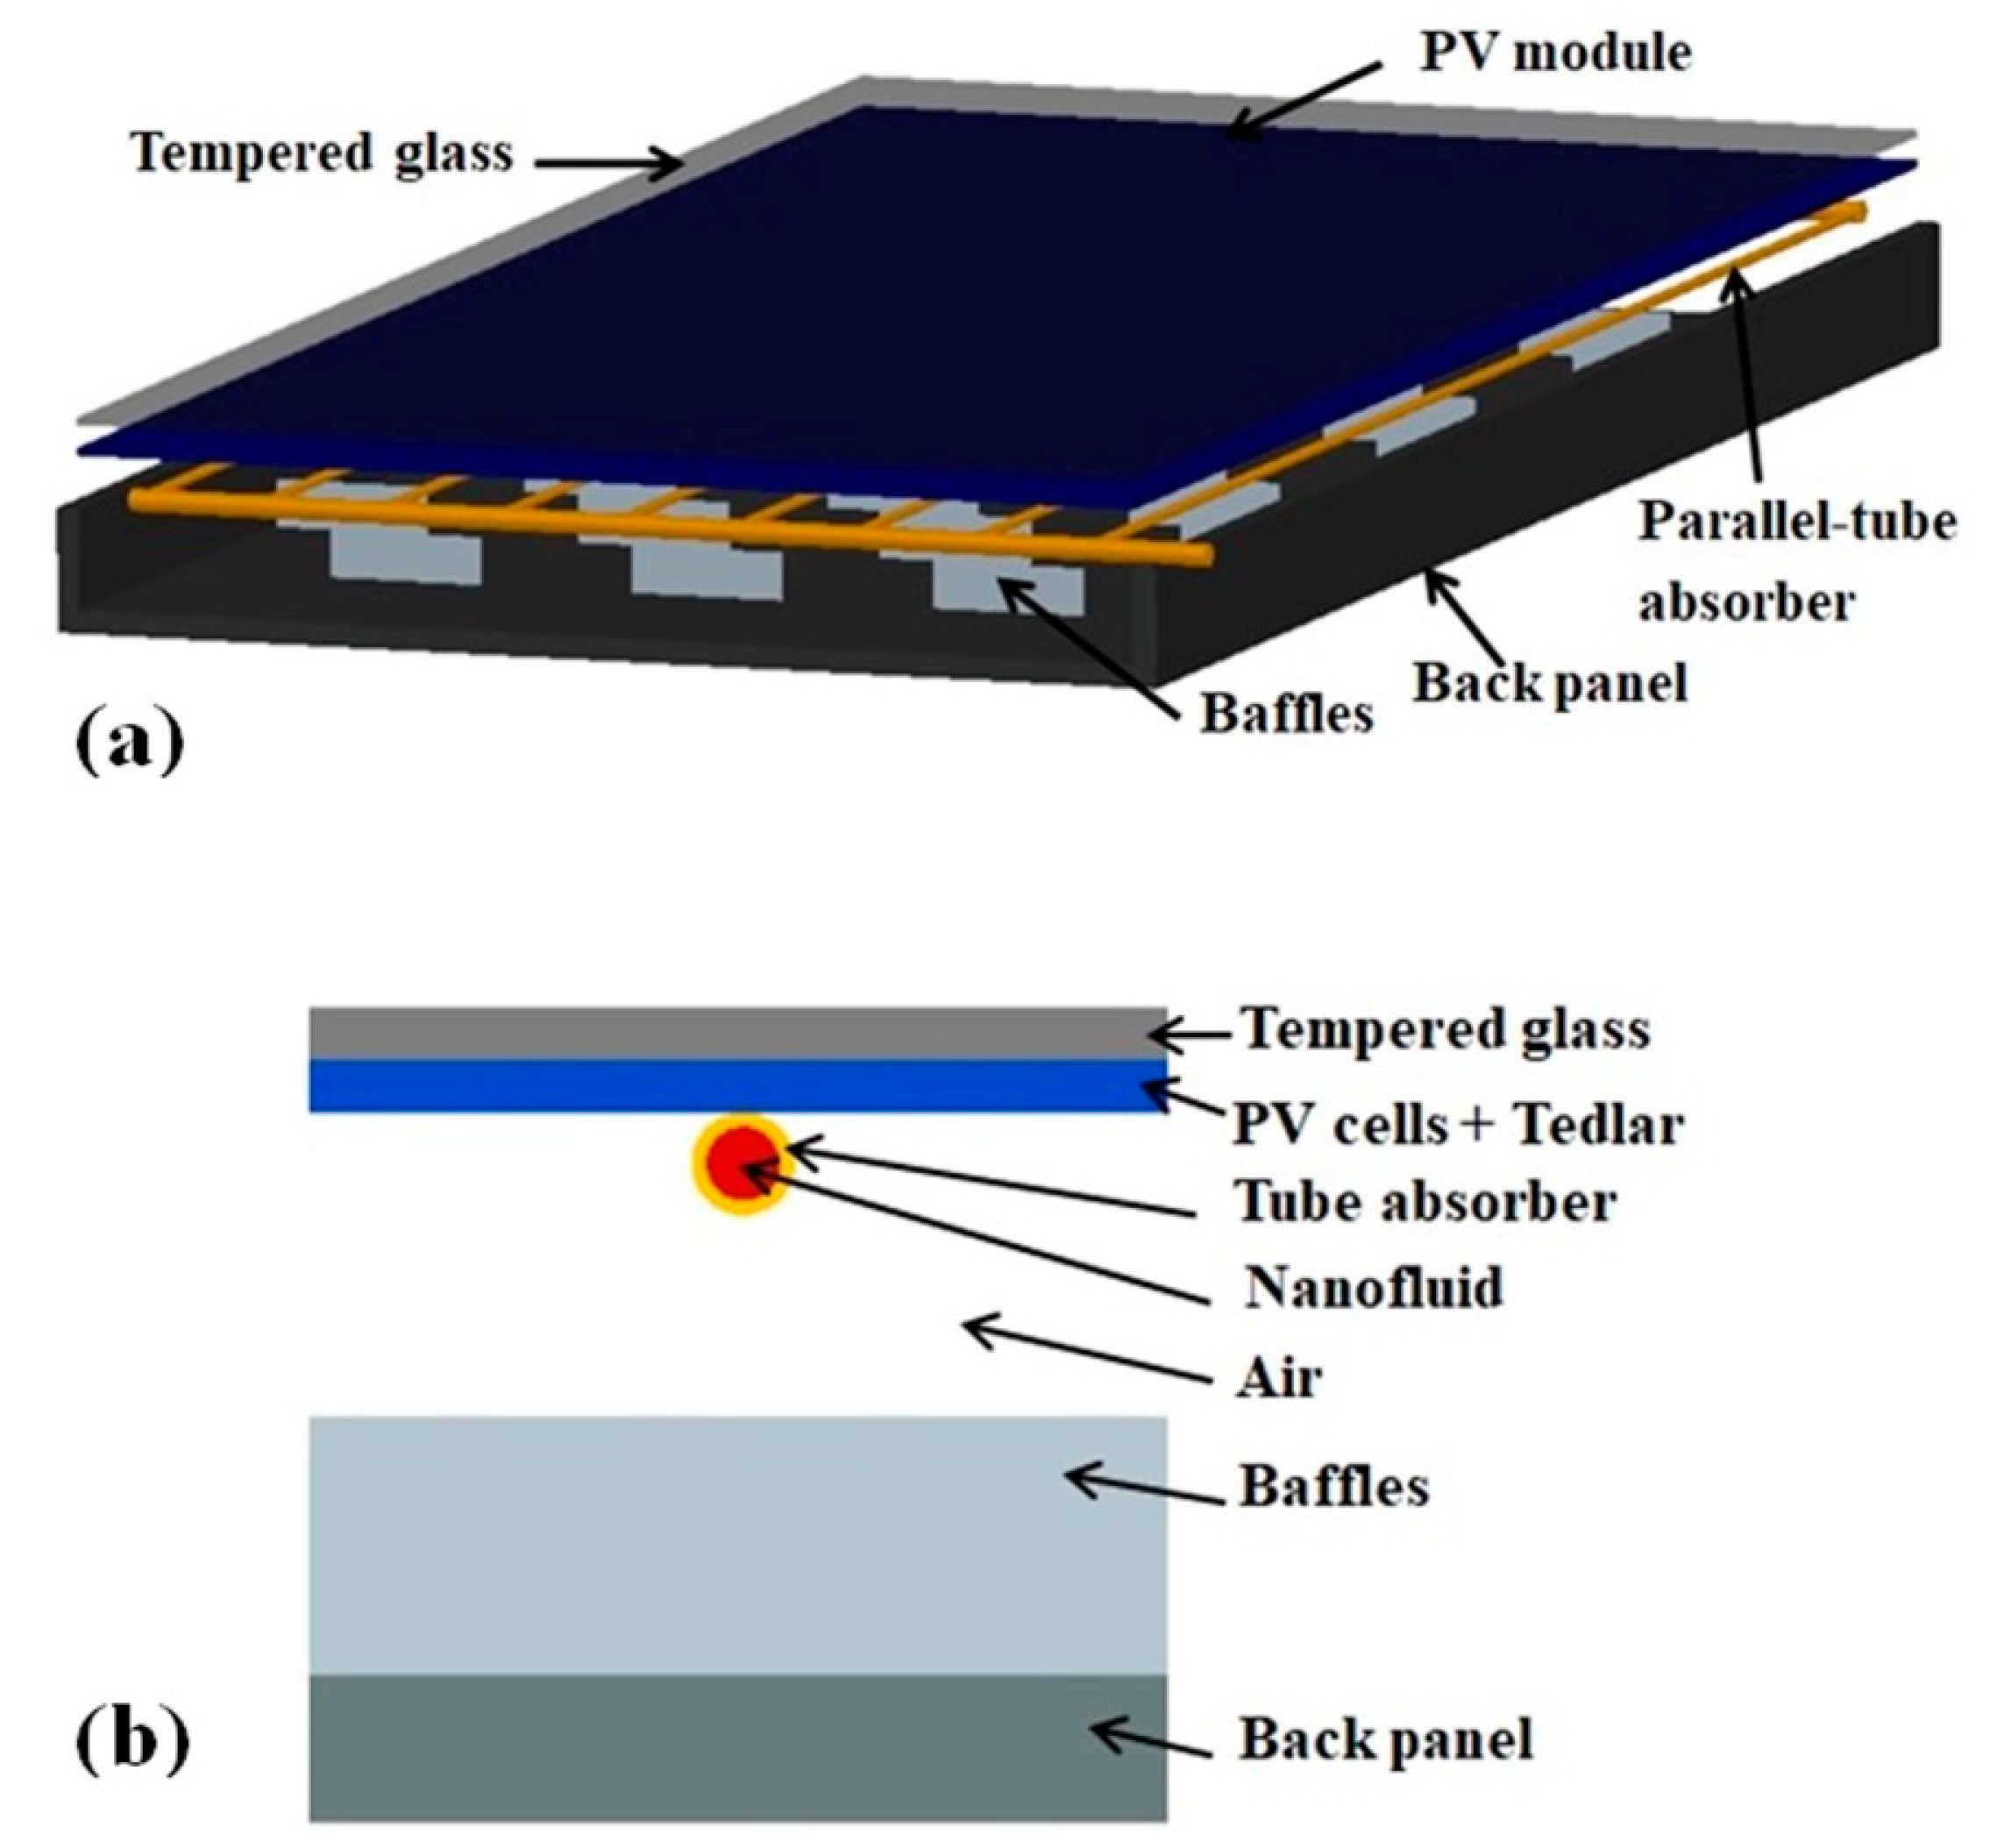
2. Collector Design
3. Mathematical Model
3.1. PV Plate
3.2. Absorber Tube
3.3. Back Plate
4. CFD Model
4.1. Numerical Scheme
4.2. Boundary Conditions and Grid Study
5. Results and Discussion
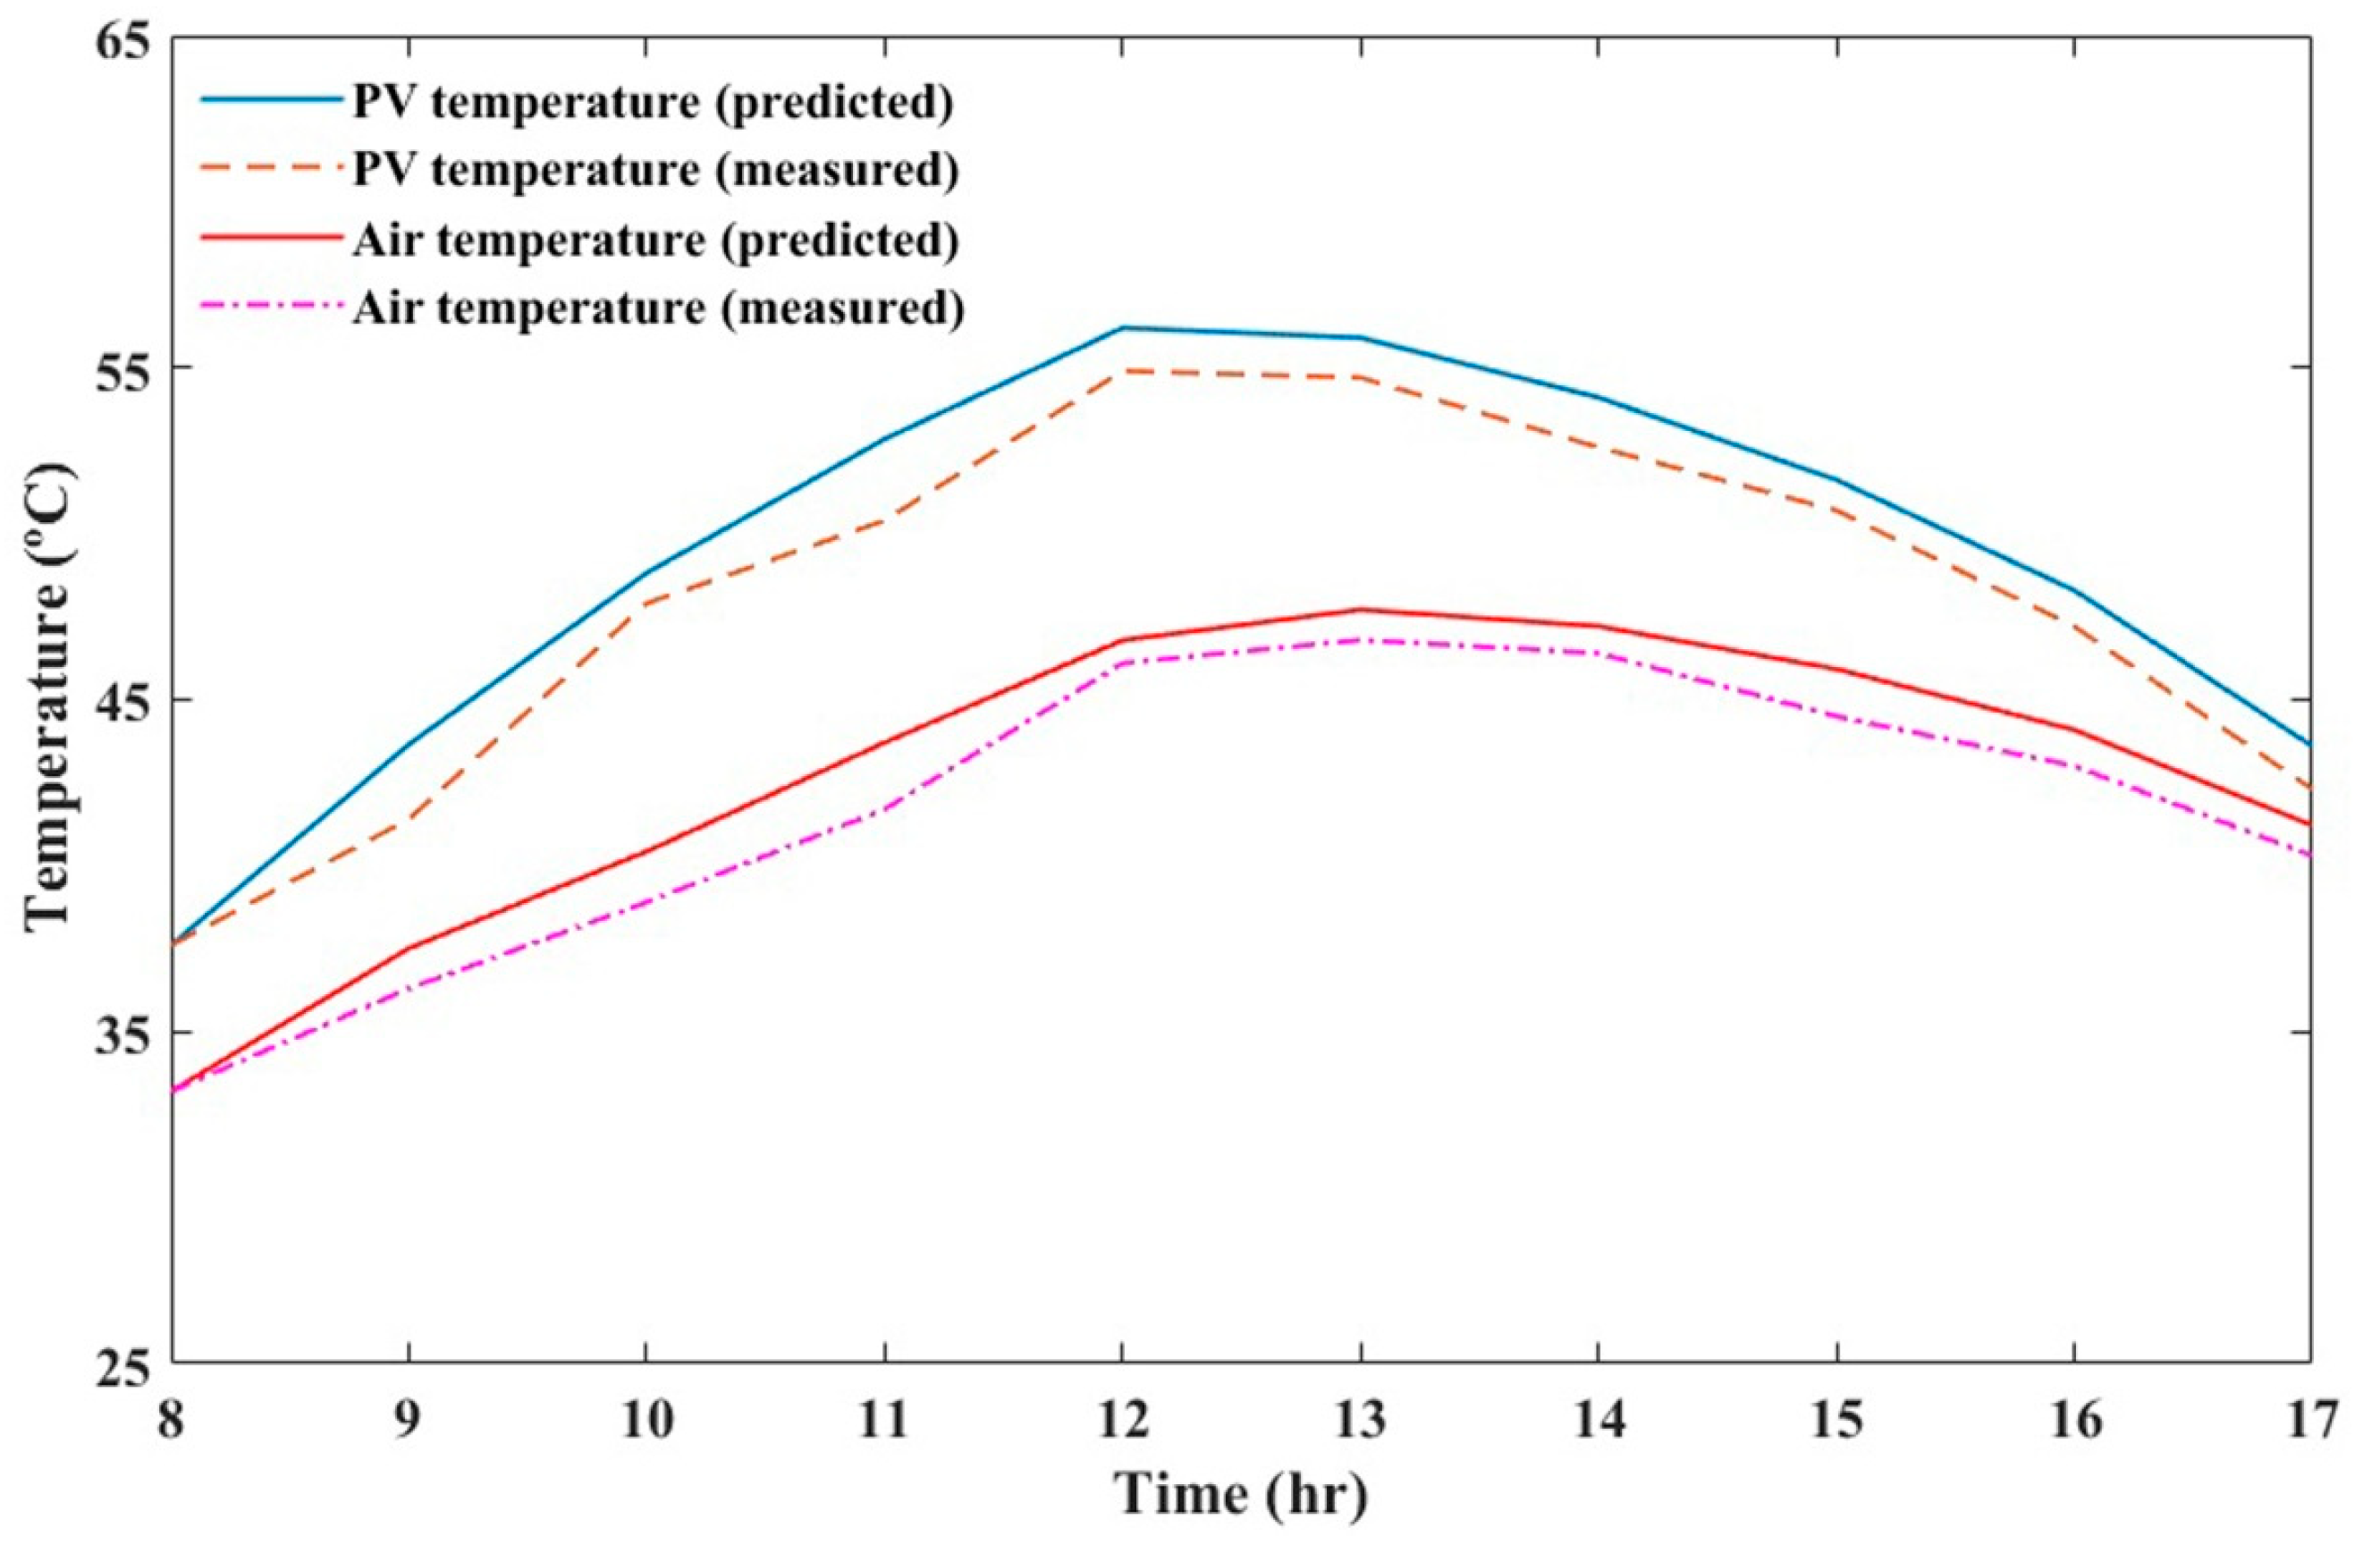
5.1. Model Validation
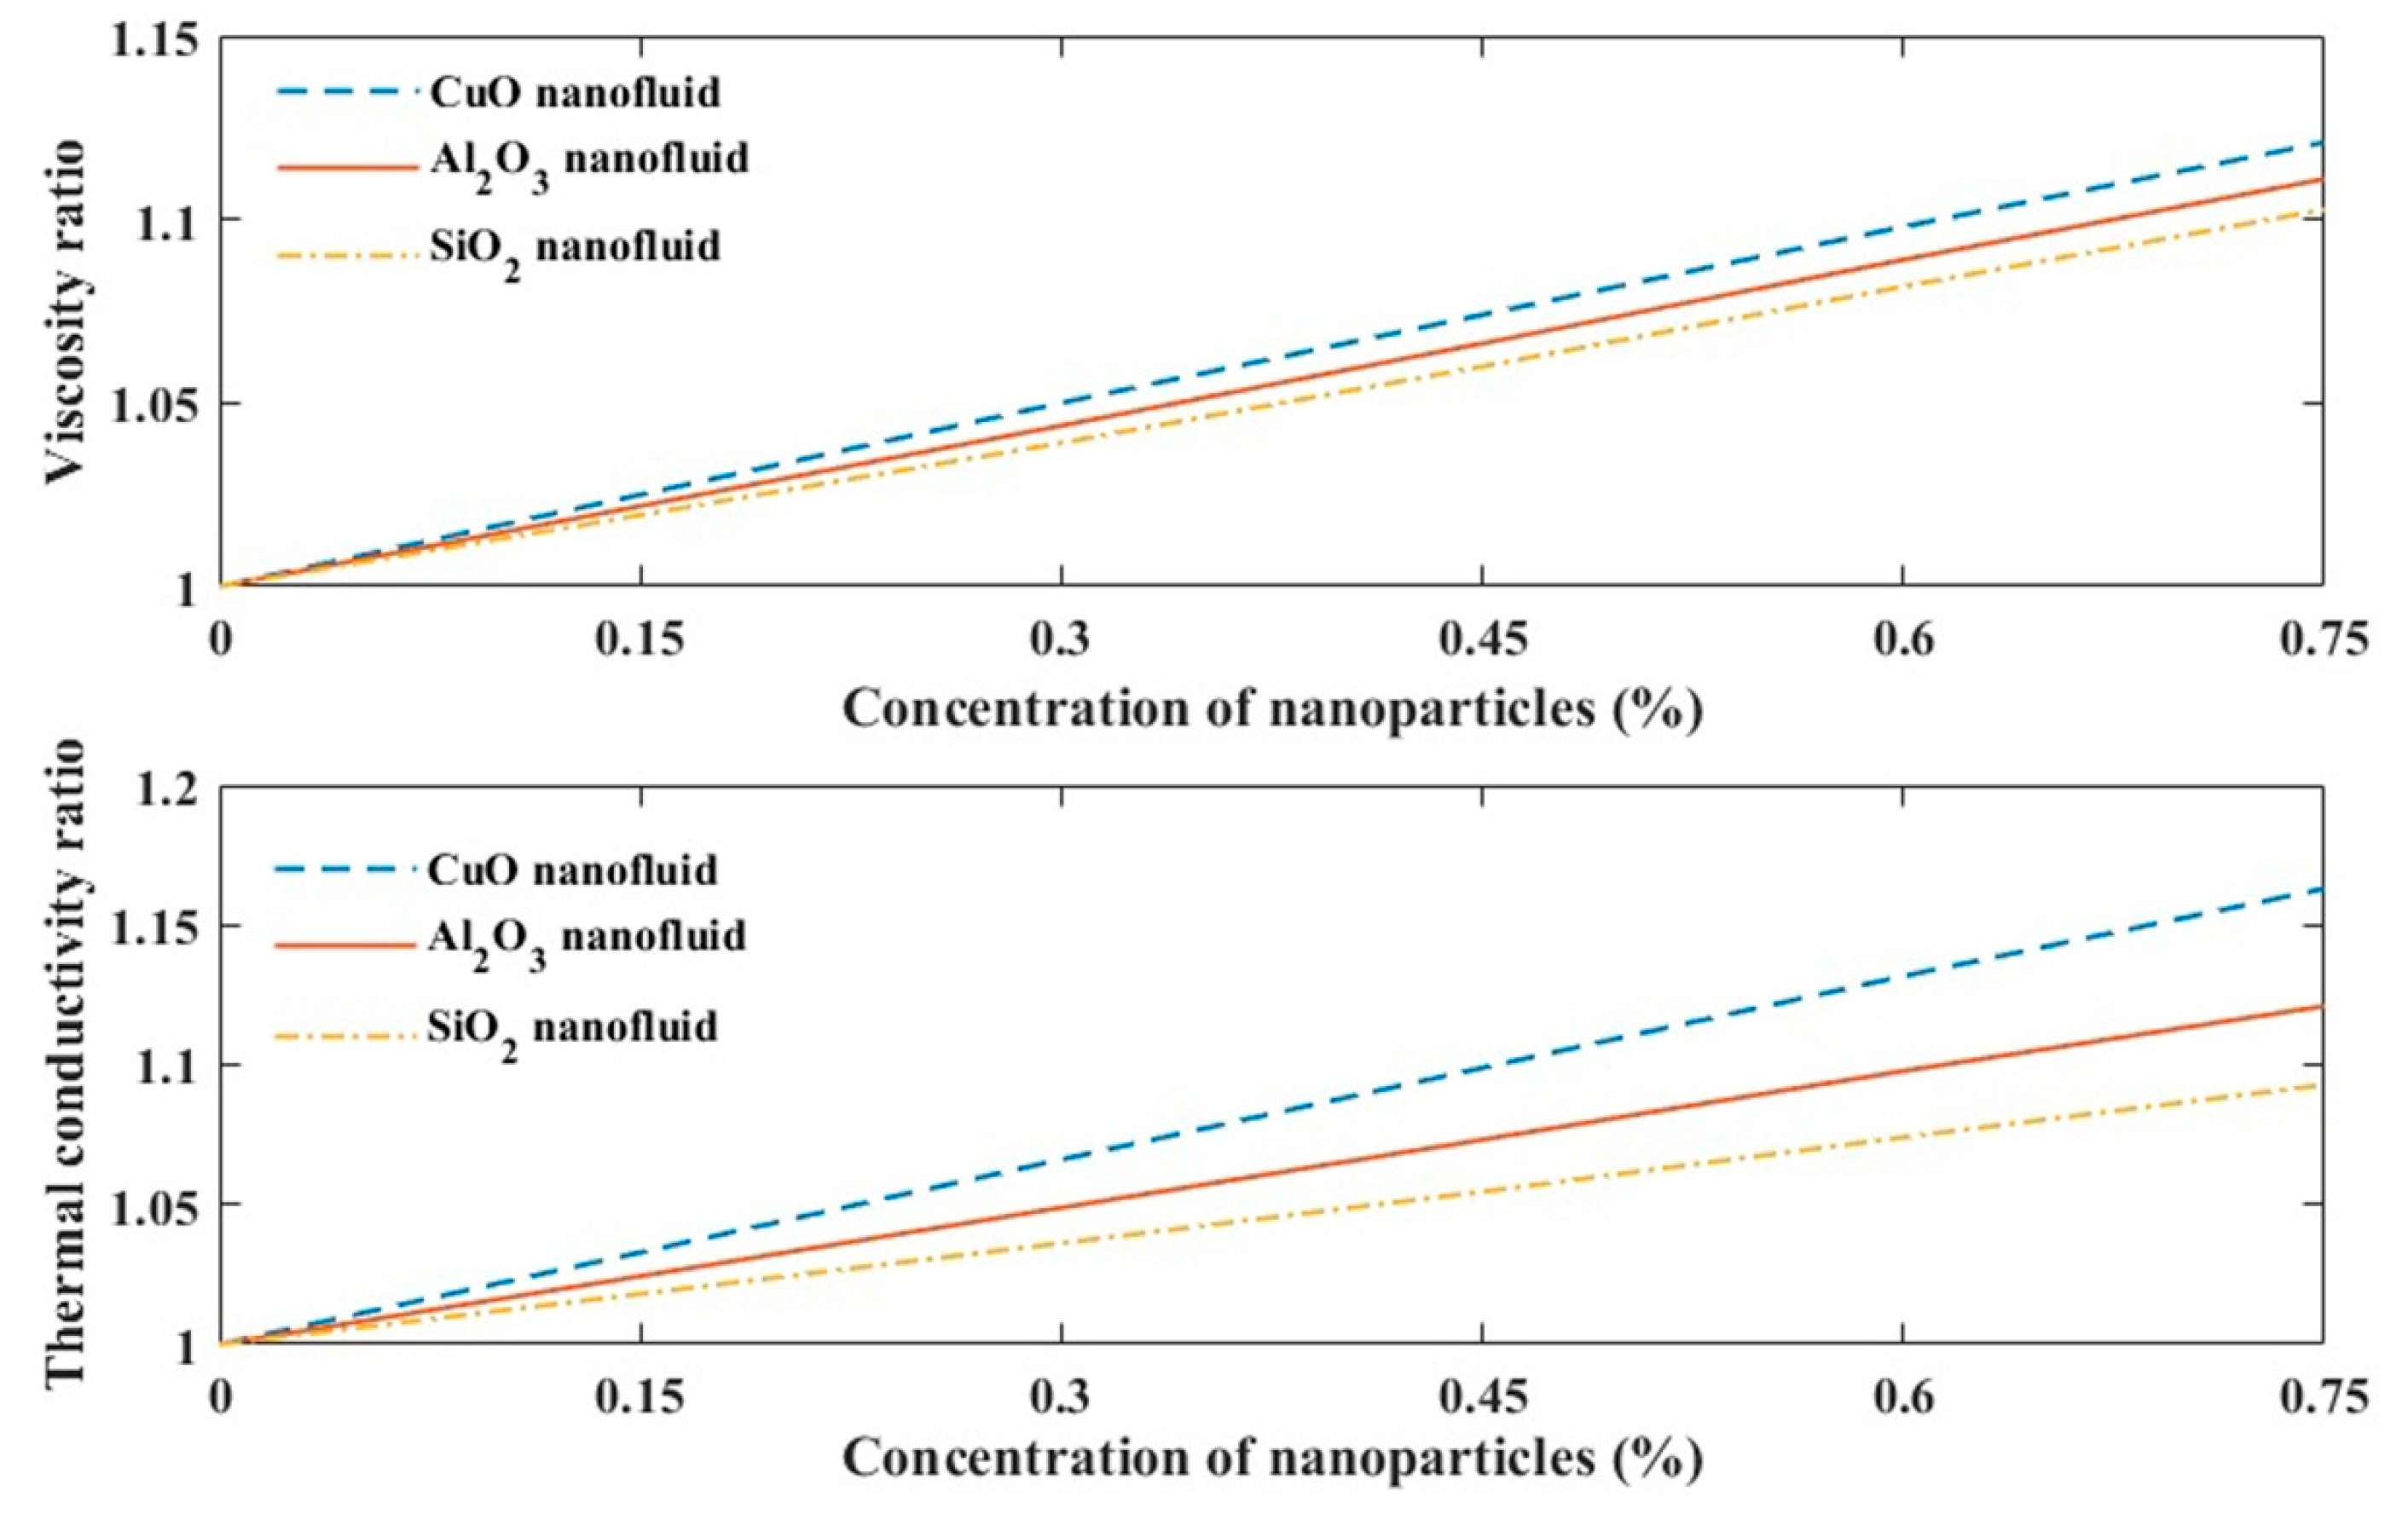
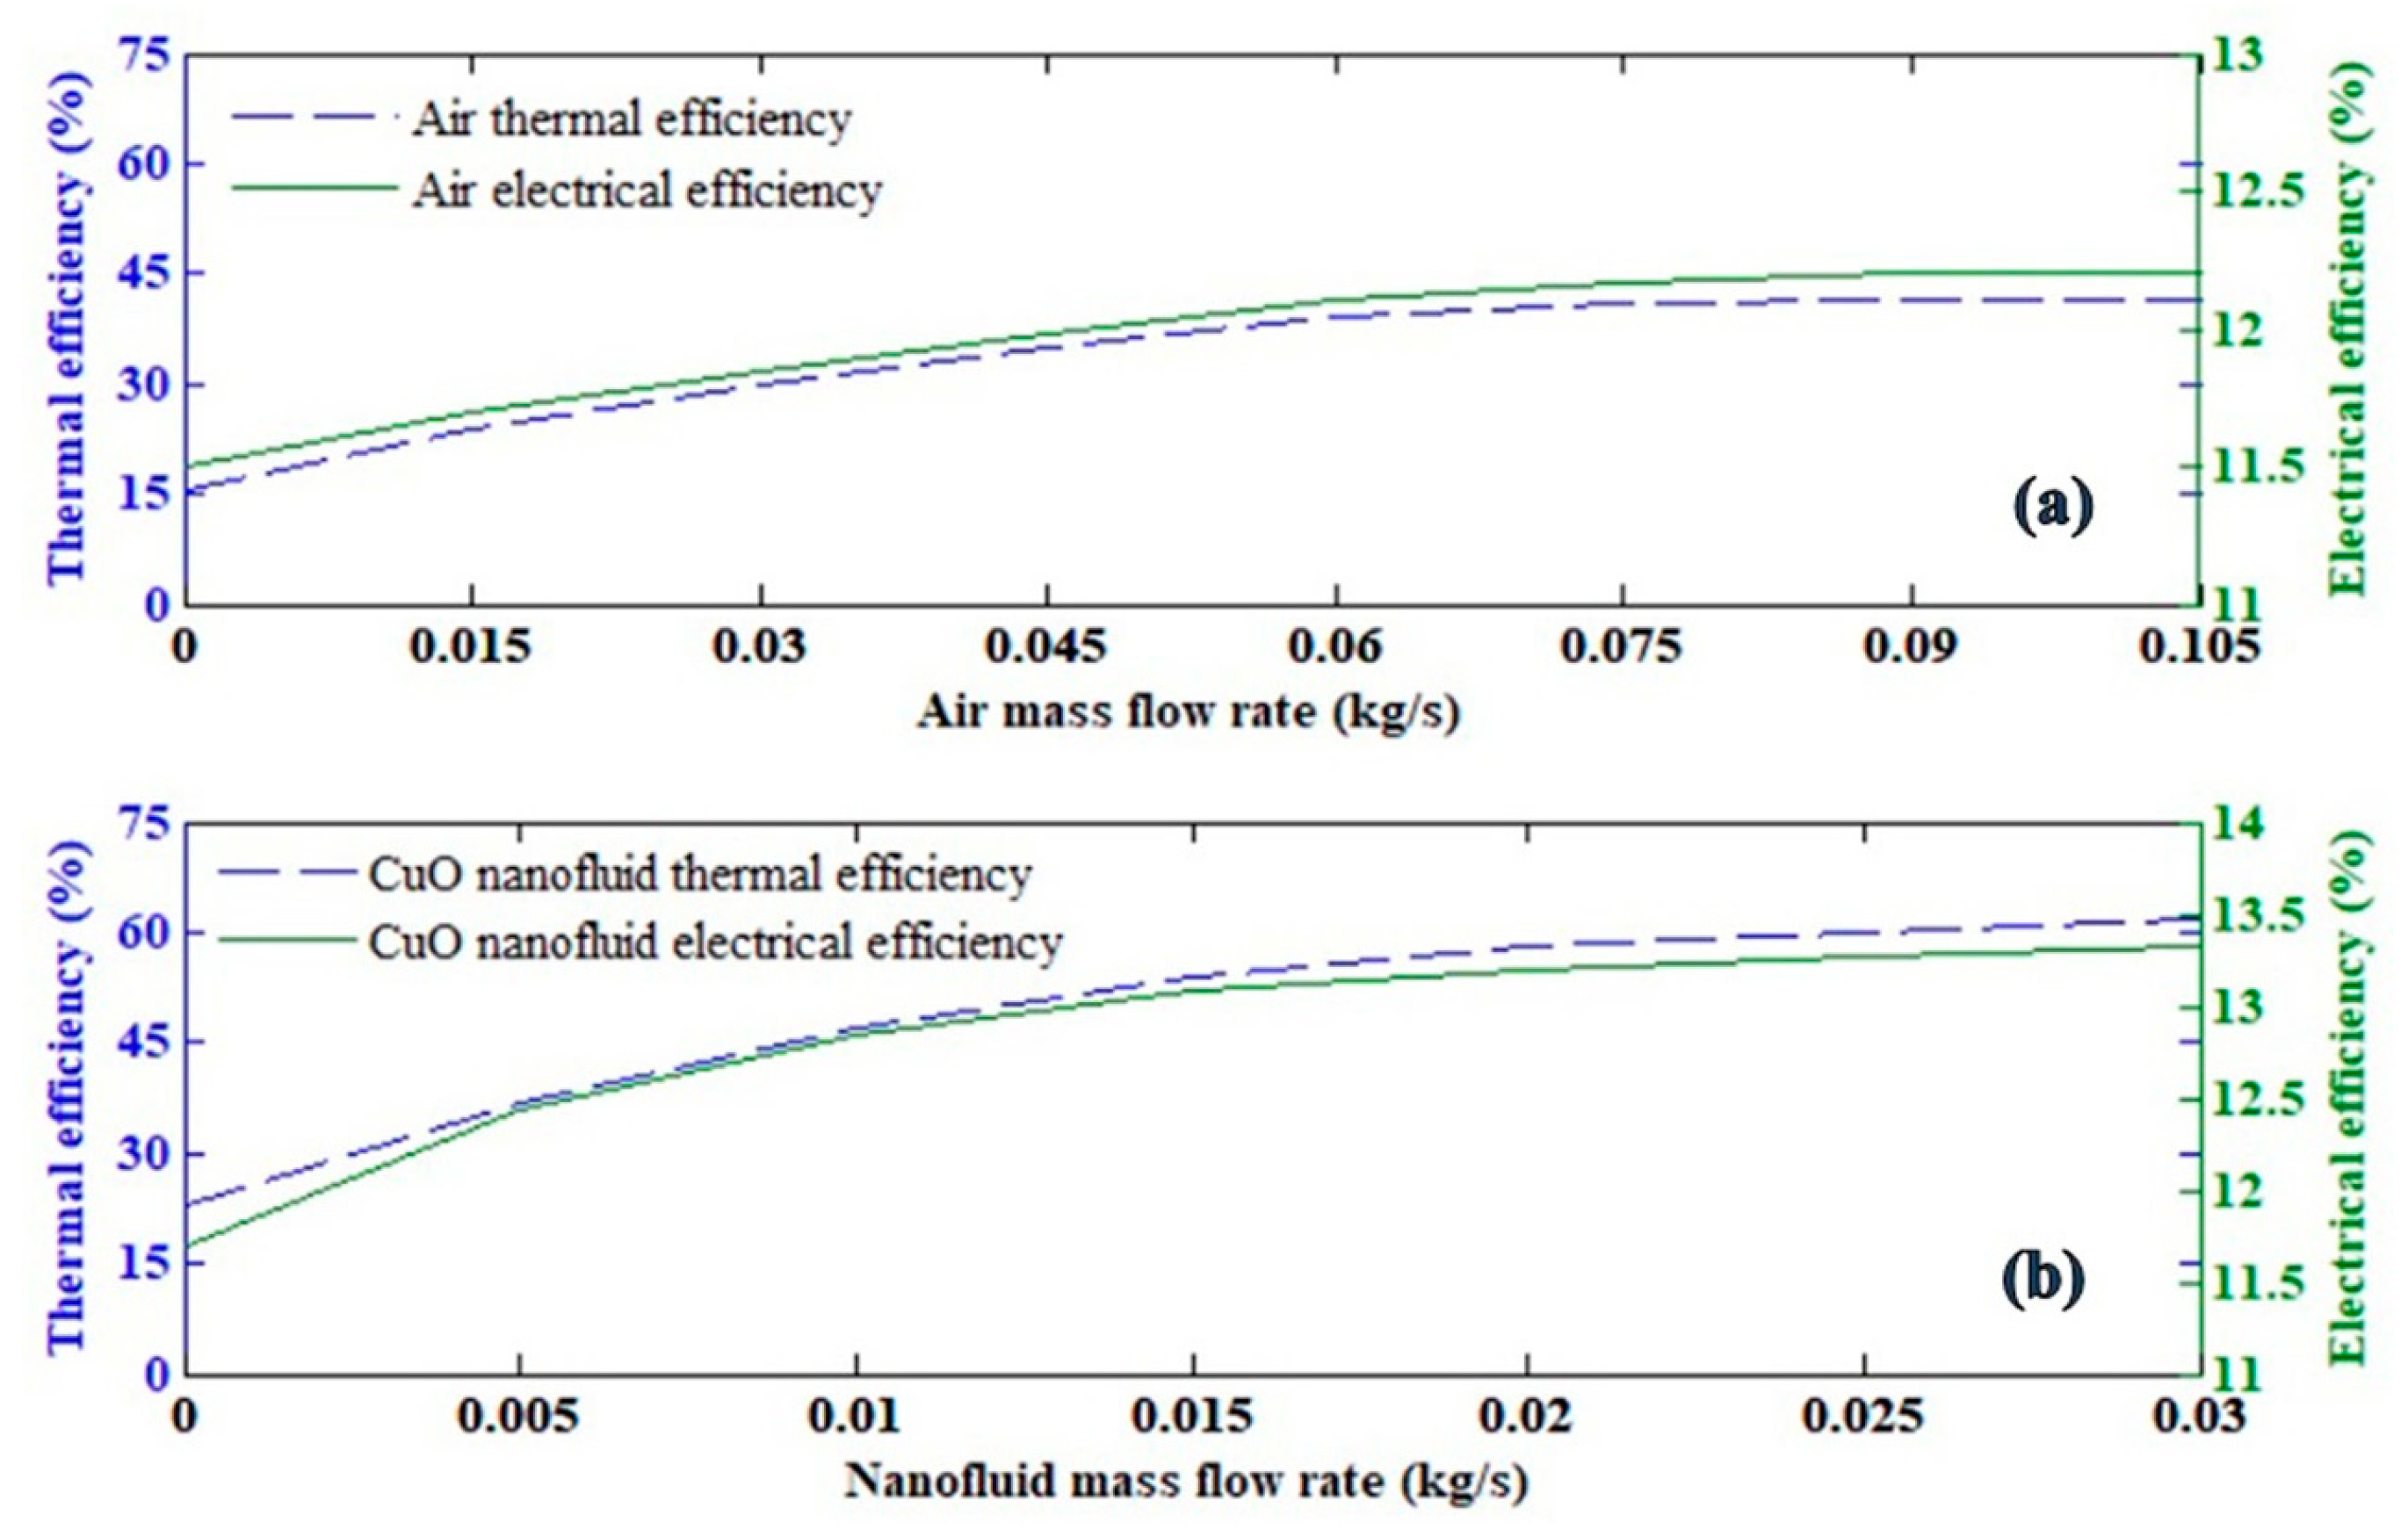
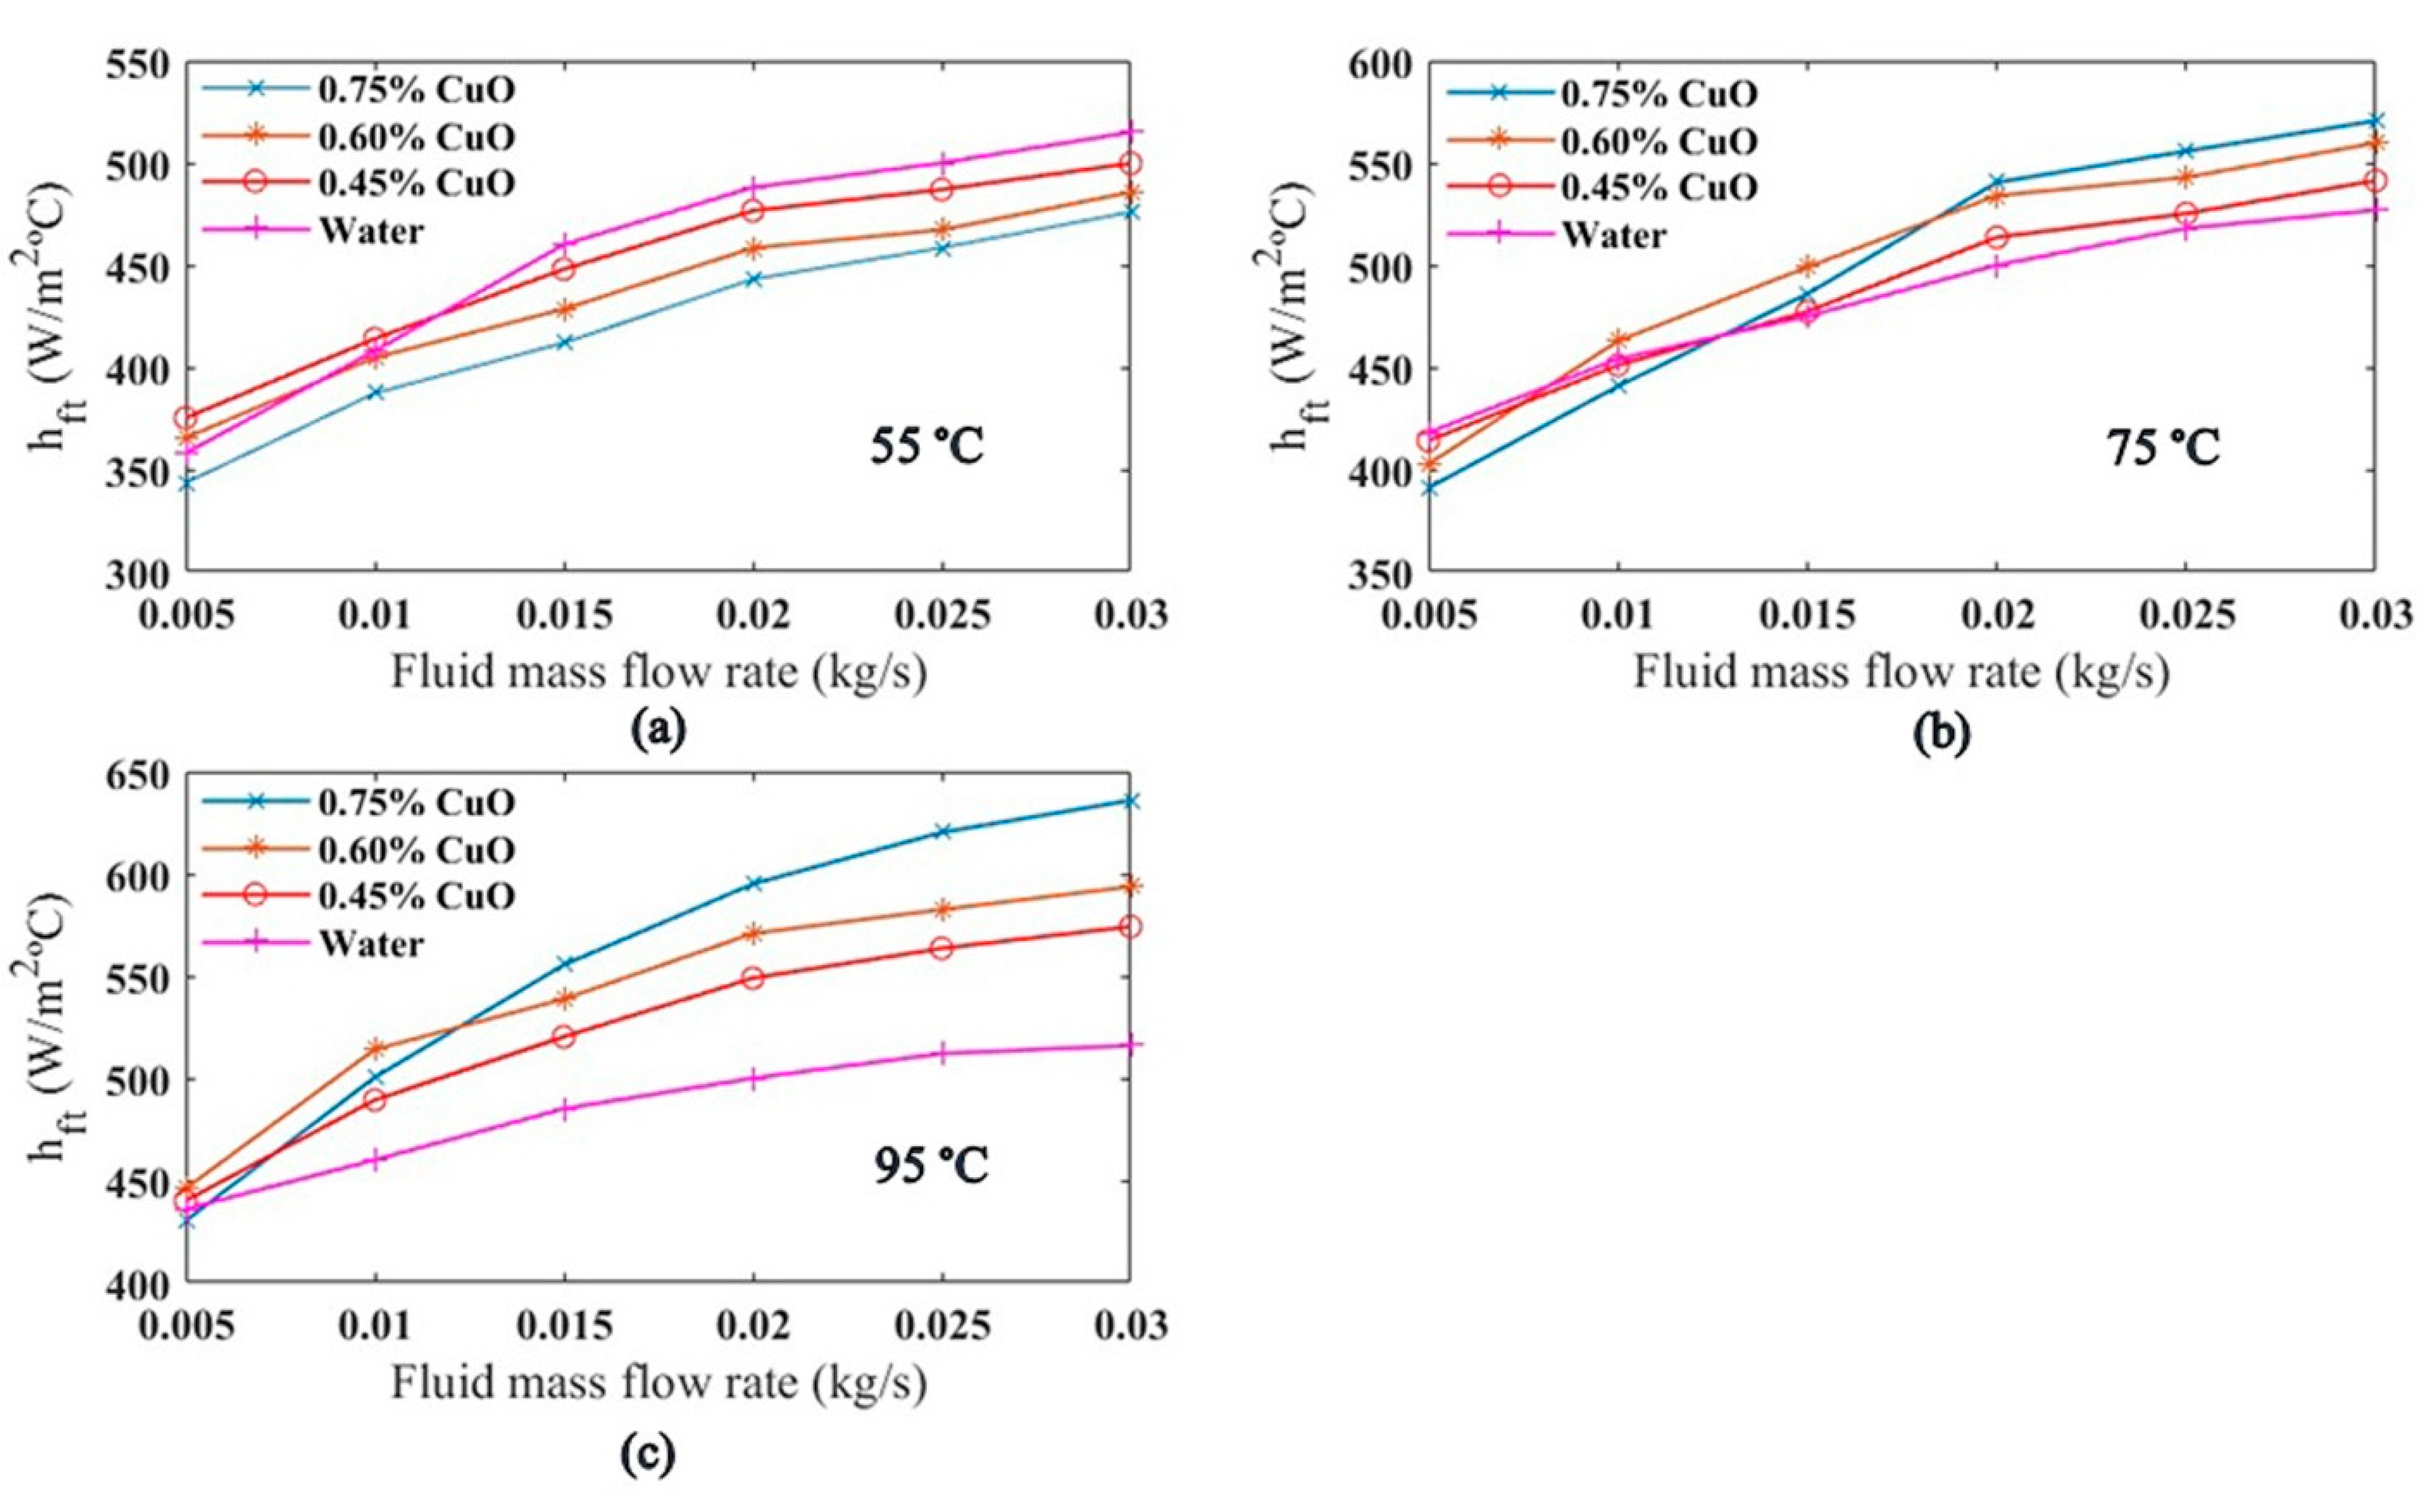
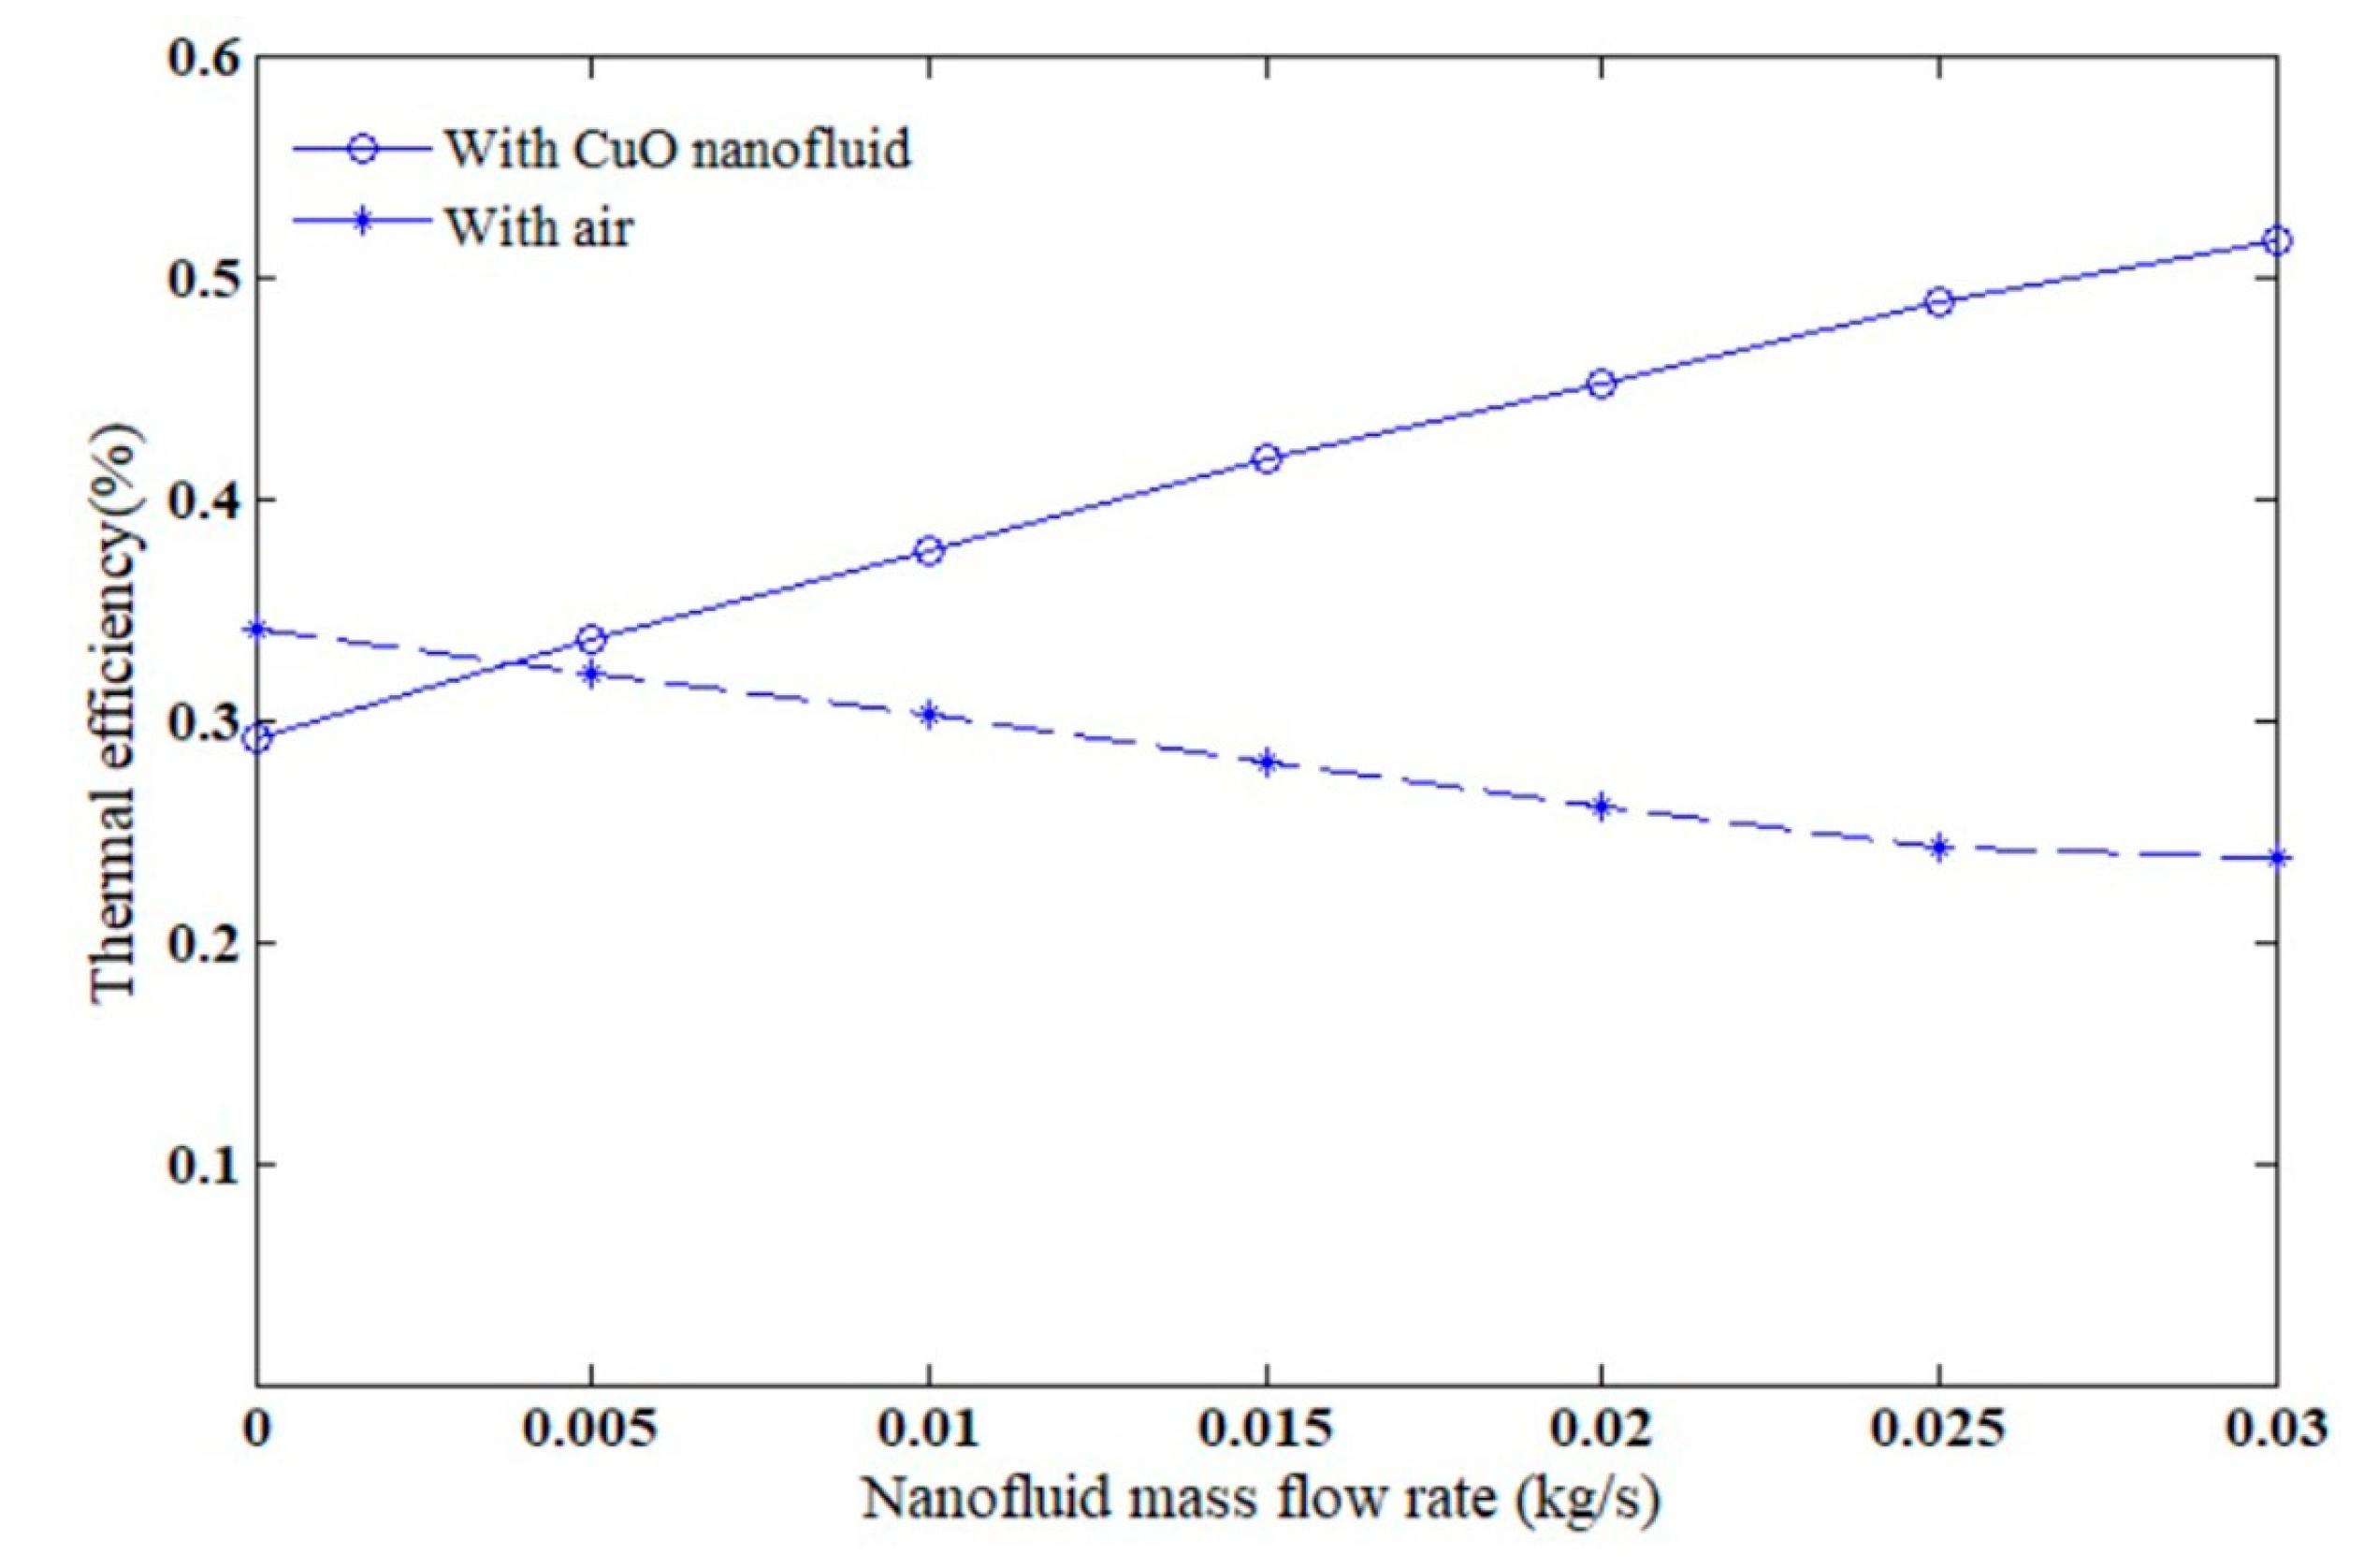
5.2. Results Derived from Mathematical Model
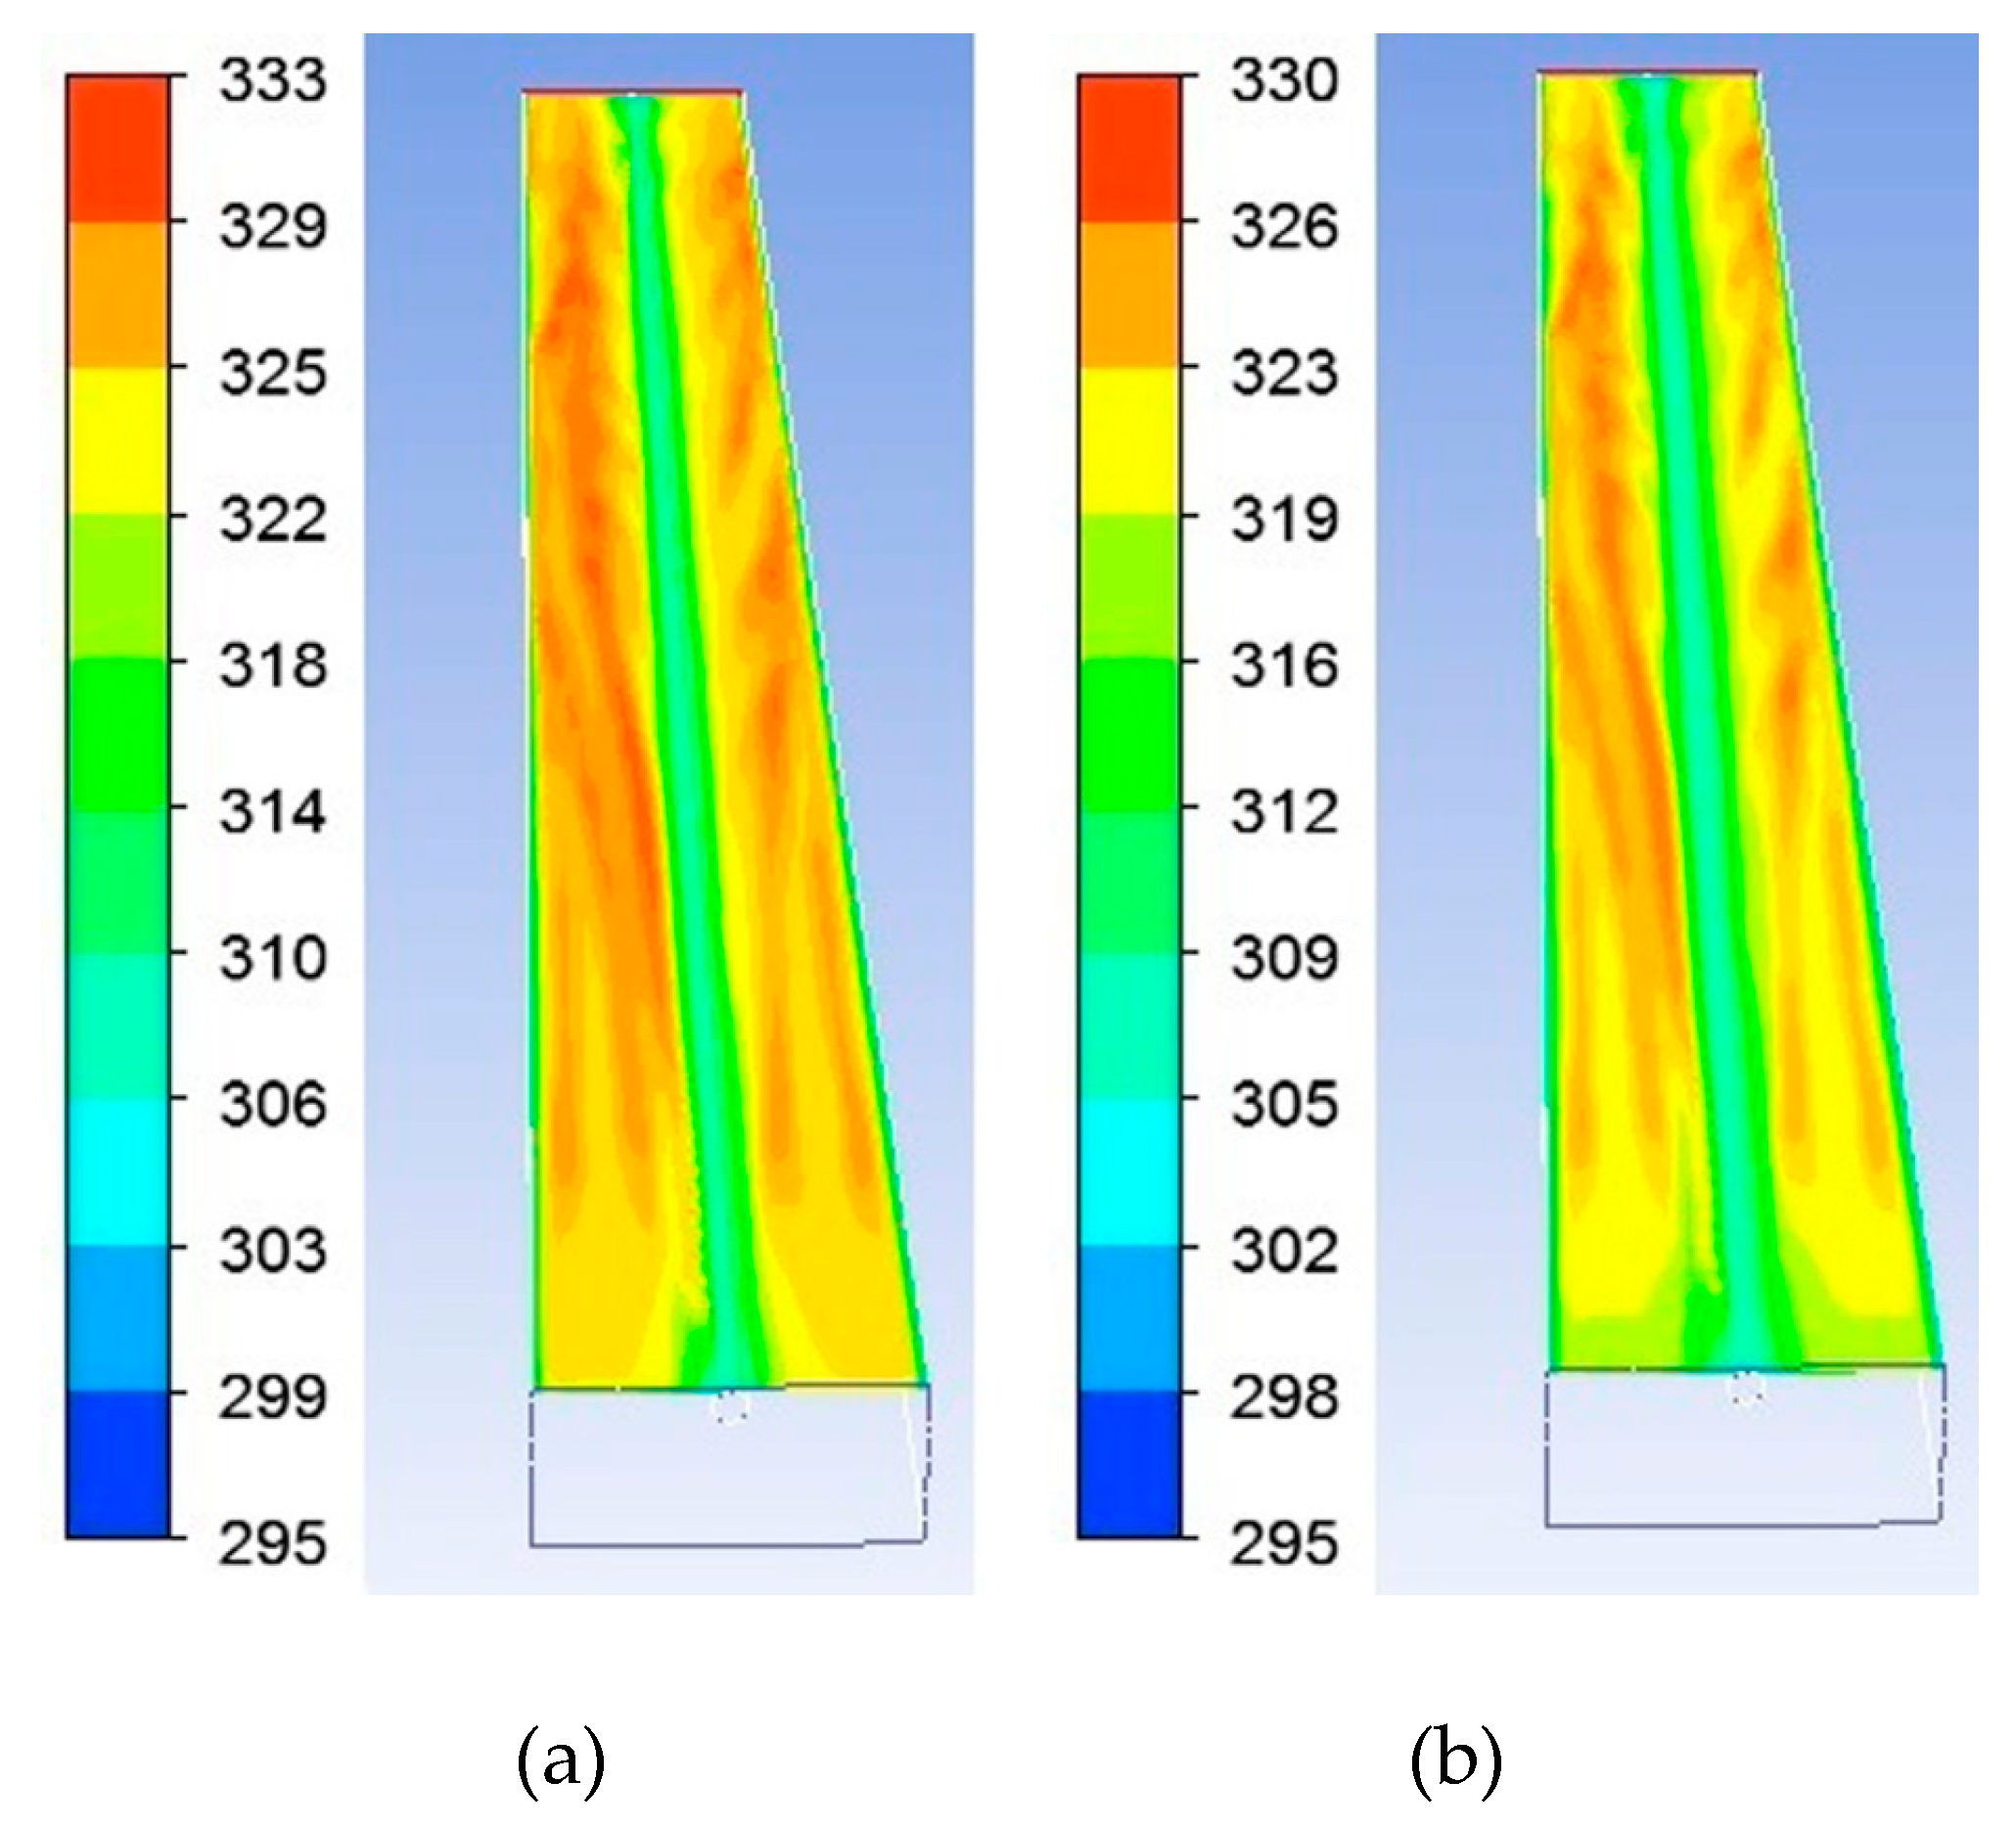
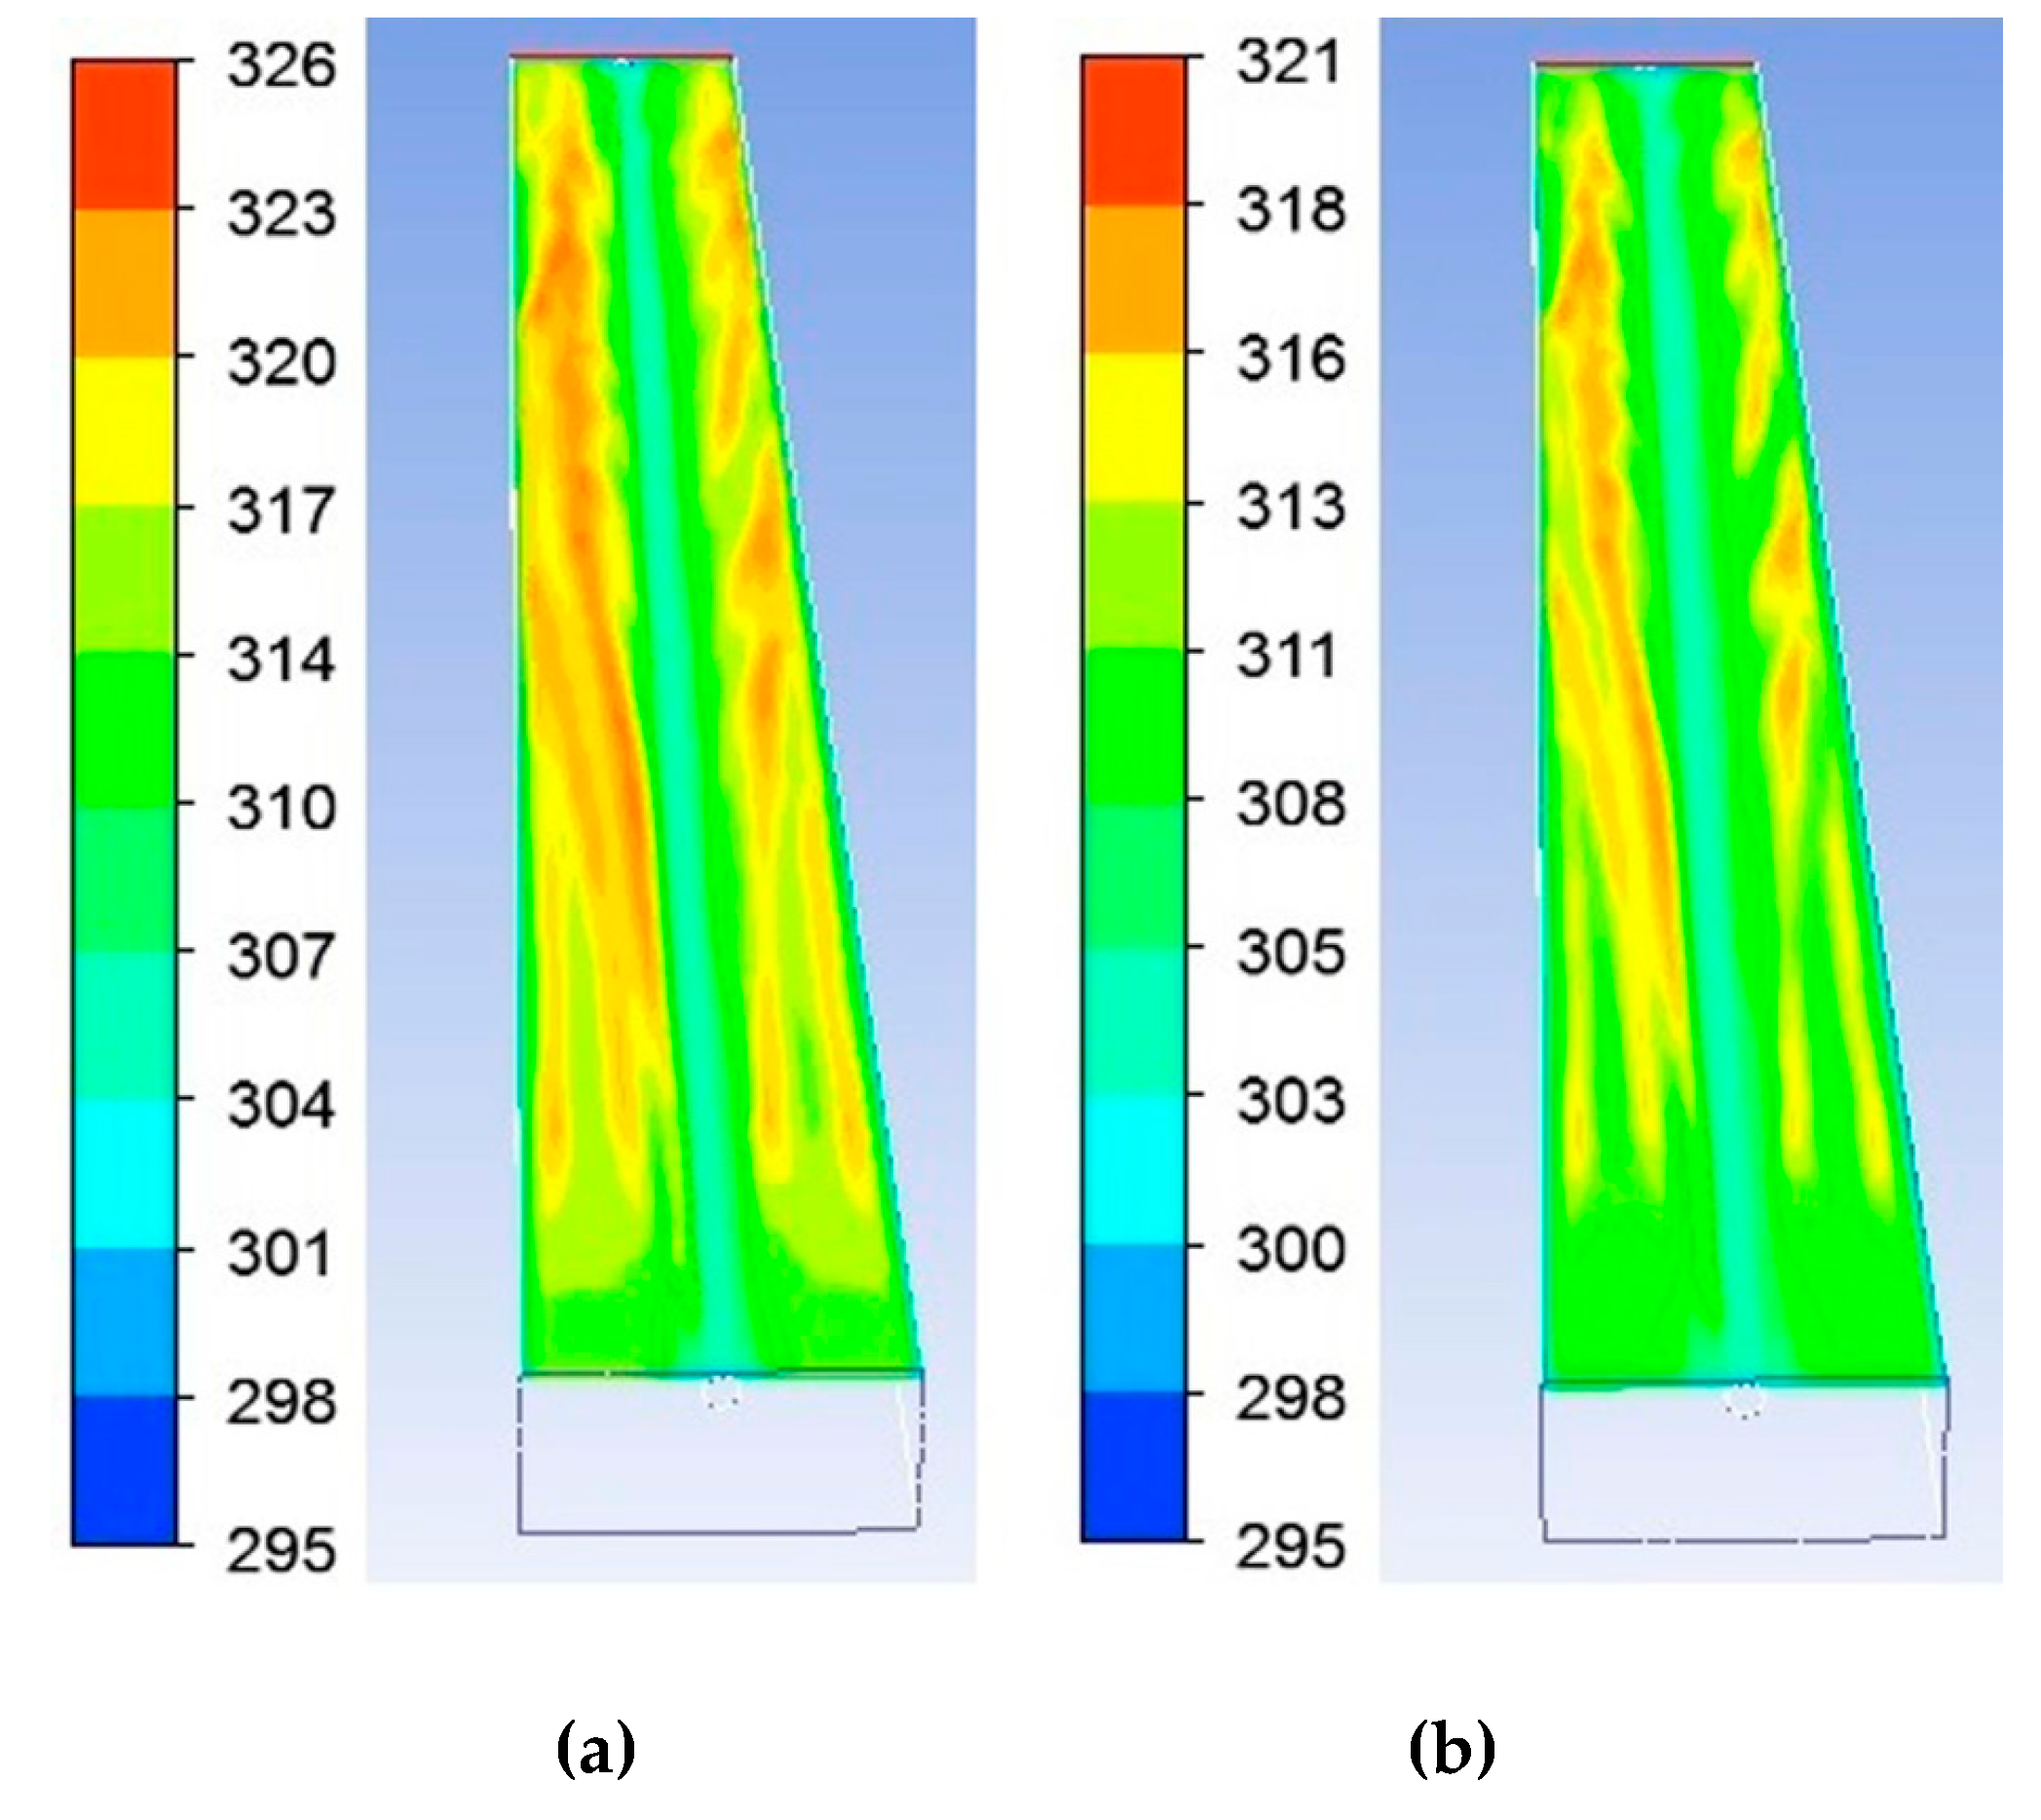
5.3. Results Derived from CFD Model
6. Conclusions
Author Contributions
Funding
Conflicts of Interest
Nomenclature
| mass (kg) | |
| specific heat (J/kg °C) | |
| temperature (°C) | |
| surface area (m2) | |
| heat transfer coefficient due to wind (W/m2 °C) | |
| convection heat transfer coefficient between PV & ambient air (W/m2 °C) | |
| conduction heat transfer coefficient between PV & tube (W/m2 °C) | |
| convection heat transfer coefficient between PV & inside air (W/m2 °C) | |
| radiation heat transfer coefficient between PV & back panel (W/m2 °C) | |
| convection heat transfer coefficient between tube & nanofluid (W/m2 °C) | |
| convection heat transfer coefficient between tube & inside air (W/m2 °C) | |
| convection heat transfer coefficient between back panel & inside air (W/m2 °C) | |
| electrical energy (W) | |
| packing factor | |
| solar radiation (W/m2) | |
| thermal conductivity (W/m °C) | |
| wind velocity (m/s) | |
| width or spacing (m) | |
| distance (m) | |
| & | tube inner & outer diameters |
| Nusselt number | |
| Reynolds number | |
| Prandtl number | |
| mass flow rate (kg/s) | |
| Greek | |
| absorptivity | |
| efficiency | |
| total equivalent efficiency | |
| solar cell temperature coefficient (l/K) | |
| emissivity | |
| Stefan-Boltzman constant | |
| volume concentration of nanoparticles | |
| Subscripts | |
| PV plate | |
| absorber tube | |
| nanofluid | |
| inside air | |
| back panel | |
| ambient air | |
| electrical | |
| reference | |
| & | nanofluid outlet & inlet |
| & | air outlet & inlet |
| thermal | |
| collector | |
| power plant | |
| nanoparticles | |
| base fluid |
References
- Yazdanpanahi, J.; Sarhaddi, F.; Mahdavi Adeli, M. Experimental investigation of exergy efficiency of a solar photovoltaic thermal (PVT) water collector based on exergy losses. Sol. Energy 2015, 118, 197–208. [Google Scholar] [CrossRef]
- Aste, N.; Del Pero, C. Simulation model for forecast of the energy performance of PV plants. In Proceedings of the ASME ATI Conference, Milano, Italy, 14–17 May 2006; Volume 2006, pp. 14–17. [Google Scholar]
- Chow, T.T. A review on photovoltaic/thermal hybrid solar technology. Appl. Energy 2010, 87, 365–379. [Google Scholar] [CrossRef]
- Kumar, R.; Rosen, M.A. Performance evaluation of a double pass PV/T solar air heater with and without fins. Appl. Therm. Eng. 2011, 31, 1402–1410. [Google Scholar] [CrossRef]
- Imtiaz Hussain, M.; Ali, A.; Lee, G.H. Multi-module concentrated photovoltaic thermal system feasibility for greenhouse heating: Model validation and techno-economic analysis. Sol. Energy 2016, 135, 719–730. [Google Scholar] [CrossRef]
- Charalambous, P.; Kalogirou, S.; Maidment, G.; Yiakoumetti, K. Optimization of the photovoltaic thermal (PV/T) collector absorber. Sol. Energy 2011, 85, 871–880. [Google Scholar] [CrossRef]
- Mahian, O.; Kianifar, A.; Kalogirou, S.A.; Pop, I.; Wongwises, S. A review of the applications of nanofluids in solar energy. Int. J. Heat Mass Transf. 2013, 57, 582–594. [Google Scholar] [CrossRef]
- Rejeb, O.; Sardarabadi, M.; Ménézo, C.; Passandideh-Fard, M.; Dhaou, M.H.; Jemni, A. Numerical and model validation of uncovered nanofluid sheet and tube type photovoltaic thermal solar system. Energy Convers. Manag. 2016, 110, 367–377. [Google Scholar] [CrossRef]
- Hasan, H.A.; Sopian, K.; Jaaz, A.H.; Al-Shamani, A.N. Experimental investigation of jet array nanofluids impingement in photovoltaic/thermal collector. Sol. Energy 2017, 144, 321–334. [Google Scholar] [CrossRef]
- Elmir, M.; Mehdaoui, R.; Mojtabi, A. Numerical simulation of cooling a solar cell by forced convection in the presence of a nanofluid. Energy Procedia 2012, 18, 594–603. [Google Scholar] [CrossRef]
- Sardarabadi, M.; Passandideh-Fard, M.; Heris, S.Z. Experimental investigation of the effects of silica/water nanofluid on PV/T (photovoltaic thermal units). Energy 2014, 66, 264–272. [Google Scholar] [CrossRef]
- Michael, J.J.; Iniyan, S. Performance analysis of a copper sheet laminated photovoltaic thermal collector using copper oxide–water nanofluid. Sol. Energy 2015, 119, 439–451. [Google Scholar] [CrossRef]
- Tripanagnostopoulos, Y. Aspects and improvements of hybrid photovoltaic/thermal solar energy systems. Sol. Energy 2007, 81, 1117–1131. [Google Scholar] [CrossRef]
- Abu Bakar, M.N.; Othman, M.; Hj Din, M.; Manaf, N.A.; Jarimi, H. Design concept and mathematical model of a bi-fluid photovoltaic/thermal (PV/T) solar collector. Renew. Energy 2014, 67, 153–164. [Google Scholar] [CrossRef]
- Jarimi, H.; Bakar, M.N.A.; Othman, M.; Din, M.H. Bi-fluid photovoltaic/thermal (PV/T) solar collector: Experimental validation of a 2-D theoretical model. Renew. Energy 2016, 85, 1052–1067. [Google Scholar] [CrossRef]
- Duffie, J.A.; Beckman, W.A. Solar Engineering of Thermal Processes, 4th ed.; John Wiley & Sons: Hoboken, NJ, USA, 2013. [Google Scholar]
- Dubey, S.; Tiwari, G. Thermal modeling of a combined system of photovoltaic thermal (PV/T) solar water heater. Sol. Energy 2008, 82, 602–612. [Google Scholar] [CrossRef]
- Chow, T. Performance analysis of photovoltaic-thermal collector by explicit dynamic model. Sol. Energy 2003, 75, 143–152. [Google Scholar] [CrossRef]
- Bhattarai, S.; Oh, J.-H.; Euh, S.-H.; Krishna Kafle, G.; Hyun Kim, D. Simulation and model validation of sheet and tube type photovoltaic thermal solar system and conventional solar collecting system in transient states. Sol. Energy Mater. Sol. Cells 2012, 103, 184–193. [Google Scholar] [CrossRef]
- Zerradi, H.; Ouaskit, S.; Dezairi, A.; Loulijat, H.; Mizani, S. New Nusselt number correlations to predict the thermal conductivity of nanofluids. Adv. Powder Technol. 2014, 25, 1124–1131. [Google Scholar] [CrossRef]
- Maxwell, J.C. A Treatise on Electricity and Magnetism; Clarendon Press: Oxford, UK, 1873. [Google Scholar]
- Drew, D.A.; Passman, S.L. Theory of Multicomponent Fluids; Springer Science & Business Media: Berlin, Germany, 2006; Volume 135. [Google Scholar]
- Fluent, A. 14.0. User’s and Theory Guides; FLUENT Inc.: New York, NY, USA, 2011. [Google Scholar]
- Khanjari, Y.; Pourfayaz, F.; Kasaeian, A. Numerical investigation on using of nanofluid in a water-cooled photovoltaic thermal system. Energy Convers. Manag. 2016, 122, 263–278. [Google Scholar] [CrossRef]
- Imtiaz Hussain, M.; Lee, G.H. Experimental and numerical studies of a U-shaped solar energy collector to track the maximum CPV/T system output by varying the flow rate. Renew. Energy 2015, 76, 735–742. [Google Scholar] [CrossRef]
- Ekramian, E.; Etemad, S.G.; Haghshenasfard, M. Numerical analysis of heat transfer performance of flat plate solar collectors. J. Fluid Flow Heat Mass Transf. 2014, 1, 38–42. [Google Scholar] [CrossRef]
- Tagliafico, L.A.; Scarpa, F.; Tagliafico, G.; Valsuani, F. An approach to energy saving assessment of solar assisted heat pumps for swimming pool water heating. Energy Build. 2012, 55, 833–840. [Google Scholar] [CrossRef]
- Hussain, M.I.; Lee, G.H. Numerical and experimental heat transfer analyses of a novel concentric tube absorber under non-uniform solar flux condition. Renew. Energy 2017, 103, 49–57. [Google Scholar] [CrossRef]
- Vyas, A.A. CFD Based Thermal Efficiency Analysis of Solar Air Heater with Smooth Plate & Perforated Plate. Imp. J. Interdiscip. Res. 2017, 3, 415. [Google Scholar]
- Fluent, A. Fluent 14.0 User’s Guide; ANSYS FLUENT Inc.: Canonsburg, PA, USA, 2011. [Google Scholar]
- Joshi, A.; Tiwari, A.; Tiwari, G.; Dincer, I.; Reddy, B. Performance evaluation of a hybrid photovoltaic thermal (PV/T)(glass-to-glass) system. Int. J. Therm. Sci. 2009, 48, 154–164. [Google Scholar] [CrossRef]
- Faizal, M.; Saidur, R.; Mekhilef, S.; Alim, M. Energy, economic and environmental analysis of metal oxides nanofluid for flat-plate solar collector. Energy Convers. Manag. 2013, 76, 162–168. [Google Scholar] [CrossRef]
- Al-Waeli, A.H.; Chaichan, M.T.; Kazem, H.A.; Sopian, K. Comparative study to use nano-(Al2O3, CuO, and SiC) with water to enhance photovoltaic thermal PV/T collectors. Energy Convers. Manag. 2017, 148, 963–973. [Google Scholar] [CrossRef]
- AZO MATERIALS, A. Silica-Silicon Dioxide. Available online: https://www.azom.com/properties.aspx?ArticleID=1114 (accessed on 30 August 2018).
- Cuce, E.; Bali, T.; Sekucoglu, S.A. Effects of passive cooling on performance of silicon photovoltaic cells. Int. J. Low-Carbon Technol. 2011, 6, 299–308. [Google Scholar] [CrossRef]


| Cell Type | Mono-Crystalline Silicon |
|---|---|
| Open circuit voltage | 38.1 V |
| Short circuit current | 9.27 A |
| Maximum power point | 31.6 V & 8.23 A |
| PV module [14] | Length & width | 1.62 m & 0.98 m |
| Absorptivity () | 0.9 | |
| Emissivity () | 0.88 | |
| Specific heat () | 900 J/(kg·K) | |
| Temperature coefficient () | 0.0045/°C | |
| Reference PV panel temperature | 298.15 K | |
| Absorber tube | Inner diameter () | 0.008 m |
| Thickness () | 0.0012 m | |
| Specific heat () | 903 J/(kg·K) | |
| Density () | 2702 kg/m3 | |
| No. of tubes | 9 | |
| Tube spacing | 0.11 m | |
| Material | Copper | |
| Back panel | Density () | 20 kg/m3 |
| Specific heat () | 670 J/(kg·K) | |
| Thermal conductivity () | 0.034 W/(m·K) | |
| Nanoparticles used | CuO, Al2O3, and SiO2 | - |
| Other fluids used | Water & air | - |
| Number of Elements | PV Module Temperature (°C) | |||
|---|---|---|---|---|
| Water | Nanofluid | Water + Air | Nanofluid + Air | |
| 781,430 | 57.46 | 56.18 | 50.69 | 46.65 |
| 903,638 | 59.35 | 57.47 | 51.55 | 48.42 |
| 1,060,023 | 60.16 | 58.73 | 52.39 | 47.44 |
| 1,437,673 | 59.87 | 57.92 | 52.23 | 47.37 |
| Metal Oxides or Additive | Chemical Formula | Properties | ||
|---|---|---|---|---|
| Specific Heat (J/kg·K) | Thermal Conductivity (W/m.K) | Density (kg/m3) | ||
| Copper oxide | CuO | 551 | 32.9 | 6310 |
| Aluminum oxide | Al2O3 | 773 | 30 | 3890 |
| Silicon dioxide | SiO2 | 730 | 1.5 | 2650 |
| Nanofluid or Water Flow Rate (kg/s) | Fixed Air Flow Rate (kg/s) | Daily Solar Radiation (MJ/m2 day) | Ambient Temperature (°C) | Total Equivalent Efficiency (%) | ||
|---|---|---|---|---|---|---|
| PV without Cooling | Water Plus Air | Nanofluid Plus Air | ||||
| 0.005 | 0.055 | 23.25 | 21.47 | 31.5 | 73.7 | 82.6 |
| 0.01 | 0.055 | 23.25 | 21.47 | - | 75.1 | 85.2 |
| 0.015 | 0.055 | 23.25 | 21.47 | - | 76.6 | 87.4 |
| 0.02 | 0.055 | 23.25 | 21.47 | - | 78.4 | 88.7 |
| 0.025 | 0.055 | 23.25 | 21.47 | - | 79.1 | 89.5 |
| 0.03 | 0.055 | 23.25 | 21.47 | - | 79.8 | 90.3 |
© 2019 by the authors. Licensee MDPI, Basel, Switzerland. This article is an open access article distributed under the terms and conditions of the Creative Commons Attribution (CC BY) license (http://creativecommons.org/licenses/by/4.0/).
Share and Cite
Hussain, M.I.; Kim, J.-H.; Kim, J.-T. Nanofluid-Powered Dual-Fluid Photovoltaic/Thermal (PV/T) System: Comparative Numerical Study. Energies 2019, 12, 775. https://doi.org/10.3390/en12050775
Hussain MI, Kim J-H, Kim J-T. Nanofluid-Powered Dual-Fluid Photovoltaic/Thermal (PV/T) System: Comparative Numerical Study. Energies. 2019; 12(5):775. https://doi.org/10.3390/en12050775
Chicago/Turabian StyleHussain, M. Imtiaz, Jin-Hee Kim, and Jun-Tae Kim. 2019. "Nanofluid-Powered Dual-Fluid Photovoltaic/Thermal (PV/T) System: Comparative Numerical Study" Energies 12, no. 5: 775. https://doi.org/10.3390/en12050775
APA StyleHussain, M. I., Kim, J.-H., & Kim, J.-T. (2019). Nanofluid-Powered Dual-Fluid Photovoltaic/Thermal (PV/T) System: Comparative Numerical Study. Energies, 12(5), 775. https://doi.org/10.3390/en12050775