High-Performance Accuracy of Daylight-Responsive Dimming Systems with Illuminance by Distant Luminaires for Energy-Saving Buildings

Abstract
:1. Introduction
1.1. Research Purpose
1.2. State of the Art
2. Methods
2.1. DRDS
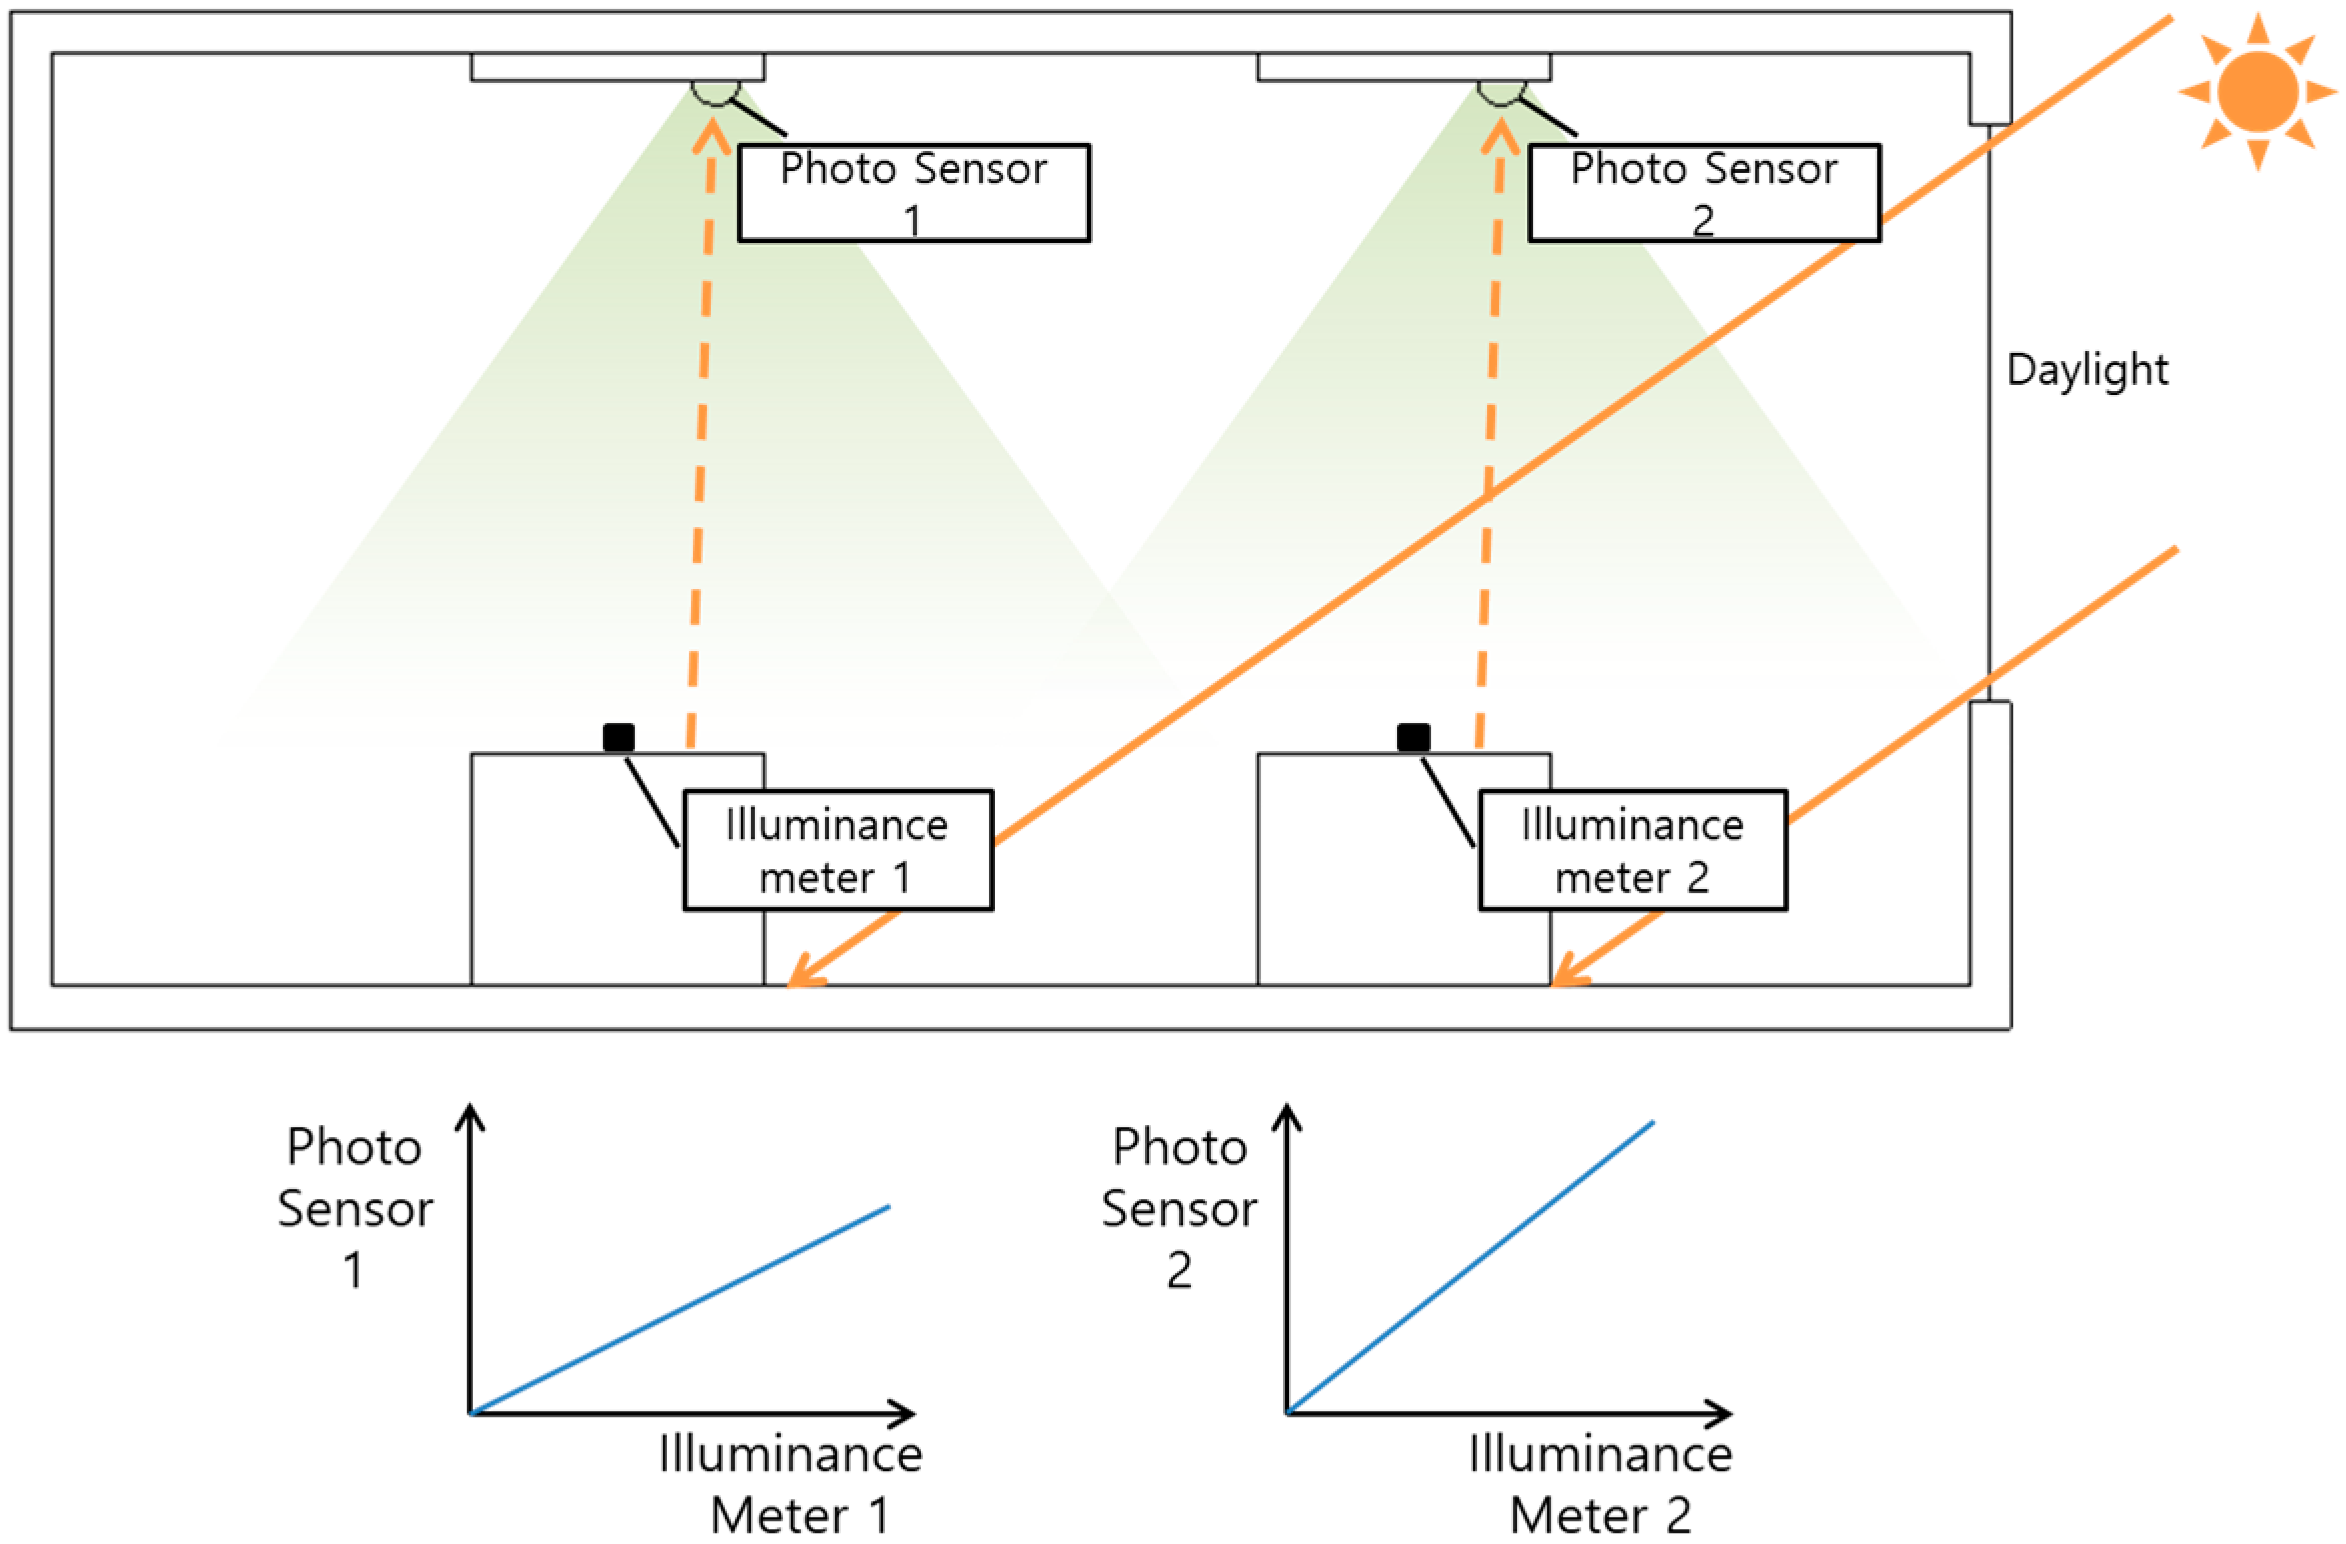
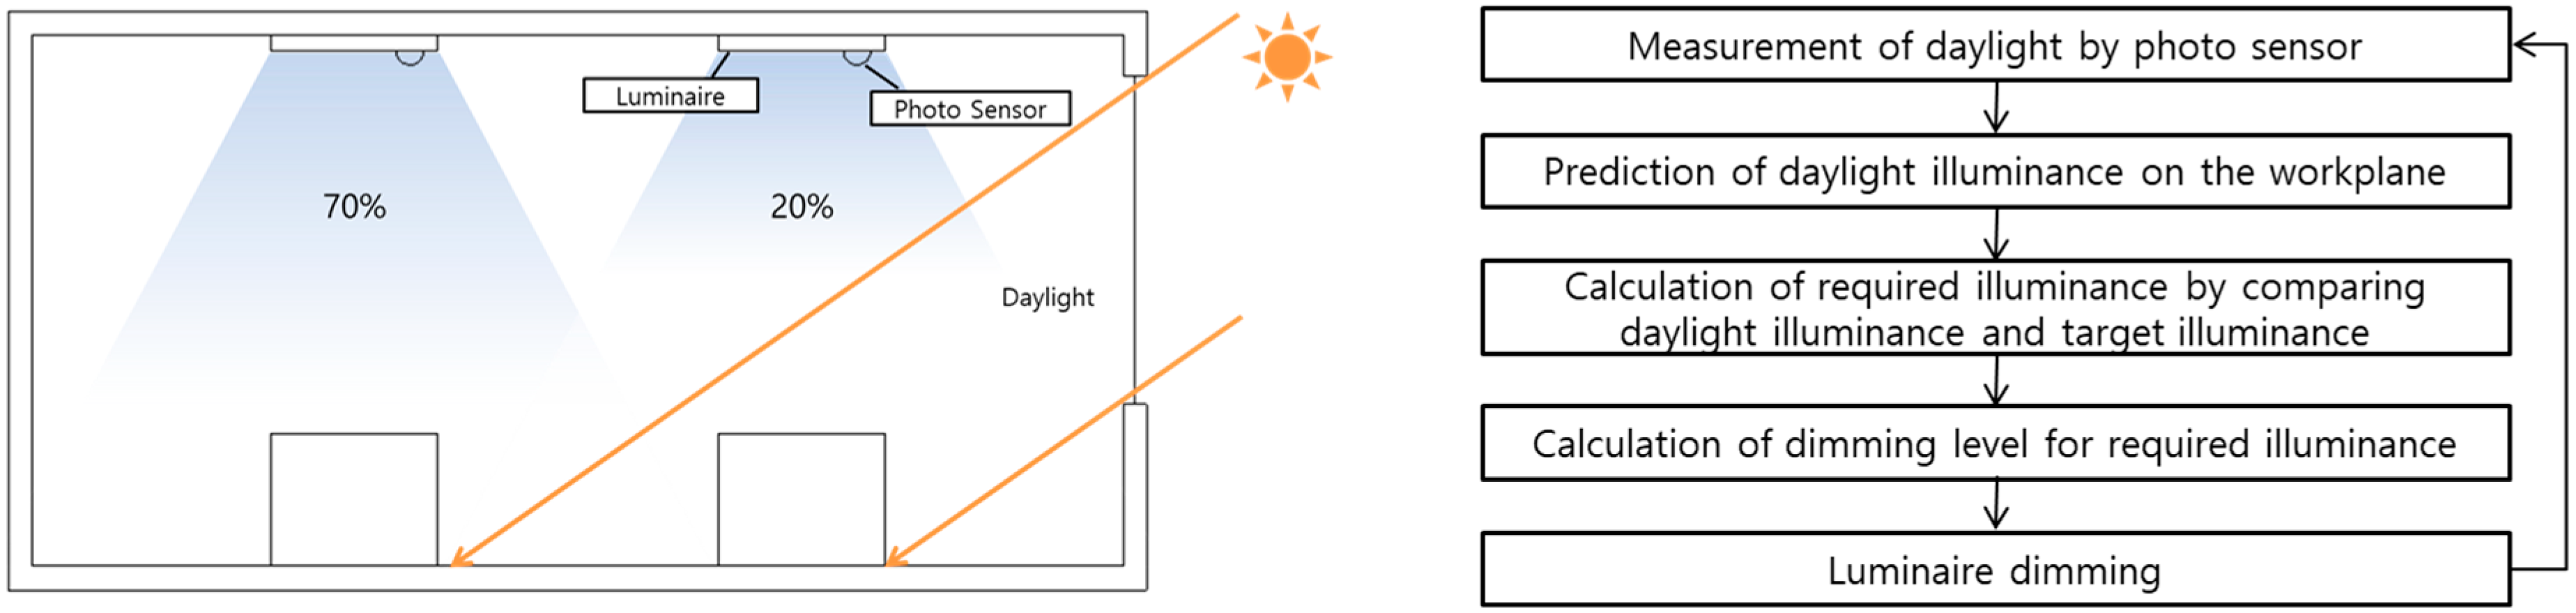
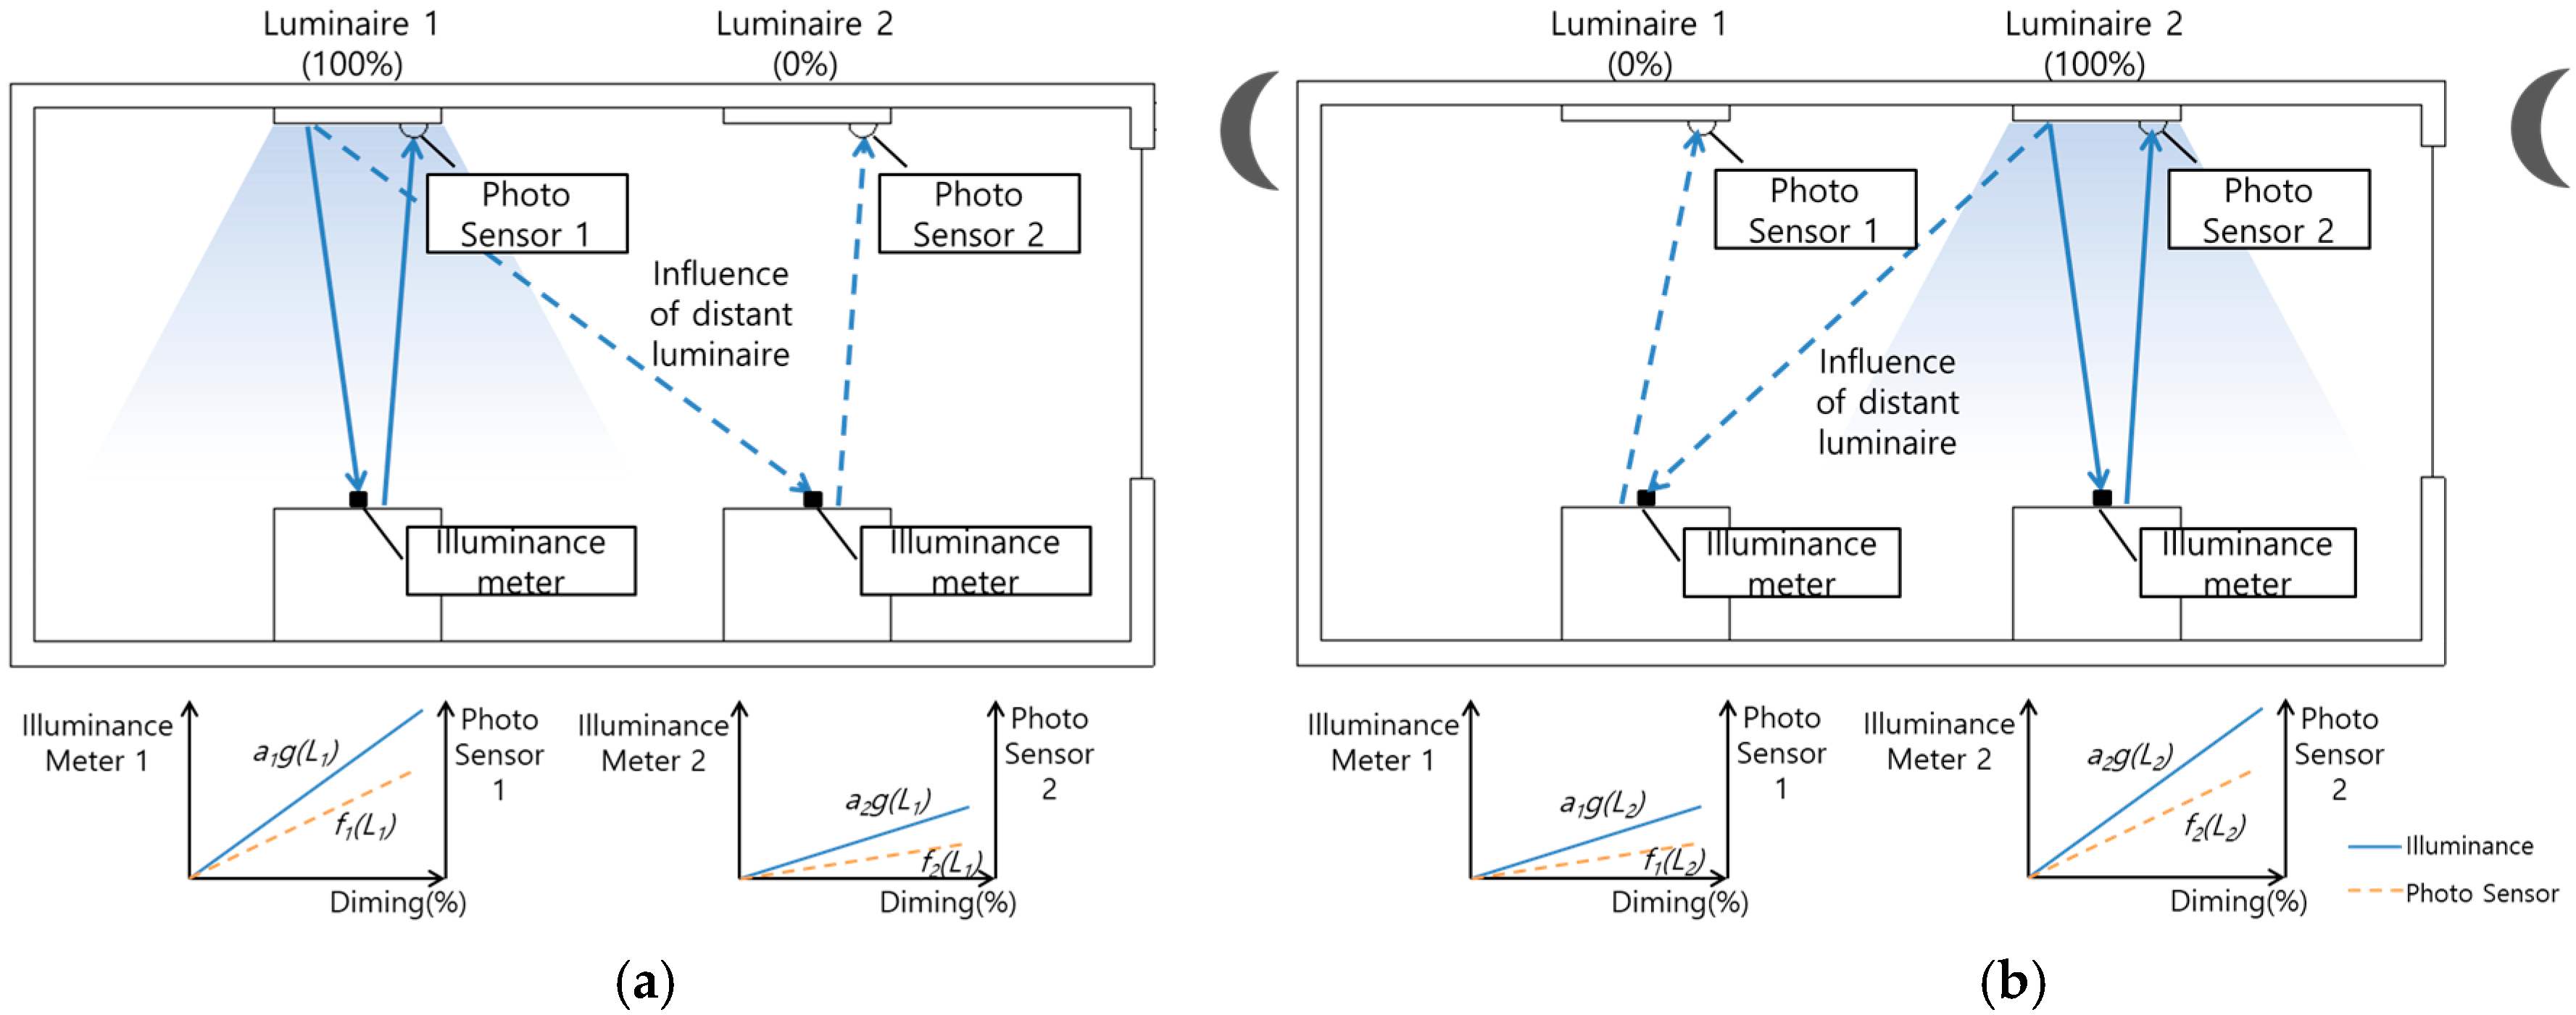
2.1.1. Concept of DRDS
2.1.2. Prediction Method for Daylight Illuminance on the Workplane
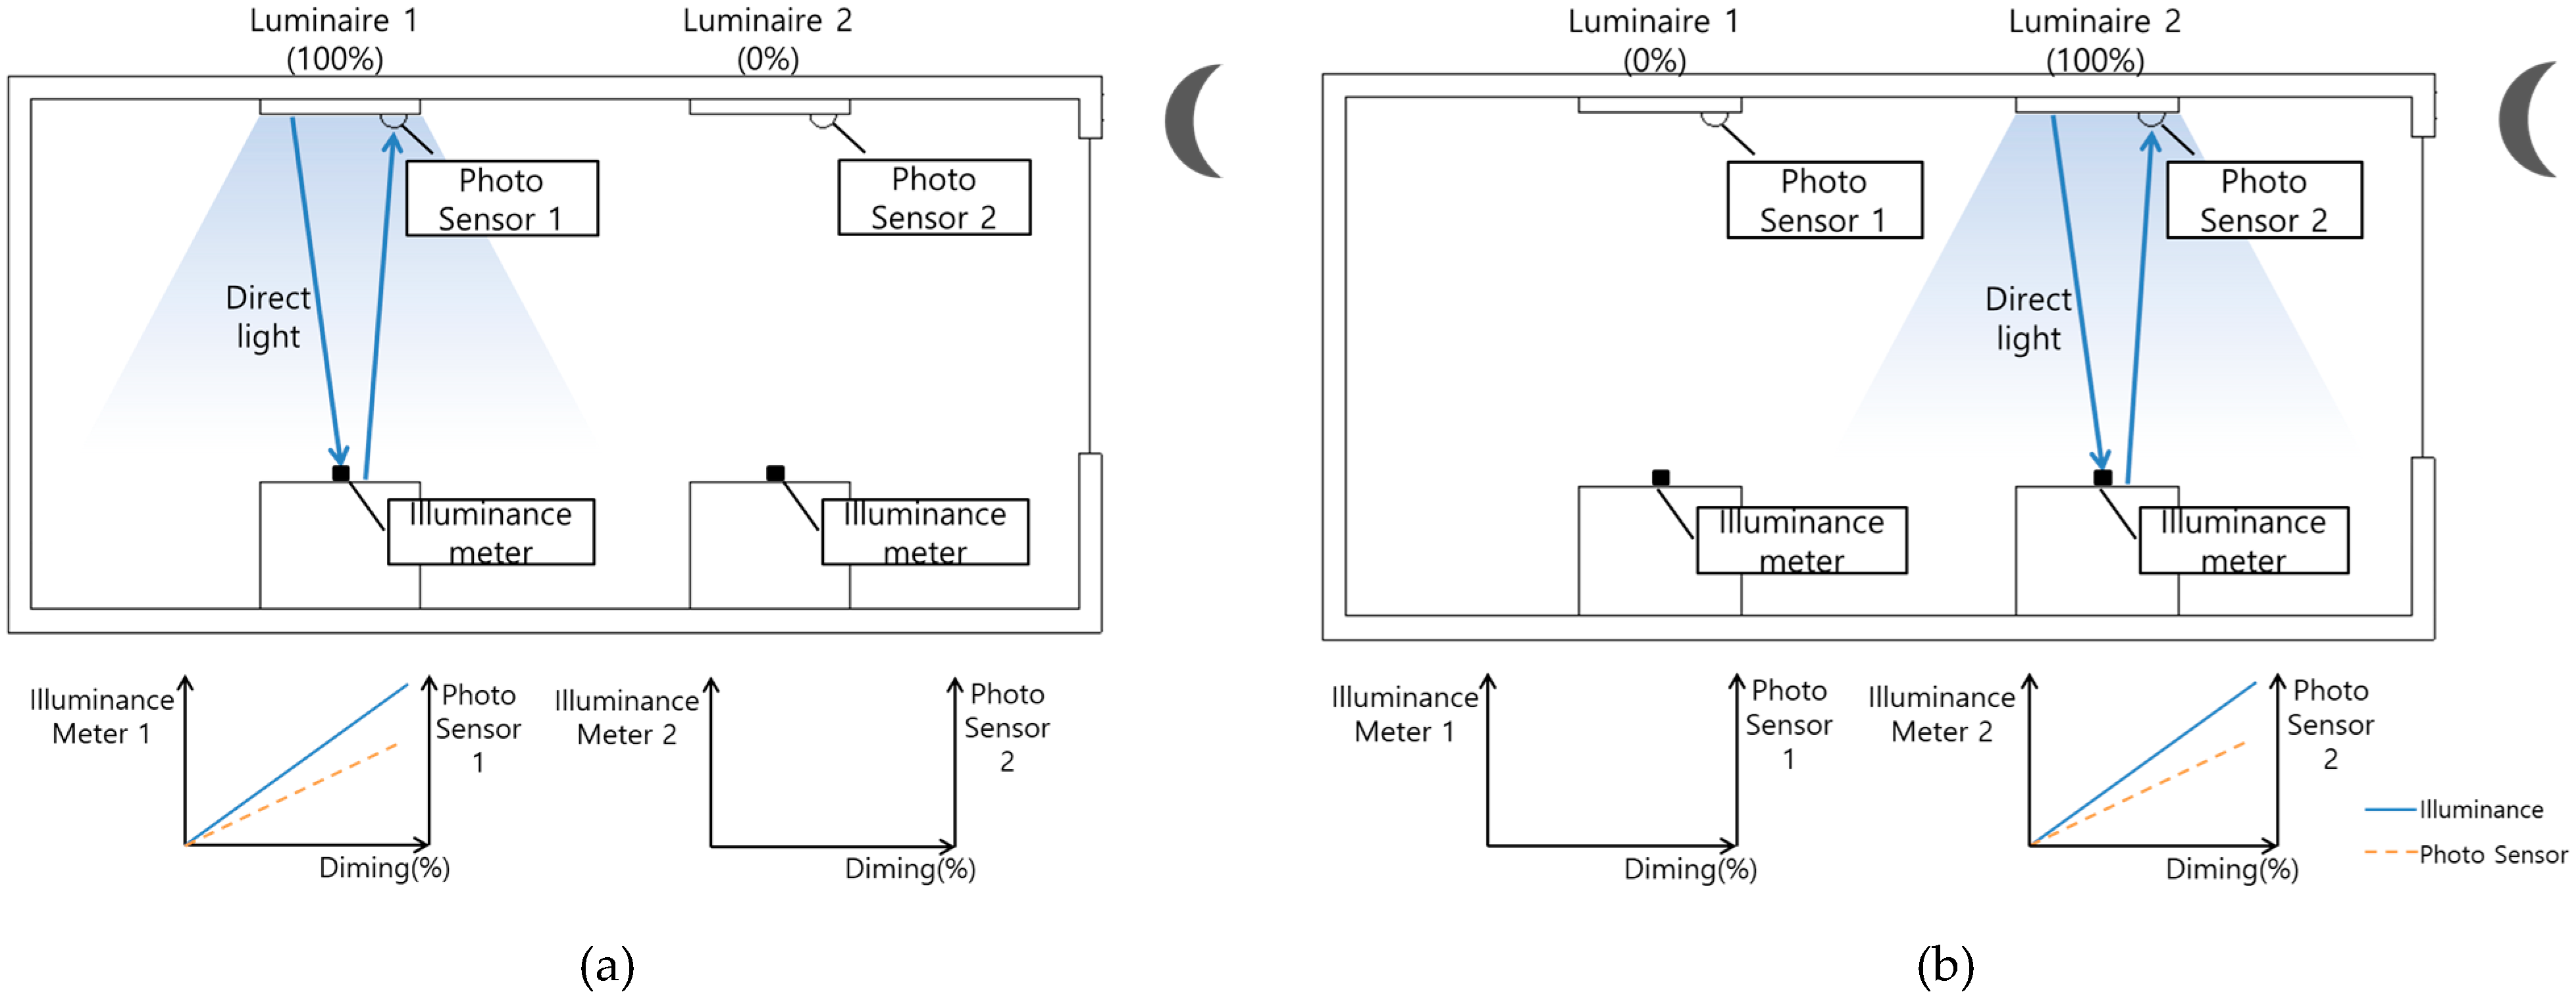
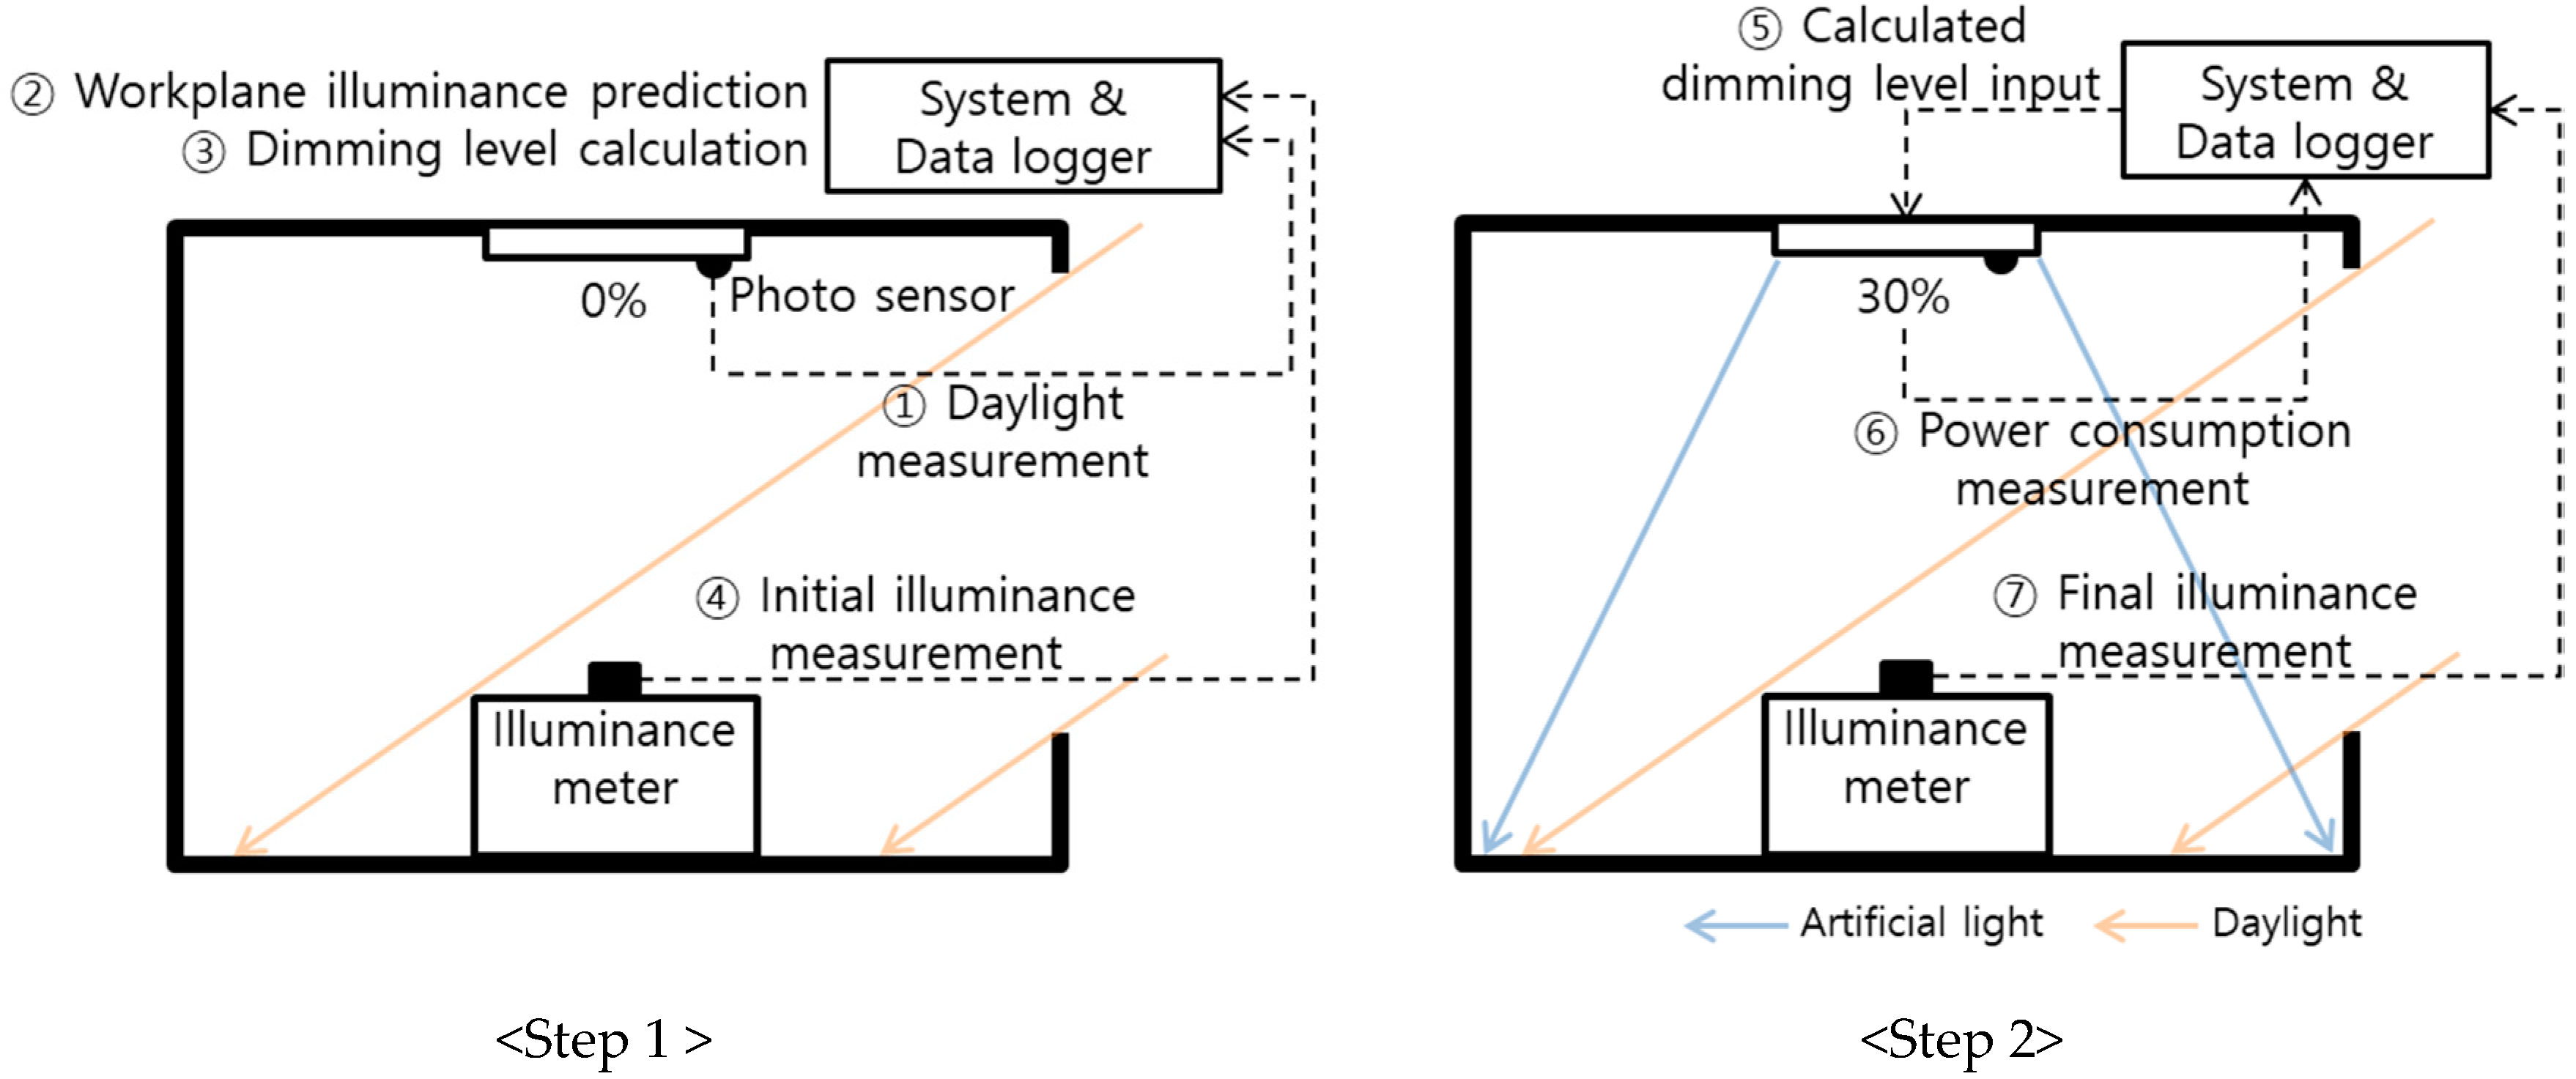
2.1.3. Simplified Dimming Control Algorithm (Simple Commissioning)
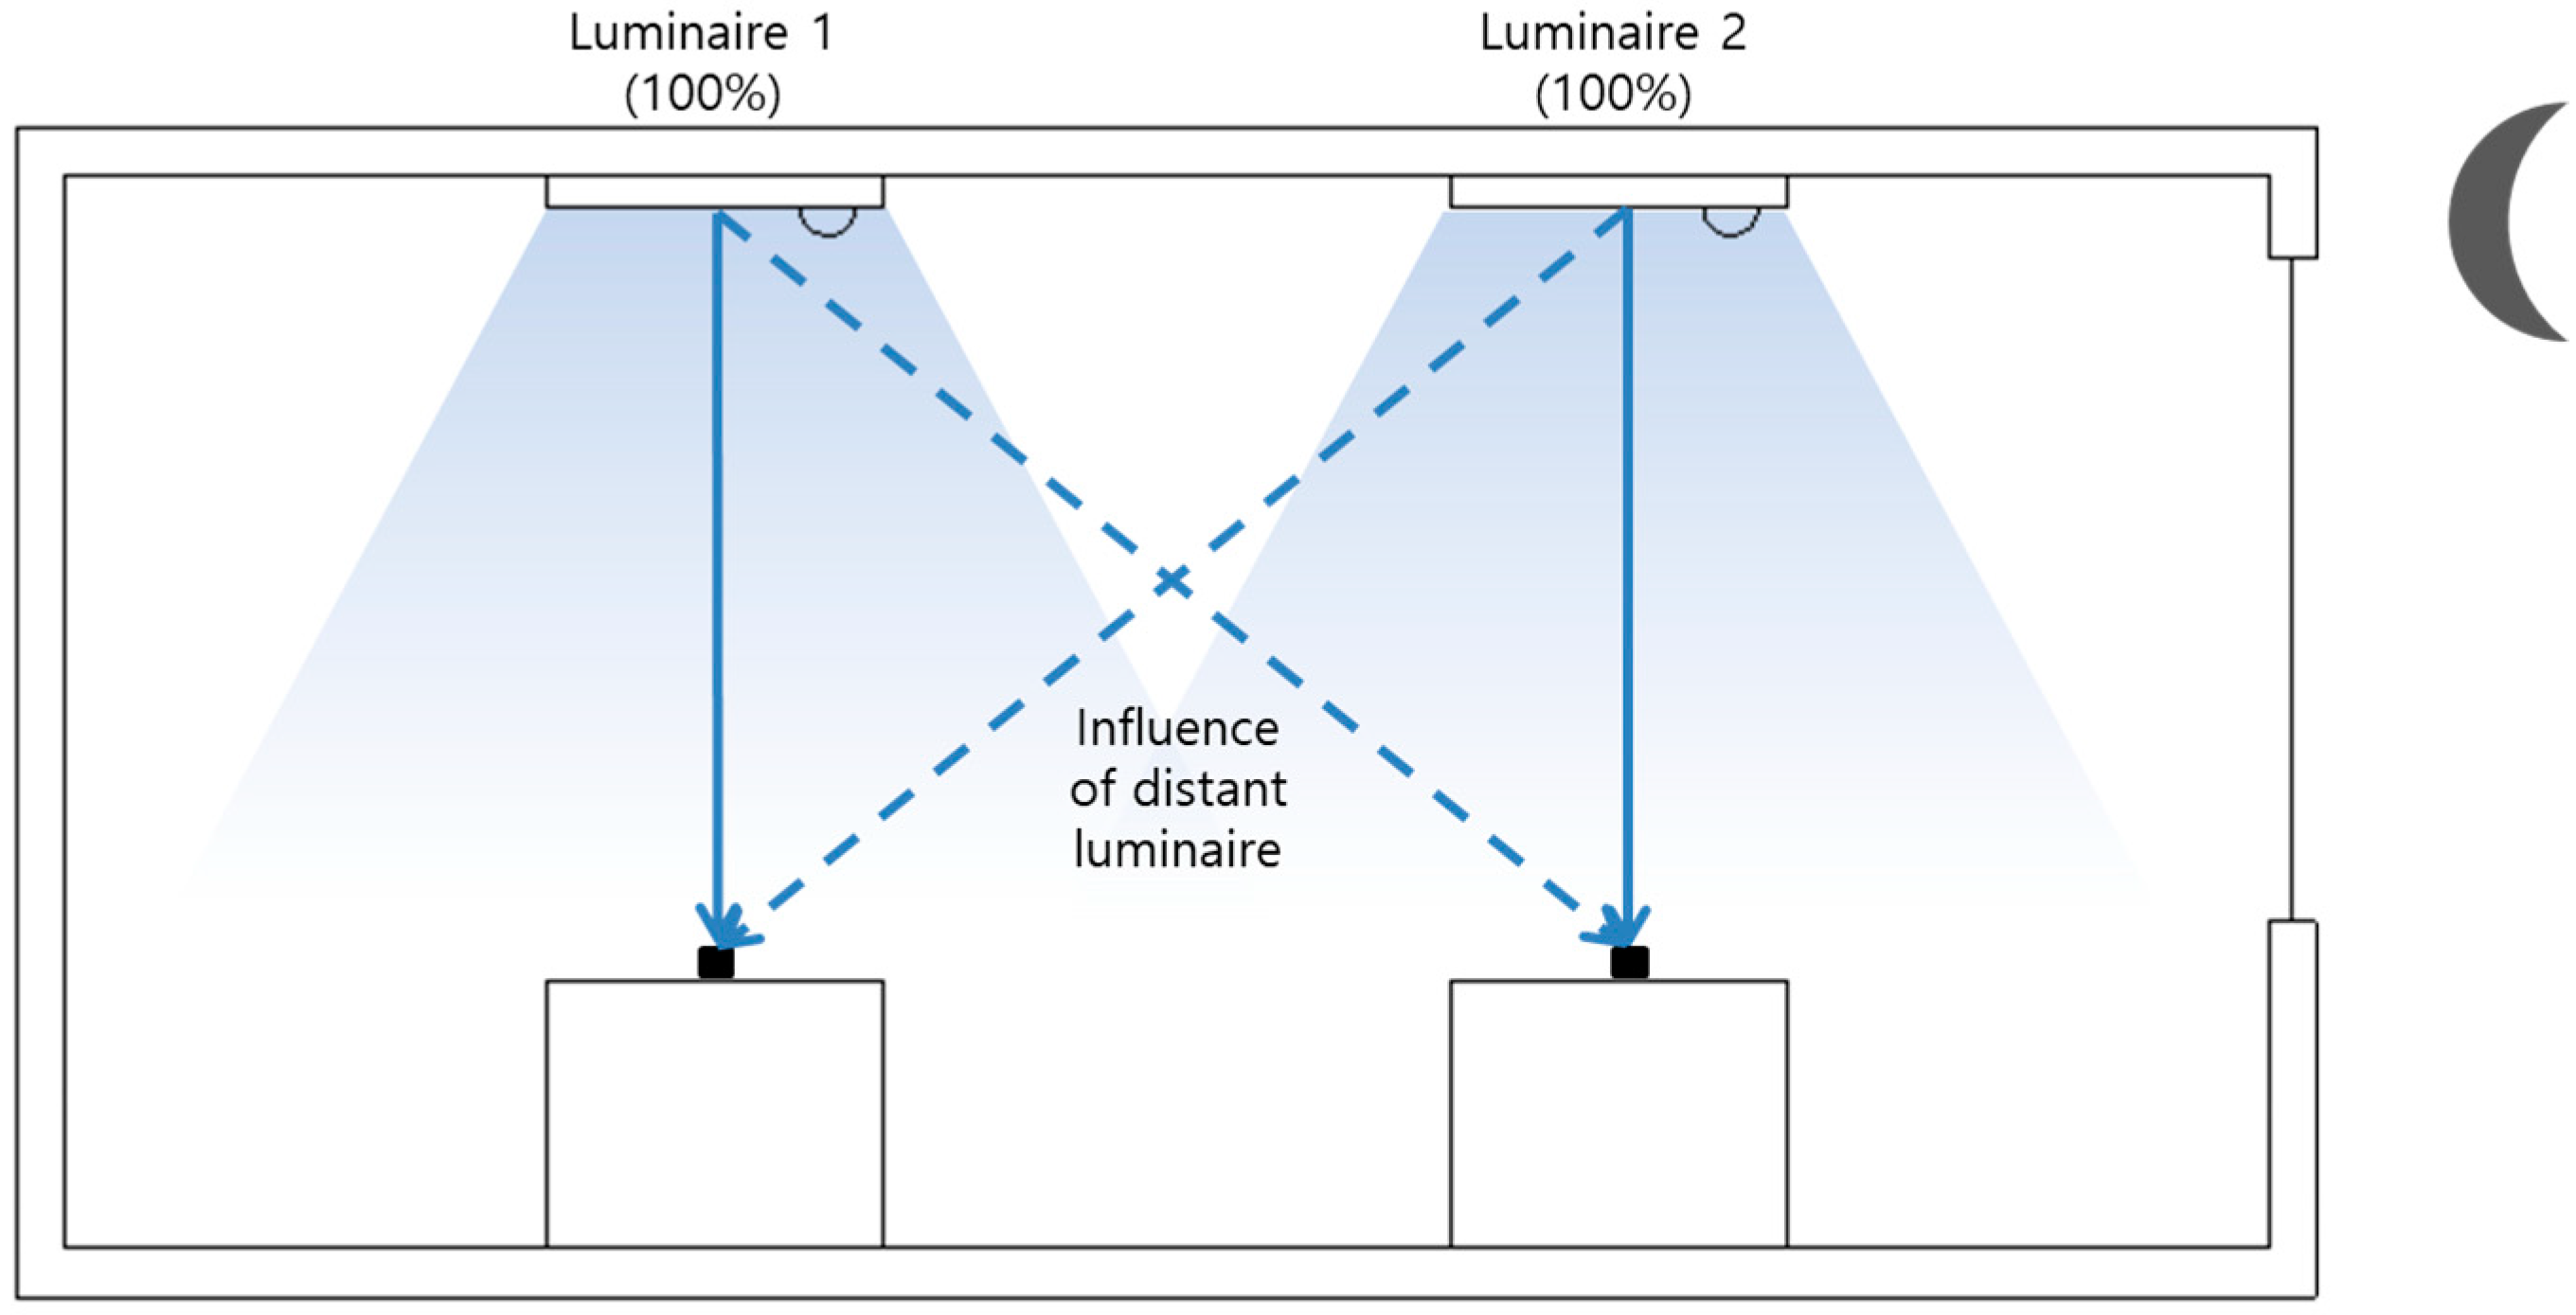
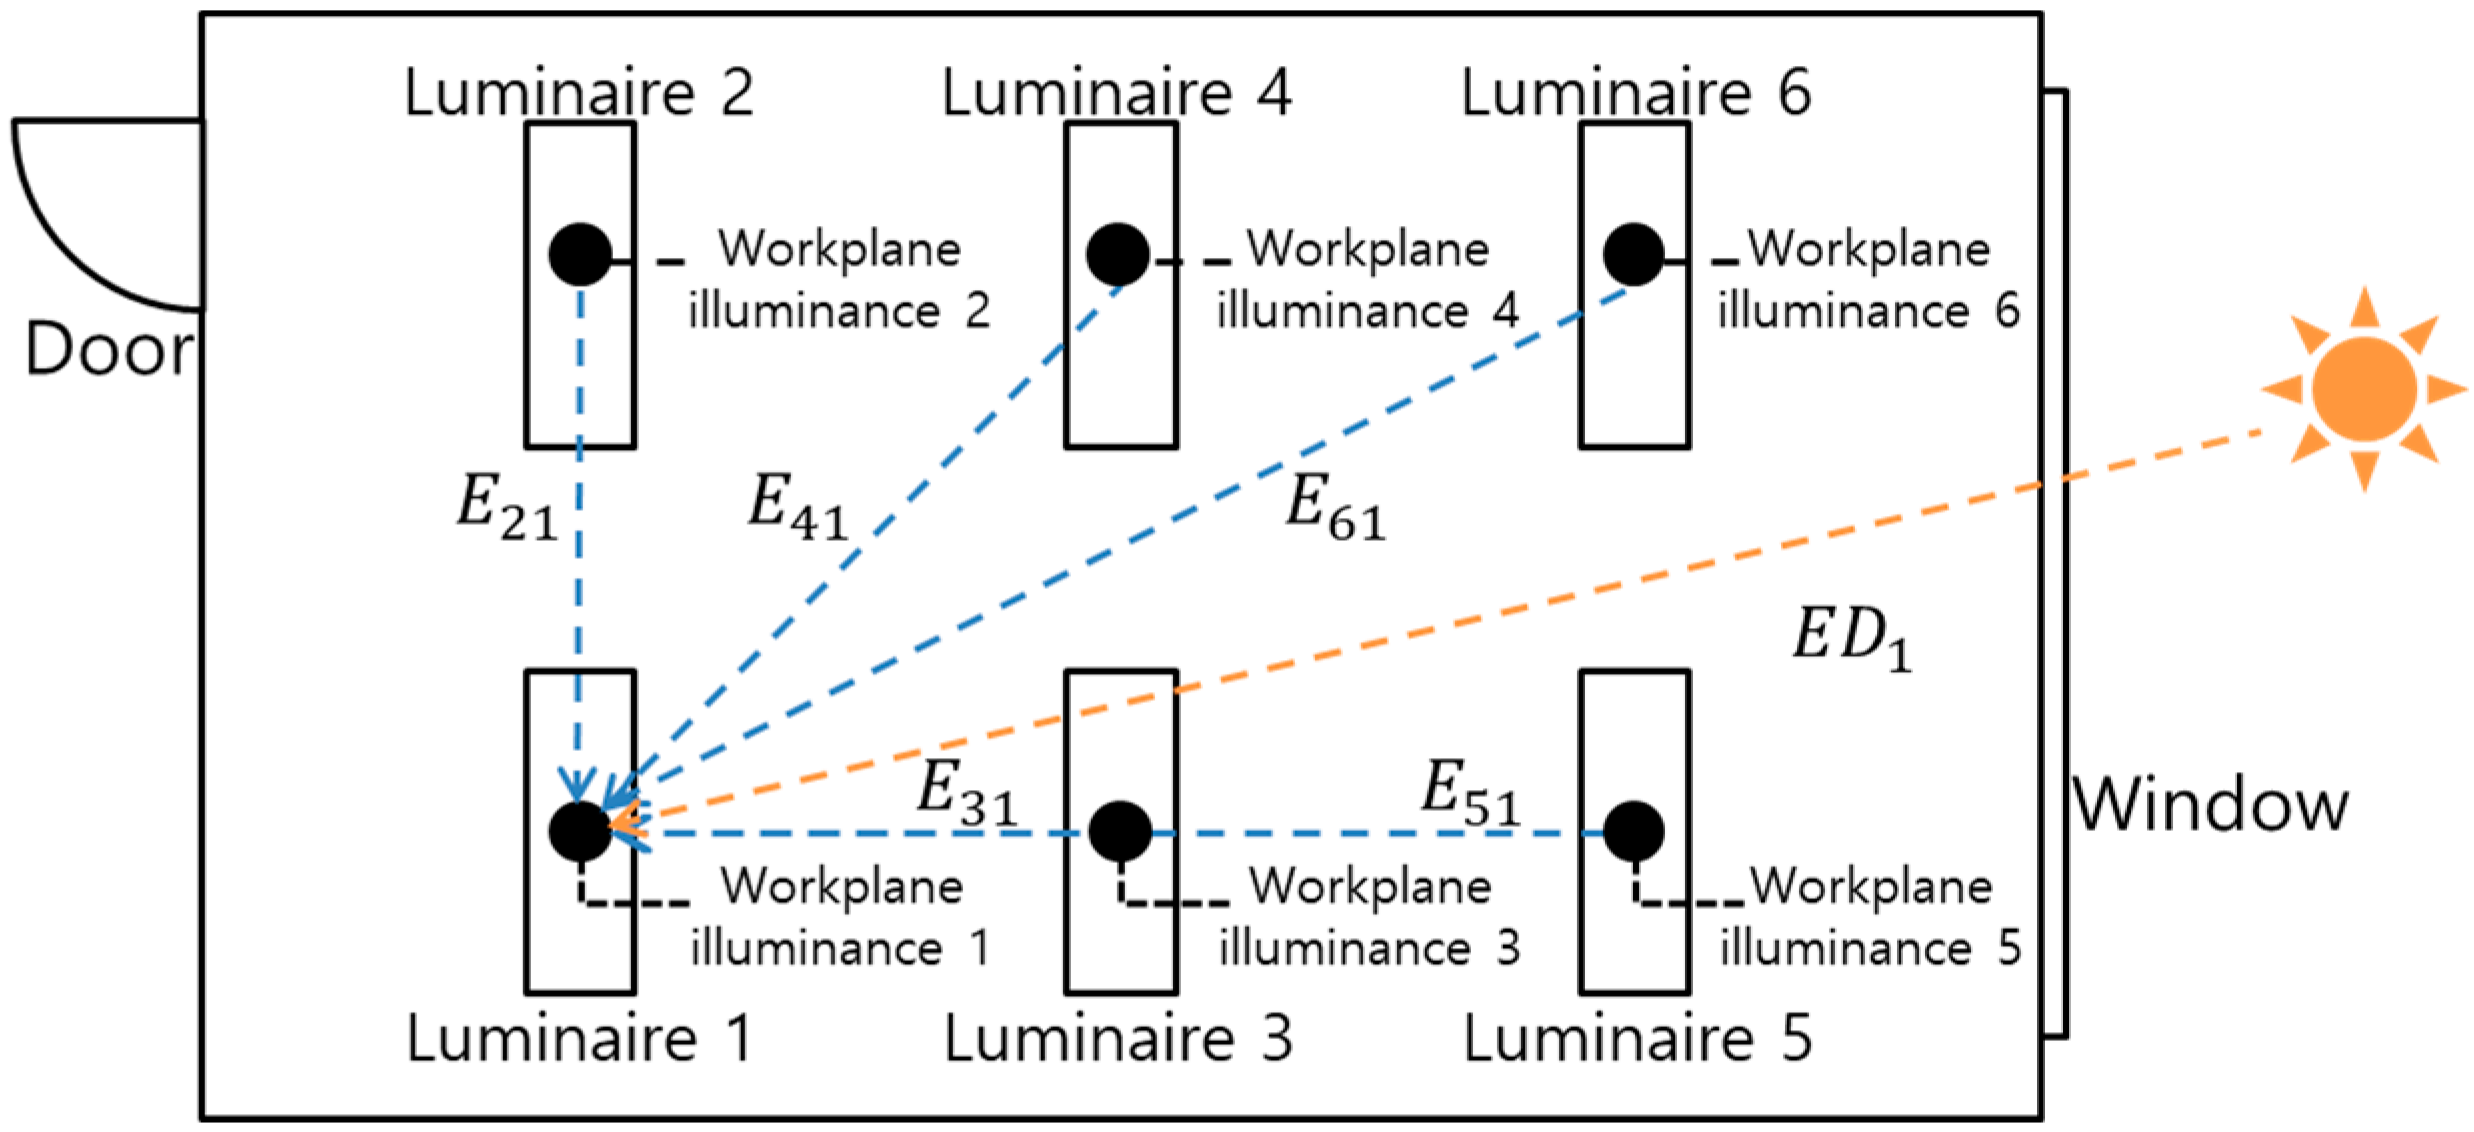
2.1.4. Proposed Dimming Control Algorithm (Advanced Commissioning)
- ED1 = Daylight illuminance at the position directly under luminaire (1)
- Eij = Workplane illuminance at the position directly under luminaire (j) from luminaire (i)
- ETj = Final workplane illuminance at the position directly under luminaire (j)
- EDj = Daylight illuminance at the position directly under luminaire (j)
- n = Number of luminaires
E12 + E22 + E32 + E42 + E52 + E62 = ER2
E13 + E23 + E33 + E43 + E53 + E63 = ER3
E14 + E24 + E34 + E44 + E54 + E64 = ER4
E15 + E25 + E35 + E45 + E55 + E65 = ER5
E16 + E26 + E36 + E46 + E56 + E66 = ER6
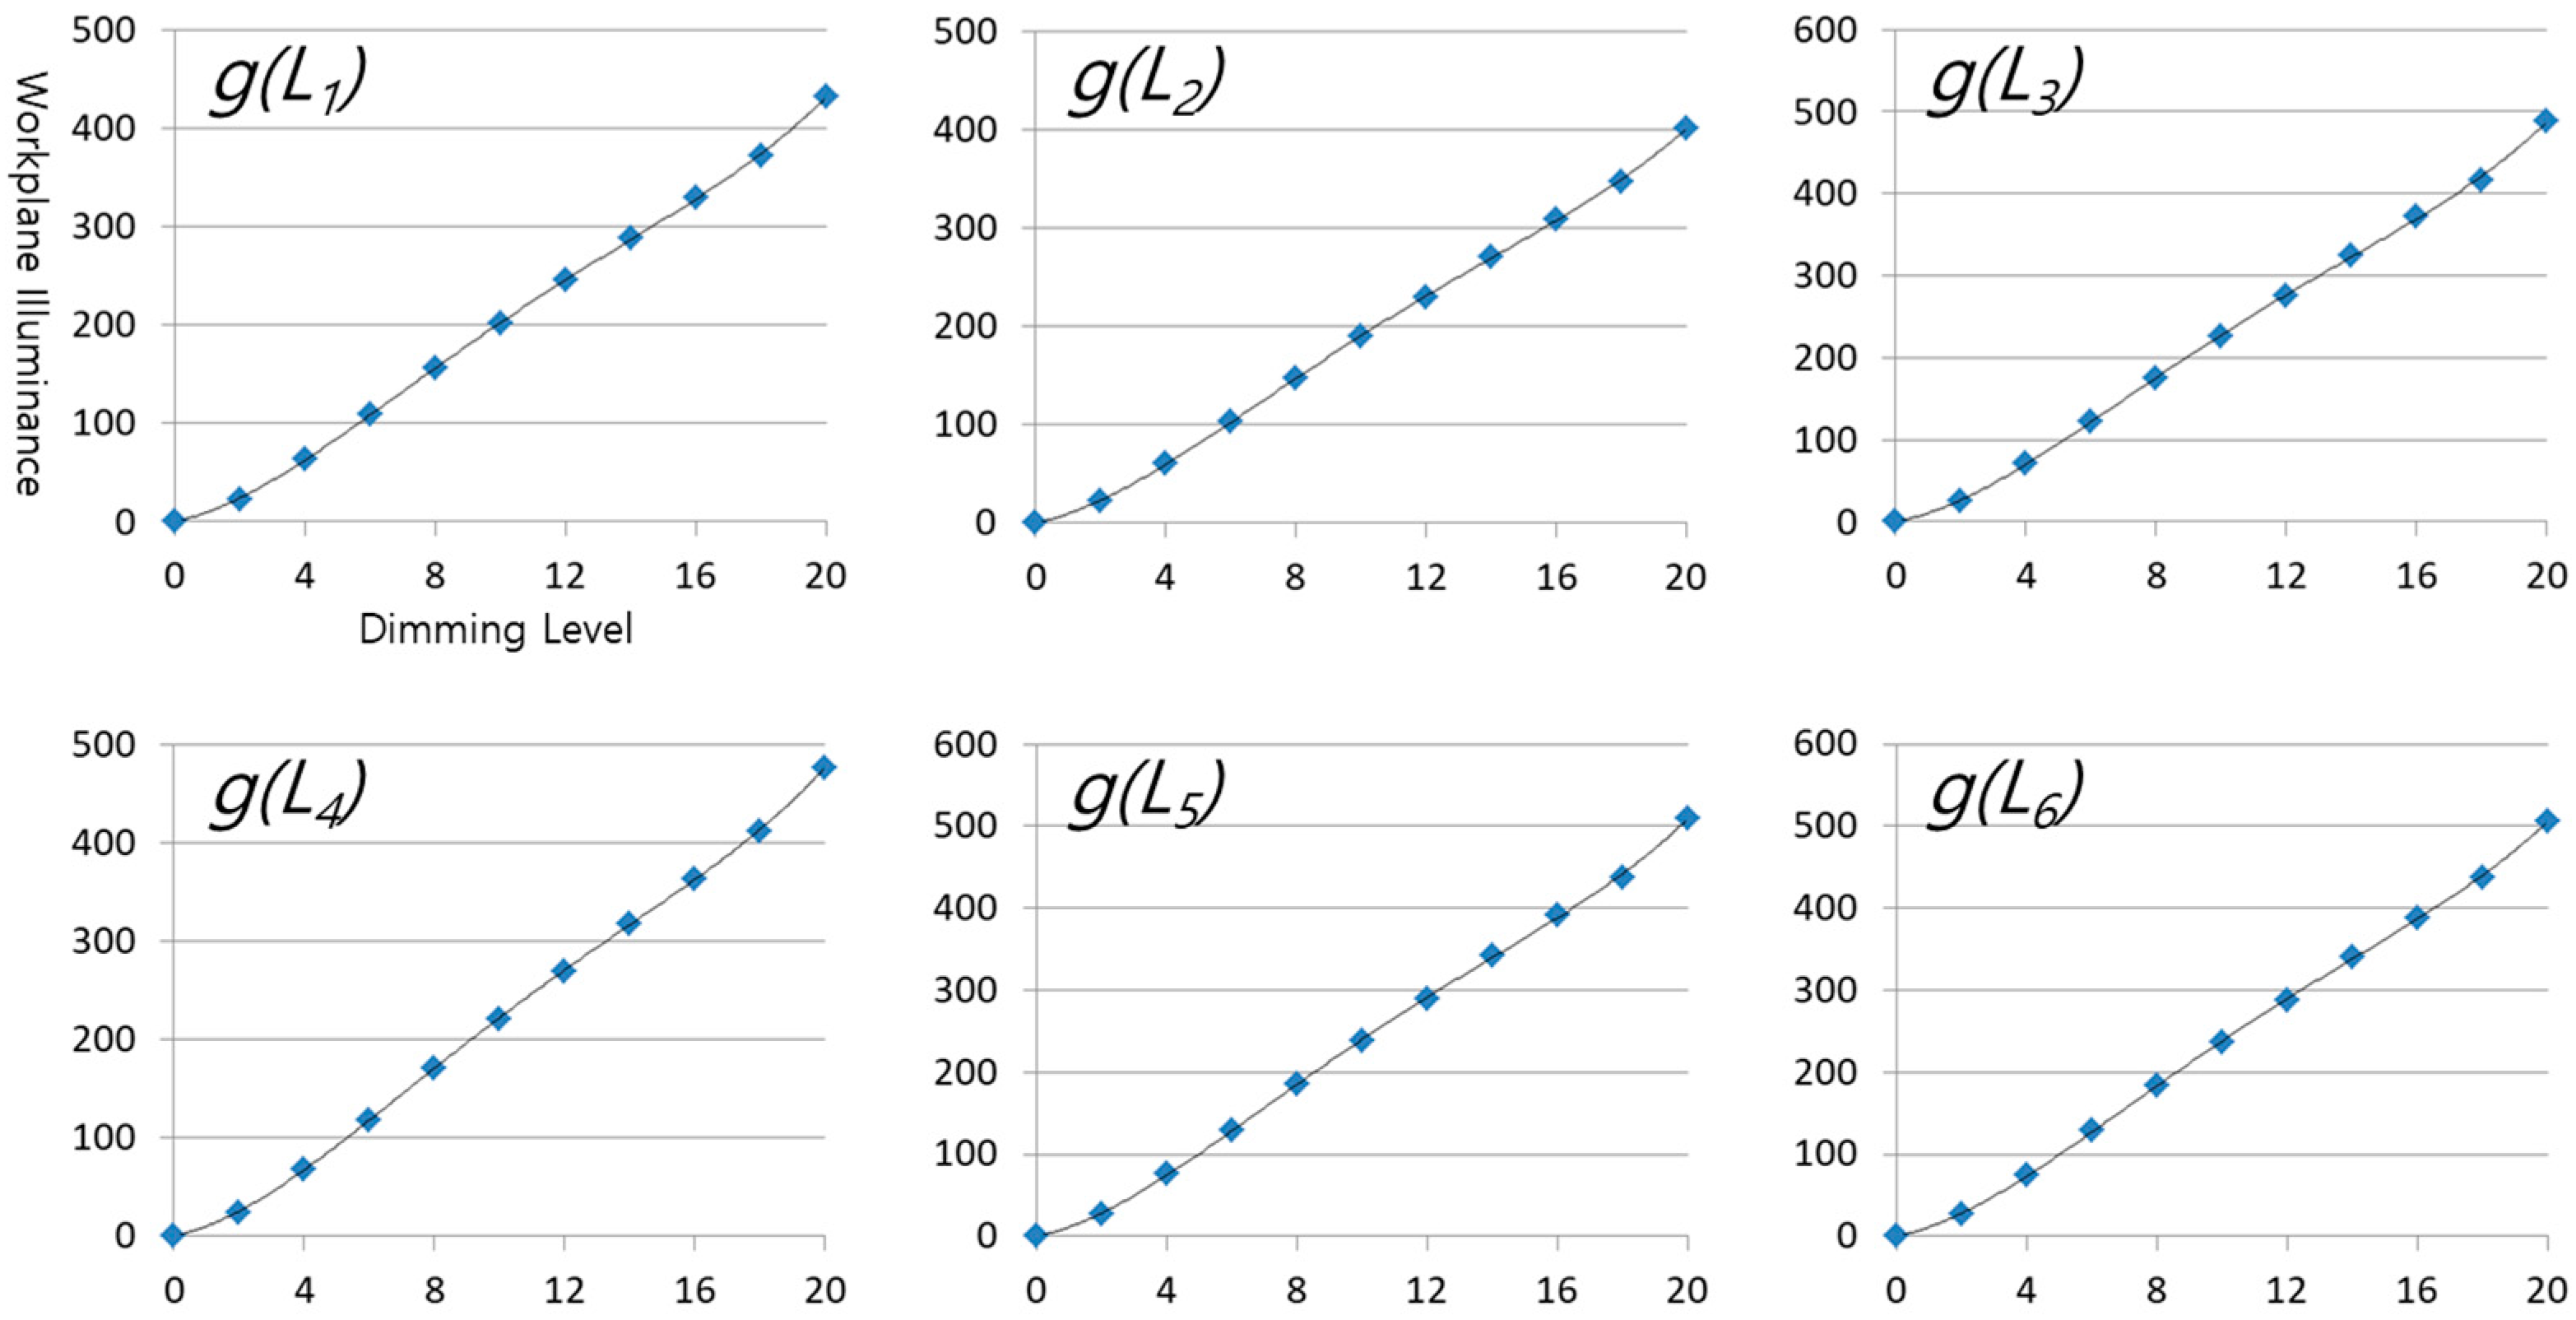
g(Lj) = Regression equation of the workplane illuminance at the position directly under luminaire (j) according to the dimming level of luminaire (j)
IEij = Proportion of the workplane illuminance at the position directly under luminaire (i) and the workplane illuminance at the position directly under luminaire (j) by luminaire (i)
IE12g(L1) + IE22g(L2) + IE32g(L3) + IE42g(L4) + IE52g(L5) + IE62g(L6) = ER2
IE13g(L1) + IE23g(L2) + IE33g(L3) + IE43g(L4) + IE53g(L5) + IE63g(L6) = ER3
IE14g(L1) + IE24g(L2) + IE34g(L3) + IE44g(L4) + IE54g(L5) + IE64g(L6) = ER4
IE15g(L1) + IE25g(L2) + IE35g(L3) + IE45g(L4) + IE55g(L5) + IE65g(L6) = ER5
IE16g(L1) + IE26g(L2) + IE36g(L3) + IE46g(L4) + IE56g(L5) + IE66g(L6) = ER6
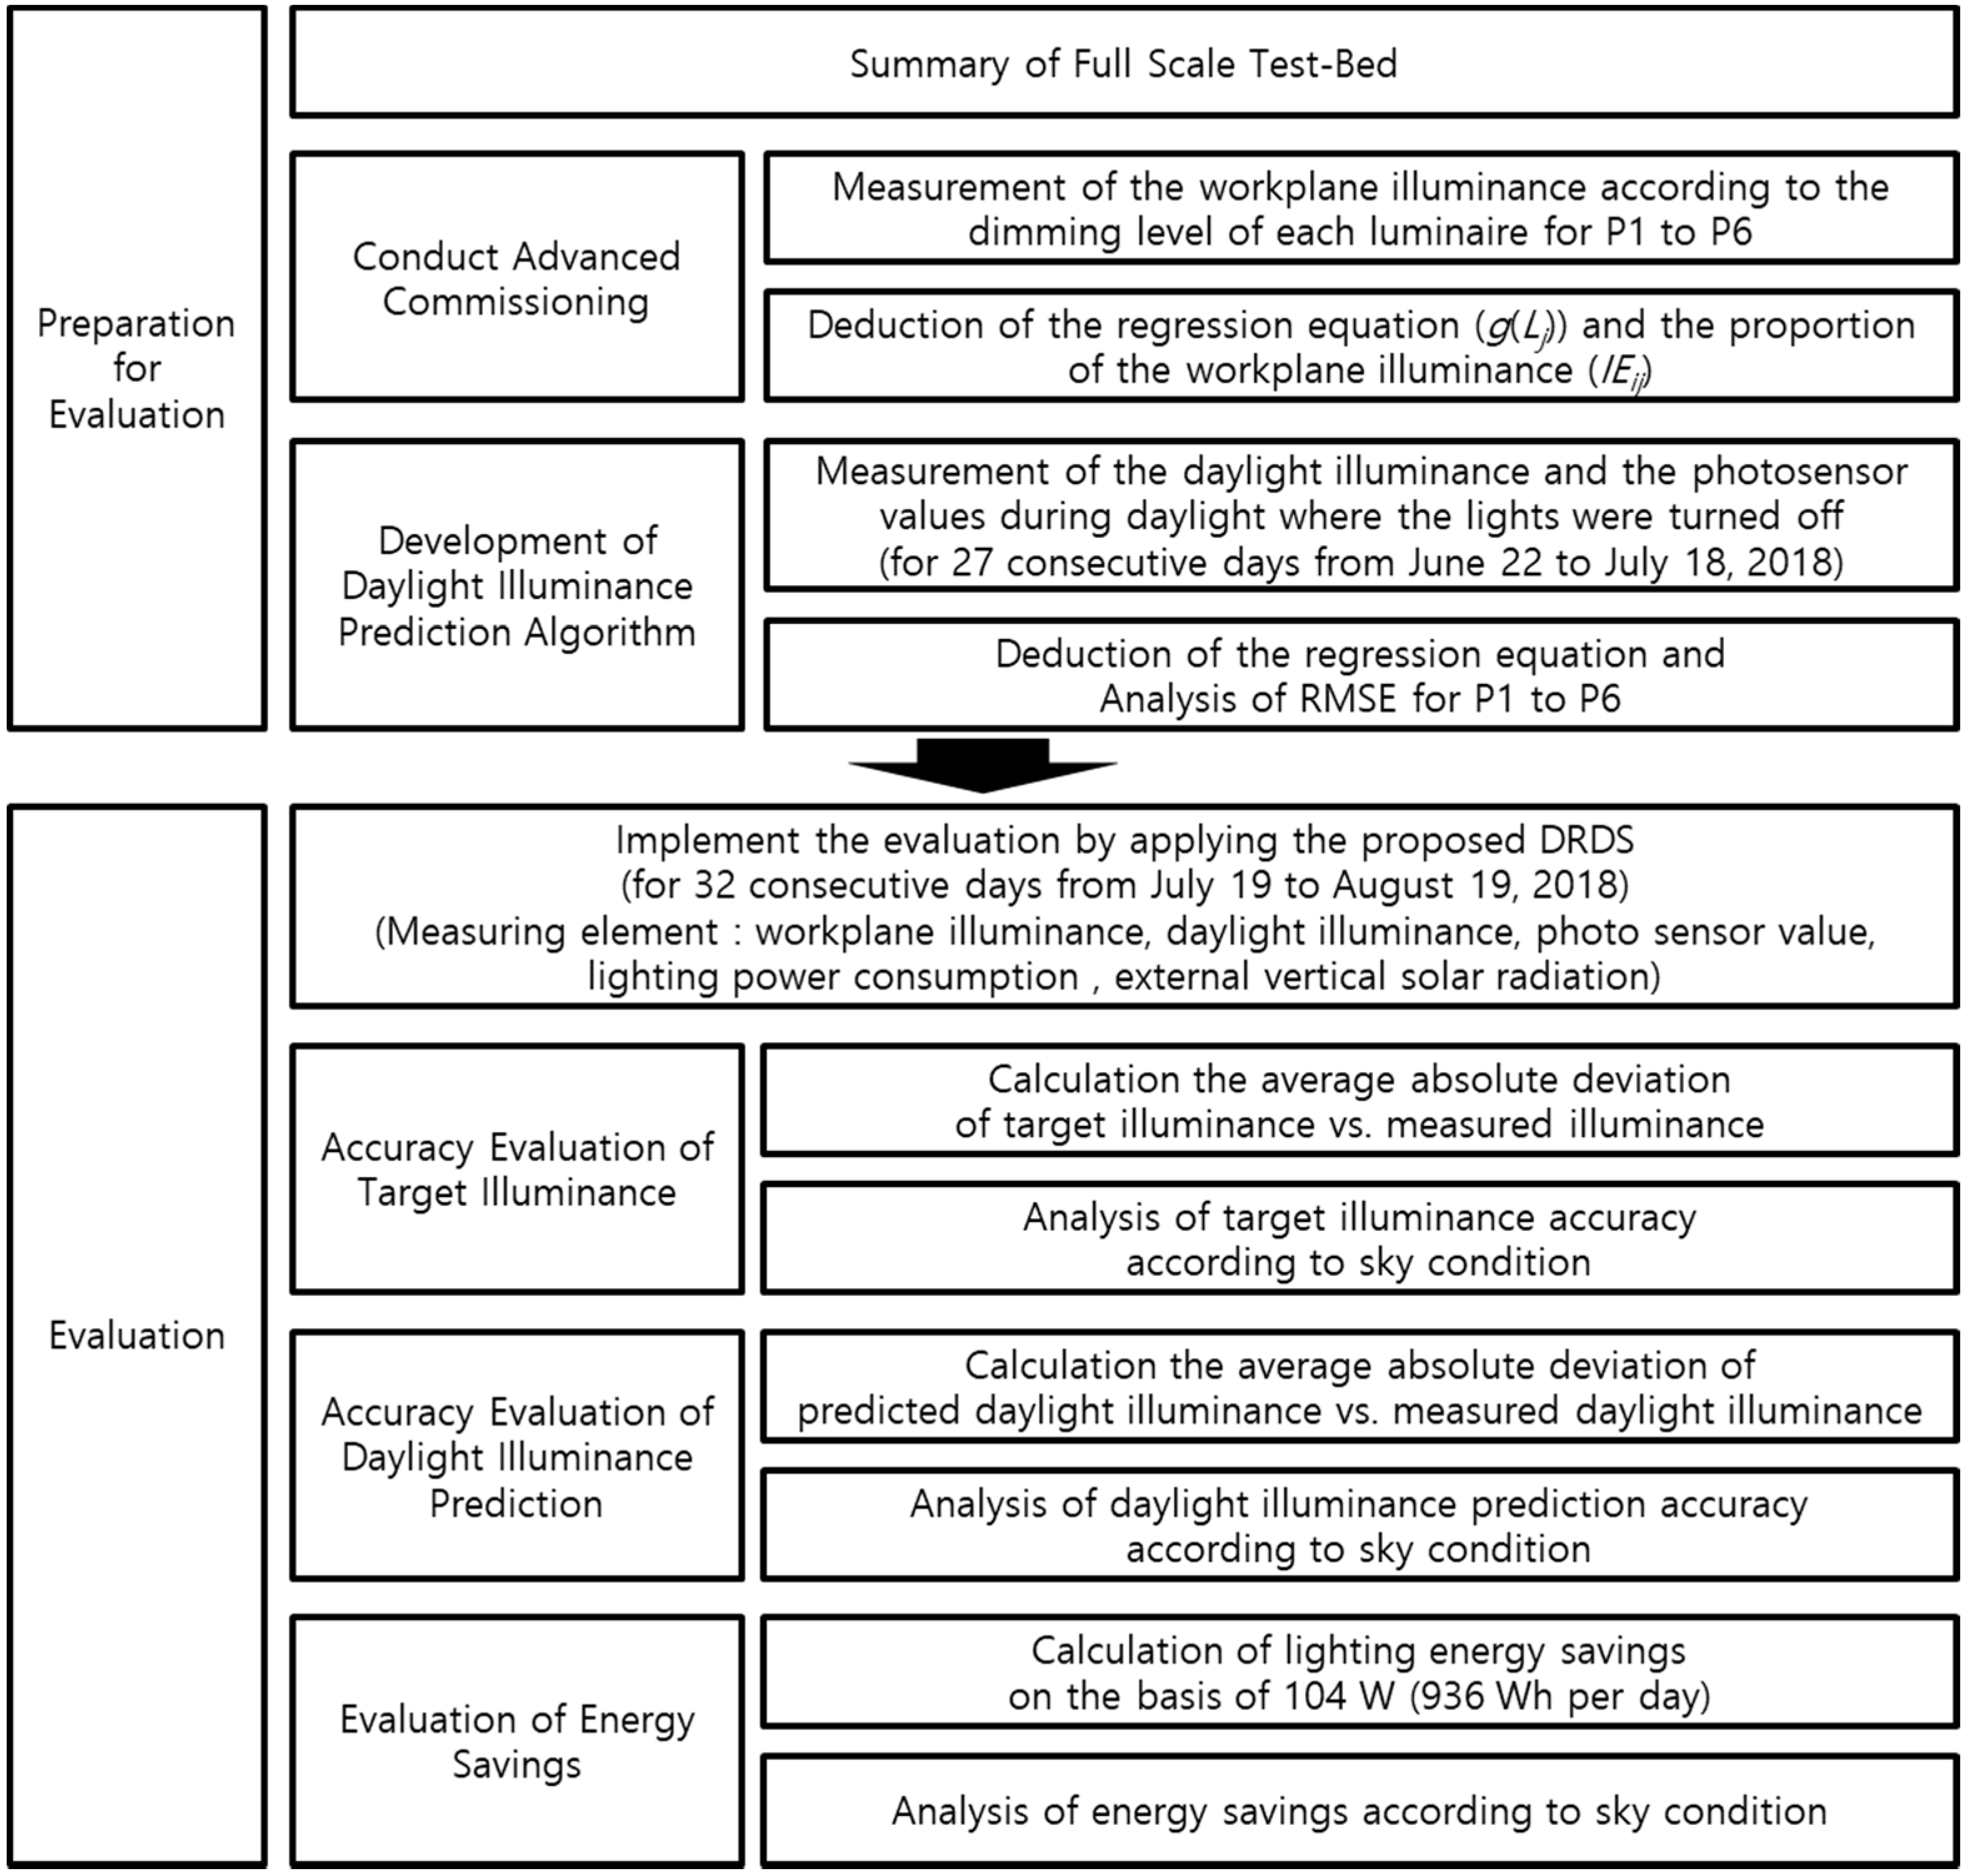
2.2. Evaluation
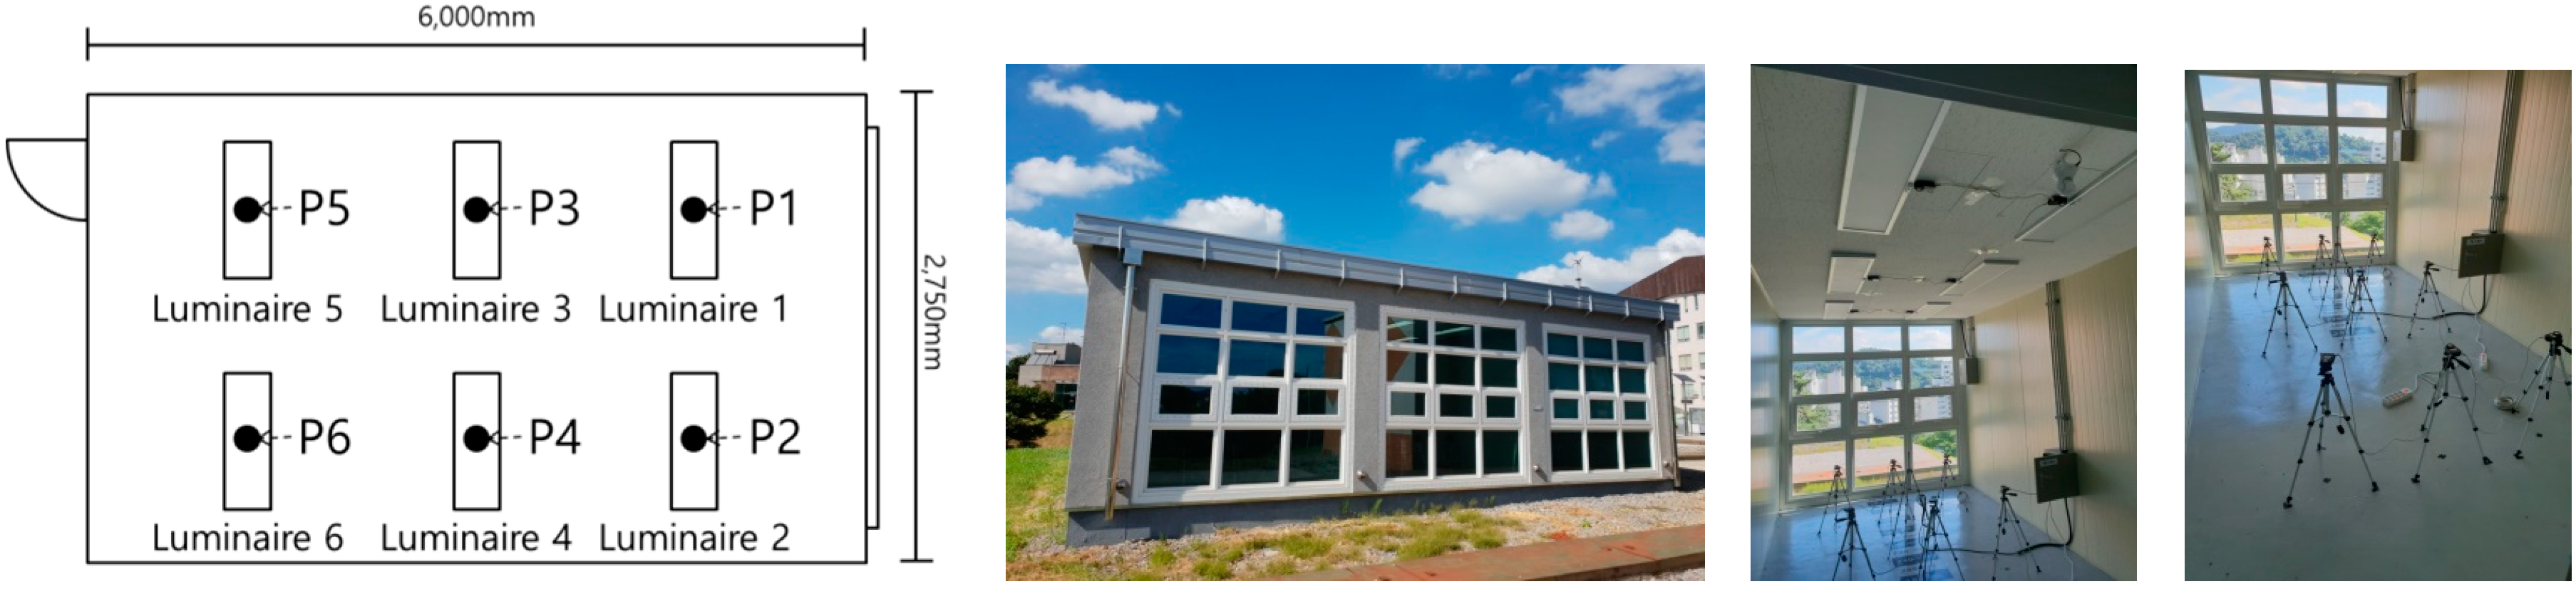
2.2.1. Test-Bed
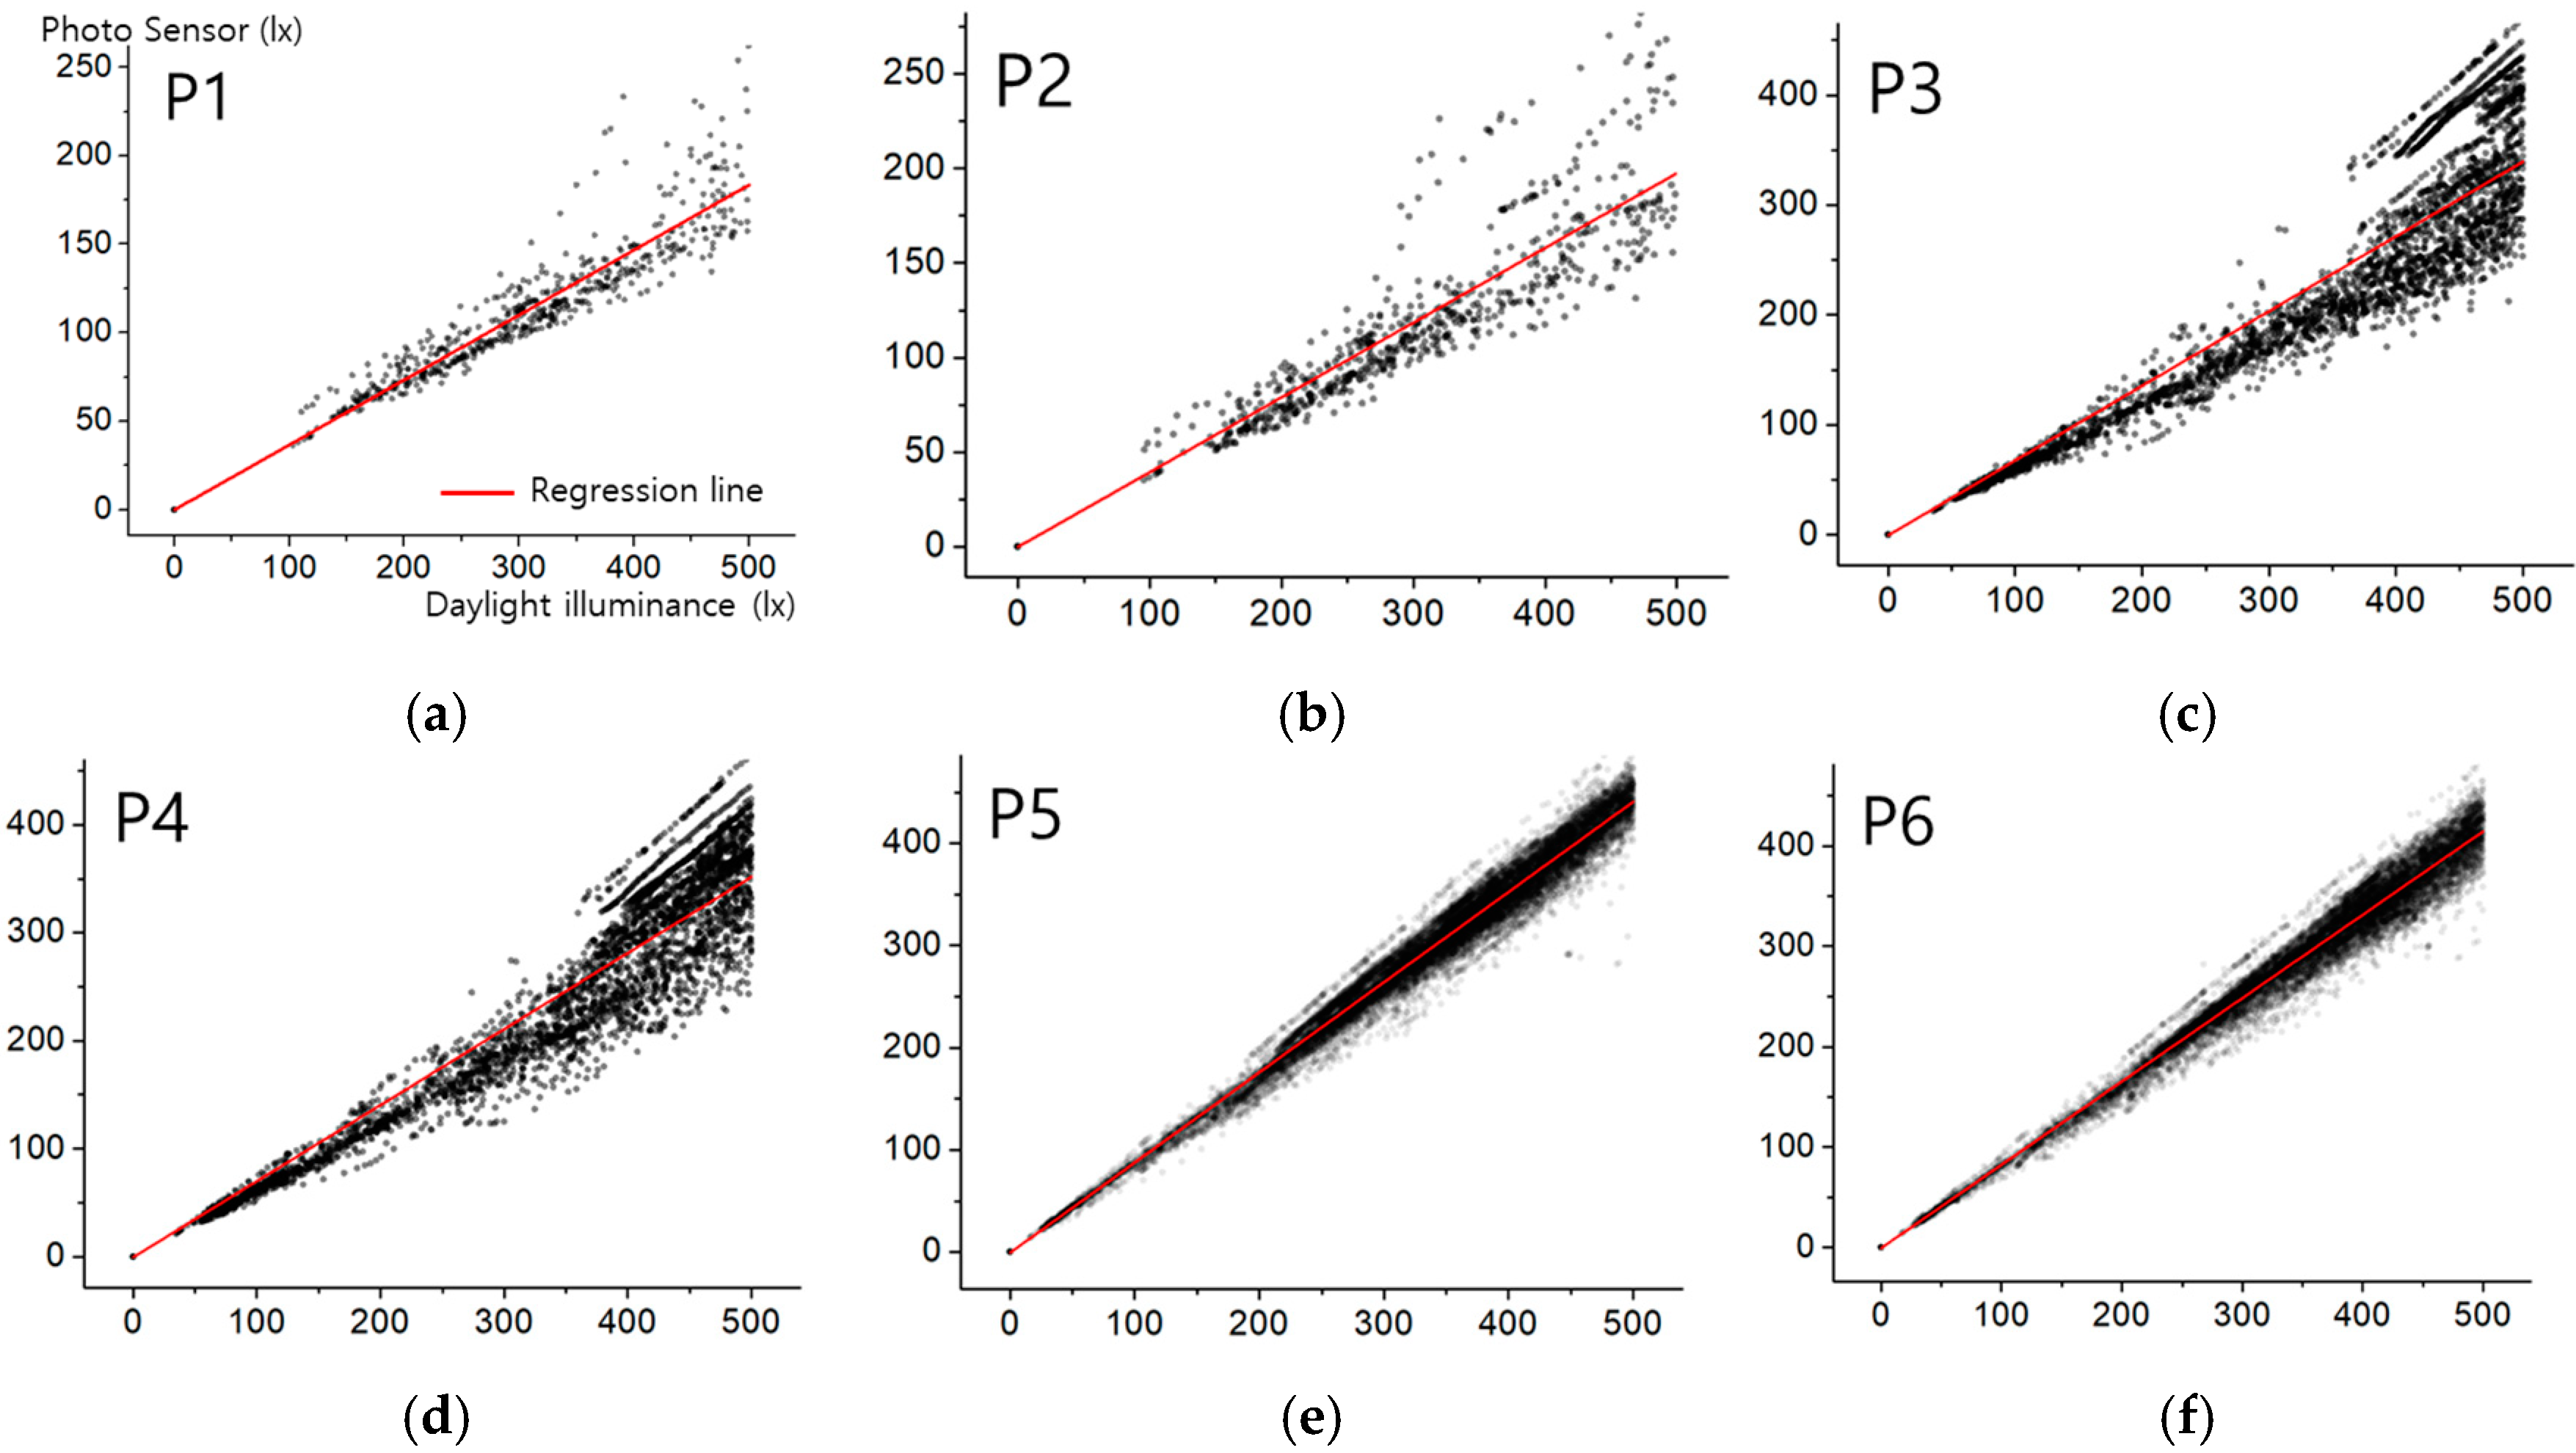
2.2.2. Prediction Algorithm of Daylight Illuminance on the Workplane
3. Results
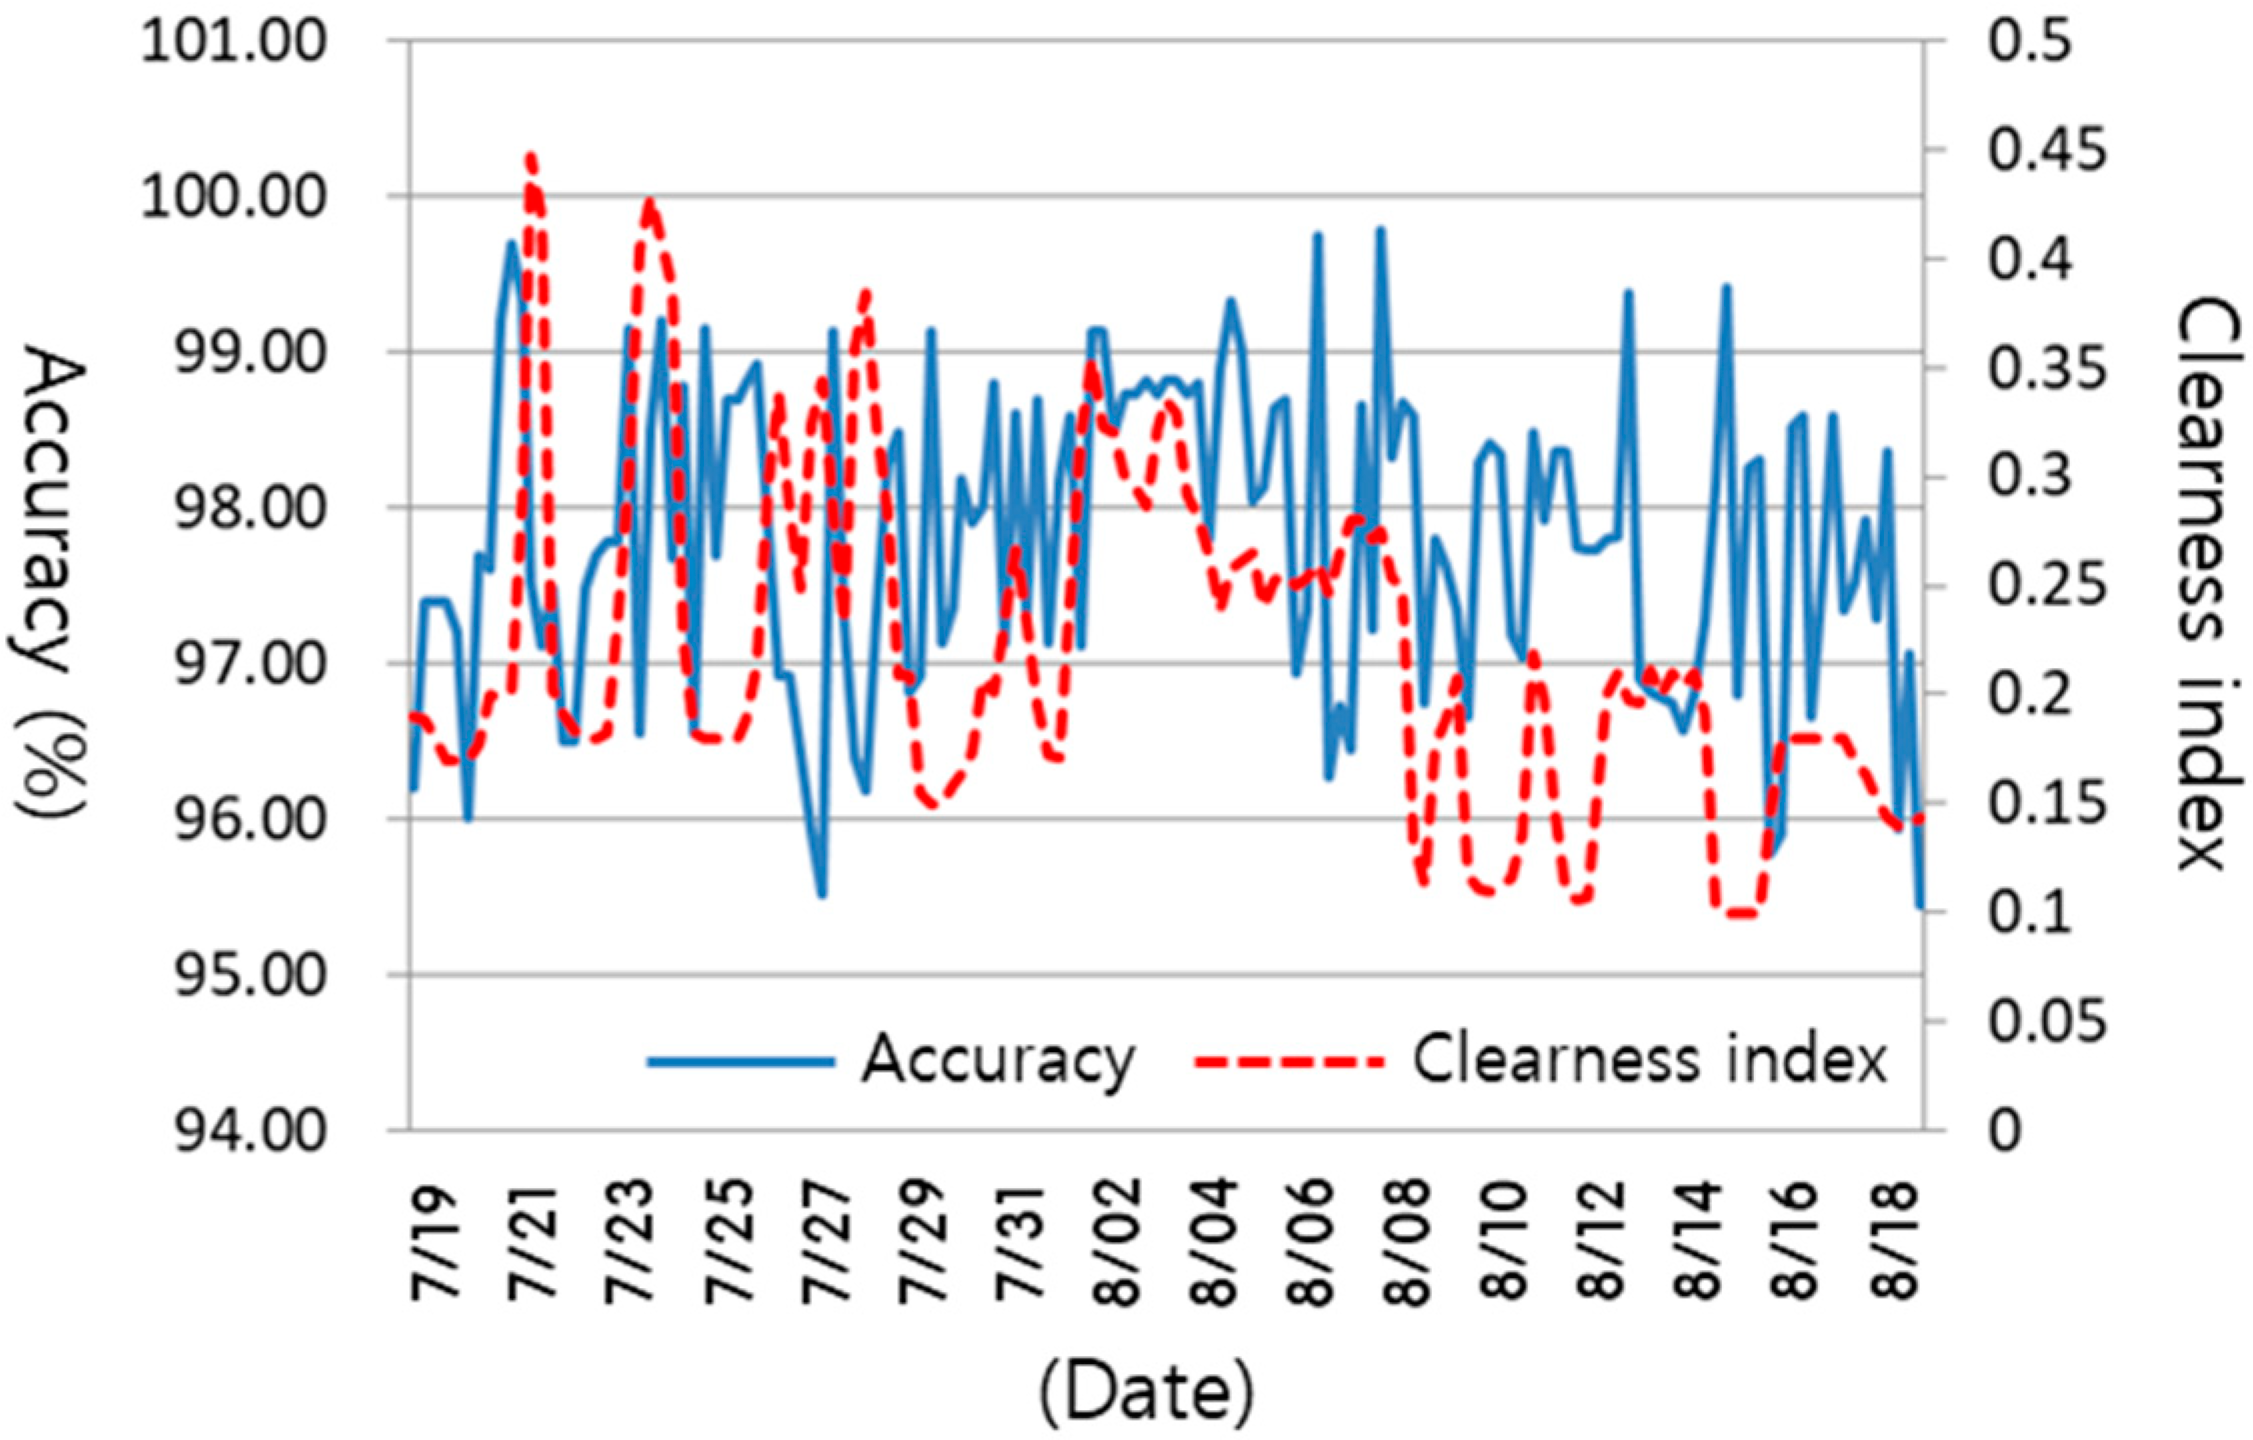
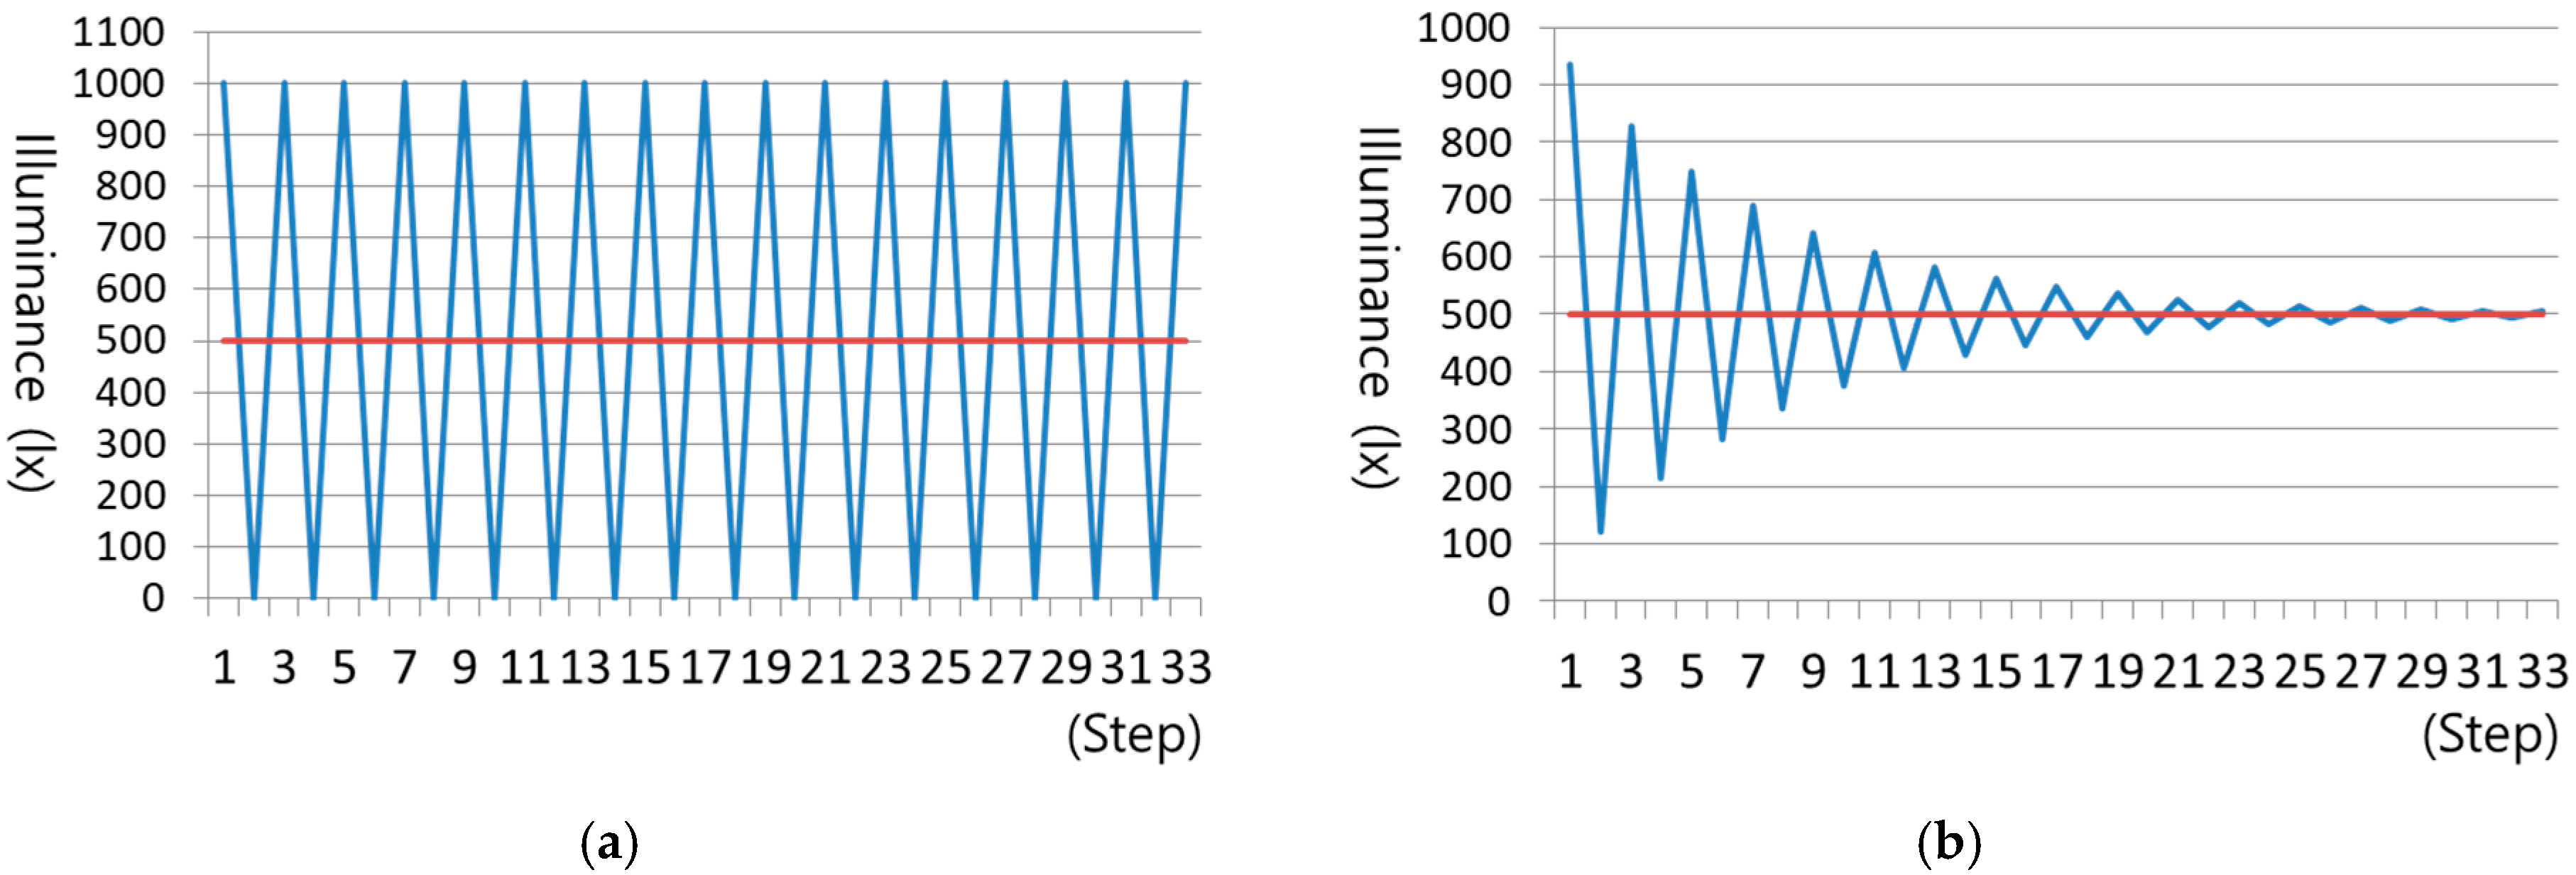
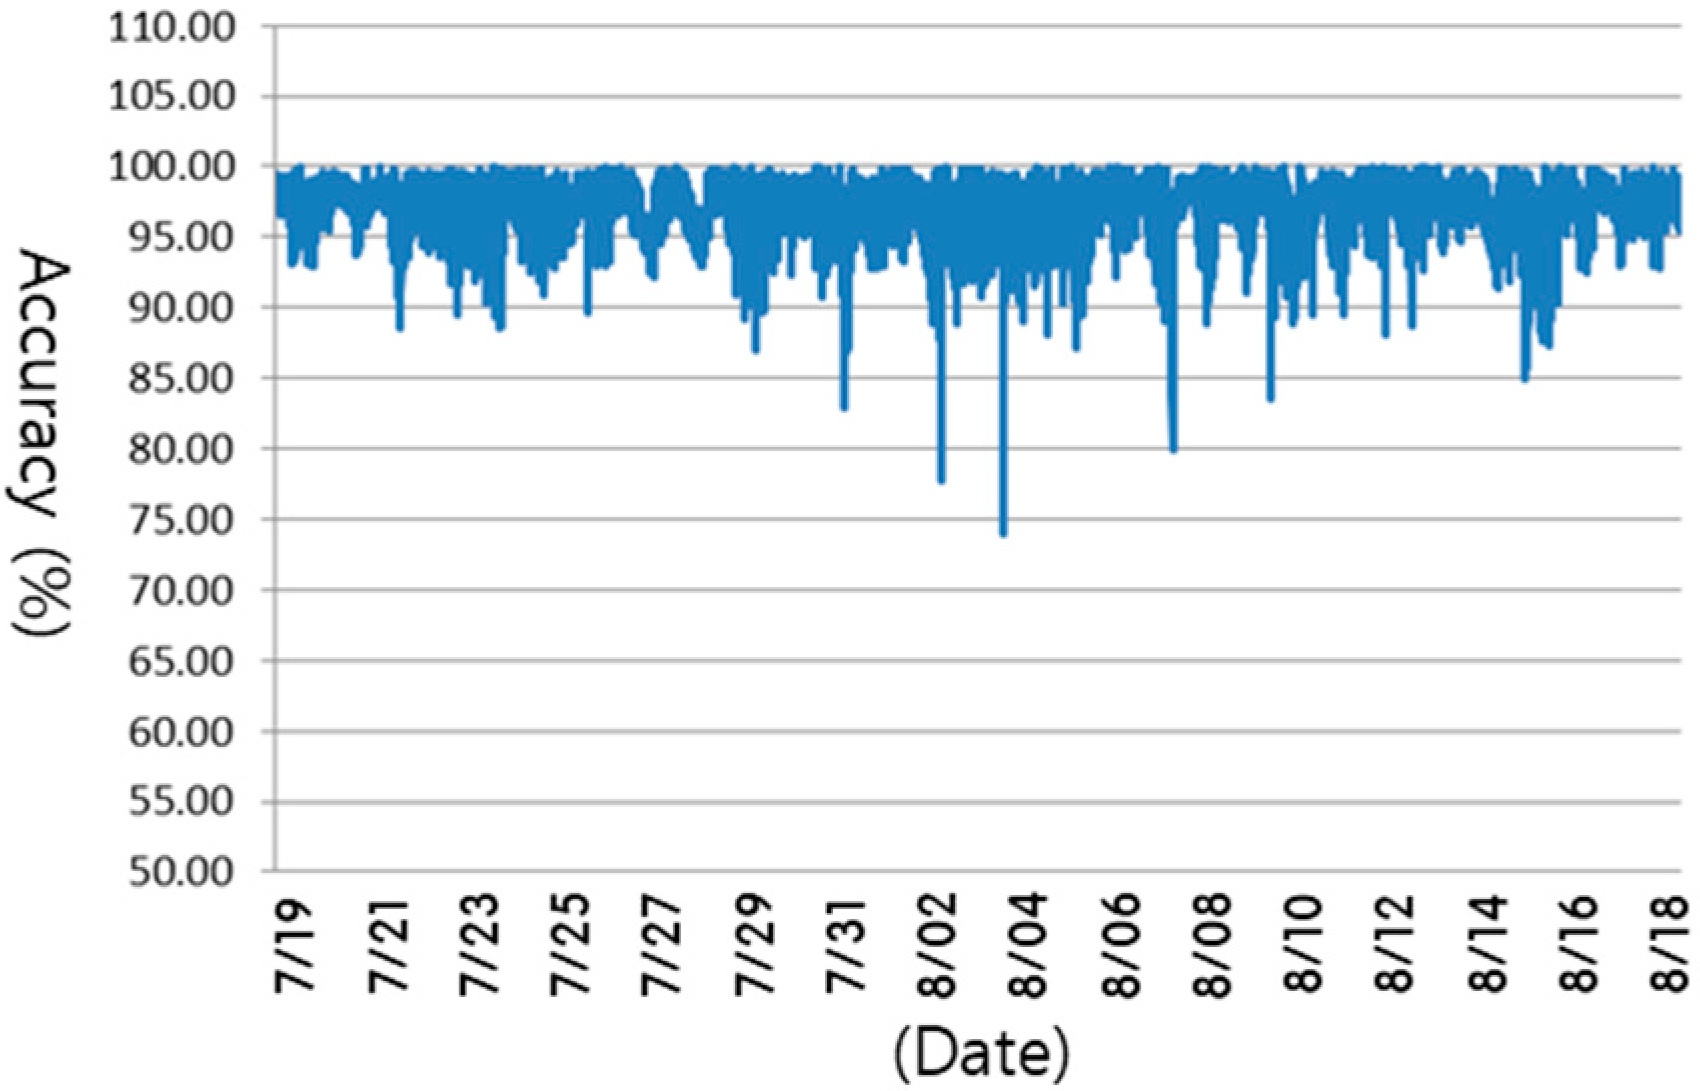
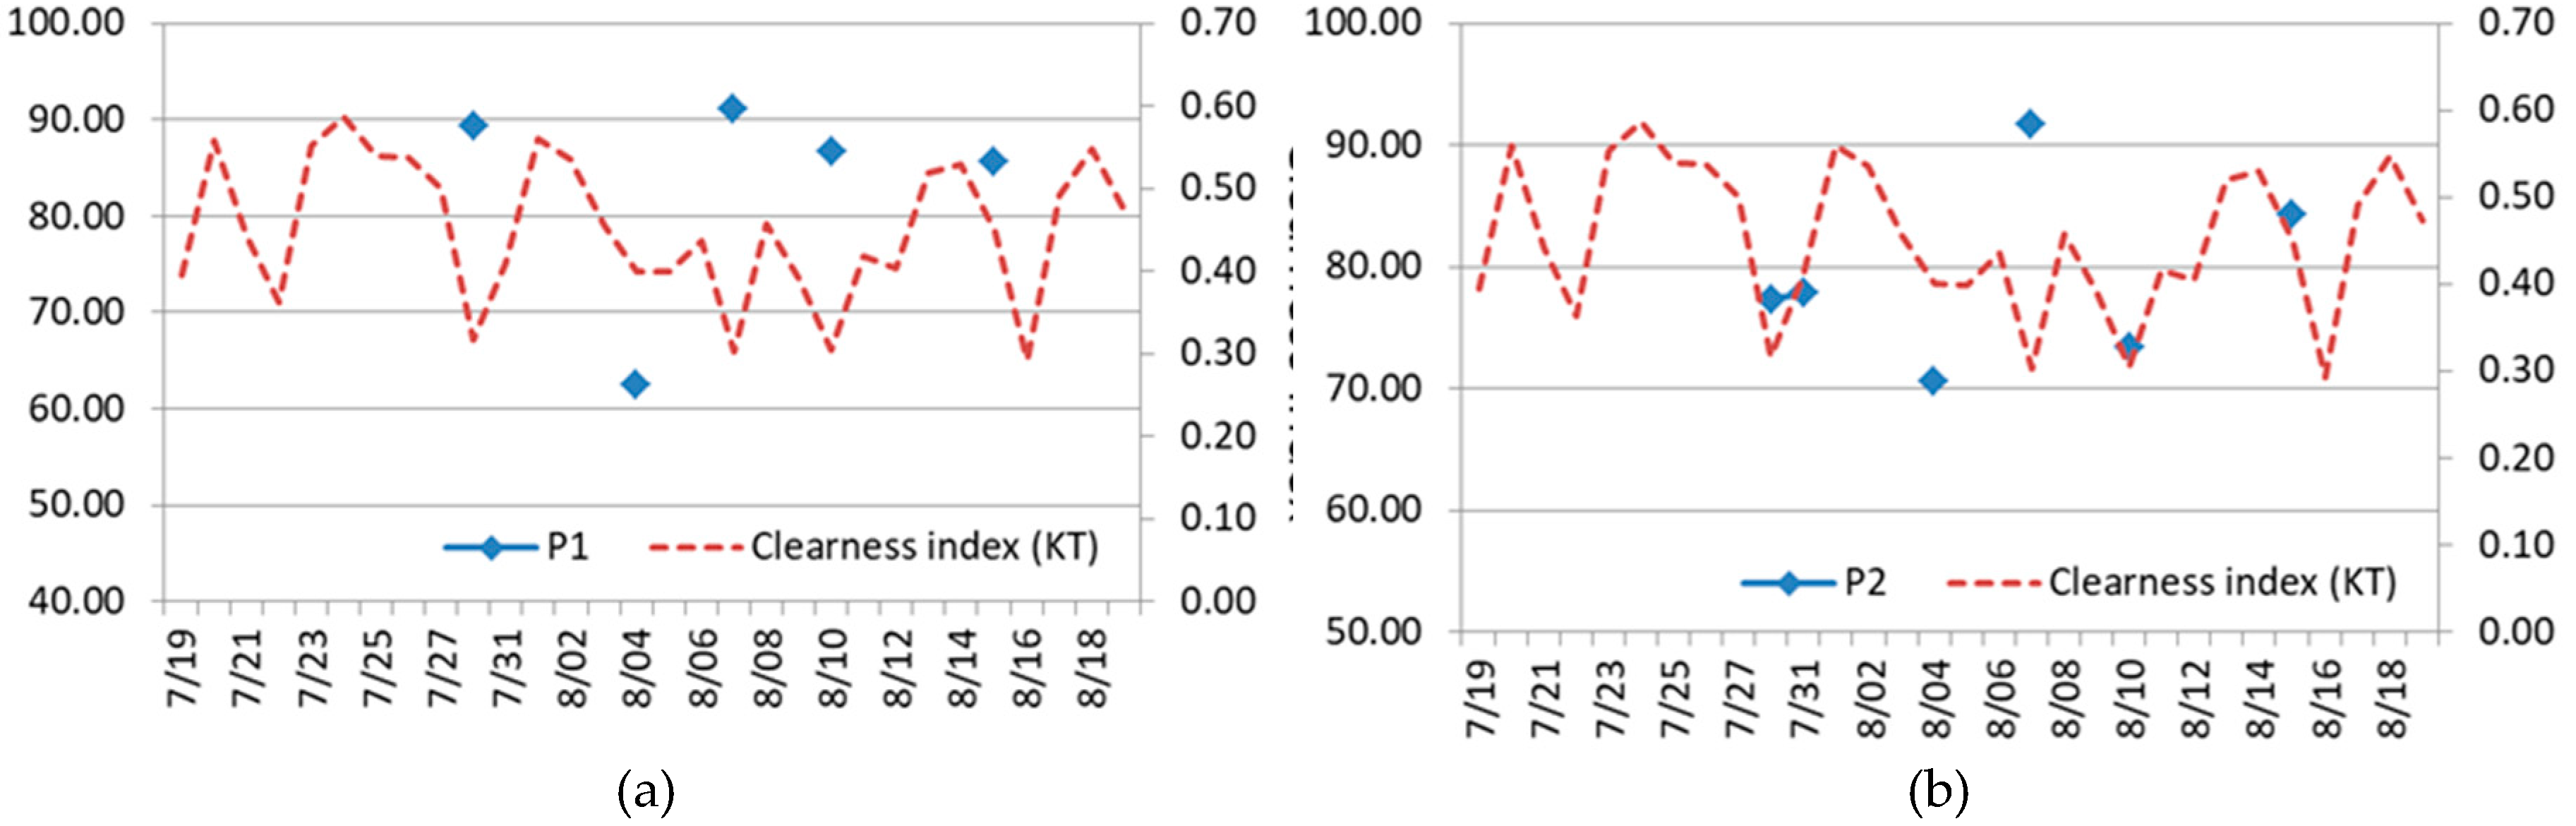
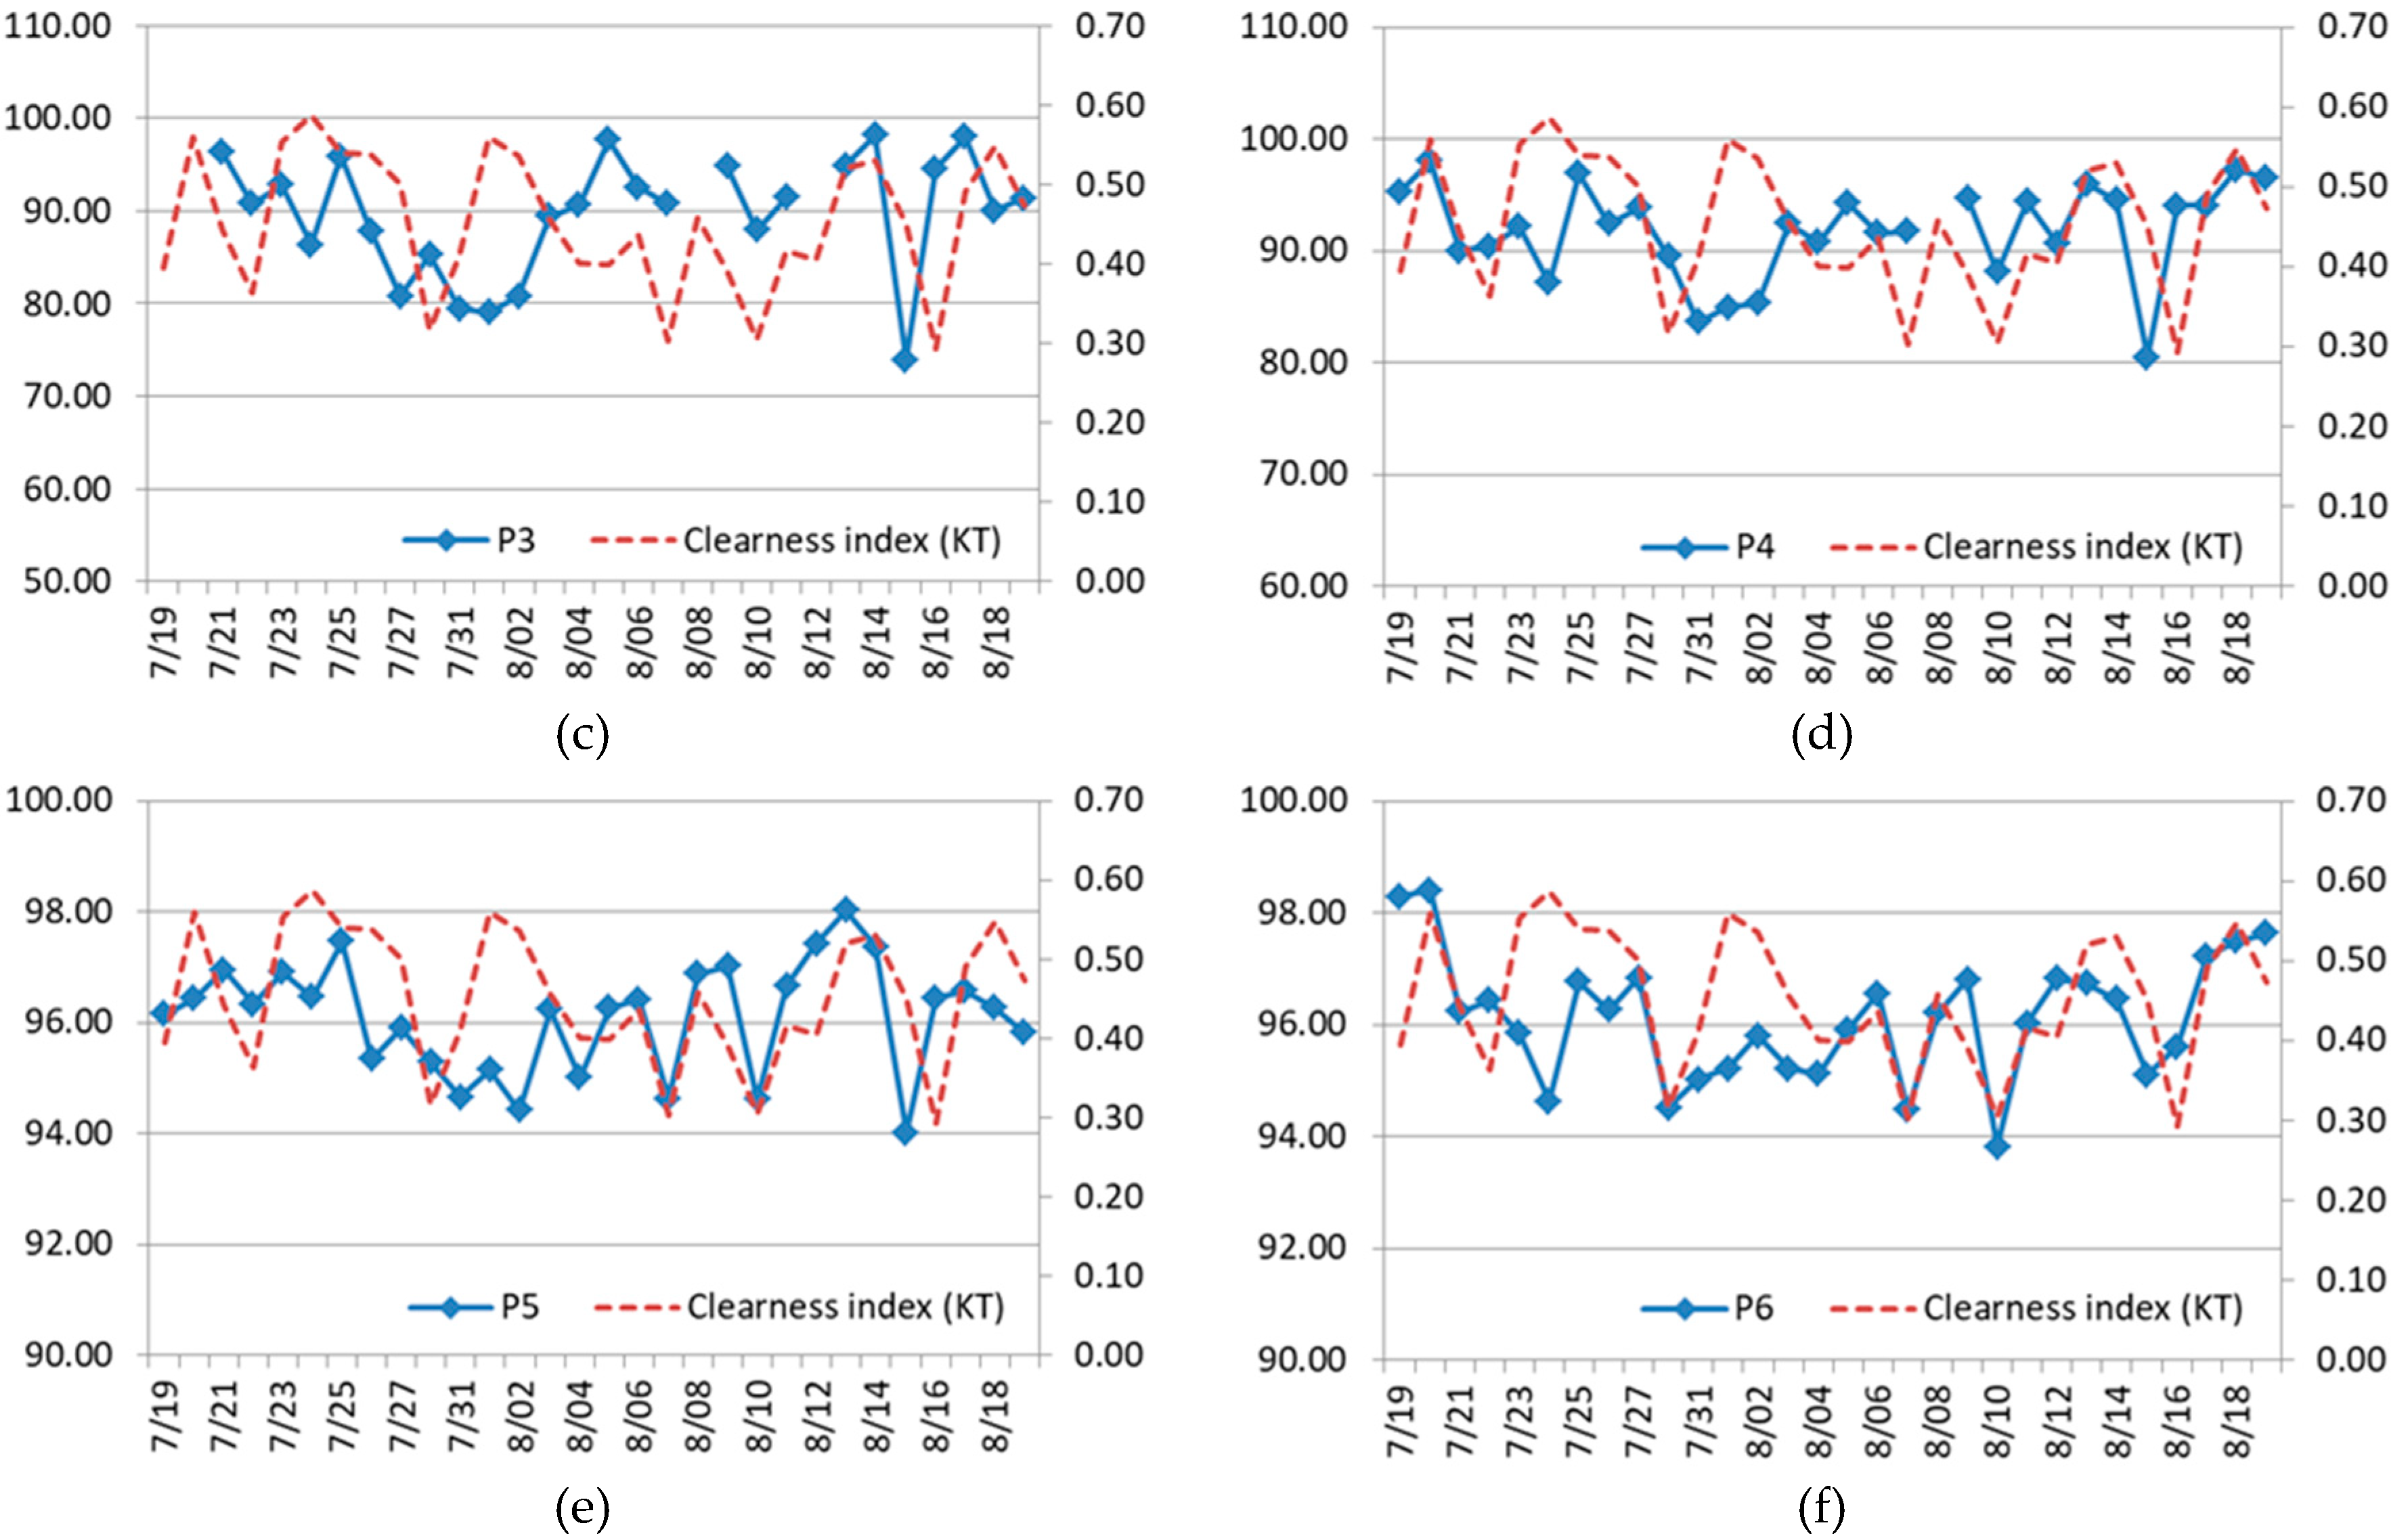
3.1. Evaluation of Target Illuminance Accuracy
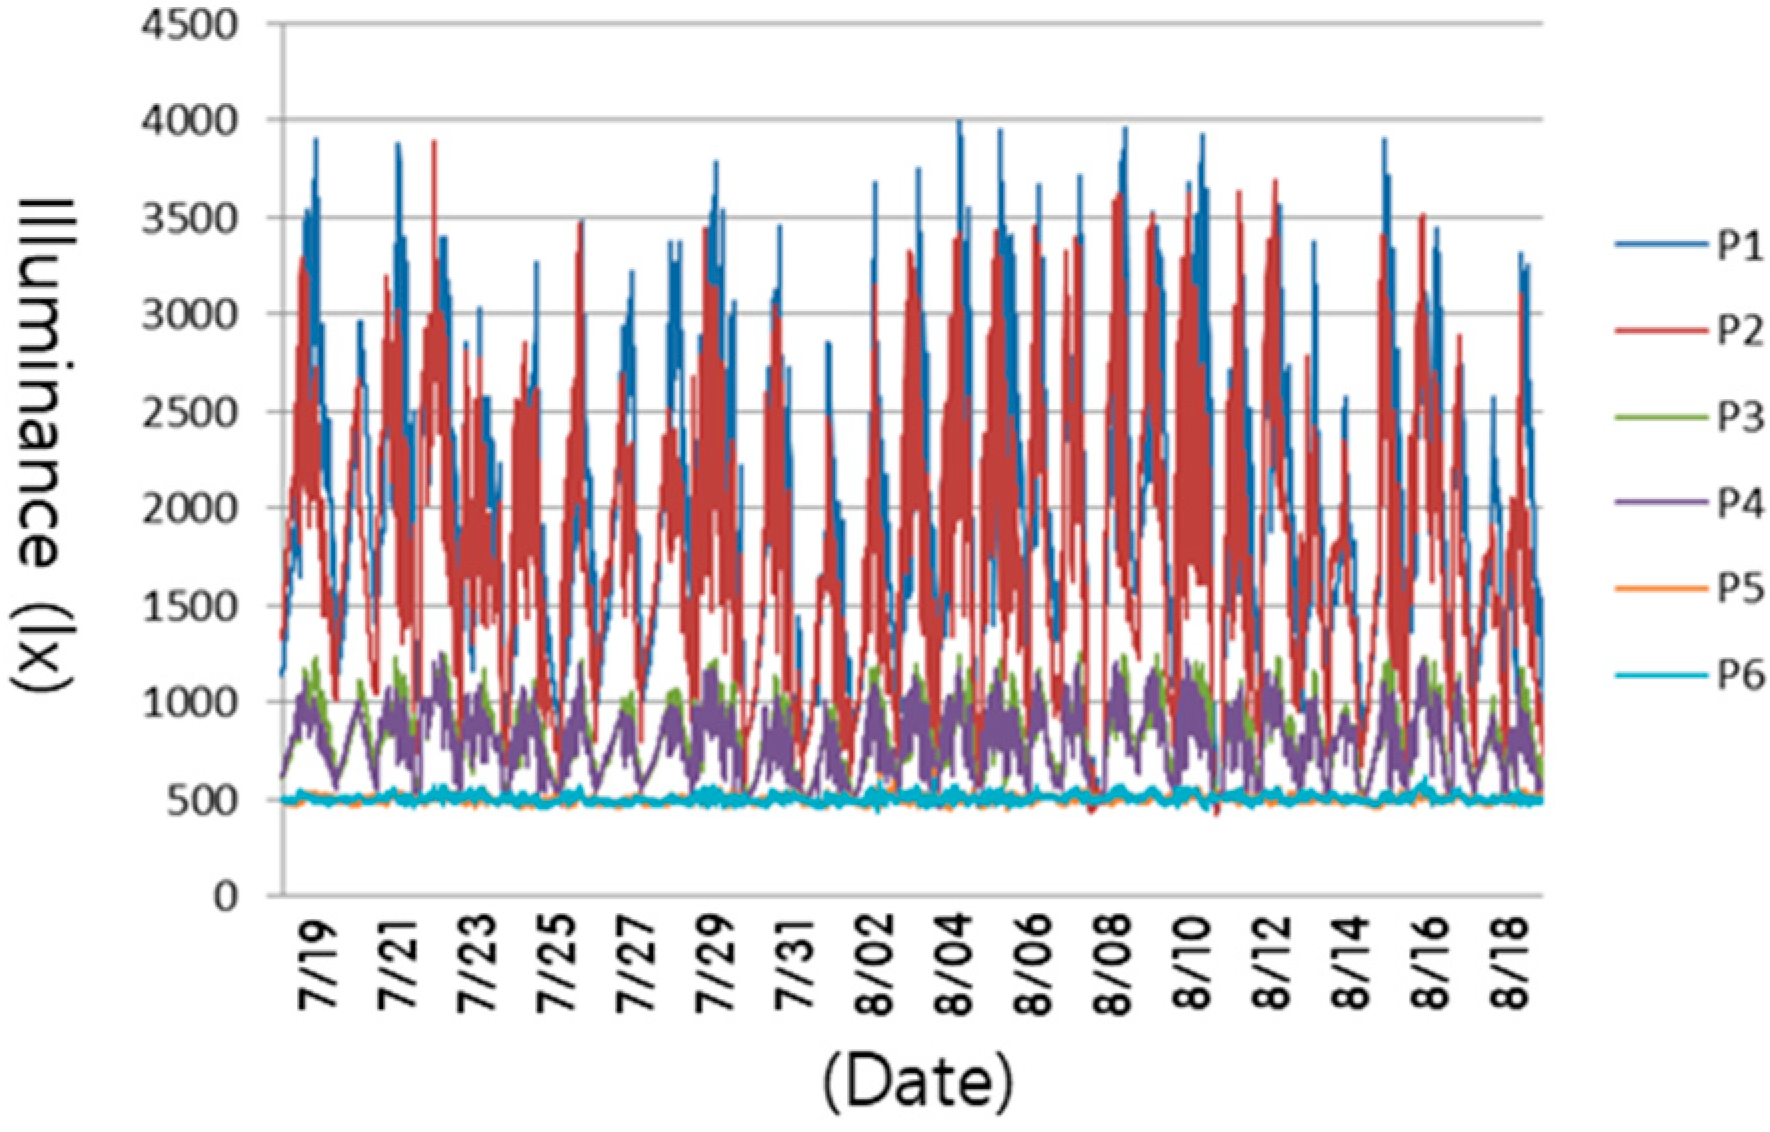
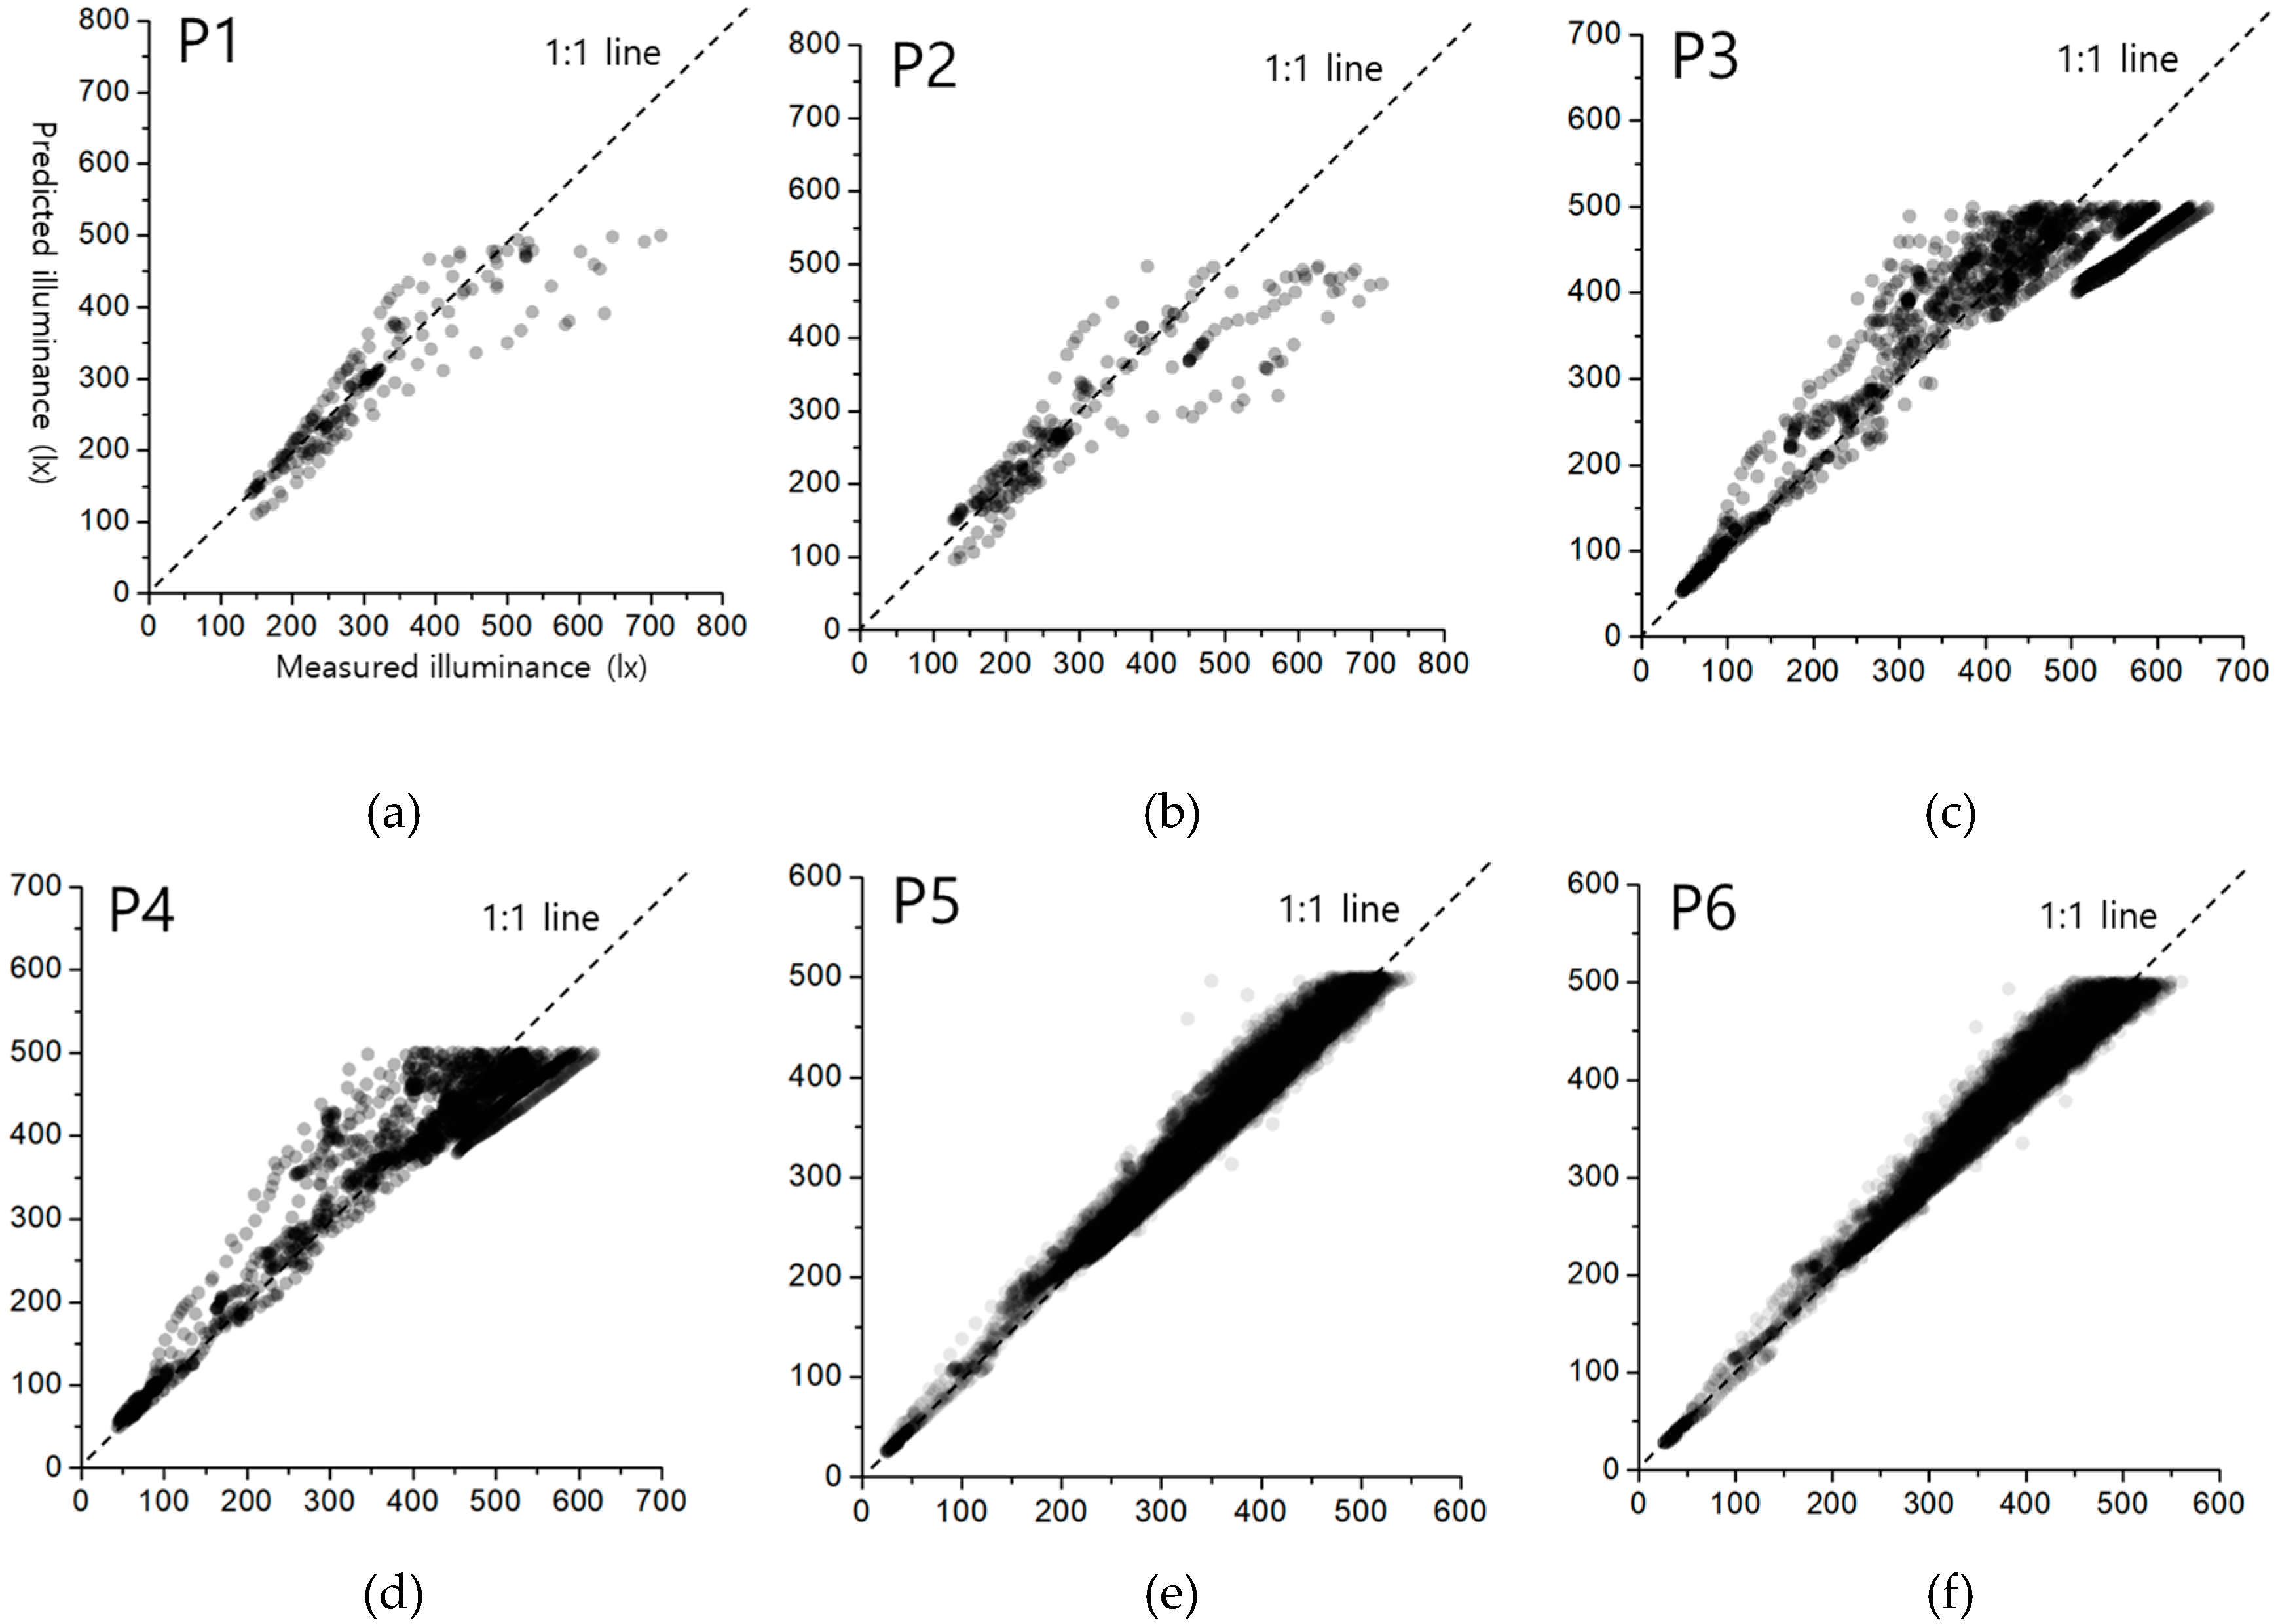
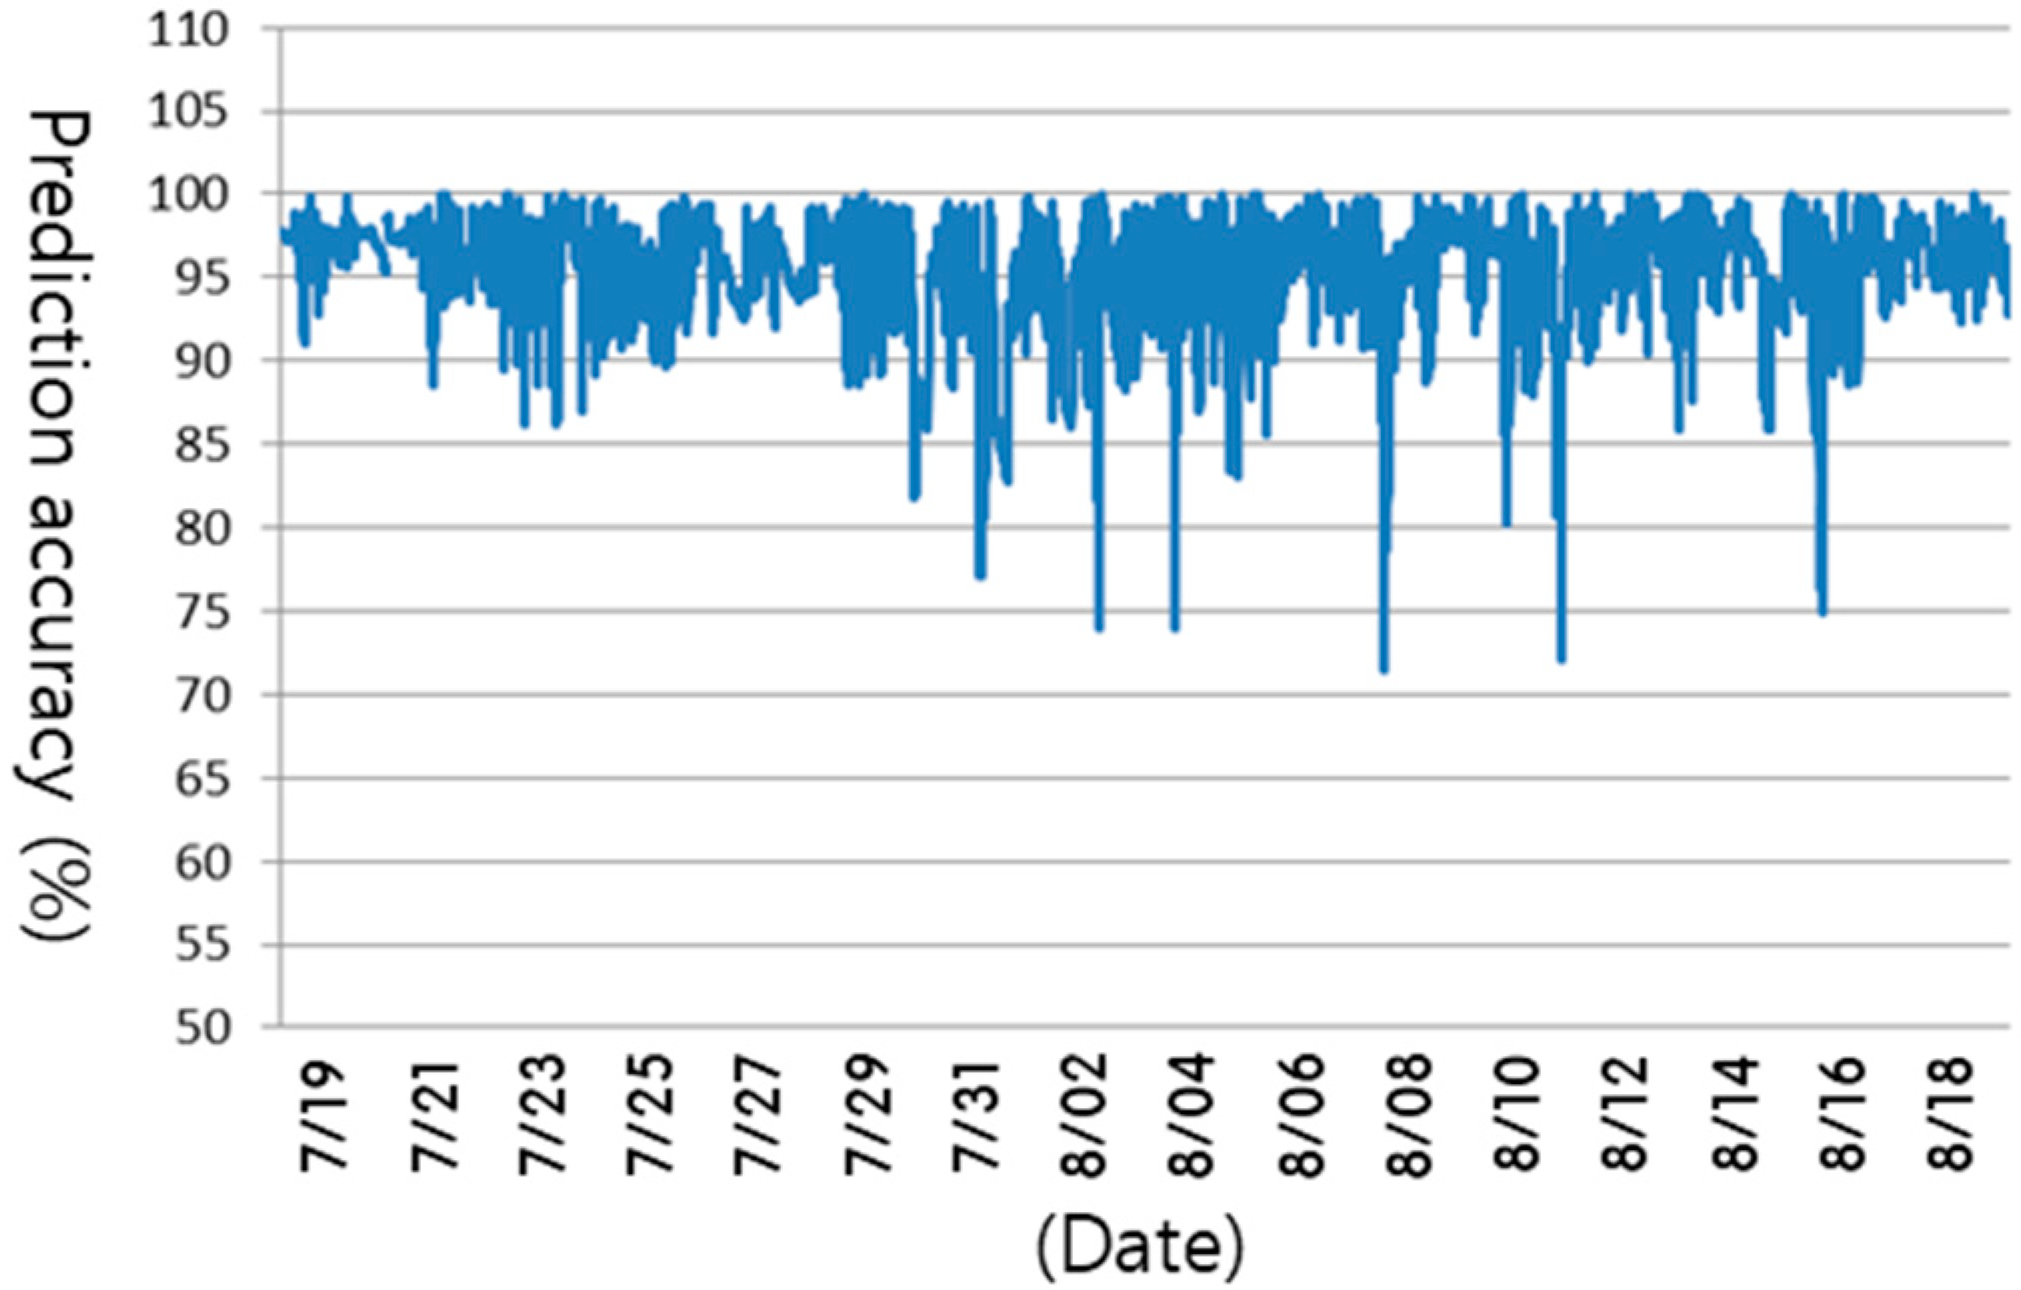
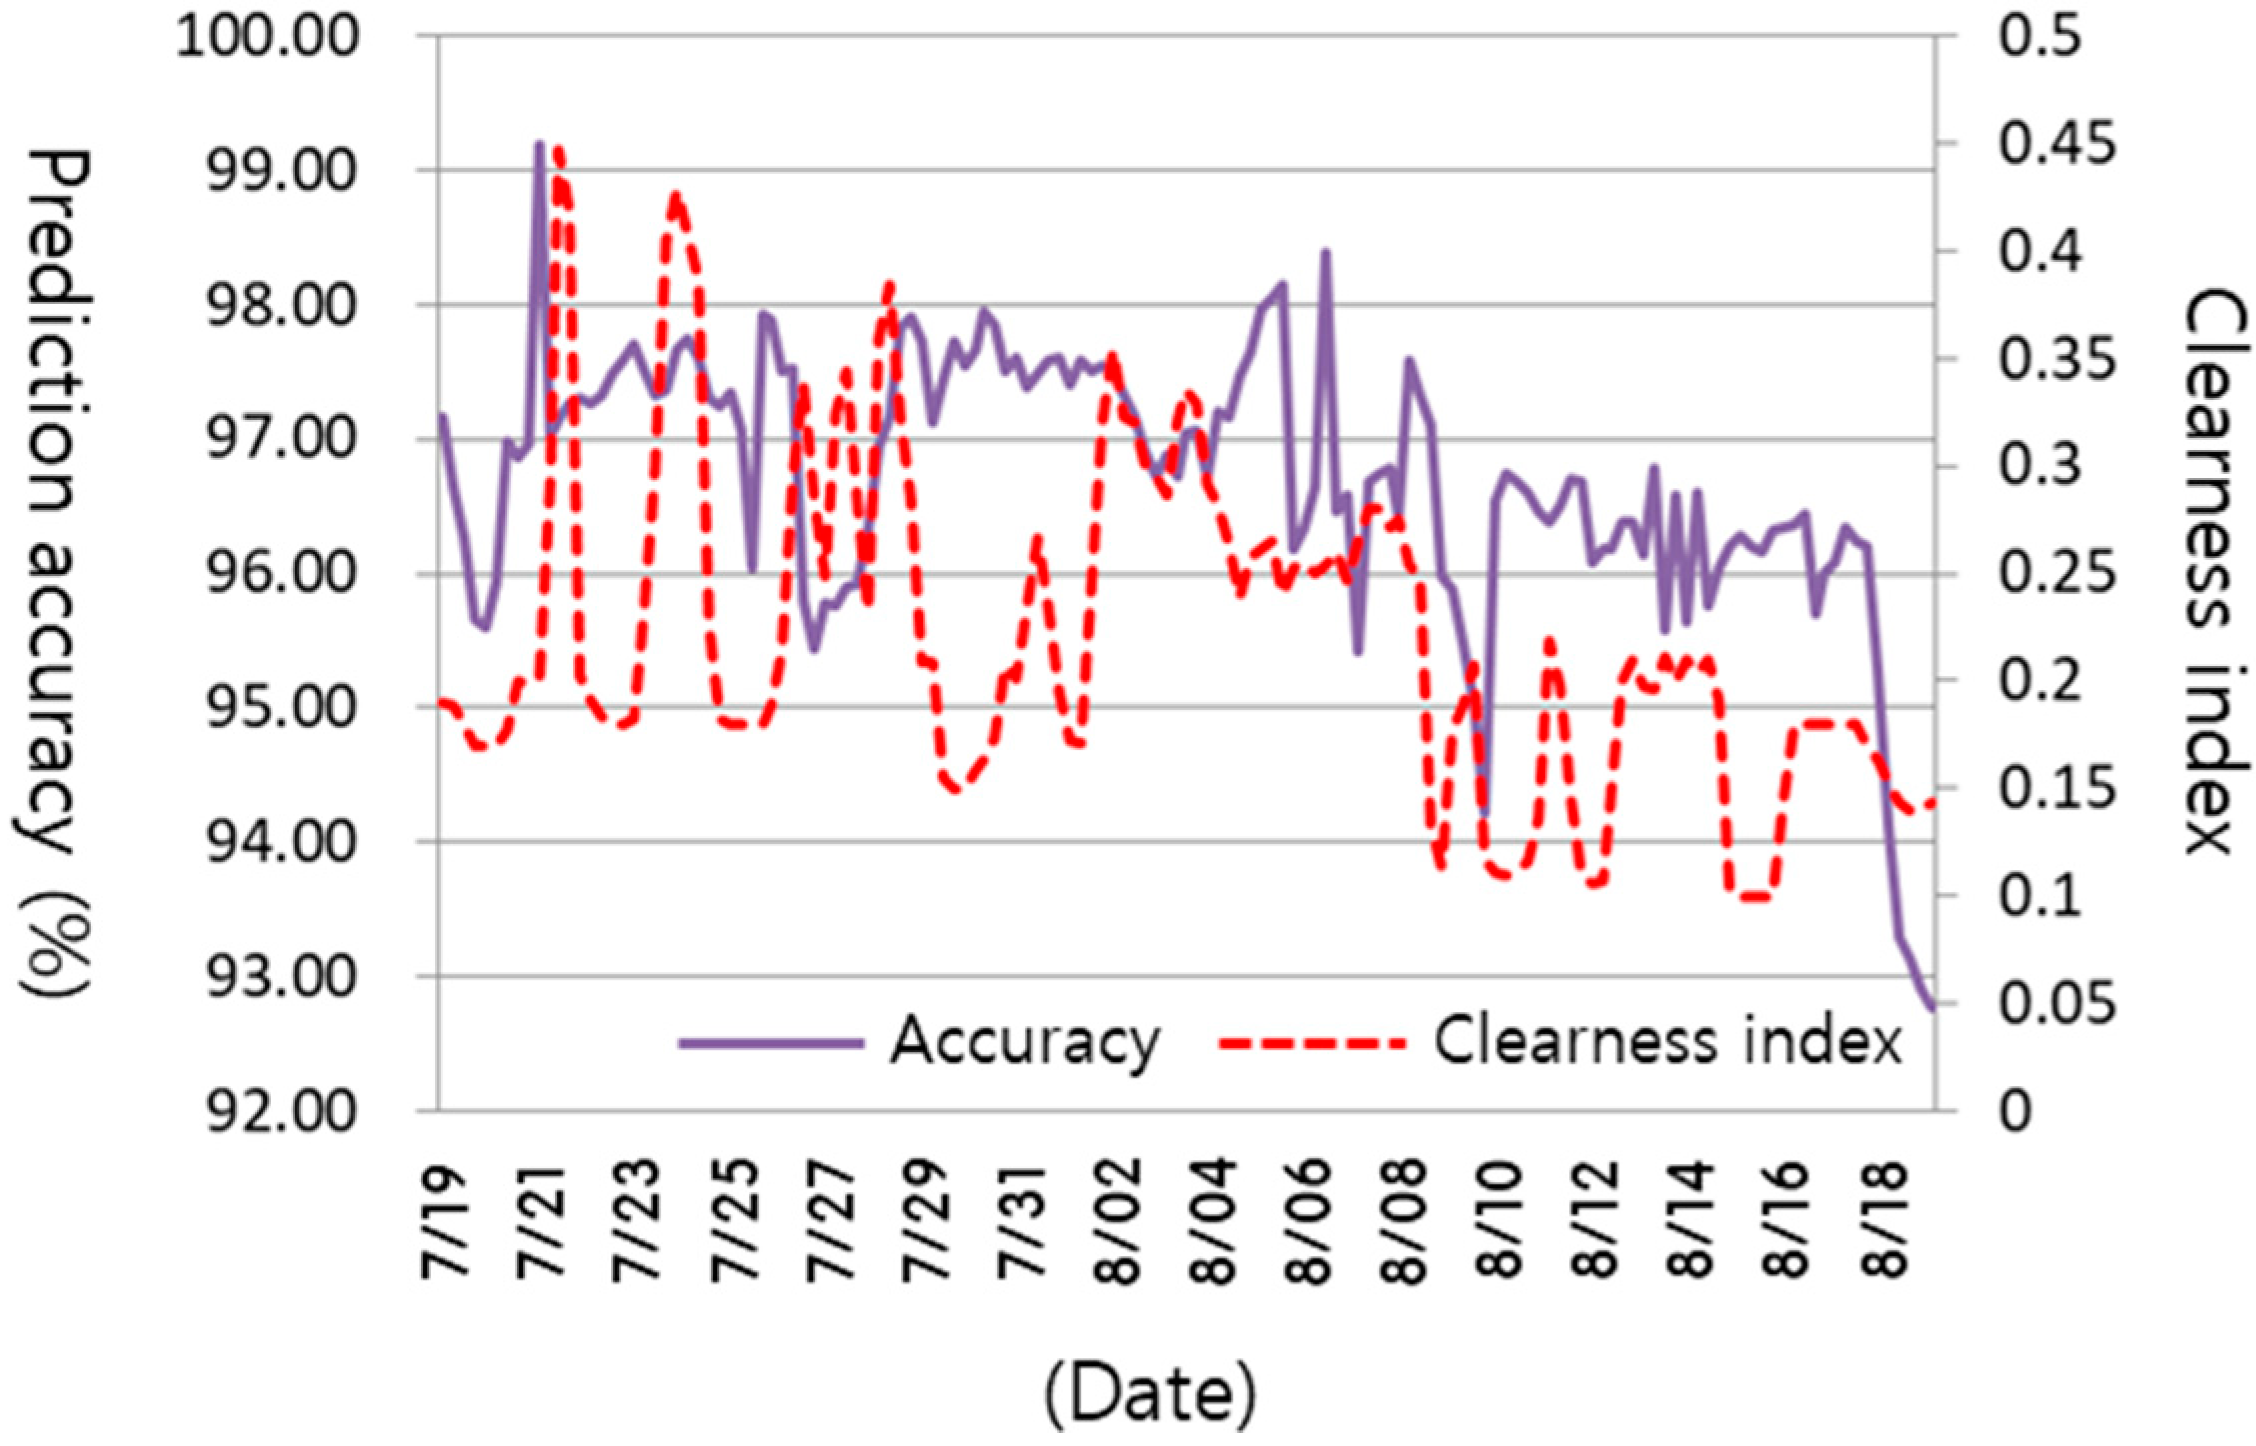
3.2. Evaluation of Daylight Illuminance Prediction Accuracy
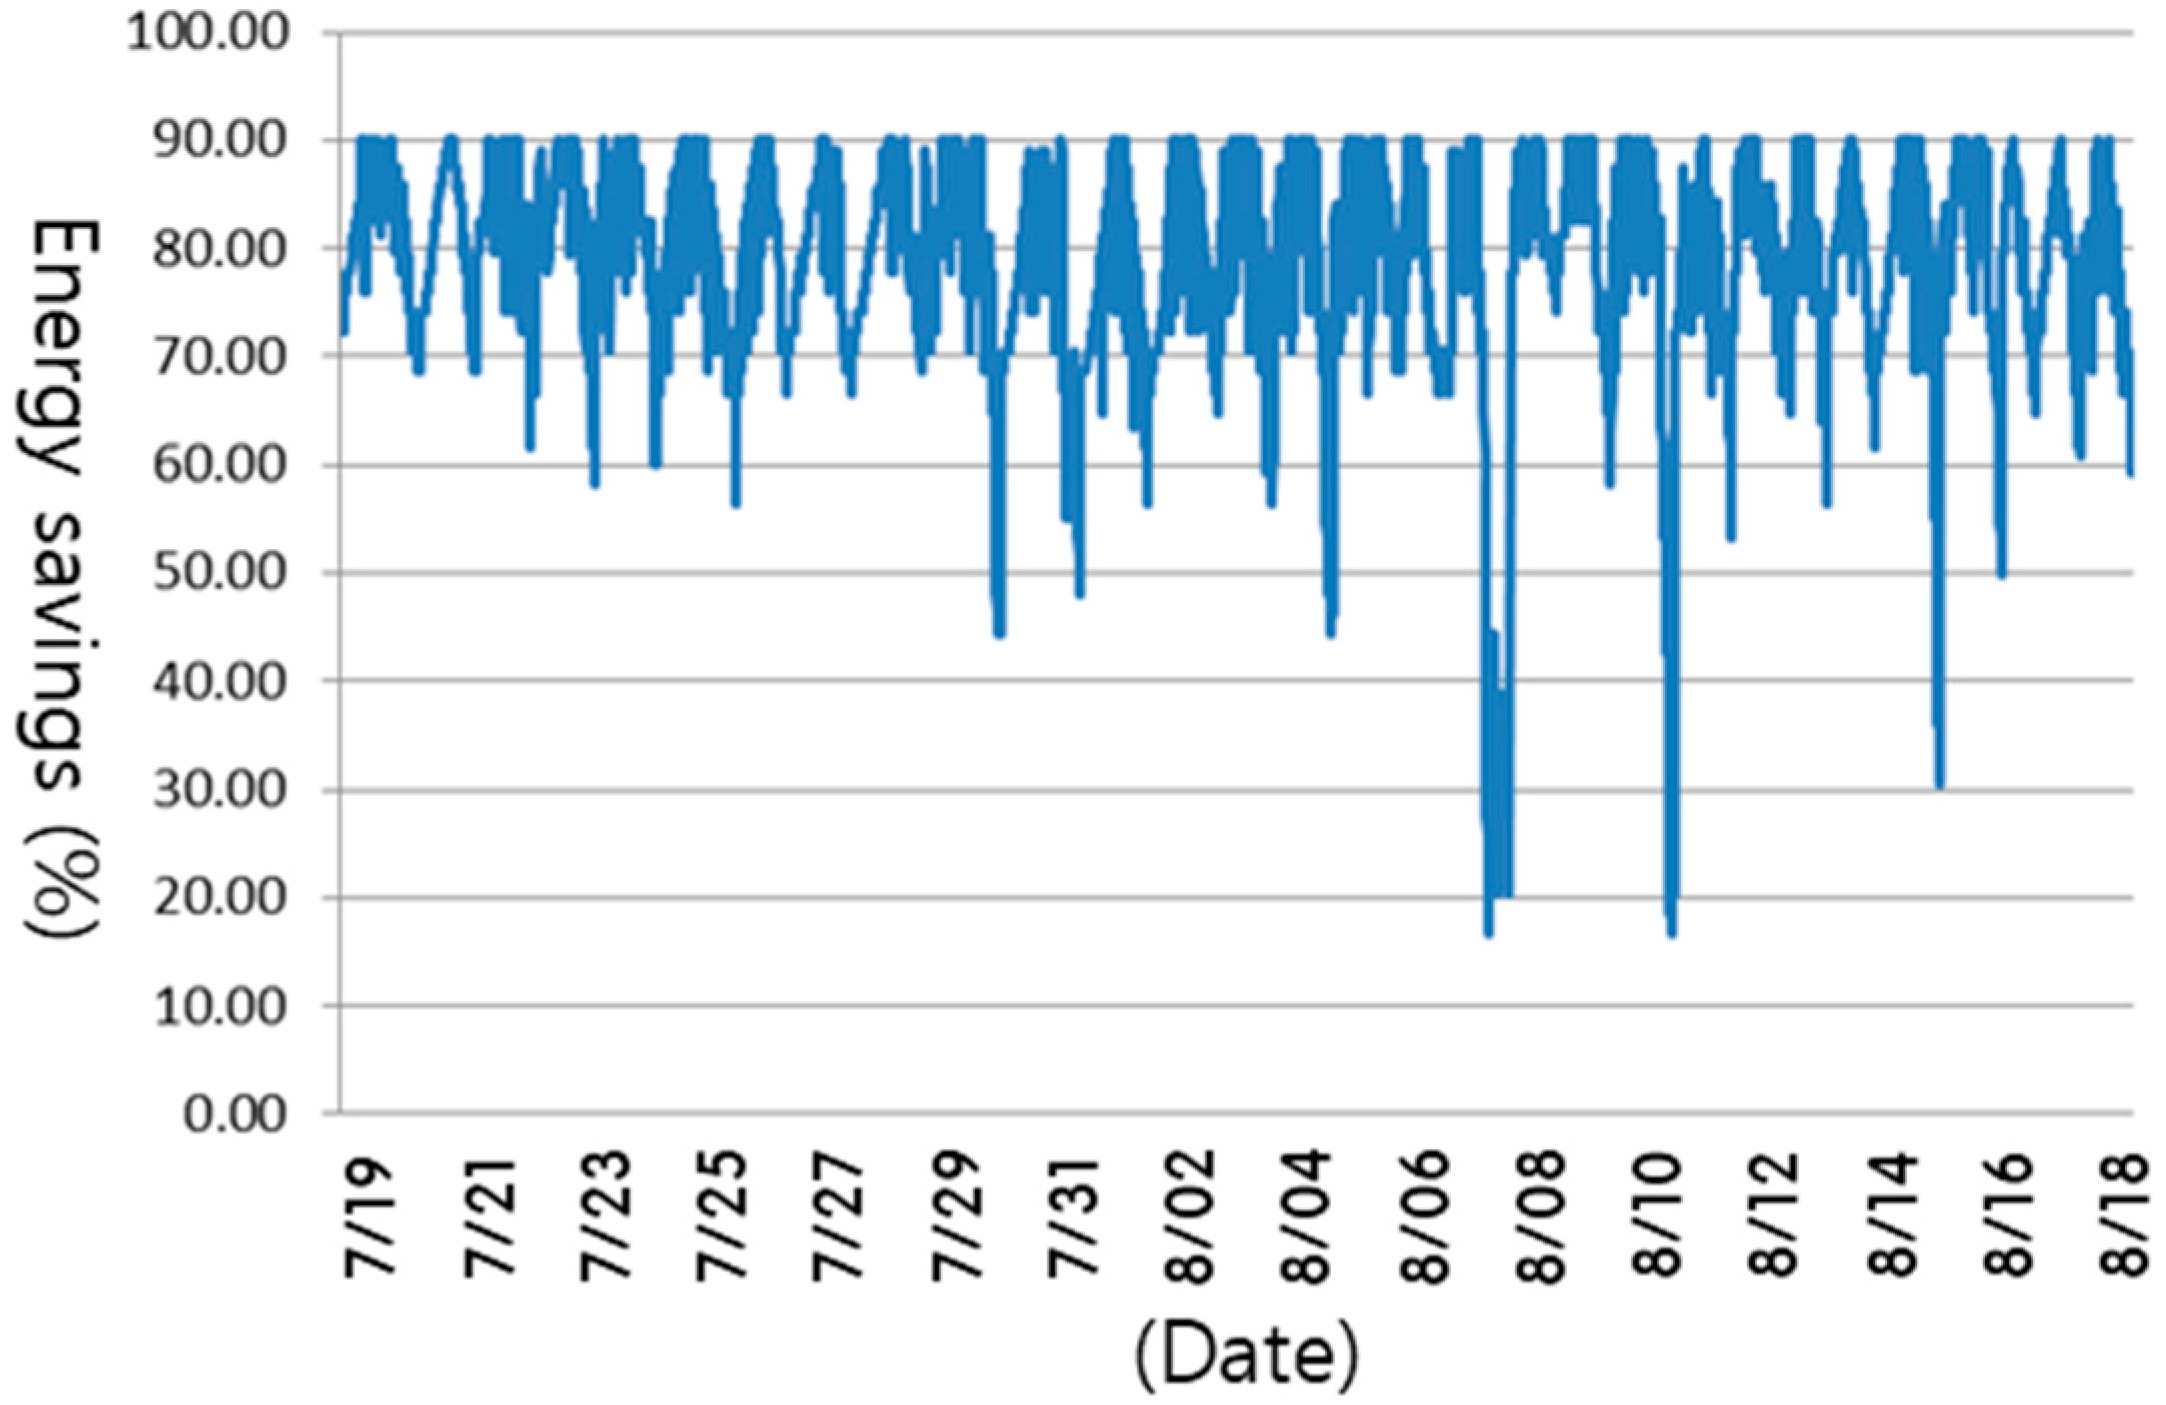
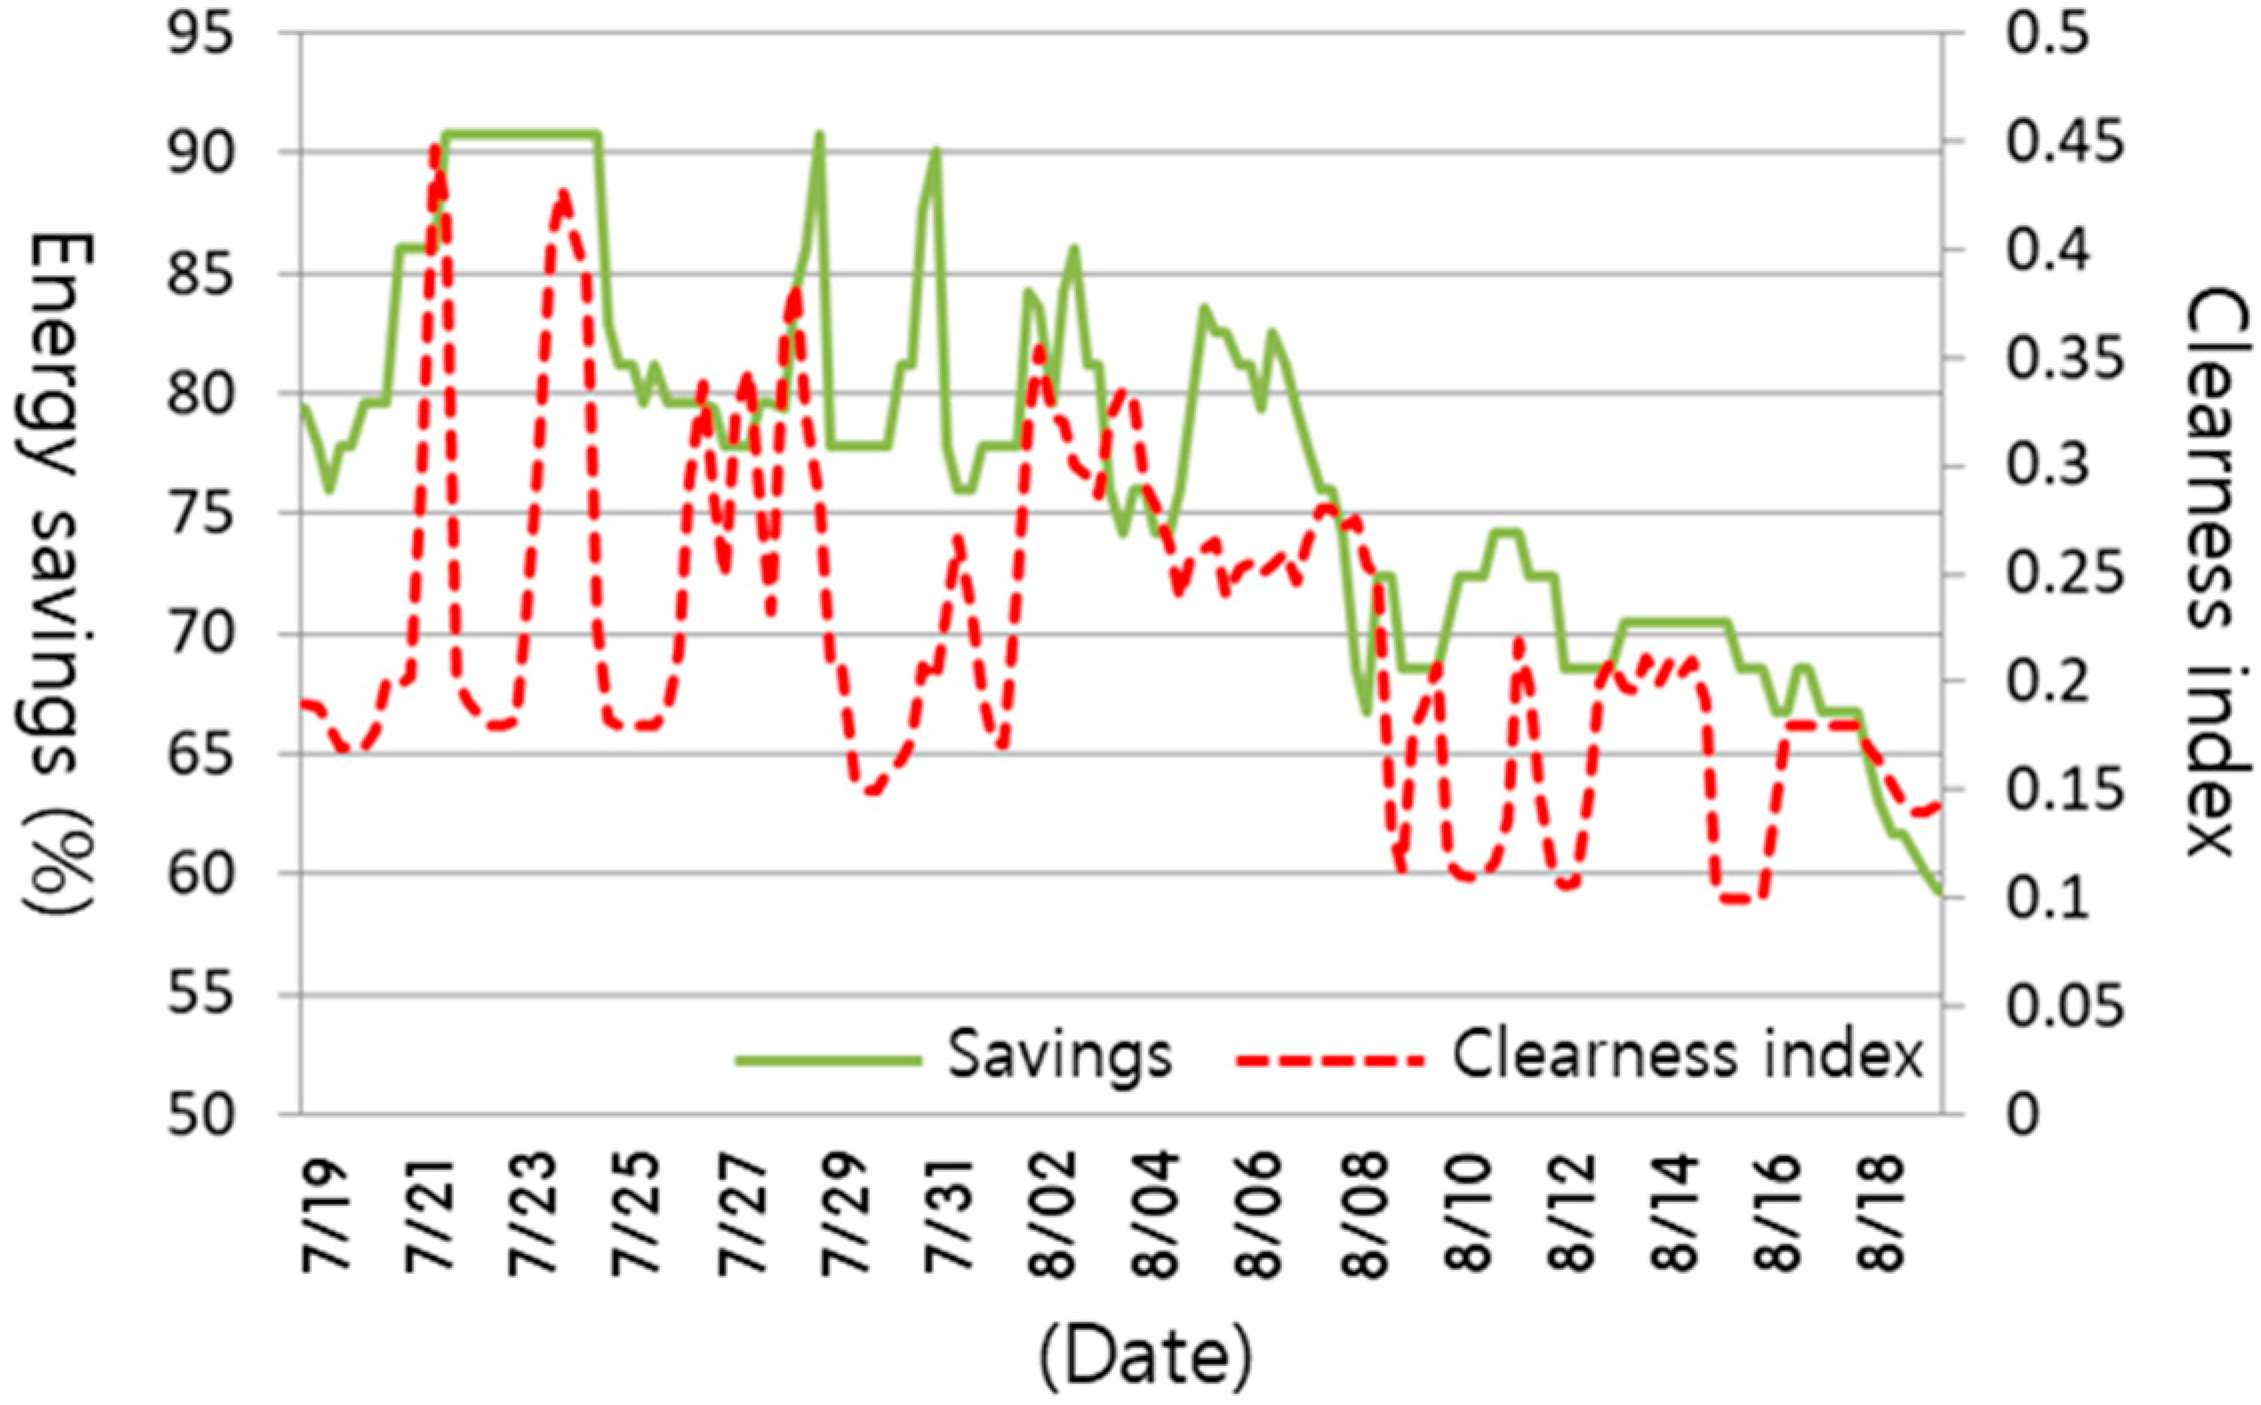
3.3. Evaluation of Energy Savings
4. Conclusions
Author Contributions
Funding
Acknowledgments
Conflicts of Interest
Nomenclature
| DRDS | Daylight responsive dimming system |
| ETj | Final work plane illuminance at the position directly under the luminaire (j) |
| Ej | Work plane illuminance at the position directly under the luminaire (j) |
| Eij | Work plane illuminance at the position directly under the luminaire (j) by luminaire (i) |
| EDj | Daylight illuminance at the position directly under the luminaire (j) |
| n | Number of luminaires in the room |
| ERj | Required illuminance at the position directly under the luminaire (j) |
| g(Lj) | Regression equation of work plane illuminance at the position directly under the luminaire (j) according to the dimming level of the luminaire (j) |
| IEij | Proportion of work plane illuminance at the position directly under the luminaire (i) and work plane illuminance at the position directly under the luminaire (j) by luminaire (i) |
References
- Ministry of Land. Infrastructure and Transport, to Cope with Climate Change Zero Energy Building Promotion Plan; National Building Policy Committee Reporting; Ministry of Land: Sejong City, Korea, 2016.
- Son, W.D. Commercialization of Green Building Remodelling Project for Private Buildings, Building Energy Seminar; Seoul Energy Dream Center: Seoul, Korea, 2015. [Google Scholar]
- Costanzo, V.; Evola, G.; Marletta, L.; Pistone Nascone, F. Application of Climate Based Daylight Modelling to the Refurbishment of a School Building in Sicily. Sustainability 2018, 10, 2653. [Google Scholar] [CrossRef]
- Piderit Moreno, M.B.; Labarca, C.Y. Methodology for assessing daylighting design strategies in classroom with a climate-based method. Sustainability 2015, 7, 880–897. [Google Scholar] [CrossRef]
- Kwon, C.; Lee, K. Integrated Daylighting Design by Combining Passive Method with DaySim in a Classroom. Energies 2018, 11, 3168. [Google Scholar] [CrossRef]
- Acosta, I.; Campano, M.Á.; Domínguez-Amarillo, S.; Muñoz, C. Dynamic Daylight Metrics for Electricity Savings in Offices: Window Size and Climate Smart Lighting Management. Energies 2018, 11, 3143. [Google Scholar] [CrossRef]
- Oh, M.; Park, J.; Roh, S.; Lee, C. Deducing the Optimal Control Method for Electrochromic Triple Glazing through an Integrated Evaluation of Building Energy and Daylight Performance. Energies 2018, 11, 2205. [Google Scholar] [CrossRef]
- Lee, K.S.; Han, K.J.; Lee, J.W. Feasibility study on parametric optimization of daylighting in building shading design. Sustainability 2016, 8, 1220. [Google Scholar] [CrossRef]
- Guan, Y.; Yan, Y. Daylighting Design in classroom based on yearly-graphic analysis. Sustainability 2016, 8, 604. [Google Scholar] [CrossRef]
- Mohelníková, J.; Míček, D.; Floreková, S.; Selucká, A.; Dvořák, M. Analysis of Daylight Control in a Chateau Interior. Build 2018, 8, 68. [Google Scholar] [CrossRef]
- Moazzeni, M.H.; Ghiabaklou, Z. Investigating the influence of light shelf geometry parameters on daylight performance and visual comfort, a case study of educational space in Tehran, Iran. Build 2016, 6, 26. [Google Scholar] [CrossRef]
- Kaminska, A.; Ożadowicz, A. Lighting Control Including Daylight and Energy Efficiency Improvements Analysis. Energies 2018, 11, 2166. [Google Scholar] [CrossRef]
- Vu, N.H.; Shin, S. Flat Optical Fiber Daylighting System with Lateral Displacement Sun-Tracking Mechanism for Indoor Lighting. Energies 2017, 10, 1679. [Google Scholar] [CrossRef]
- Lee, K.S.; Han, K.J.; Lee, J.W. The Impact of Shading Type and Azimuth Orientation on the Daylighting in a Classroom–Focusing on Effectiveness of Façade Shading, Comparing the Results of DA and UDI. Energies 2017, 10, 635. [Google Scholar] [CrossRef]
- Kim, S.H.; Kim, I.T.; Choi, A.S.; Sung, M.K. Evaluation of Optimized PV Power Generation an Electrical Energy Savings from the PV Blind-integrated Daylight Responsive Dimming System Using LED Lighting. Sol. Energy 2014, 107, 746–757. [Google Scholar] [CrossRef]
- Al-Ashwal, N.T.; Budaiwi, I.M. Energy savings due to daylight and artificial lighting integration in office buildings in hot climate. Int. J. Energy Environ. 2011, 2, 999–1012. [Google Scholar]
- Fernandes, L.L.; Lee, E.S.; Ward, G. Lighting energy savings potential of split-pane electrochromic windows controlled for daylighting with visual comfort. Energy Build. 2013, 61, 8–20. [Google Scholar] [CrossRef]
- Caicedo, D.; Pandharipande, A.; Willems, F.M. Daylight-adaptive lighting control using light sensor calibration prior-information. Energy Build. 2014, 73, 105–114. [Google Scholar] [CrossRef]
- Yoo, S.; Kim, J.; Jang, C.Y.; Jeong, H. A sensor-less LED dimming system based on daylight harvesting with BIPV systems. Opt. Express 2014, 22, A132–A143. [Google Scholar] [CrossRef]
- Gentile, N.; Dubois, M.C. Field data and simulations to estimate the role of standby energy use of lighting control systems in individual offices. Energy Build. 2017, 155, 390–403. [Google Scholar] [CrossRef]
- Nagy, Z.; Yong, F.Y.; Frei, M.; Schlueter, A. Occupant centered lighting control for comfort and energy efficient building operation. Energy Build. 2015, 94, 100–108. [Google Scholar] [CrossRef]
- Gentile, N.; Laike, T.; Dubois, M.C. Lighting control systems in individual offices rooms at high latitude: Measurements of electricity savings and occupants’ satisfaction. Sol. Energy 2016, 127, 113–123. [Google Scholar] [CrossRef]
- Yun, G.Y.; Kim, H.; Kim, J.T. Effects of occupancy and lighting use patterns on lighting energy consumption. Energy Build. 2012, 46, 152–158. [Google Scholar] [CrossRef]
- Pandharipande, A.; Caicedo, D. Daylight integrated illumination control of LED systems based on enhanced presence sensing. Energy Build. 2011, 43, 944–950. [Google Scholar] [CrossRef]
- Wang, Z.; Tan, Y.K. Illumination control of LED systems based on neural network model and energy optimization algorithm. Energy Build. 2013, 62, 514–521. [Google Scholar] [CrossRef]
- Choi, H.Y.; Hong, S.K.; Choi, A.S.; Sung, M.K. Toward the accuracy of prediction for energy savings potential and system performance using the daylight responsive dimming system. Energy Build. 2016, 133, 271–280. [Google Scholar] [CrossRef]
- Parise, G.; Martirano, L. Daylight impact on energy performance of internal lighting. IEEE Trans. Ind. Appl. 2013, 49, 242–249. [Google Scholar] [CrossRef]
- Ul Haq, M.A.; Hassan, M.Y.; Abdullah, H.; Rahman, H.A.; Abdullah, M.P.; Hussin, F.; Said, D.M. A review on lighting control technologies in commercial buildings, their performance and affecting factors. Renew. Sustain. Energy Rev. 2014, 33, 268–279. [Google Scholar] [CrossRef]
- Park, B.C.; Choi, A.S.; Jeong, J.W.; Lee, E.S. Performance of integrated systems of automated roller shade systems and daylight responsive dimming systems. Build. Environ. 2011, 46, 747–757. [Google Scholar] [CrossRef]
- Li, D.H.; Cheung, G.H.; Cheung, K.L.; Lam, T.N. Determination of vertical daylight illuminance under non-overcast sky conditions. Build. Environ. 2010, 45, 498–508. [Google Scholar] [CrossRef]
- Acosta, I.; Munoz, C.; Campano, M.A.; Navarro, J. Analysis of daylight factors and energy saving allowed by windows under overcast sky conditions. Renew. Energy 2015, 77, 194–207. [Google Scholar] [CrossRef]
- Li, D.H. A review of daylight illuminance determinations and energy implications. Appl. Energy 2010, 87, 2109–2118. [Google Scholar] [CrossRef]
- Korean Standards Association. KS A3011, KS Recommended Levels of Illumination; Korea Industrial Standards Certificate: Gyeonggi-do Province, Korea, 1998. [Google Scholar]
- Reindl, D.T.; Beckman, W.A.; Duffie, J.A. Diffuse fraction correlations. Sol. Energy 1990, 45, 1–7. [Google Scholar] [CrossRef]
- Park, B.C.; Choi, A.S.; Jeong, J.W.; Lee, E.S. A Preliminary Study on the Performance of Daylight Responsive Dimming Systems with Improved Closed-Loop Control Algorithm. Leukos 2011, 8, 41–59. [Google Scholar]
- Jeong, K.Y.; Choi, A.S.; Sung, M.K. A mock-up study for validation of an improved control algorithm for automated roller shade. Indoor Built Environ. 2016, 25, 17–28. [Google Scholar] [CrossRef]


| x4 | x3 | x2 | x | Adjusted R2 | |
|---|---|---|---|---|---|
| g(L1) | 0.0051 | −0.2112 | 2.9129 | 7.1438 | 0.9999 |
| g(L2) | 0.0045 | −0.1894 | 2.6403 | 7.0639 | 0.9999 |
| g(L3) | 0.006 | −0.251 | 3.4595 | 7.2117 | 0.9999 |
| g(L4) | 0.0055 | −0.2328 | 3.2959 | 7.0318 | 0.9999 |
| g(L5) | 0.006 | −0.2531 | 3.5007 | 8.2746 | 0.9999 |
| g(L6) | 0.0058 | −0.2436 | 3.413 | 8.2883 | 0.9999 |
| P1 (j = 1) | P2 (j = 2) | P3 (j = 3) | P4 (j = 4) | P5 (j = 5) | P6 (j = 6) | |
|---|---|---|---|---|---|---|
| L1 (i = 1) | 1 | 0.557 | 0.356 | 0.269 | 0.095 | 0.092 |
| L2 (i = 2) | 0.470 | 1 | 0.245 | 0.372 | 0.085 | 0.099 |
| L3 (i = 3) | 0.361 | 0.264 | 1 | 0.558 | 0.339 | 0.257 |
| L4 (i = 4) | 0.247 | 0.372 | 0.471 | 1 | 0.222 | 0.338 |
| L5 (i = 5) | 0.094 | 0.086 | 0.362 | 0.273 | 1 | 0.567 |
| L6 (i = 6) | 0.092 | 0.100 | 0.267 | 0.379 | 0.510 | 1 |
| P1 | P2 | P3 | P4 | P5 | P6 | |
|---|---|---|---|---|---|---|
| Gradient | 0.3669 | 0.3950 | 0.6797 | 0.7040 | 0.8827 | 0.8295 |
| Adjusted R2 | 0.9695 * | 0.9844 | 0.9698 | 0.9804 | 0.9976 ** | 0.9970 |
| RMSE | 40.89 | 57.23 | 64.86 ** | 52.22 | 17.60 * | 20.00 |
| Sky Condition | P1 (%) | P2 (%) | P3 (%) | P4 (%) | P5 (%) | P6 (%) |
|---|---|---|---|---|---|---|
| Clear | 91.41 | 87.72 | 87.07 * | 89.49 | 96.13 ** | 94.27 |
| Partly cloudy | - | - | 83.85 * | 89.55 | 97.13 ** | 97.00 |
| Overcast | 96.39 | 95.71 | 93.62 * | 94.11 | 97.15 | 97.18 ** |
| P1 | P2 | P3 | P4 | P5 | P6 | |
|---|---|---|---|---|---|---|
| Average (%) | 88.99 | 84.25 * | 86.41 | 89.39 | 95.99 | 96.00 ** |
| SD (%) | 11.58 | 15.44 ** | 9.93 | 7.37 | 3.07 * | 3.15 |
| Max (%) | 99.96 | 99.86 | 99.93 | 99.99 | 100.00 ** | 100.00 ** |
| Min (%) | 37.43 | 21.11 * | 60.88 | 63.55 | 70.58 | 76.74 ** |
| RMSE | 53.94 | 77.57 ** | 69.46 | 51.28 | 17.21 * | 18.86 |
| Sky Condition | P1 (%) | P2 (%) | P3 (%) | P4 (%) | P5 (%) | P6 (%) |
|---|---|---|---|---|---|---|
| Clear | 85.49 | 81.16 | 62.93 * | 69.85 | 95.32 ** | 93.82 |
| Partly cloudy | - | - | 76.84 * | 84.92 | 96.34 ** | 96.26 |
| Overcast | 89.06 | 84.30 * | 90.37 | 91.12 | 95.48 | 95.81 ** |
| Sky Condition | Average Power Consumption (W) | Daily Power Consumption (Wh) | Savings (%) |
|---|---|---|---|
| Clear | 10.75 | 96.78 | 89.67 |
| Partly cloudy | 15.54 | 139.83 | 85.08 |
| Overcast | 27.30 | 245.73 | 73.78 |
© 2019 by the authors. Licensee MDPI, Basel, Switzerland. This article is an open access article distributed under the terms and conditions of the Creative Commons Attribution (CC BY) license (http://creativecommons.org/licenses/by/4.0/).
Share and Cite
Kim, I.-T.; Kim, Y.-S.; Cho, M.; Nam, H.; Choi, A.; Hwang, T. High-Performance Accuracy of Daylight-Responsive Dimming Systems with Illuminance by Distant Luminaires for Energy-Saving Buildings. Energies 2019, 12, 731. https://doi.org/10.3390/en12040731
Kim I-T, Kim Y-S, Cho M, Nam H, Choi A, Hwang T. High-Performance Accuracy of Daylight-Responsive Dimming Systems with Illuminance by Distant Luminaires for Energy-Saving Buildings. Energies. 2019; 12(4):731. https://doi.org/10.3390/en12040731
Chicago/Turabian StyleKim, In-Tae, Yu-Sin Kim, Meeryoung Cho, Hyeonggon Nam, Anseop Choi, and Taeyon Hwang. 2019. "High-Performance Accuracy of Daylight-Responsive Dimming Systems with Illuminance by Distant Luminaires for Energy-Saving Buildings" Energies 12, no. 4: 731. https://doi.org/10.3390/en12040731
APA StyleKim, I.-T., Kim, Y.-S., Cho, M., Nam, H., Choi, A., & Hwang, T. (2019). High-Performance Accuracy of Daylight-Responsive Dimming Systems with Illuminance by Distant Luminaires for Energy-Saving Buildings. Energies, 12(4), 731. https://doi.org/10.3390/en12040731