Article

Numerical Study on Flow Characteristics in a Francis Turbine during Load Rejection

1
College of Energy and Electrical Engineering, Hohai University, Nanjing 210098, China
2
College of Water Conservancy and Hydropower Engineering, Hohai University, Nanjing 210098, China
3
Shanghai Investigation, Design & Research Institute Corporation Limited, Shanghai 200434, China
*
Author to whom correspondence should be addressed.
Energies 2019, 12(4), 716; https://doi.org/10.3390/en12040716
Submission received: 21 January 2019 / Revised: 16 February 2019 / Accepted: 20 February 2019 / Published: 22 February 2019
(This article belongs to the Section A: Sustainable Energy)

Abstract

:
Labyrinth seals are not usually included in the numerical models of hydraulic machinery to simplify the geometric modeling, and thereby reduce the calculation burden. However, this simplification affects the numerical results, especially in the load rejection process, because disc friction losses, volume losses, and pressure fluctuations in the seal ring (SR) clearance passage are neglected. This paper addresses the issue by considering all of the geometrical details of labyrinth seals when conducting multiscale flow simulations of a high head Francis turbine under a transient load rejection condition using the commercial software code. A comparison of the numerical results that were obtained with the experimental testing data indicates that the calculated values of both torque and mass discharge rate are 8.65% and 5% slightly less than the corresponding values that were obtained from experimental model testing, respectively. The obtained pressure fluctuations of the Francis turbine in the vaneless zone and the draft tube appear to more closely match with the experimental test data when including SR clearance. Moreover, the flow rates through SR clearance passages were very small, but the pressure fluctuations among them were significantly enhanced under the minimal load condition. The numerical model with SR clearance can more accurately reflect the fact that the water thrust on the runner only fluctuates from 800 N to 575 N during the load rejection process, even though the water thrust on the blades varies from −220 N to 1200 N. Therefore, multiscale flow study is of great significance in understanding the effect of clearance flow on the load rejection process in the Francis turbine.

1. Introduction

Special attention should be paid to the dramatically worsened conflicts between energy supply and environmental protection around the world, so renewable energy is becoming of paramount importance in energy exploitation. The hydropower plant stands out for its feasibility among all of the different types of renewable energy [1,2]. As a mature technology, the Francis turbine has an incomparable advantage in the utilization of water resources in medium and high heads [3], and it could also be used in an energy recovery system [4,5].
With the application of advanced design technology in the development of hydro turbines, the physical fluctuations in the labyrinth seals of Francis turbines have been the focus of a significant volume of research [6,7,8]. Meanwhile, transient processes, such as unit start-up and load rejection processes, are also important factors to be considered in the hydraulic design and optimization of the Francis turbines [9,10,11]. Here, hydropower accidents that are related to the occurrence of plant-vibration and turbine-lift during transient processes have often proved to be caused by a variety of hydraulic parameters in the labyrinth passages. For example, the dangerous vibration accident that took place at the Tianhuangping Pumped Storage Power Station in China during load acceptance in 2003 was caused by a high-pressure pulsation, being as high as 1.5 MPa, in the head cover clearance due to the upper labyrinth rings being clogged with calcium [12]. Hence, considering the leakage flow in the advanced design calculations of multiscale transient processes is of great significance for Francis turbines. This would not only help in analyzing unit vibration mechanisms by obtaining the pressure fluctuations and axial forces at the head cover and bottom ring, but also improving the accuracy of hydraulic efficiency predictions by obtaining the volumetric losses of the seal ring (SR) clearance.
In fact, the leakage flow of the Francis turbines has been taken into consideration since the early 20th century [13]. For example, Čelič et al. [14] investigated the influence of disc friction losses and labyrinth seal losses on the efficiency of a high head Francis turbine, and obtained an accurate prediction of efficiency if the runner seals were included. Koirala et al. [15] considered the guide vane clearance gap of a Francis turbine, and demonstrated that the leakage flow increased with an increasing clearance gap, which thereby reduced the energy conversion efficiency of the turbine along with producing a larger secondary vortex. Schiffer et al. [16] performed a numerical simulation of a Francis turbine with runner seals on the crown and band side, and presented a new approach to determine the total efficiency, including all of the losses occurring in the hydraulic components of the turbine. However, these past studies have mostly focused on the calculation of steady-state conditions in an effort to obtain more accurate or detailed parameters and inner flow characteristics.
In addition, the transient processes of hydraulic turbines have been primarily studied while using experimental and numerical simulation methods. The experimental method is considered to be a reliable means of investigating the hydraulic characteristics in transient processes, and the approach has solved numerous practical engineering problems. For example, Goyal et al. [17] performed a transient pressure measurement at a part load operating condition for a high head Francis turbine model, and a standing wave was observed between the pressure tank outlet and the turbine inlet. Hasmatuchi et al. [18] operated an experiment investigation of the rotating stall in a reduced scale model of a low specific speed pump-turbine at the runaway and turbine brake condition in generating mode. Trivedi et al. [19,20,21] has conducted a large number of experimental studies that focused on measuring pressure fluctuations in the transient processes of Francis turbines. These efforts demonstrated that pressure fluctuations in the pipeline are mainly affected by the rotational speed and the unsteady vortex in the vaneless zone and the runner. Although accurate data can be obtained through experiments, the experimental method presents obvious disadvantages, such as large investment costs, difficult operational procedures, relative inflexibility, and high safety risk.
Numerical methods have been developed to address these issues since the 1960s [22]. In the early stages of development, numerical methods were mainly based on one-dimensional (1D) approaches that relied on the method of characteristics (MOC) [23,24,25]. However, the MOC technique generally focuses on the overall water conveyance system, including long penstocks or tail water channels, and therefore it cannot obtain detailed information regarding the internal flow field of the turbine. Currently, three dimensional (3D) numerical simulation methods that are based on computational fluid dynamics (CFD) have been increasingly applied for evaluating the transient characteristics of hydraulic turbines [26,27]. For example, Pavesi et al. [28] conducted numerical simulations of a pump-turbine during the transient load following process in pump mode, and a full 3D flow structure was observed in the wicket gate channel, owing to boundary layer separation and stalling at lower rotational speeds. Li et al. [29] simulated the transient guide vane closure process for a pump-turbine that was operated in pump mode, and confirmed that the dynamic instabilities that were observed at the end of the closure process originated from severe hydraulic variations that occurred in the guide vanes. Fu et al. [30,31] discussed the energy conversion and dynamic instability of a pump-turbine during the transient load rejection process, and concluded that viscous dissipation effects of vortex flows in the tandem cascade regions mainly caused the dynamic instabilities and hydraulic losses. However, most previous numerical studies of transient processes in hydraulic turbines employing 3D CFD methods have neglected leakage flow in the runner crown and bottom ring to reduce the calculation time. Nonetheless, the clearance flow between the runner and its adjacent stationary parts has a significant influence on the internal flow and dynamic characteristics of hydraulic turbines [32,33].
This paper addresses this issue by considering all of the geometrical details of labyrinth seals in a Francis turbine during a transient load rejection process using a multiscale 3D CFD numerical method that was provided by the commercial ANSYS Fluent 17.0 software (ANSYS Inc, Canonsburg, PA, USA). First, this work establishes an overall Francis turbine passage model that includes a labyrinth seal clearance in the upper crown and bottom ring. Subsequently, the boundary conditions and solution method are determined according to the characteristics of transient flow calculations. Finally, the calculated dynamic operational parameters, such as leakage flow rate, static pressure of monitoring points, runner torque, and the axial force on the runner, are compared with the experimental results.

2. Numerical Simulation Method

2.1. Computation Domain and Meshing Schemes

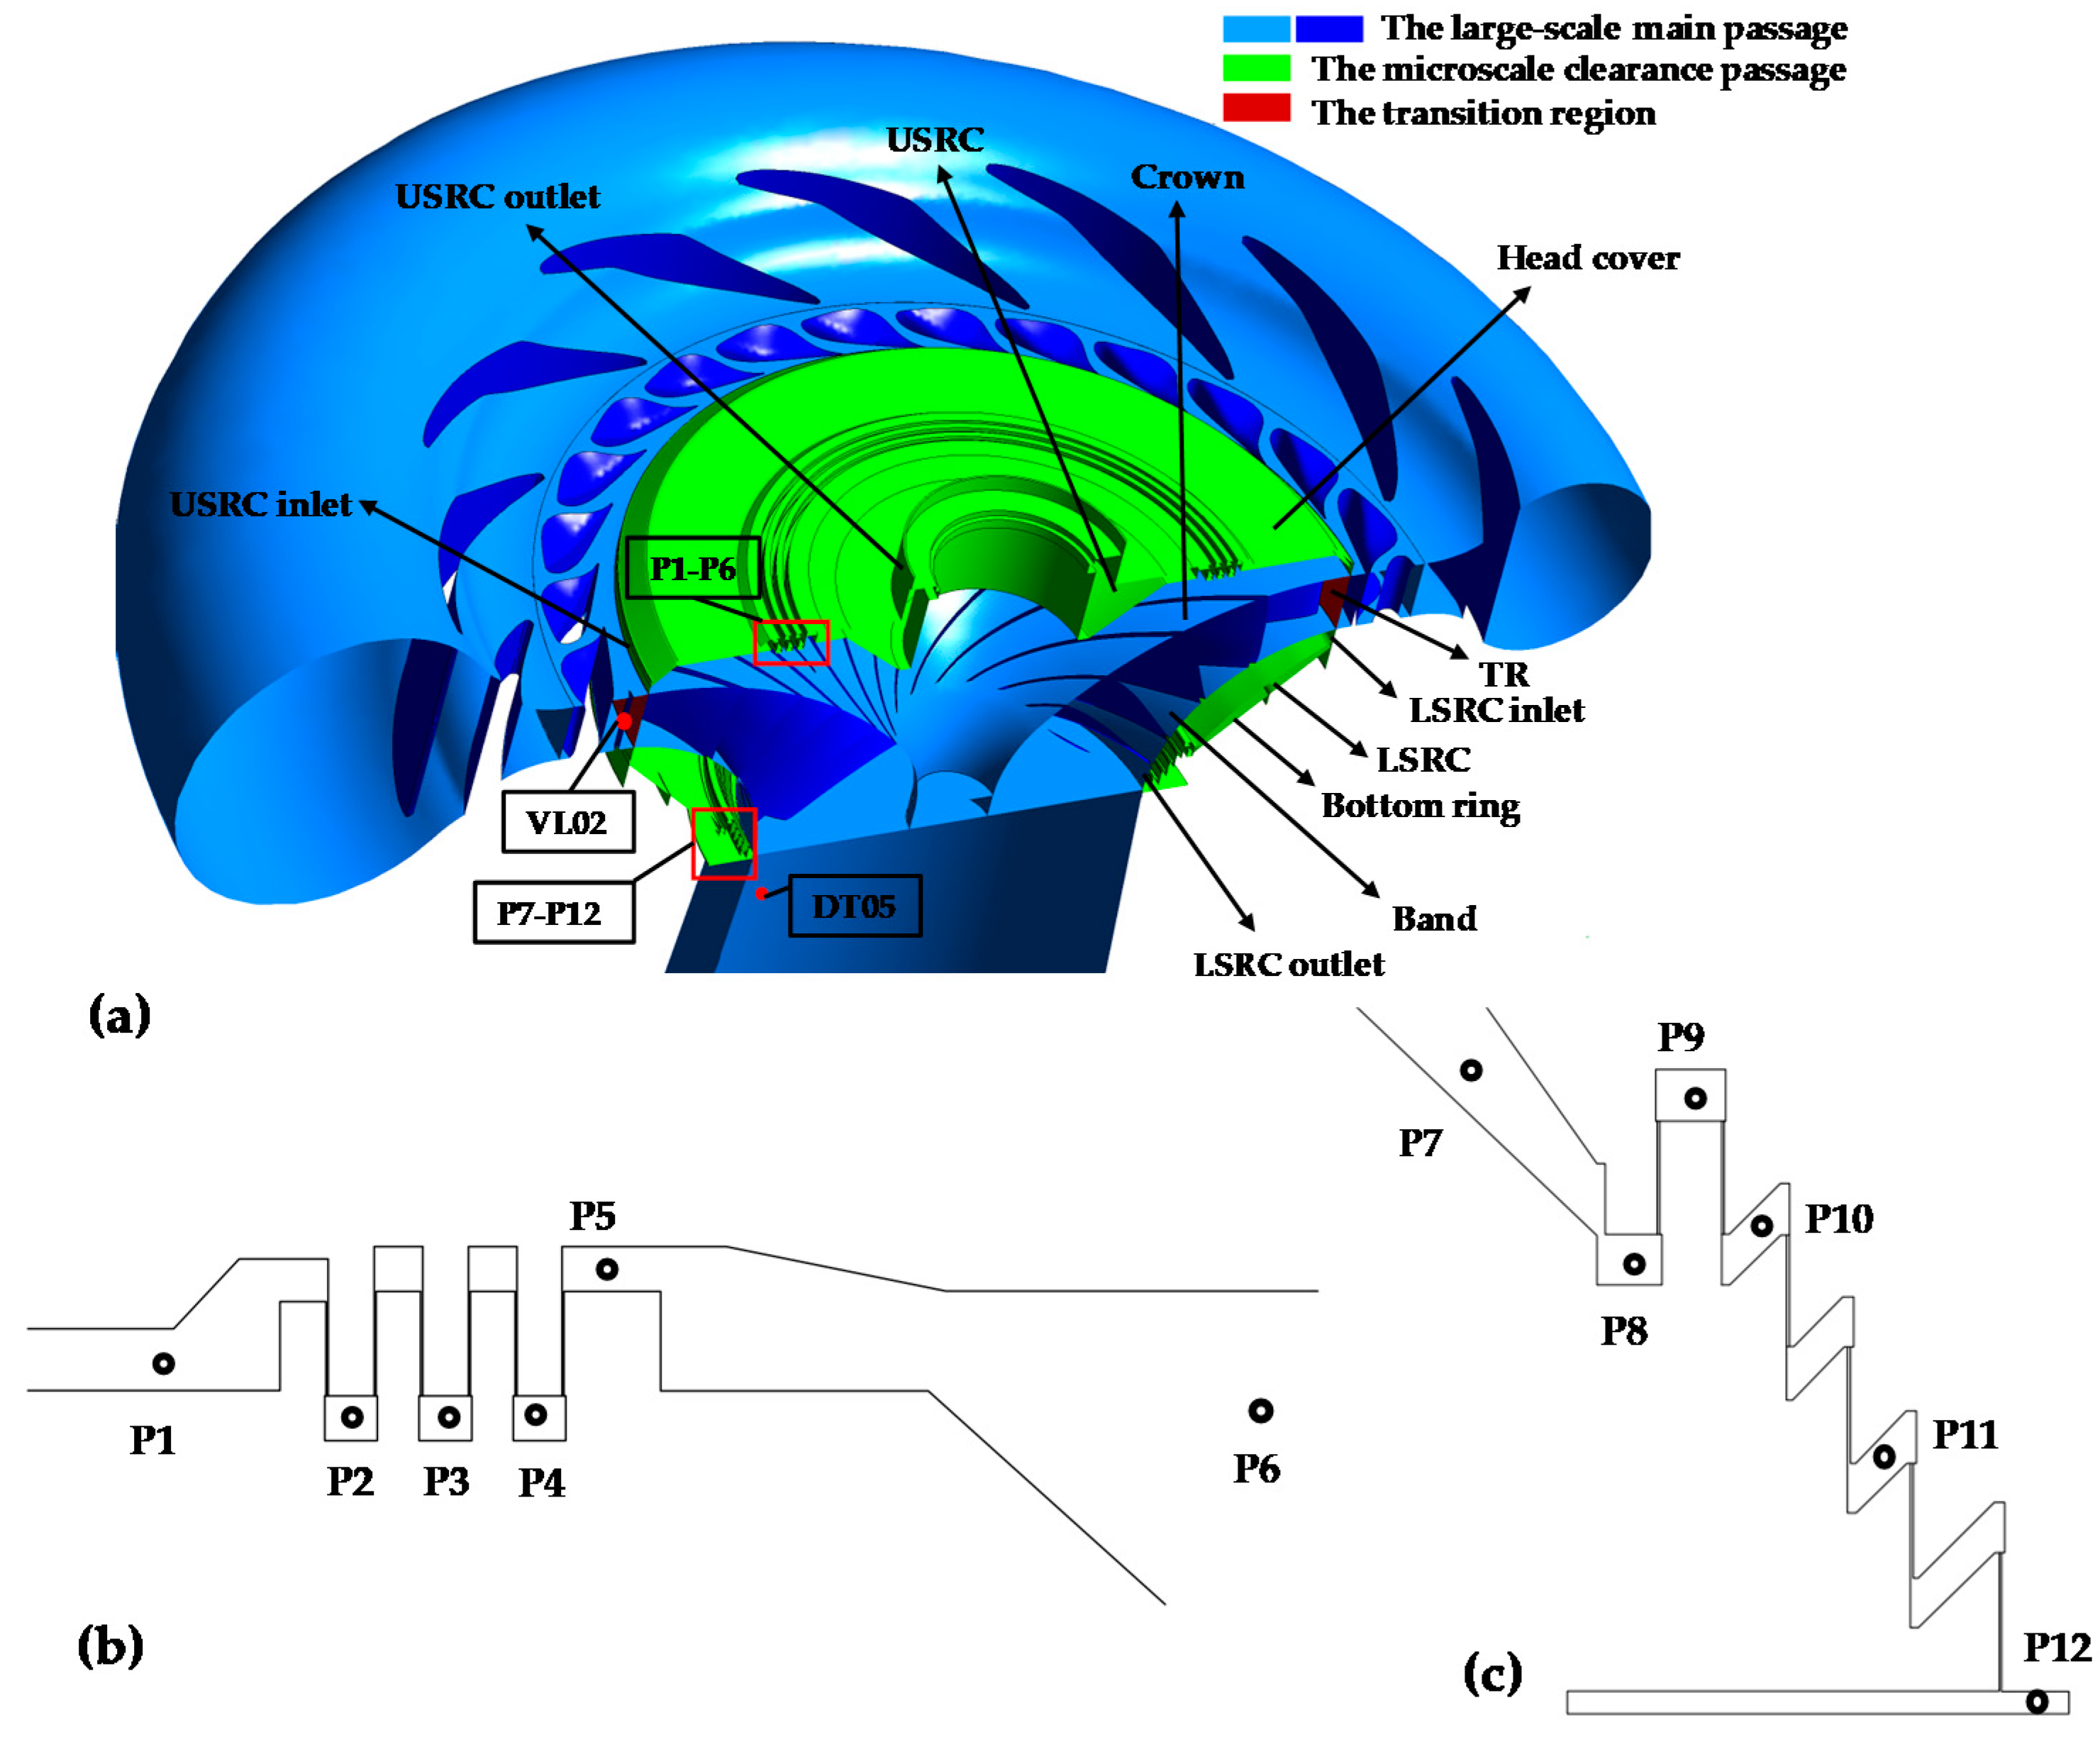
The computation domain is illustrated in Figure 1 and it consists of three components: the large-scale main passage, the microscale clearance passage, and the transition region that connects them smoothly, which is defined as multiscale passage. The main flow passage includes a volute with 14 stay vanes, a guide vane with 28 vanes, a runner consisting of a crown, a band, 15 long blades and 15 short blades, and a draft tube. The microscale clearance passage is illustrated in Figure 2a, and it consists of two components: an upper seal ring clearance (USRC) between the upper surface of the crown and the lower surface of the head cover, and a lower seal ring clearance (LSRC) between the lower surface of the band and the upper surface of the bottom ring. The transitional zone refers to a cylindrical flow passage with a wall thickness of 0.5 mm that is located between the guide vane outlet and the runner inlet. This zone effectively connects the USRC and LSRC with the main flow passage. In addition, the locations of the pressure measurement points VL02 in the vaneless zone, DT05 in the draft tube, and P1–P12 in the USRC and LSRC are shown in Figure 2a, while the exact locations of P1–P6 and P7–P12 are shown in Figure 2b,c, respectively. The Norwegian University of Science and Technology (NTNU) and Lulea University of Technology (LTU) [34] provided the experimental test data for a model turbine design corresponding to the numerical model employed herein.
All of the dimensions in the numerical model were obtained, including the diameter of the runner water inlet as D1 = 0.349 m, the net head of the turbine as Hr = 12 m, and the mass flow rate of the turbine as Qr = 200 kg/s, by scaling the parameters of a prototype turbine (i.e., Dp1 = 1.78 m, Hpr = 377 m, and Qpr = 31000 kg/s) at a ratio of 1:5.1.
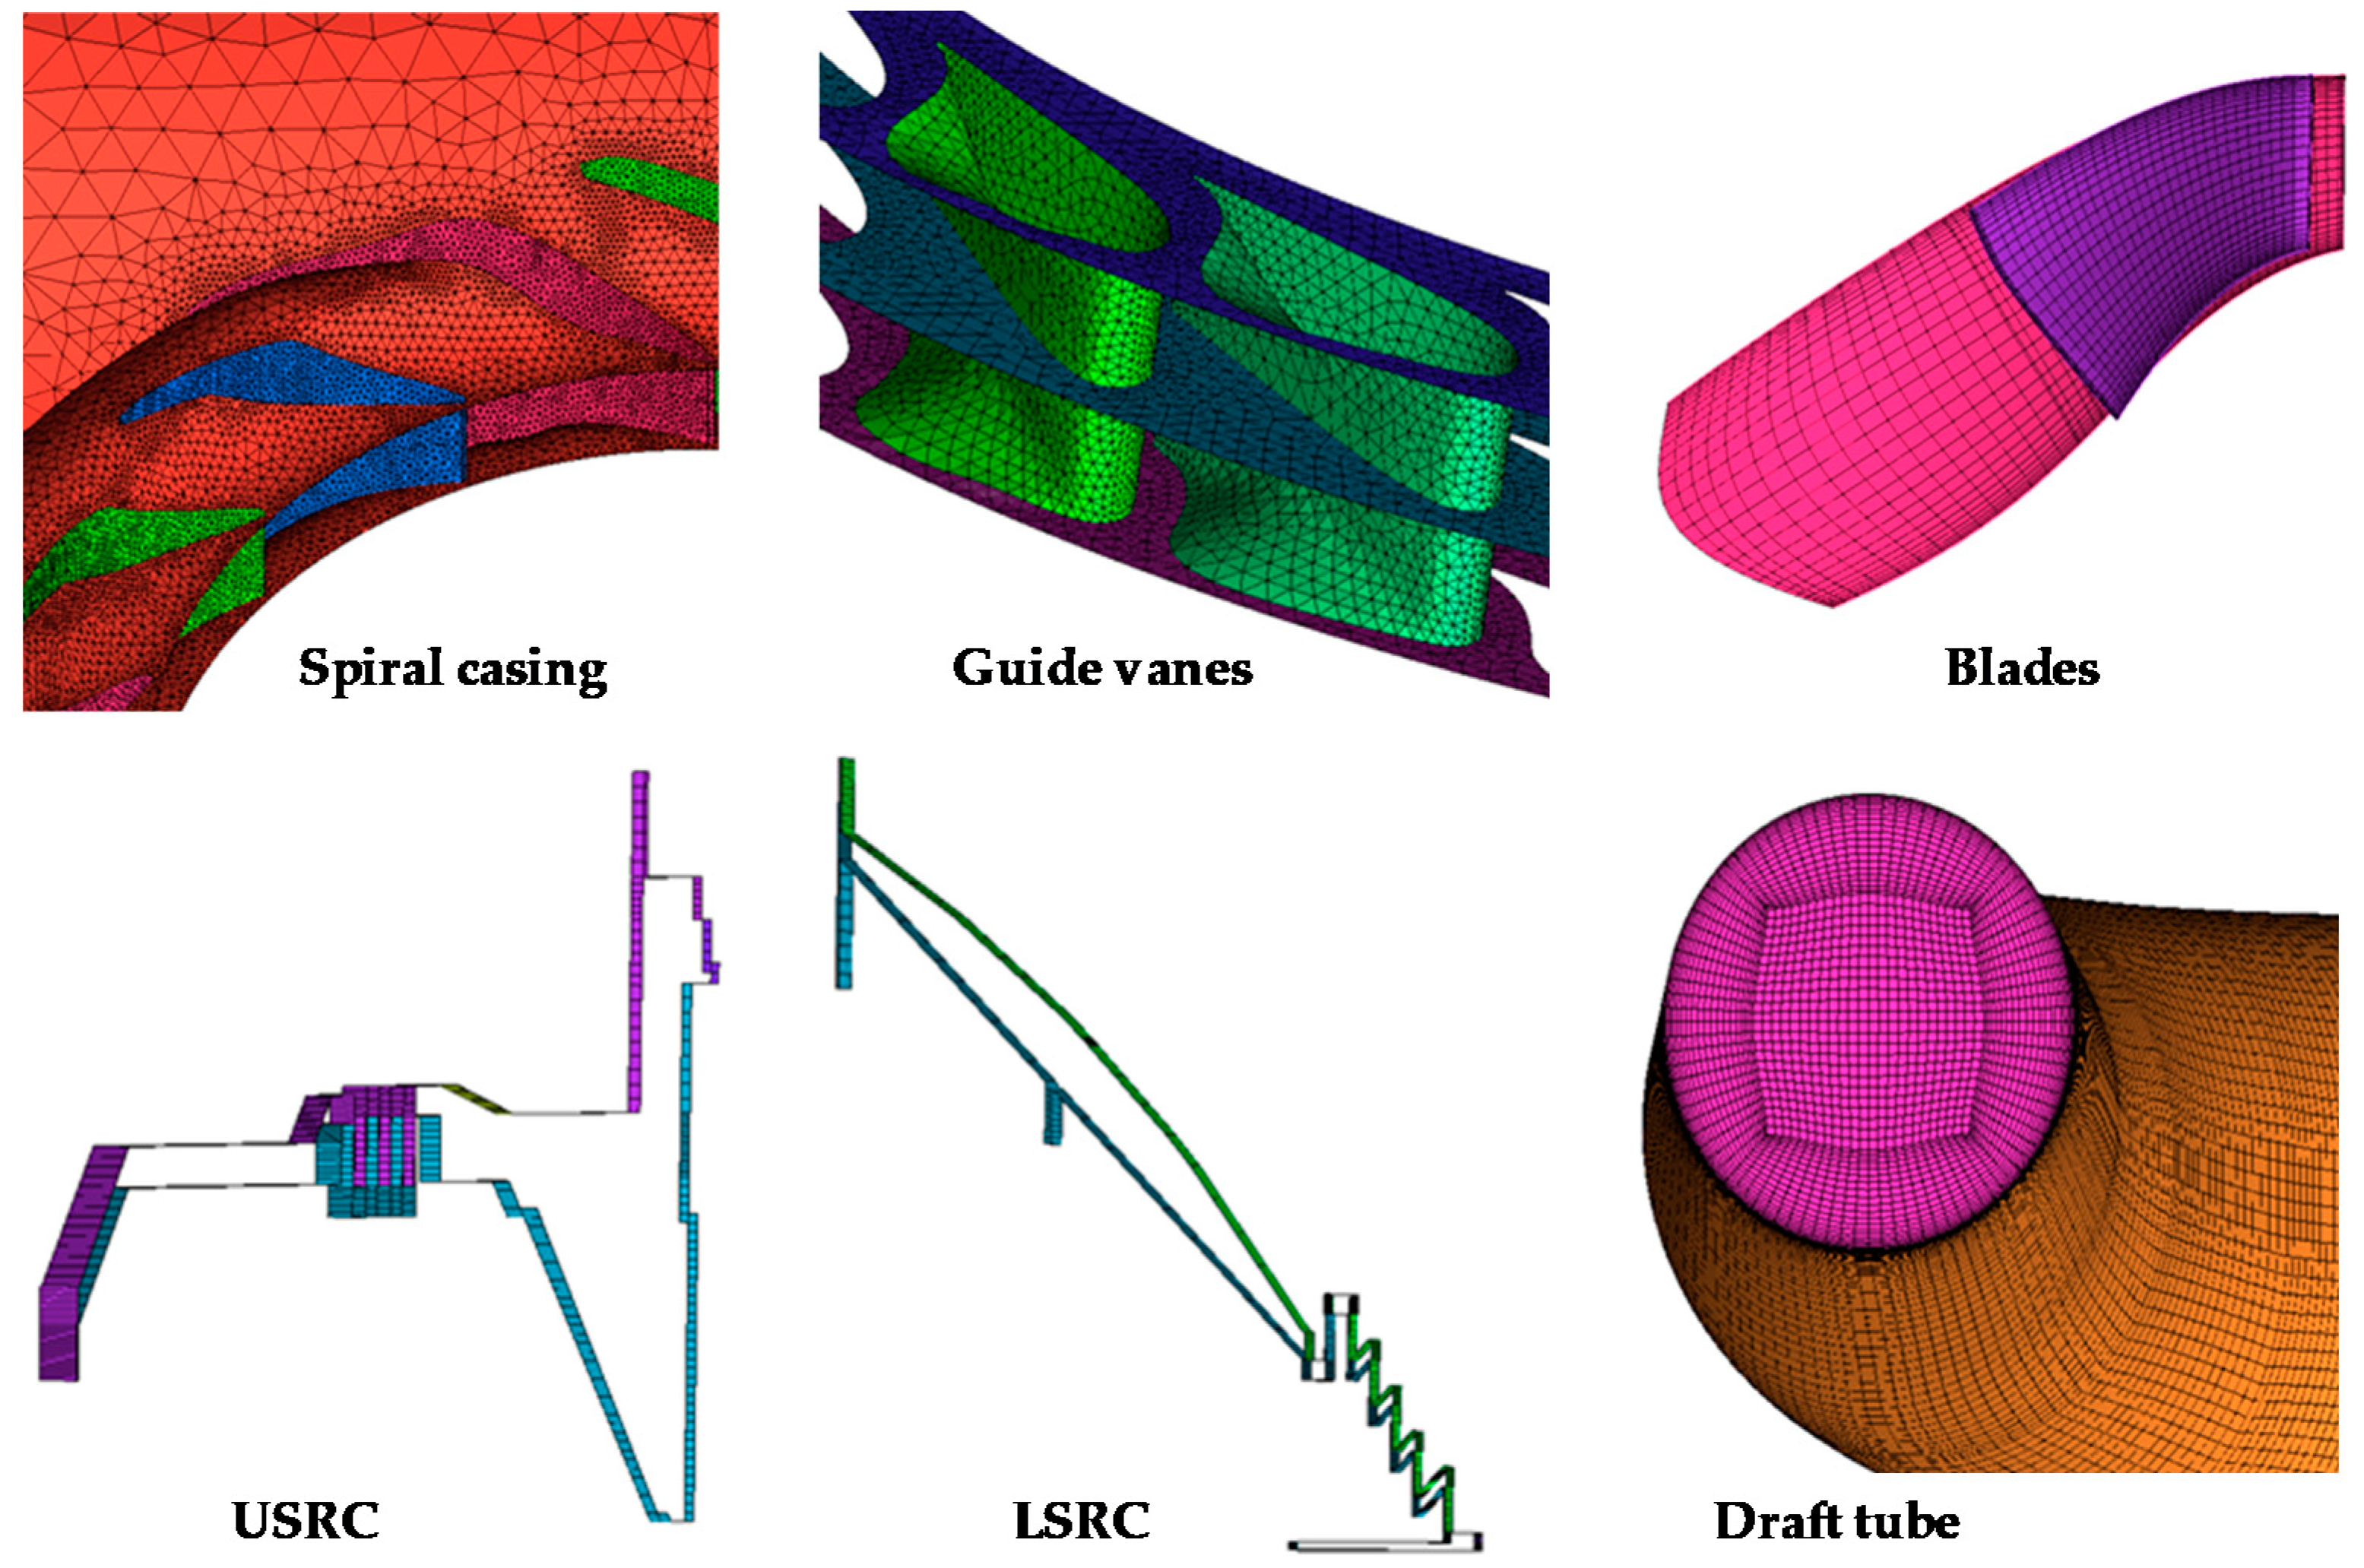
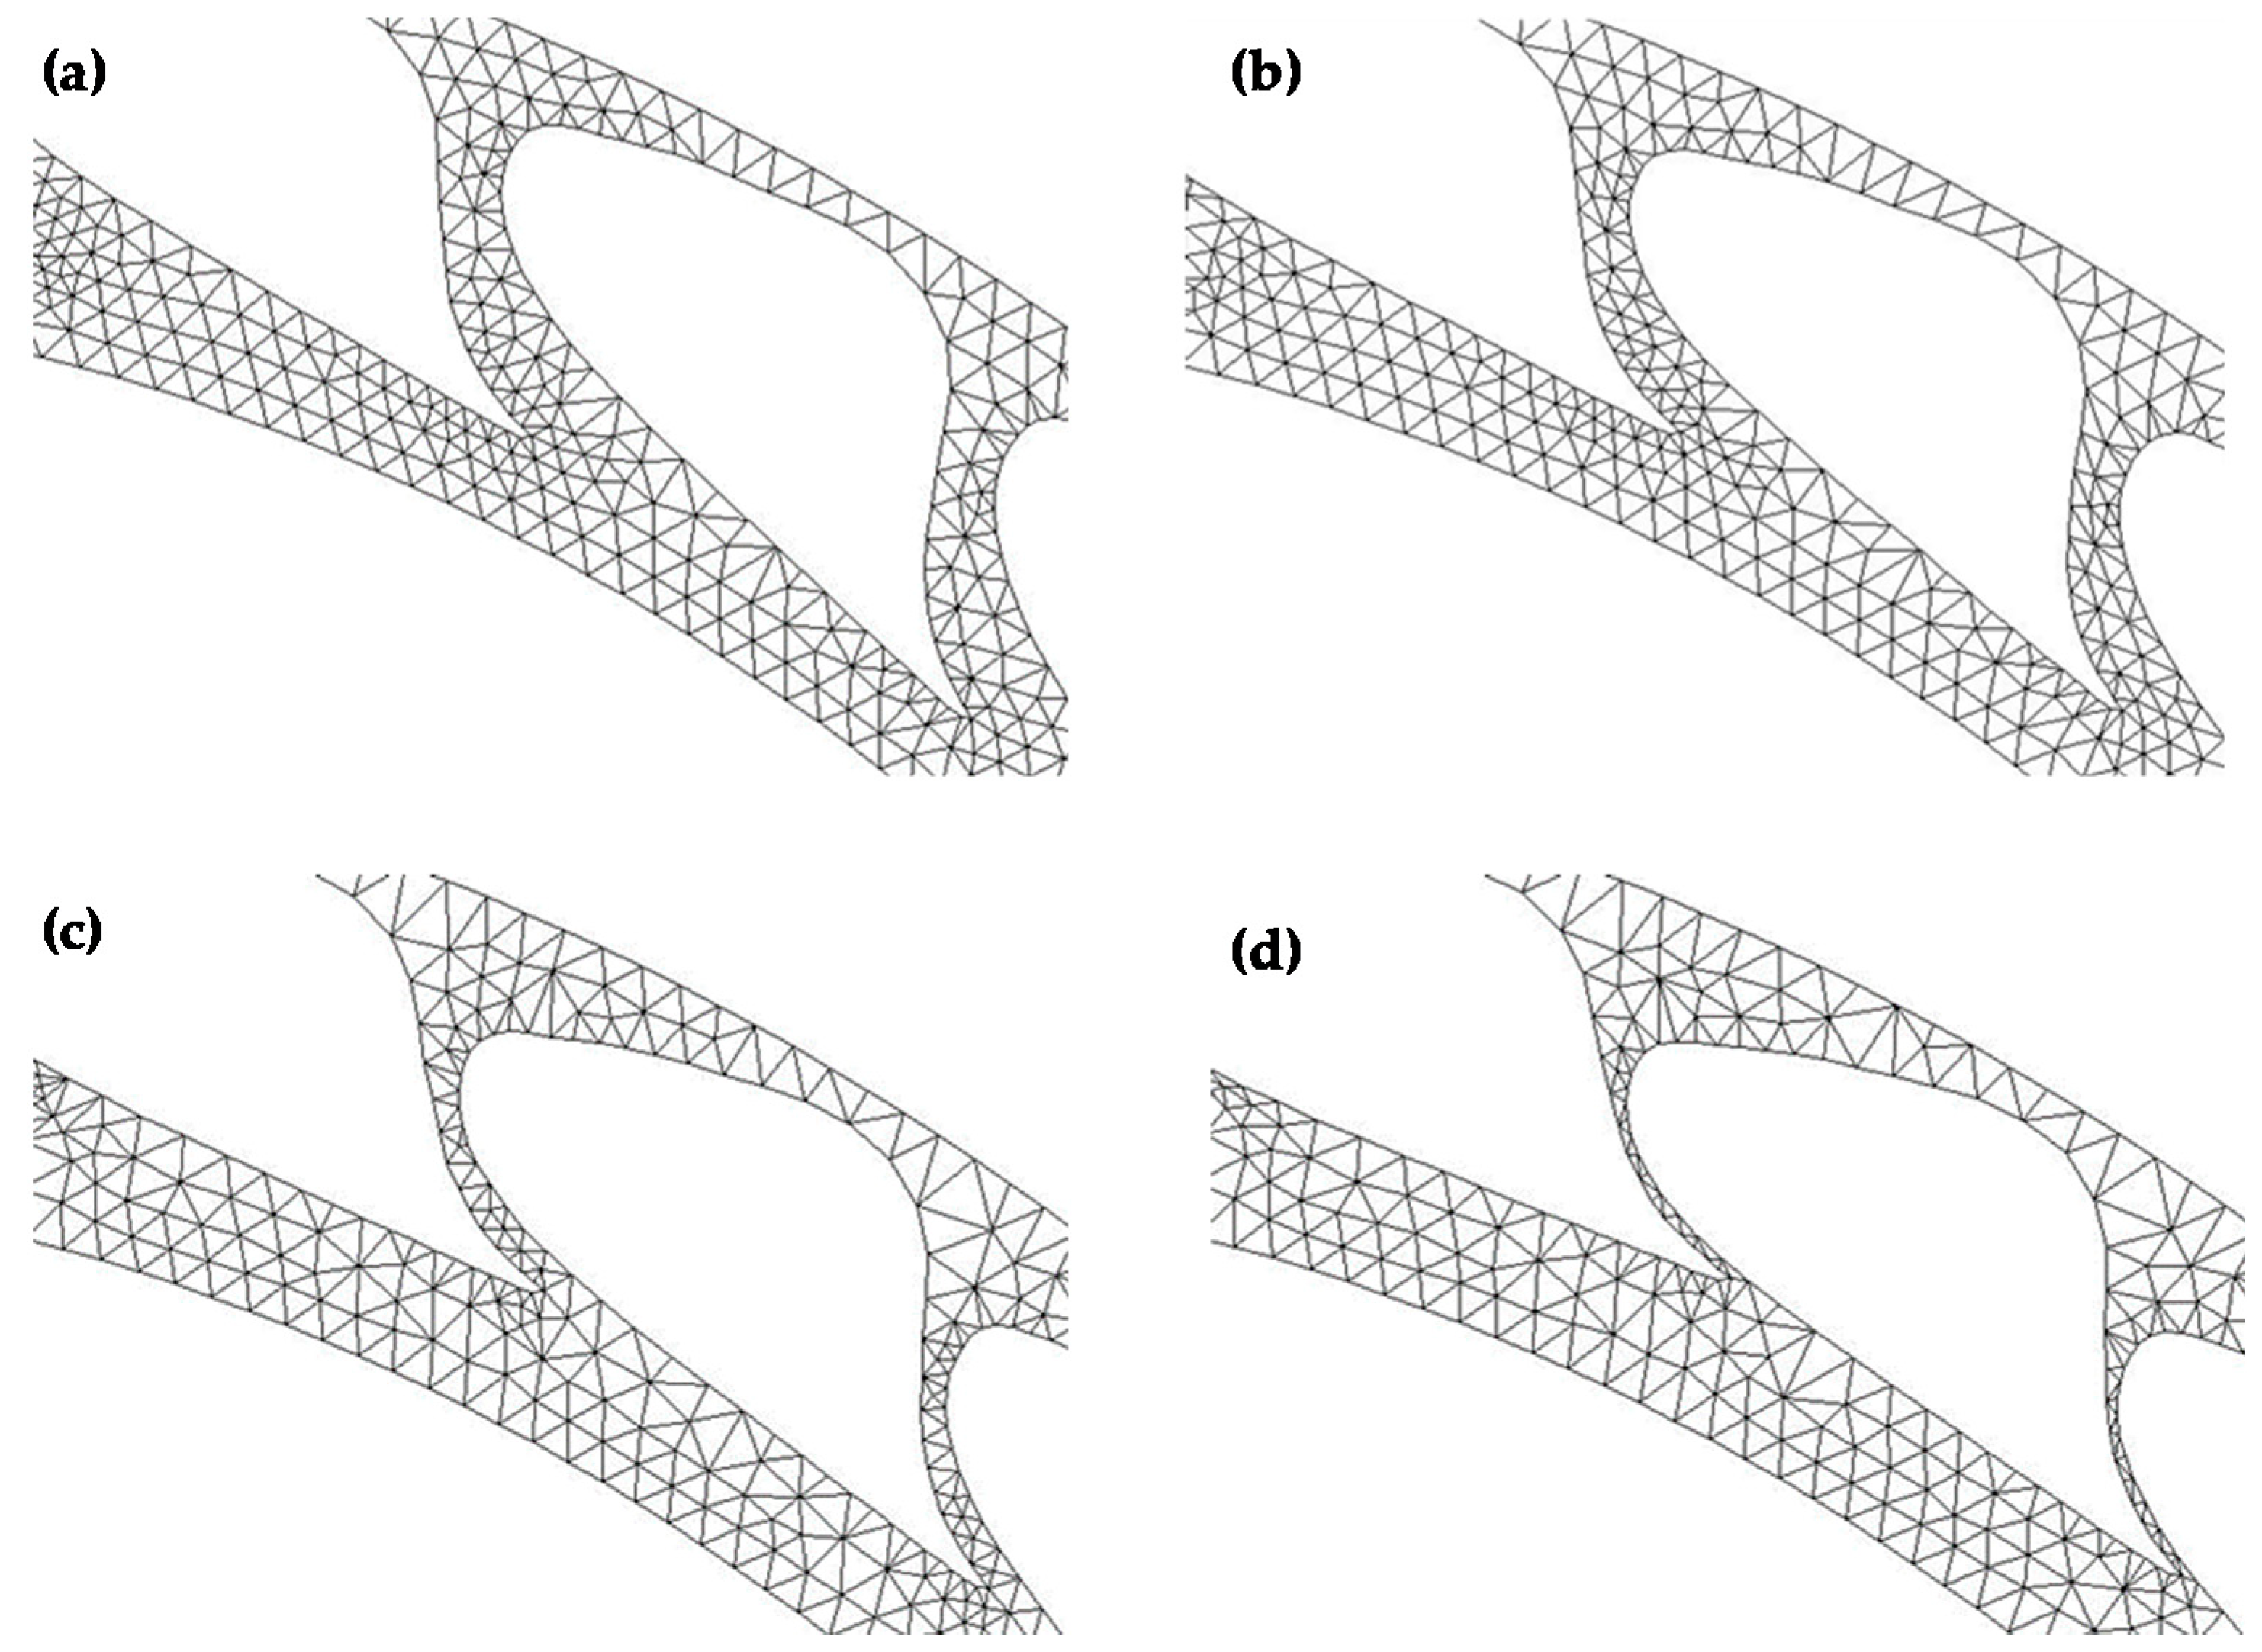
The multiscale passage computational domain was divided into mesh while using the ANSYS ICEM 17.0 software (ANSYS Inc, Canonsburg, PA, USA), and a schematic of the resulting mesh is shown in Figure 3 at the designed condition. The structural mesh division technique was used for the runner, draft tube, transition zone, and USRC and LSRC to improve the accuracy and efficiency of the calculation. The unstructured tetrahedron mesh division technique was used in the spiral casing. As shown in Figure 4, the dynamic mesh technique that is based on unstructured mesh division was employed for successfully reducing the guide vane angle from 9.84° to 0.8° over an 8 s period under the load rejection condition.

2.2. Governing Equations

Because transient calculations are the primary focus of the present study, the Navier–Stokes equations that are based on the Arbitrary Lagrange–Eulerian (ALE) method were employed as the governing equations. These are given according to the continuous Equation (1) and momentum Equation (2), as follows.
ρ t + ρ ( v u ) = 0
ρ v t + ( ρ v ) ( v u ) = p + μ 2 v + ρ g
Here, ρ is the fluid density; t is the time; ∇ is the Hamiltonian operator; ν refers to the fluid velocity vector; u is the mesh movement velocity vector; p is the static pressure; μ is the fluid viscosity; and, g is the vector of accelerations acting on the continuum. In calculations involving the dynamic mesh, changes in the moving boundary mesh and the volume of the control body must obey the following geometric conservation law.
t Ω d V = Ω C m d S
Here, V is the volume of the control body that is formed by its boundary Ω, C is the boundary velocity, and m is the outward normal unit vector of the infinitesimal area Ω at dS.
The Menter’s shear stress transport (SST) k-ω turbulence model [35,36] redefines the turbulent viscosity by modifying only a small number of model constants to consider the transport of turbulent shear stress, so it would reduce the distortion when simulating turbulent flows in a wide range of flow fields. In addition, the SST k-ω model can effectively predict flow separation under adverse pressure gradient conditions. Hence, when considering the complex flow fields in the Francis turbine model, the governing equations were enclosed using the SST k-ω turbulence model, which is given, as follows.
( ρ k ) t + ( ρ k u i ) u i = P k β * ρ k ω + x j [ ( μ + σ k μ t ) k x j ]
( ρ ω ) t + ( ρ ω u i ) u i = α ω k P k β ρ ω 2 + x j [ ( μ + σ ω μ t ) ω x j ] + 2 ρ ( 1 F f ) σ ω , 2 1 ω k x j ω x j
Here, k is the kinetic energy of the turbulence, ω is specific dissipation rate, ui and uj are the velocity components in different directions, x, j = 1, 2, 3; Pk is the generation of turbulence kinetic energy; σk, σω are the turbulent Prandtl numbers for k and ω; μt is the turbulent eddy viscosity; and, Ff is a mixing function. The empirical constant values of the above formula are β* = 0.09, σk = 1.0, σω = 0.856, α = 0.31, β = 0.0828, and σω,2 = 0.856 [37].

2.3. Solution Method, Boundary Conditions and Simulation Conditions

The solutions were conducted within ANSYS Fluent 17.0. The finite volume method was used for discretizing the governing equations. The second-order central difference scheme was adopted for the diffusion term and the second order upwind scheme was adopted for the convection term. The semi-implicit method for pressure linked equations-consistent (SIMPLEC) pressure-velocity coupling algorithm was employed for the iterative solution of the discretized Navier–Stokes equations.
The boundary conditions were set as follows. (1) In the steady-state calculations, the runner was defined in a rotating reference frame. In the transient calculations, the rotor component was defined as the rotation mesh, while the other flow-related components were defined in stationary coordinates. (2) The spiral casing inlet was defined as the pressure inlet, and the draft tube outlet and the USRC outlet were defined as the pressure outlet. (3) The upper surface of the crown and the lower surface of the band were defined as the rotation surfaces, and the rotation direction and rotation speed were consistent with the rotating runner. (4) The guide vanes were closed according to the defined linear closure process, where the surfaces of the guide vanes were defined as rigid body motion areas, and the upper and lower surfaces of the guide vane area were defined as deforming surfaces.
Numerical simulations of the Francis turbine were conducted under a load rejection condition, both with and without an SR clearance at a synchronous speed of 34.85 rad/s. Both the USRC and LSRC were set as 0.05 mm. The total sampling time during numerical model testing was 10 s and the sampling frequency was 5 kHz. During the periods 0–1 s and 8–10 s, the guide vanes remained stationary, while, during the period 1–8 s, the guide vane angle decreased from 9.84° to 0.8° linearly. Table 1 list the model testing operational parameters under the designed load (DL) condition and the minimal load (ML) condition that were obtained after load rejection. For the Francis turbine model without SR clearance, the following parameters were monitored: the mass flow rate of the inlet and outlet Q, the torque of runner T, the axial force of runner Fz, the axial force of blades Fz1 (with SR clearance) and Fz2 (without SR clearance), and the pressure at points VL02 and DT05. In addition to these monitored parameters, the following monitored parameters were included in the Francis turbine model with an SR clearance: the total axial forces of the crown and the band, denoted as Fz3, the axial forces of the head cover Fz4, the mass flow rate of the USRC and LSRC, the pressure at points P1 to P6 in the USRC, and the pressure at points P7 to P12 in the LSRC.

3. Numerical Results and Analysis

3.1. Mesh and Time Step Dependency Analysis

The dependency analysis results that were based on the evaluation criterion of efficiency ηM with respect to the number of mesh cells N (with the time step Δt = 0.002 s) are listed in Table 2. Accordingly, scheme 3 was selected as the final computational mesh based on the trade-off between the required calculation time and accuracy. The value of the dimensionless parameter y+ in the boundary layer of each component was determined according to this scheme. This provided y+ values of 6.5–89 for the spiral casing and guide vanes, 7.5–48 for the runner, 6–77 for the draft tube, and y+ ≈ 1 for the clearance, which is a helpful way to more realistically capture the characteristics of the flow field in the clearance. In addition, the maximum and minimum cell surface area was 2.8 × 10⁻³ m2 and 9.1 × 10⁻⁹ m2, respectively. For the model without SR clearance, the total grid number is about 0.8 million less than that of the model with SR clearance, because the extremely fine sharp parts of meshes are not considered. Actually, the main computational load comes from the dynamic mesh because the closing of the guide vane updates the guide vane area grid every time step. For the two models, they shared the same closing law of guide vanes, so the calculation time is basically the same. In this paper, the workstation that was equipped with Intel Xeon E5-1650 v3 CPU with 3.5 GHz basic frequency and 128 GB RAM was used to carry out the calculation. The typical CPU time that was required to implement the 3D simulation for the 6600 k cells system was about 200 h on this configured computer.
The dependency analysis results that were based on the evaluation criteria of mass flow rate Q and runner torque T with respect to Δt (with N = 6600 k) are shown in Table 3. Accordingly, a value of Δt = 0.002 s was applied based on the trade-off between the required calculation time and accuracy.

3.2. Analysis of Flow Characteristics and Forces in the Main Passage

In this paper, the accuracy of numerical prediction is expressed by the relative deviation of the predicted parameters:
Δ X = X X X × 100 %
Here, X represents the experimental value of the parameters and X′ represents the numerical prediction value.
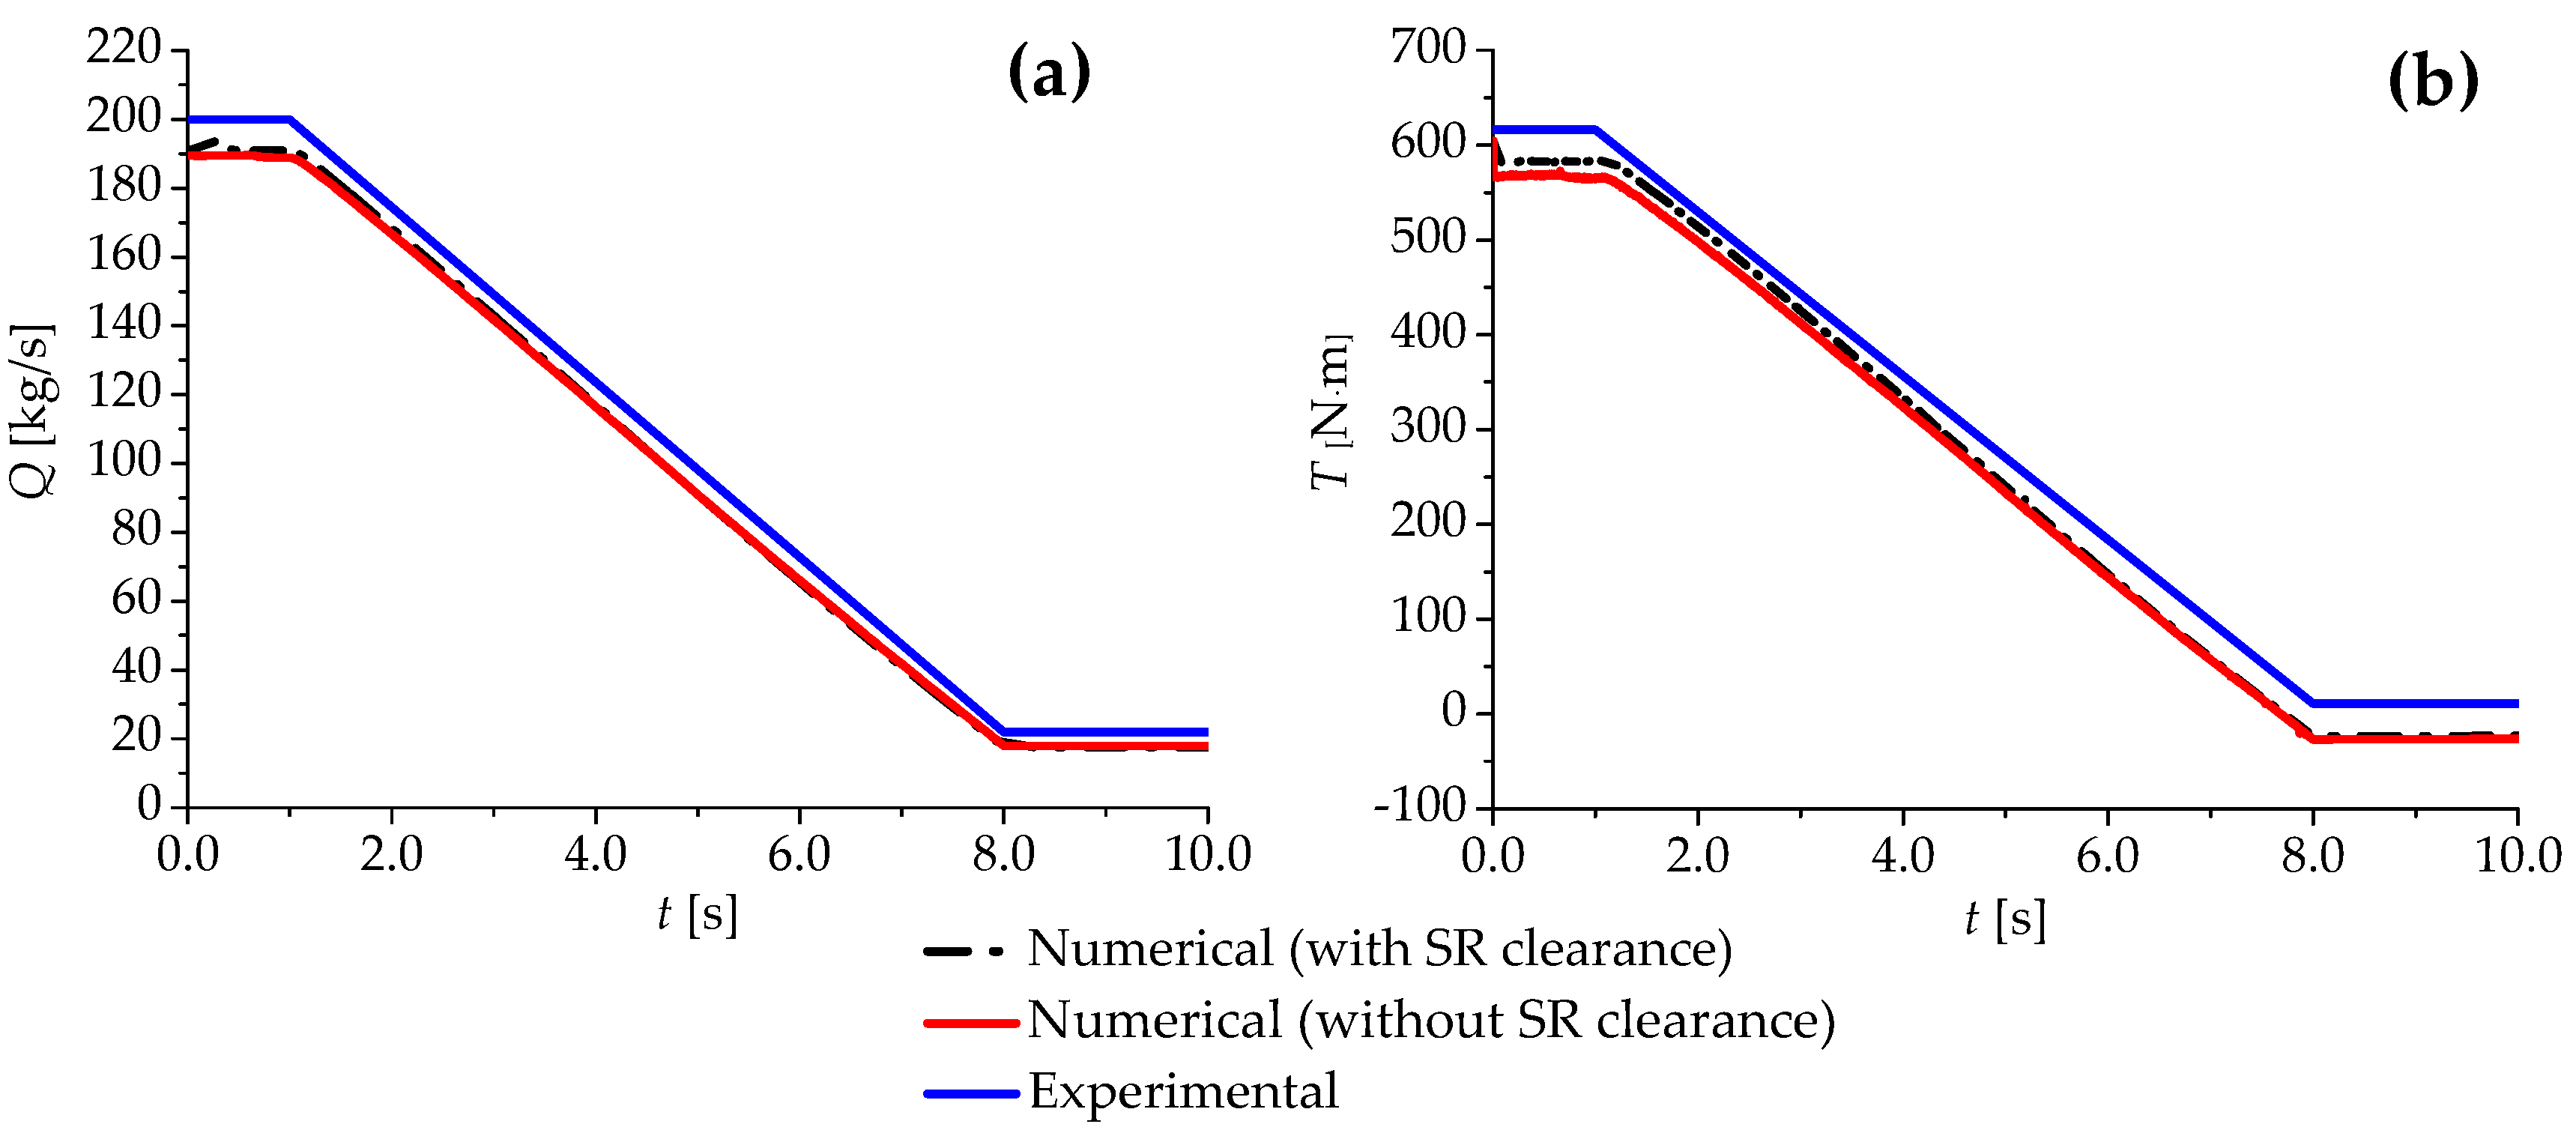
Figure 5a,b presents the numerical simulation and experimental model test results of the Francis turbine with and without an SR clearance with respect to the mass flow rate Q across the spiral casing inlet and the torque T of the runner, respectively. The following were observed from the Figure 5. (1) The initial value of Q (192.7 kg/s) and the final value of Q (17.3 kg/s) obtained from the numerical simulation are consistent with the initial value (200 kg/s) and the final value (22 kg/s) of Q obtained from the experimental model test results. The relative error between numerical simulation when considering SR clearance and experimental results is less than 10%. For the Q curve, the relative difference between the results with and without SR clearance range from 1% to 3%. (2) The initial value of T (585.8 N·m), as obtained from the numerical simulation, is slightly less than that obtained from the experimental model test results (616.1 N·m). However, the final value of T (−20 N·m) that was obtained from the numerical simulation substantially differs from the experimental model test results (11.16 N·m). The relative error between the numerical results with SR clearance and test results is less than 6% overall. One possible reason for this discrepancy is that the unchanging computational model is not able to describe the complex flow patterns obtained under a small flow condition with a reasonable degree of accuracy, which negatively affects the calculation of T. For the T curve, the relative difference between the results with and without SR clearance range from 2% to 3%. (3) The calculated values of Q and T are slightly less than those values that were obtained from the experimental model testing over the entire load rejection transition process. However, the trends observed in the numerical results of the model with SR clearance are consistent with those of the experimental model test results, the relative is 0.5% less than that of the without SR clearance model, which indicates that the proposed numerical simulations of the multiscale passage are feasible for predicting variations in Q and T with respect to t during load rejection.
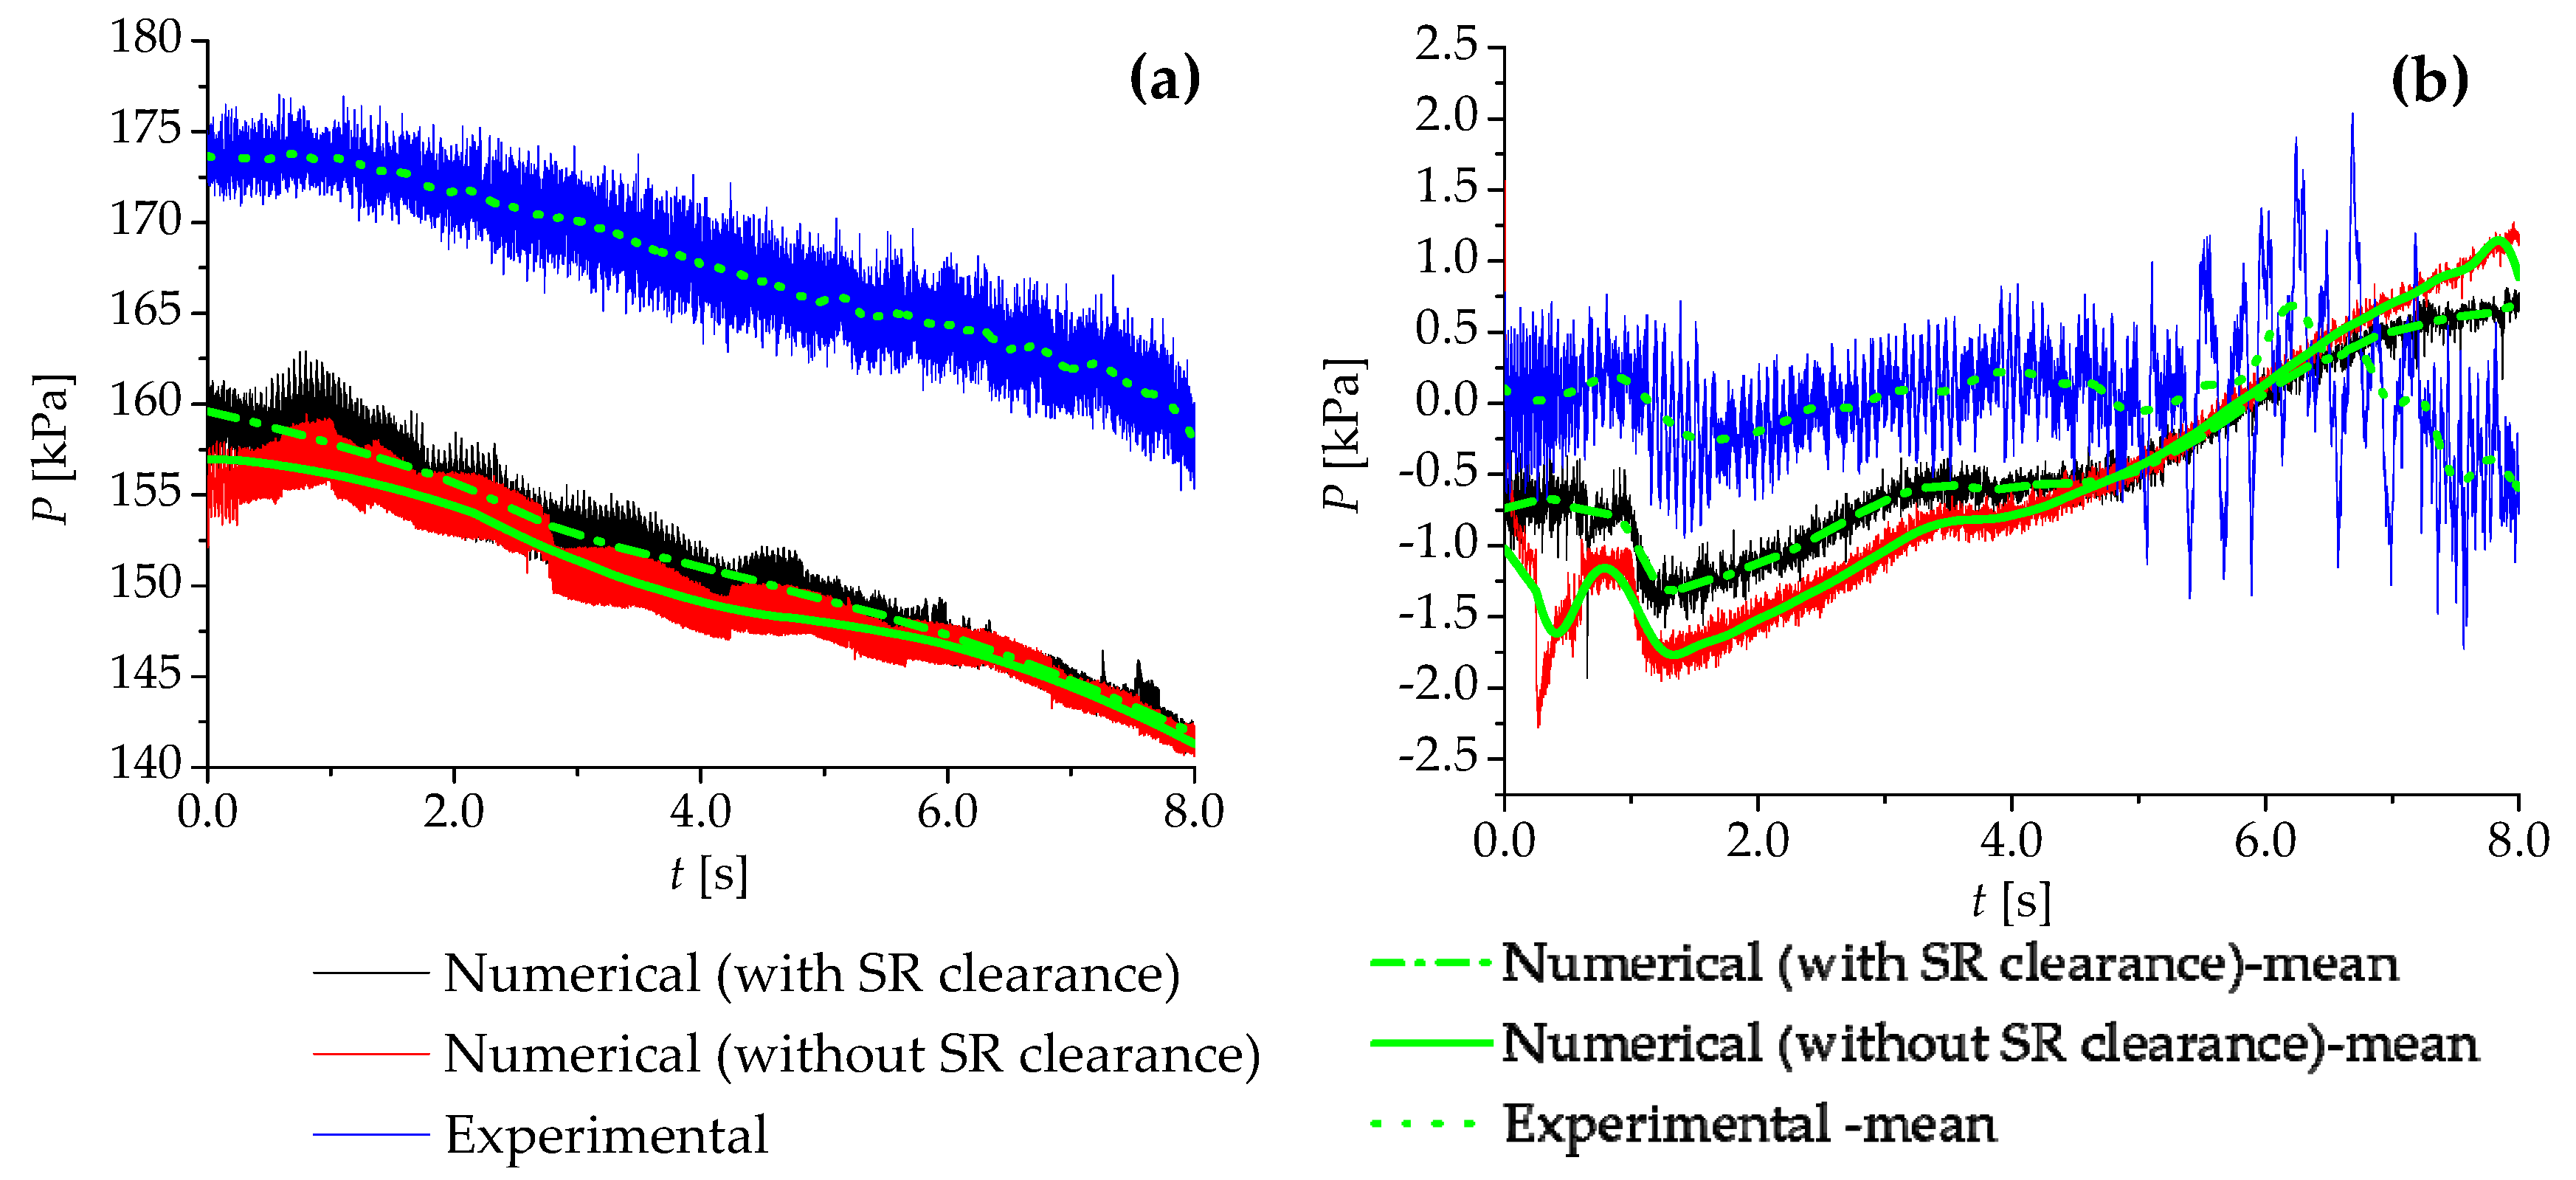
Figure 6a,b presents the numerical simulation and experimental model test results of the pressures at VL02 and DT05, respectively. In order to see the trend of the curve more clearly, a adjacent-averaging treatment was adopted for each curve to get a smooth curve. From Figure 6, the findings were obtained, as follows: (1) Even though the calculated pressure at VL02 is slightly less than the experimental value, the vibrational trends of the two are basically equivalent in the time domain. Here, the magnitude of the error between the calculated result of model with clearance and experimental values is about 20 kPa and the relative error is about 10%. However, the error is about 12% for the model without SR clearance. Thus, the numerical simulation results that were obtained for the model with labyrinth seals agree more closely with the experimental results than those that were obtained for the model without labyrinth seals. (2) During the period 0–4 s, the calculated static pressure values at DT05 are less than the experimental values. However, the guide vanes began to close at t = 1 s, and the pressure drop due to the water hammer effect is reflected in both the numerical simulation and experimental model test results. During the period 4–8 s, the calculated static pressure at DT05 continues to increase due to limitations in the numerical model, while the experimental static pressure exhibits a declining trend after 7 s.

3.3. Analysis of Flow Characteristics and Forces in the Clearance Passage

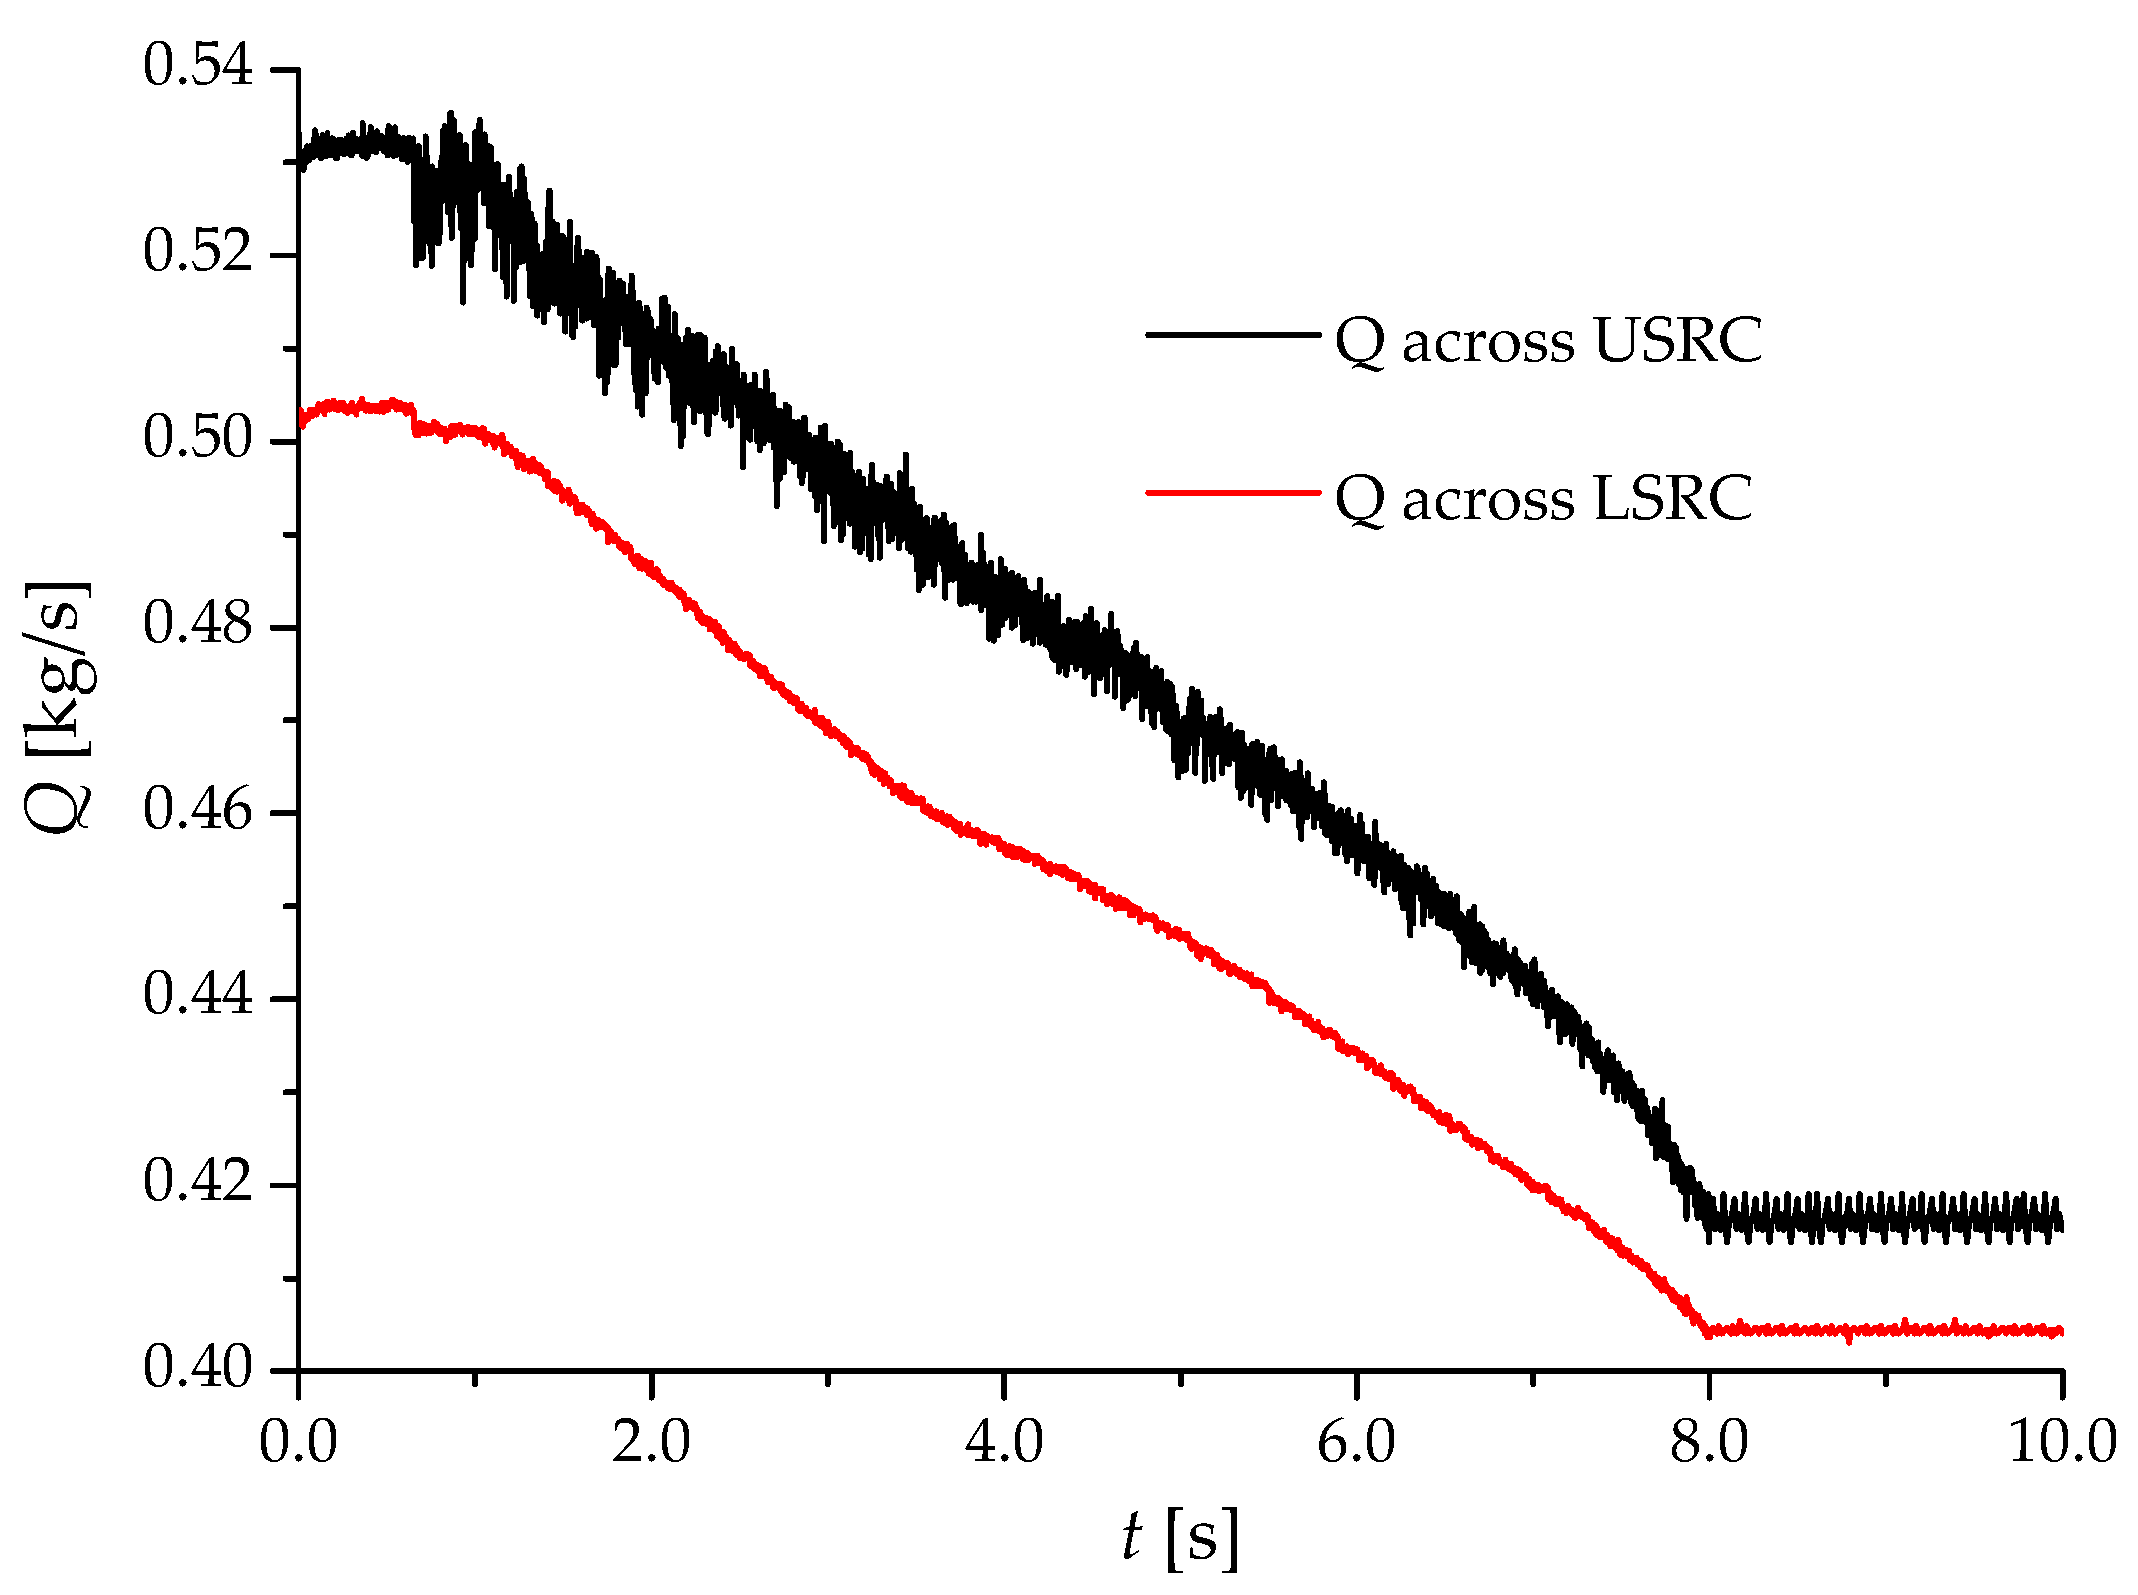
Figure 7 presents the values of Q that were obtained from the numerical simulation across the USRC and LSRC. The results indicate that the value of Q that was obtained for the USRC is slightly greater than that obtained for the LSRC. Meanwhile, the discharge fluctuations observed across the USRC are relatively greater during the load rejection transition due to greater pressure fluctuations in front of the USRC than in front of the LSRC.
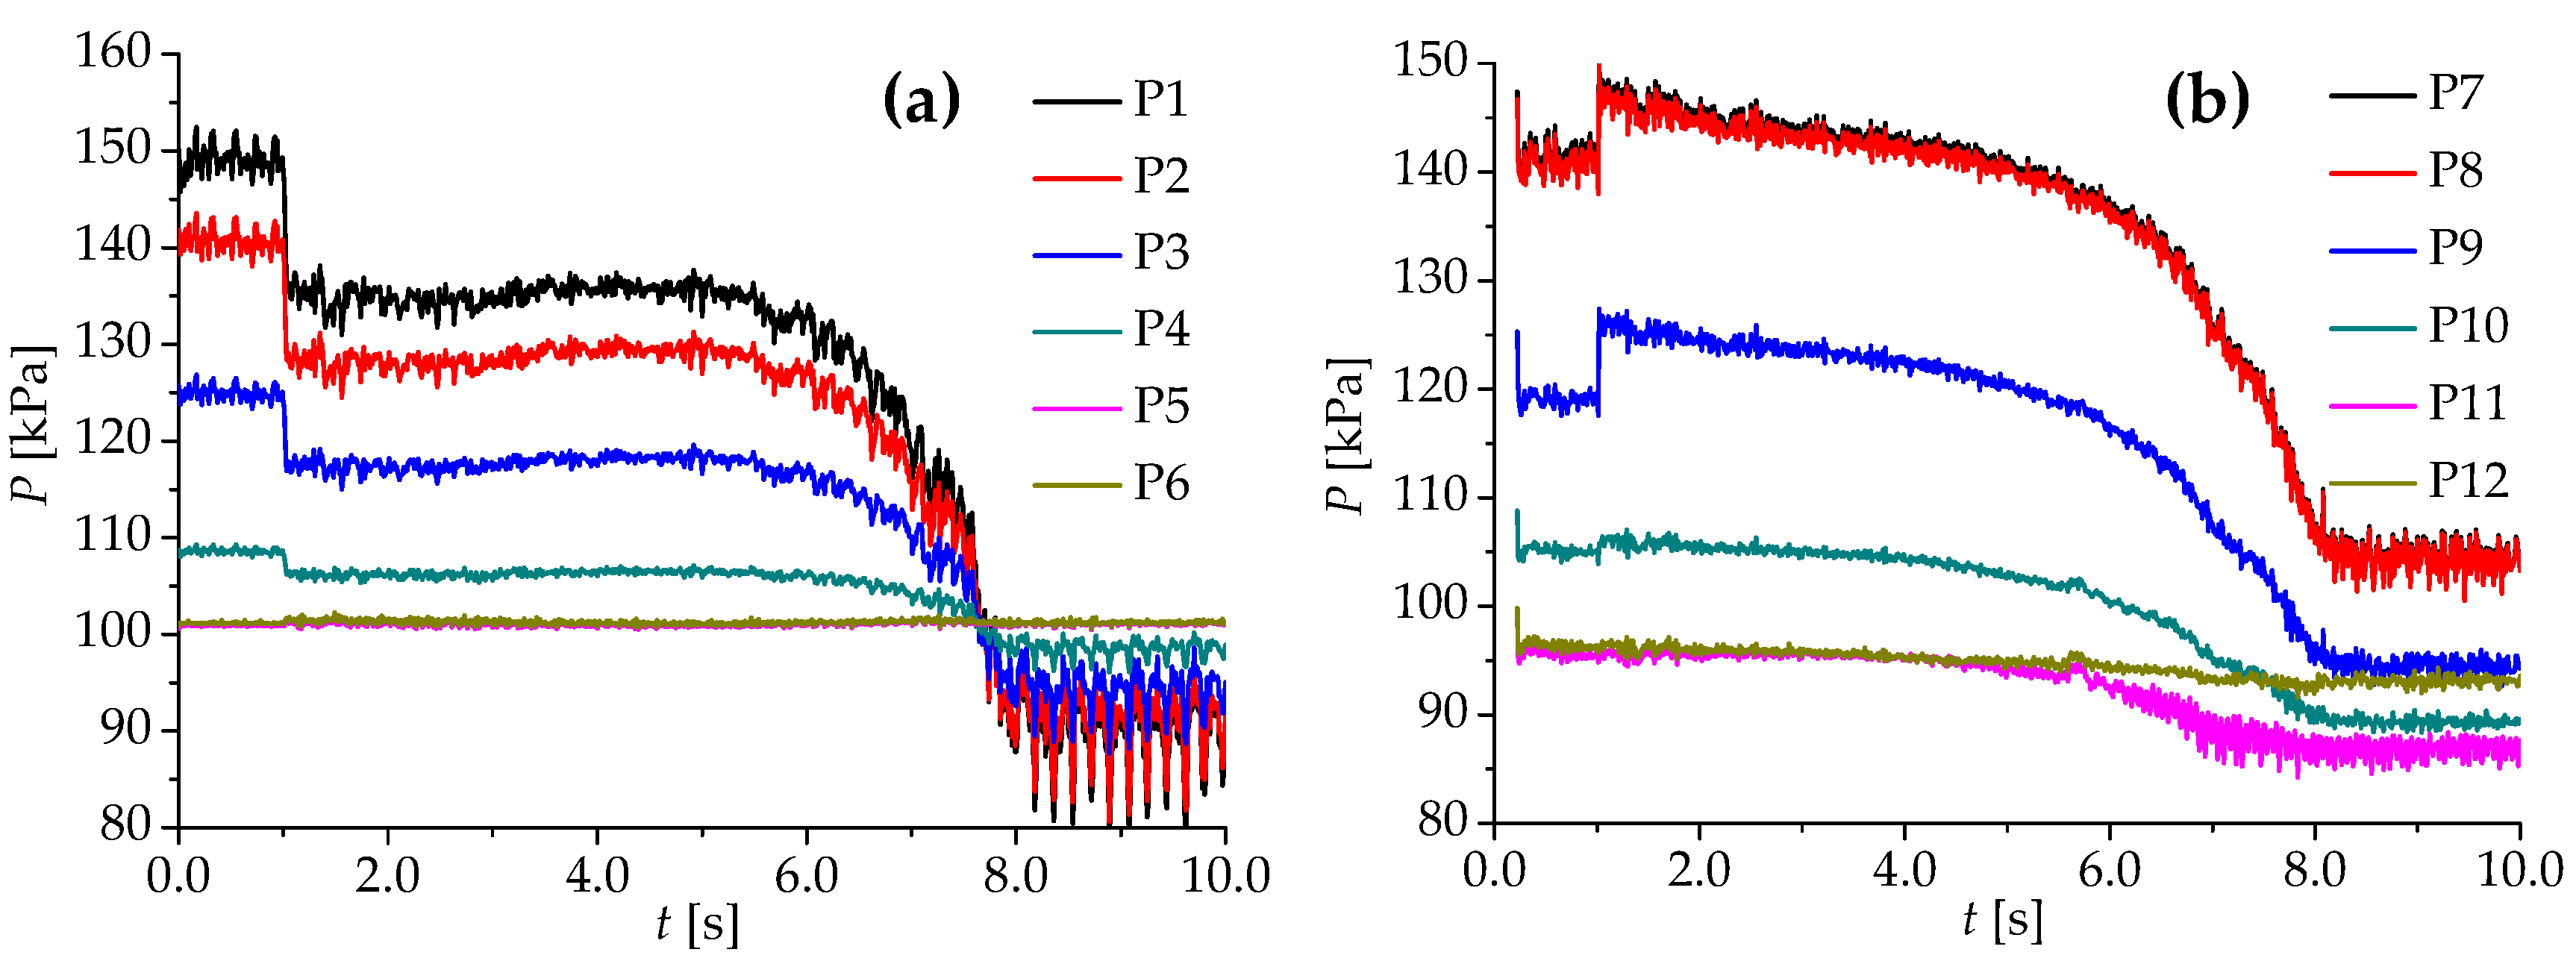
Figure 8a,b presents the values of p that were obtained for P1–P6 in the USRC passage and for P7–P12 in the LSRC passage, respectively. The results given indicate the following. (1) During the period 0–1 s, the pressure at P1 (150 kPa) on the inlet side of the USRC is 50% greater than pressure at P6 (100 kPa) on the outlet side of the USRC. The pressure differences between the neighboring measurement points are about 8 kPa to 10 kPa, indicating that the pressure dropped nearly linearly with respect to the number of labyrinth ring cavities. The amplitudes of pressure fluctuations before the SRs are greater than those after the SRs due to the step-by-step consumption of mechanical energy in the form of vortices that were produced by the gap cavities. (2) When the guide vanes begin to close at t = 1 s, the pressure in the front chamber of the USRC suddenly decreases while the pressure in the front chamber of the LSRC inversely increases due to the water hammer effect, which can potentially lead to the runner-lifting phenomenon. (3) During the period 1–8 s, the guide vanes are closed and the load is reduced during the load rejection process. The overall load rejection process can be divided into the following two segments according to the pressures in the SRs. During the period 1–5.5 s, the pressure in the USRC is stable and the pressure in the LSRC only decreases slightly. During the period 5.5–8 s, the pressures in both the USRC and LSRC decrease significantly because of the throttling effect that occurs when the guide vane opening is less than a specific value. (4) During the period 8–10 s, the opening angle of the guide vanes is maintained at 0.8°, such that the turbine runs under the ML condition, and the amplitudes of pressure fluctuations in the USRC and LSRC are greater than those that were obtained during the period 0–8 s. This may be due to the more intense pressure pulsation induced by the unsteady vortex flow in the passage under small flow conditions.
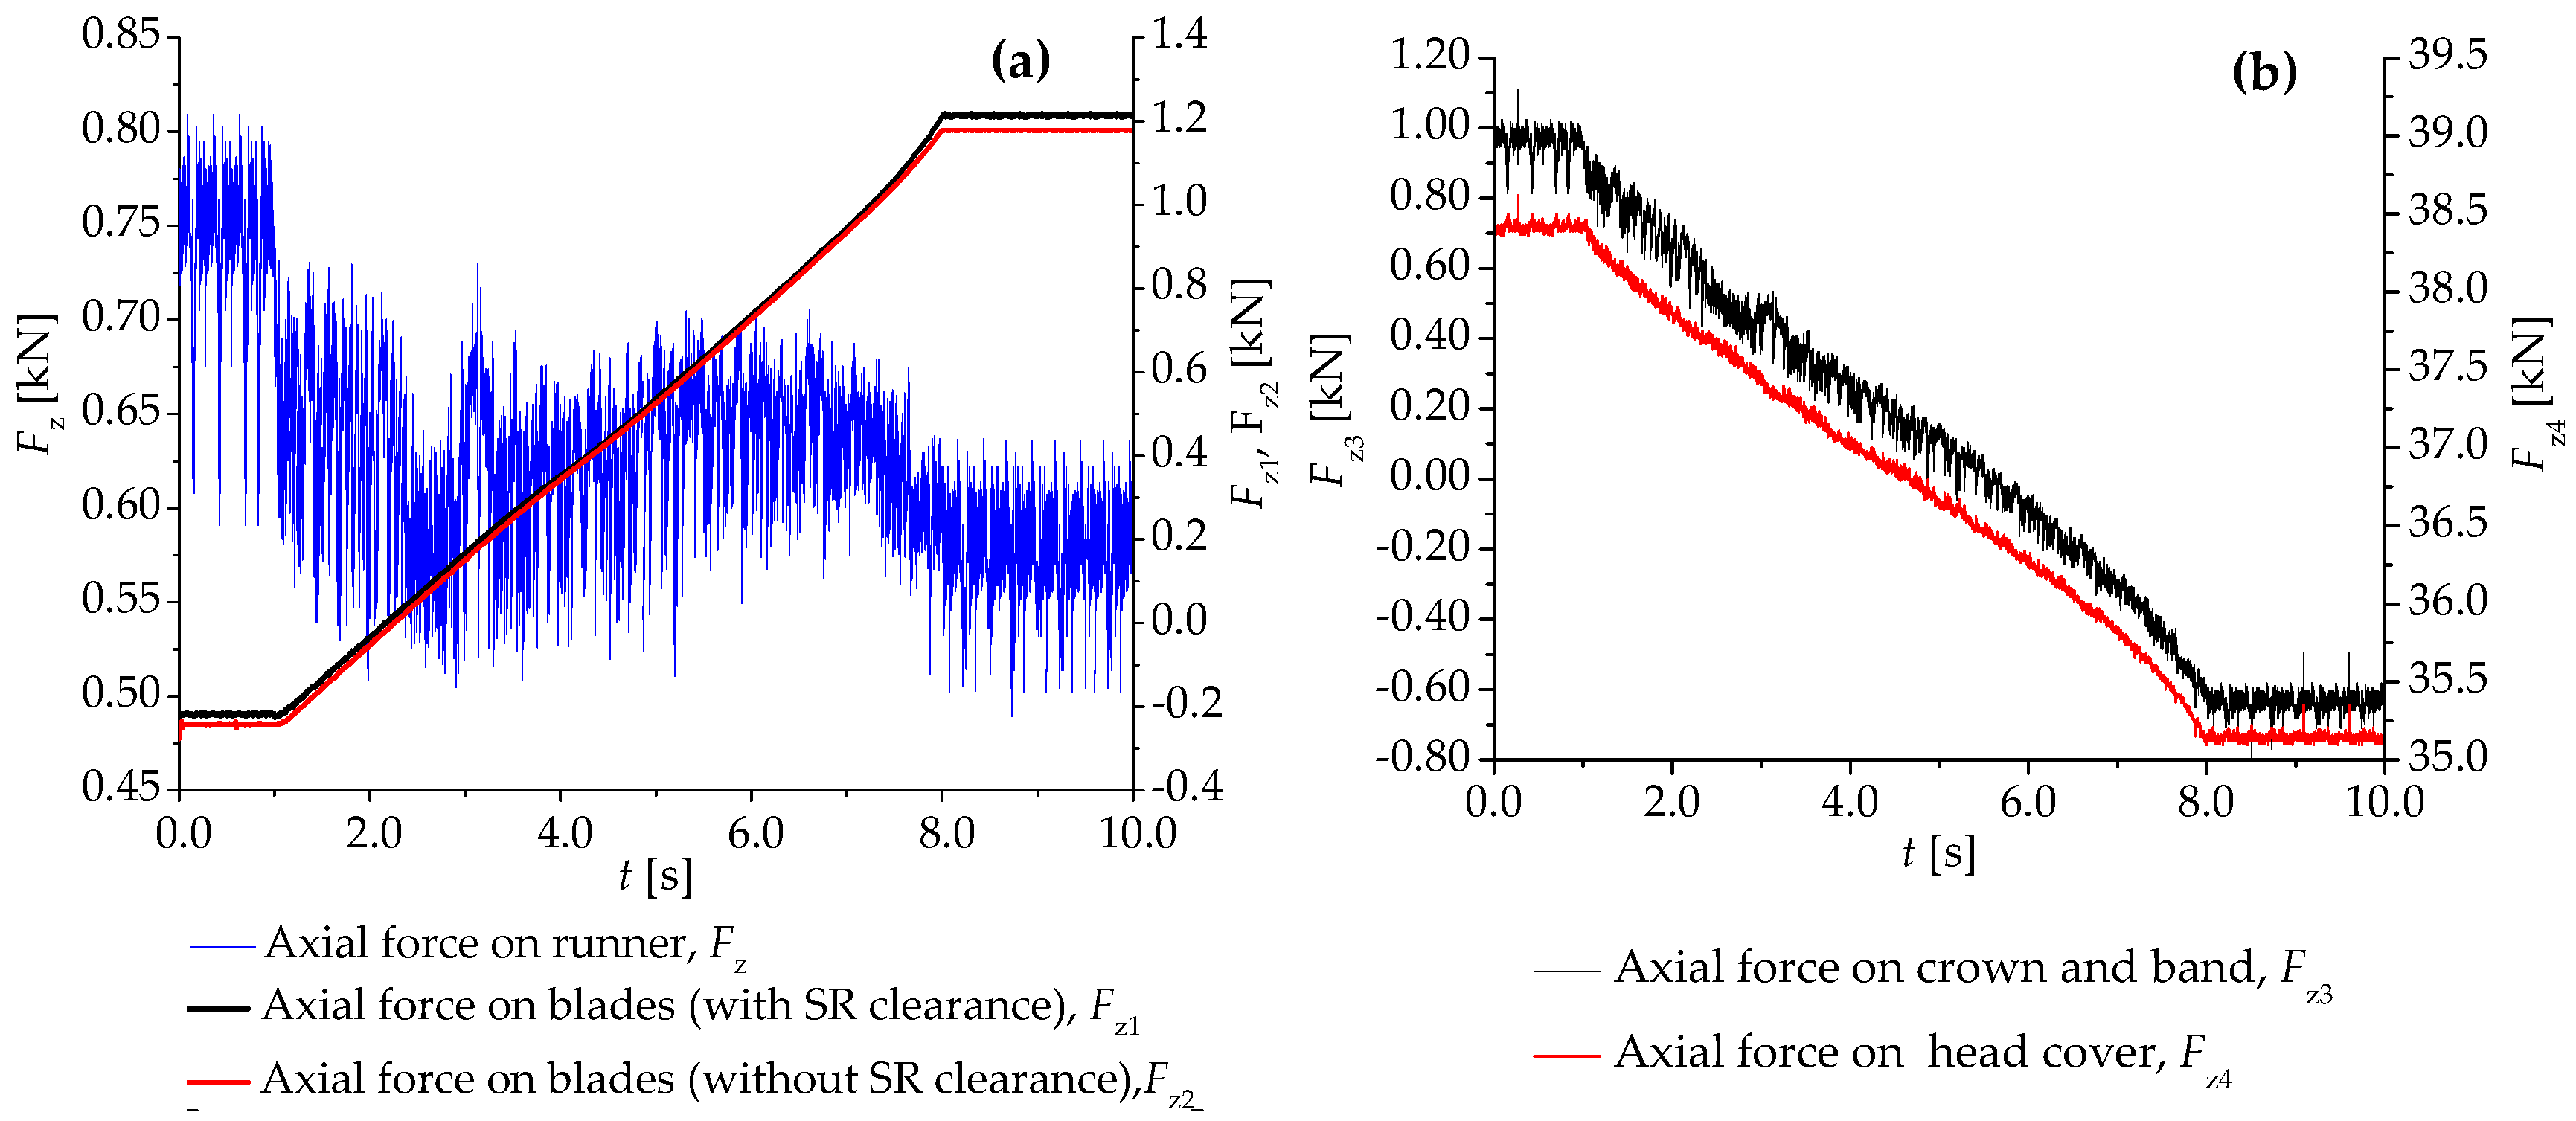
Figure 9a,b presents the numerical results of the axial water thrust acting on the runner and its components, including the blades, the crown and band, and the head cover of the Francis turbine during the load rejection process, respectively. From Figure 9a, the total average axial water thrust on the runner is 800 N under the initial condition (DL condition) and it decreases to 575 N under the termination condition (ML condition). The total axial water thrust on the runner changes a little, because the axial water thrust on the crown and band linearly decreases, while that on the blades linearly increases whether an SR clearance is included, and the inverse variations offset each other. Specifically, the water thrust on the blades varies from −220 N to 1200 N When t = 2.3 s, the direction of the force on the blade surface changes from vertically downward, vertically upward. Subsequently, the axial force on the surface of the crown and band decreases from 1000 N to −600 N, and the force on the head cover changes from 38.4 kN to 35.2 kN. Obviously, the force on the head cover is greater but less fluctuating than that on the crown and band head cover.

4. Conclusions

The present study applied multiscale and dynamic mesh technology and conducted 3D CFD simulations of the transient load rejection process in a Francis turbine with and without SR clearance. The numerical results of the multiscale flow in the Francis turbine were compared with the experimental test results and the results showed that the multiscale flow simulation method can describe the flow characteristic, particularly in the clearance passage. Some conclusions were obtained, as follows.
The predicted performance characteristics of the Francis with and without SR clearance were basically consistent in overall trend, while there are still some obvious differences. The flow rate through both the USRC and LSRC passages were very small, but the pressure fluctuations among them were significantly enhanced under the ML condition. When the guide vanes began to close, the pressure in the crown clearance suddenly decreased, while the pressure in the lower ring clearance increased. In addition, the internal pressure in both clearance passages sharply decreased as the guide vanes closed to their minimum opening angle. The multiscale flow simulation method is able to correctly evaluate the change of the axial water thrust on the runner during the transient process. During the load rejection process, the axial force on the runner was relatively stable, because the axial force on the blades increased, while the sum of the axial forces on the crown and band decreased. An equivalent variation trend was observed for the lower surface of the head cover. In a word, the numerical results considering the SR clearance can provide a basis for people to better understand the flow characteristics in the SR clearance and the force change on the runner during the transient process.
However, the multiscale CFD method is not accurate enough to deal with complex objects, such as hydro-turbines, and the method also does not consider the effect of the displacement variation of the runner due to vibrations on the hydraulic characteristics of the clearance passages. The multiscale numerical model improvement and the fluid-structure interaction calculation of the runner region during the transient process will be a challenge for our next step study.

Author Contributions

D.Z. suggested the methodology and performed critical revision of the article; H.C. performed the numerical simulation, analyzed the numerical results and the paper writing; J.Z. and S.J. designed the numerical methods and performed the calculations; J.G., C.Y. and A.Y. analyzed the numerical results and edited the graphics in the paper.

Funding

This research was funded by the National Natural Science Foundation of China (No. 51839008; No. 51709086; No. 51806058; No. 51339005). The research was also funded by Open Research Fund Program of State Key Laboratory of Water Resource and Hydropower Engineering Science (No. 2015SDG04).

Acknowledgments

The support of Hohai University and Wuhan University, China is also gratefully acknowledged. We also appreciate Norwegian University of Science and Technology for providing the geometric model and test data.

Conflicts of Interest

The authors declare no conflict of interest.

Nomenclature

CBoundary moving velocitym/s
d S Infinitesimal aream2
D1Diameter of the model runner inletm
Dp1Diameter of the prototype runner inletm
FfMixing function-
FzAxial force of the runnerkN
Fz1Axial force of the blades (with SR clearance)kN
Fz2Axial force of the blades (without SR clearance)kN
Fz3Axial force of the crown and bandkN
Fz4Axial force of the head coverkN
g Vector of accelerations acting on the continuumm/s2
HrNet head of the model turbinem
HprNet head of the prototype turbinem
NNumber of mesh cells-
PStatic pressurePa
PkTerms for generating turbulence-
P ω Terms for generating turbulence-
QMass flow rate of the turbinekg/s
QrRated mass flow rate of the model turbinekg/s
QprRated mass flow rate of the prototype turbinekg/s
TTorque of the runnerN·m
tTimes
VVolume of control bodym3
ηMEfficiency of the turbine%
k Kinetic energy of the turbulenceJ
ε Rate of dissipation in k -
ω Turbulence frequencyHz
v Fluid velocity vectorm/s
u Mesh movement velocity vectorm/s
ρDensity of fluidkg/m3
Δ t Time step sizes
Hamilton operator-
2 Laplacian operator-
μFluid viscosityPa·s
μ t Turbulent eddy viscosityPa·s
Ω Boundary of control volume-
σ k Empirical coefficients-
α 2 Empirical coefficients-
β 2 Empirical coefficients-
σ ω 2 Empirical coefficients-

Abbreviations

1DOne dimensional
3DThree dimensional
ALEArbitrary Lagrangian Eulerian
CFDComputational fluid dynamics
DLDesign load
LSRCLower seal ring clearance
MLMinimal load
MOCMethod of characteristics
SIMPLECSemi-Implicit method for pressure linked equations-consistent
SRSeal ring
SST k-ωShear stress transport k-ω
USRCUpper seal ring clearance

References

  1. Paish, O. Micro-hydropower: Status and prospects. Proc. Inst. Mech. Eng. Part. A J. Power Energy 2002, 216, 31–40. [Google Scholar] [CrossRef]
  2. Spanhoff, B. Current status and future prospects of hydropower in Saxony (Germany) compared to trends in Germany, the European Union and the World. Renew. Sustain. Energy Rev. 2014, 30, 518–525. [Google Scholar] [CrossRef]
  3. Okot, D.K. Review of small hydropower technology. Renew. Sustain. Energy Rev. 2013, 26, 515–520. [Google Scholar] [CrossRef]
  4. Perez-Sanchez, M.; Sanchez-Romero, F.J.; Ramos, H.M.; Lopez-Jimenez, P.A. Energy Recovery in Existing Water Networks: Towards Greater Sustainability. Water 2017, 9, 97. [Google Scholar] [CrossRef]
  5. Zhou, D.; Chen, H.; Yang, C. A highly efficient Francis turbine designed for energy recovery in cooling towers. Adv. Mech. Eng. 2015, 7. [Google Scholar] [CrossRef] [Green Version]
  6. Wang, W.; Su, S.; Yan, Y. Study on comb labyrinth seals of Francis turbine at different Reynolds number. Appl. Mech. Mater. 2014, 444–445, 423–426. [Google Scholar] [CrossRef]
  7. Bouderlique, R.; Guibault, F.; Garon, A.; Vu, T. A computational model for hydraulic labyrinth seals. In Proceedings of the ASME 2010 3rd Joint US-European Fluids Engineering Summer Meeting collocated with 8th International Conference on Nanochannels, Microchannels, and Minichannels, Montreal, QC, Canada, 1–5 August 2010; pp. 23–31. [Google Scholar]
  8. Thapa, B.S.; Dahlhaug, G.; Thapa, B. Velocity and pressure measurements in guide vane clearance gap of a low specific speed Francis turbine. In Proceedings of the 28th IAHR Symposium on Hydraulic Machinery and Systems, Grenoble, France, 4–8 July 2016. [Google Scholar]
  9. Trivedi, C.; Cervantes, M.J.; Gandhi, B.K.; Ole Dahlhaug, G. Experimental investigations of transient pressure variations in a high head model Francis turbine during start-up and shutdown. J. Hydrodyn. 2014, 26, 277–290. [Google Scholar] [CrossRef]
  10. Trivedi, C.; Cervantes, M.J.; Gandhi, B.K. Investigation of a High Head Francis Turbine at Runaway Operating Conditions. Energies 2016, 9, 149. [Google Scholar] [CrossRef]
  11. Fu, X.; Li, D.; Wang, H.; Zhang, G.; Li, Z.; Wei, X. Analysis of transient flow in a pump-turbine during the load rejection process. J. Mech. Sci. Technol. 2018, 32, 2069–2078. [Google Scholar] [CrossRef]
  12. You, G. Characteristics of Pump Turbine in Tianhuangping Pumped Storage Power Station. In Proceedings of the Technology Construction and Management in Zhejiang Tianhuangping Pumped Storage Power Station, Hangzhou, China, 1 August 2003. [Google Scholar]
  13. Casartelli, E.; Cimmino, D.; Staubli, T.; Gentner, C. Interaction of Leakage Flow with the Main Runner-outflow in a Francis Turbine. Available online: https://www.researchgate.net/publication/242193073_Interaction_of_leakage_flow_with_the_main_runner-outflow_in_a_Francis_turbine (accessed on 20 January 2019).
  14. Celic, D.; Ondracka, H. The influence of disc friction losses and labyrinth losses on efficiency of high head Francis turbine. In Francis-99 Workshop 1: Steady Operation of Francis Turbines; Cervantes, M.J., Trivedi, C., Dahlhaug, O.G., Nielsen, T., Eds.; IOP Publishing Ltd.: Bristol, UK, 2015. [Google Scholar]
  15. Koirala, R.; Zhu, B.; Neopane, H.P. Effect of Guide Vane Clearance Gap on Francis Turbine Performance. Energies 2016, 9, 275. [Google Scholar] [CrossRef]
  16. Schiffer, J.; Benigni, H.; Jaberg, H. Numerical simulation of the flow in a Francis turbine including the runner seals on crown and band side. In Advancing Policy and Practice; Aqua~ Media International Ltd.: Bordeaux, France, 2015. [Google Scholar]
  17. Goyal, R.; Trivedi, C.; Gandhi, B.K.; Cervantes, M.J.; Dahlhaug, O.G. Transient pressure measurements at part load operating condition of a high head model Francis turbine. Proc. Eng. Sci. 2016, 41, 1311–1320. [Google Scholar]
  18. Hasmatuchi, V.; Farhat, M.; Roth, S.; Botero, F.; Avellan, F. Experimental Evidence of Rotating Stall in a Pump-Turbine at Off-Design Conditions in Generating Mode. J. Fluids Eng.-ASME 2011, 133. [Google Scholar] [CrossRef]
  19. Trivedi, C.; Gandhi, B.K.; Cervantes, M.J.; Dahlhaug, O.G. Experimental investigations of a model Francis turbine during shutdown at synchronous speed. Renew. Energy 2015, 83, 828–836. [Google Scholar] [CrossRef]
  20. Trivedi, C.; Gogstad, P.J.; Dahlhaug, O.G. Investigation of the unsteady pressure pulsations in the prototype Francis turbines during load variation and startup. J. Renew. Sustain. Energy 2017, 9. [Google Scholar] [CrossRef]
  21. Trivedi, C.; Agnalt, E.; Dahlhaug, O.G. Experimental Investigation of a Francis Turbine during Exigent Ramping and Transition into Total Load Rejection. J. Hydraul. Eng.-ASCE 2018, 144. [Google Scholar] [CrossRef]
  22. Ghidaoui, M.S.; Zhao, M.; McInnis, D.A.; Axworthy, D.H. A Review of Water Hammer Theory and Practice. Appl. Mech. Rev. 2005, 58, 49–76. [Google Scholar] [CrossRef]
  23. Afshar, M.H.; Rohani, M.; Taheri, R. Simulation of transient flow in pipeline systems due to load rejection and load acceptance by hydroelectric power plants. Int. J. Mech. Sci. 2010, 52, 103–115. [Google Scholar] [CrossRef]
  24. Wan, W.Y.; Huang, W.R. Investigation on complete characteristics and hydraulic transient of centrifugal pump. J. Mech. Sci. Technol. 2011, 25, 2583–2590. [Google Scholar] [CrossRef]
  25. Zhou, J.; Xu, Y.; Zheng, Y.; Zhang, Y. Optimization of Guide Vane Closing Schemes of Pumped Storage Hydro Unit Using an Enhanced Multi-Objective Gravitational Search Algorithm. Energies 2017, 10, 911. [Google Scholar] [CrossRef]
  26. Zhou, D.; Chen, H.; Zhang, L. Investigation of Pumped Storage Hydropower Power-Off Transient Process Using 3D Numerical Simulation Based on SP-VOF Hybrid Model. Energies 2018, 11, 1020. [Google Scholar] [CrossRef]
  27. Mossinger, P.; Jung, A. Transient two-phase CFD simulation of overload operating conditions and load rejection in a prototype sized Francis turbine. In Proceedings of the 28th IAHR Symposium on Hydraulic Machinery and Systems, Grenoble, France, 4–8 July 2016. [Google Scholar]
  28. Pavesi, G.; Cavazzini, G.; Ardizzon, G. Numerical Simulation of a Pump-Turbine Transient Load Following Process in Pump Mode. J. Fluids Eng.-Trans. ASME 2018, 140. [Google Scholar] [CrossRef]
  29. Li, D.; Wang, H.; Li, Z.; Nielsen, T.K.; Goyal, R.; Wei, X.; Qin, D. Transient characteristics during the closure of guide vanes in a pump turbine in pump mode. Renew. Energy 2018, 118, 973–983. [Google Scholar] [CrossRef]
  30. Fu, X.; Li, D.; Wang, H.; Zhang, G.; Li, Z.; Wei, X.; Qin, D. Energy Analysis in a Pump-Turbine During the Load Rejection Process. J. Fluids Eng.-Trans. ASME 2018, 140. [Google Scholar] [CrossRef]
  31. Fu, X.; Li, D.; Wang, H.; Zhang, G.; Li, Z.; Wei, X. Dynamic instability of a pump-turbine in load rejection transient process. Sci. China Technolo. Sci. 2018, 61, 1765–1775. [Google Scholar] [CrossRef]
  32. Fu, X.; Li, D.Y.; Wang, H.; Zhang, G.; Li, Z.; Wei, X. Influence of the clearance flow on the load rejection process in a pump-turbine. Renew. Energy 2018, 127, 310–321. [Google Scholar] [CrossRef]
  33. Dörfler, P.; Sick, M.; Coutu, A. Flow-induced Pulsation and Vibration in Hydroelectric Machinery, 1st ed.; Springer: London, UK, 2013. [Google Scholar]
  34. Test Case. Available online: https://www.ltu.se/research/subjects/Stromningslara/Konferenser/Francis-99 (accessed on 20 November 2013).
  35. Kan, K.; Zheng, Y.; Chen, Y.; Xie, Z.; Yang, G.; Yang, C. Numerical study on the internal flow characteristics of an axial-flow pump under stall conditions. J. Mech. Sci. Technol. 2018, 32, 4683–4695. [Google Scholar] [CrossRef]
  36. Menter, F.R. Two-equation eddy-viscosity turbulence models for engineering applications. AIAA J. 1994, 32, 1598–1605. [Google Scholar] [CrossRef] [Green Version]
  37. Menter, F.R.; Kuntz, M.; Langtry, R. Ten years of industrial experience with the SST turbulence model. Turbul. Heat Mass Transf. 2003, 4, 625–632. [Google Scholar]
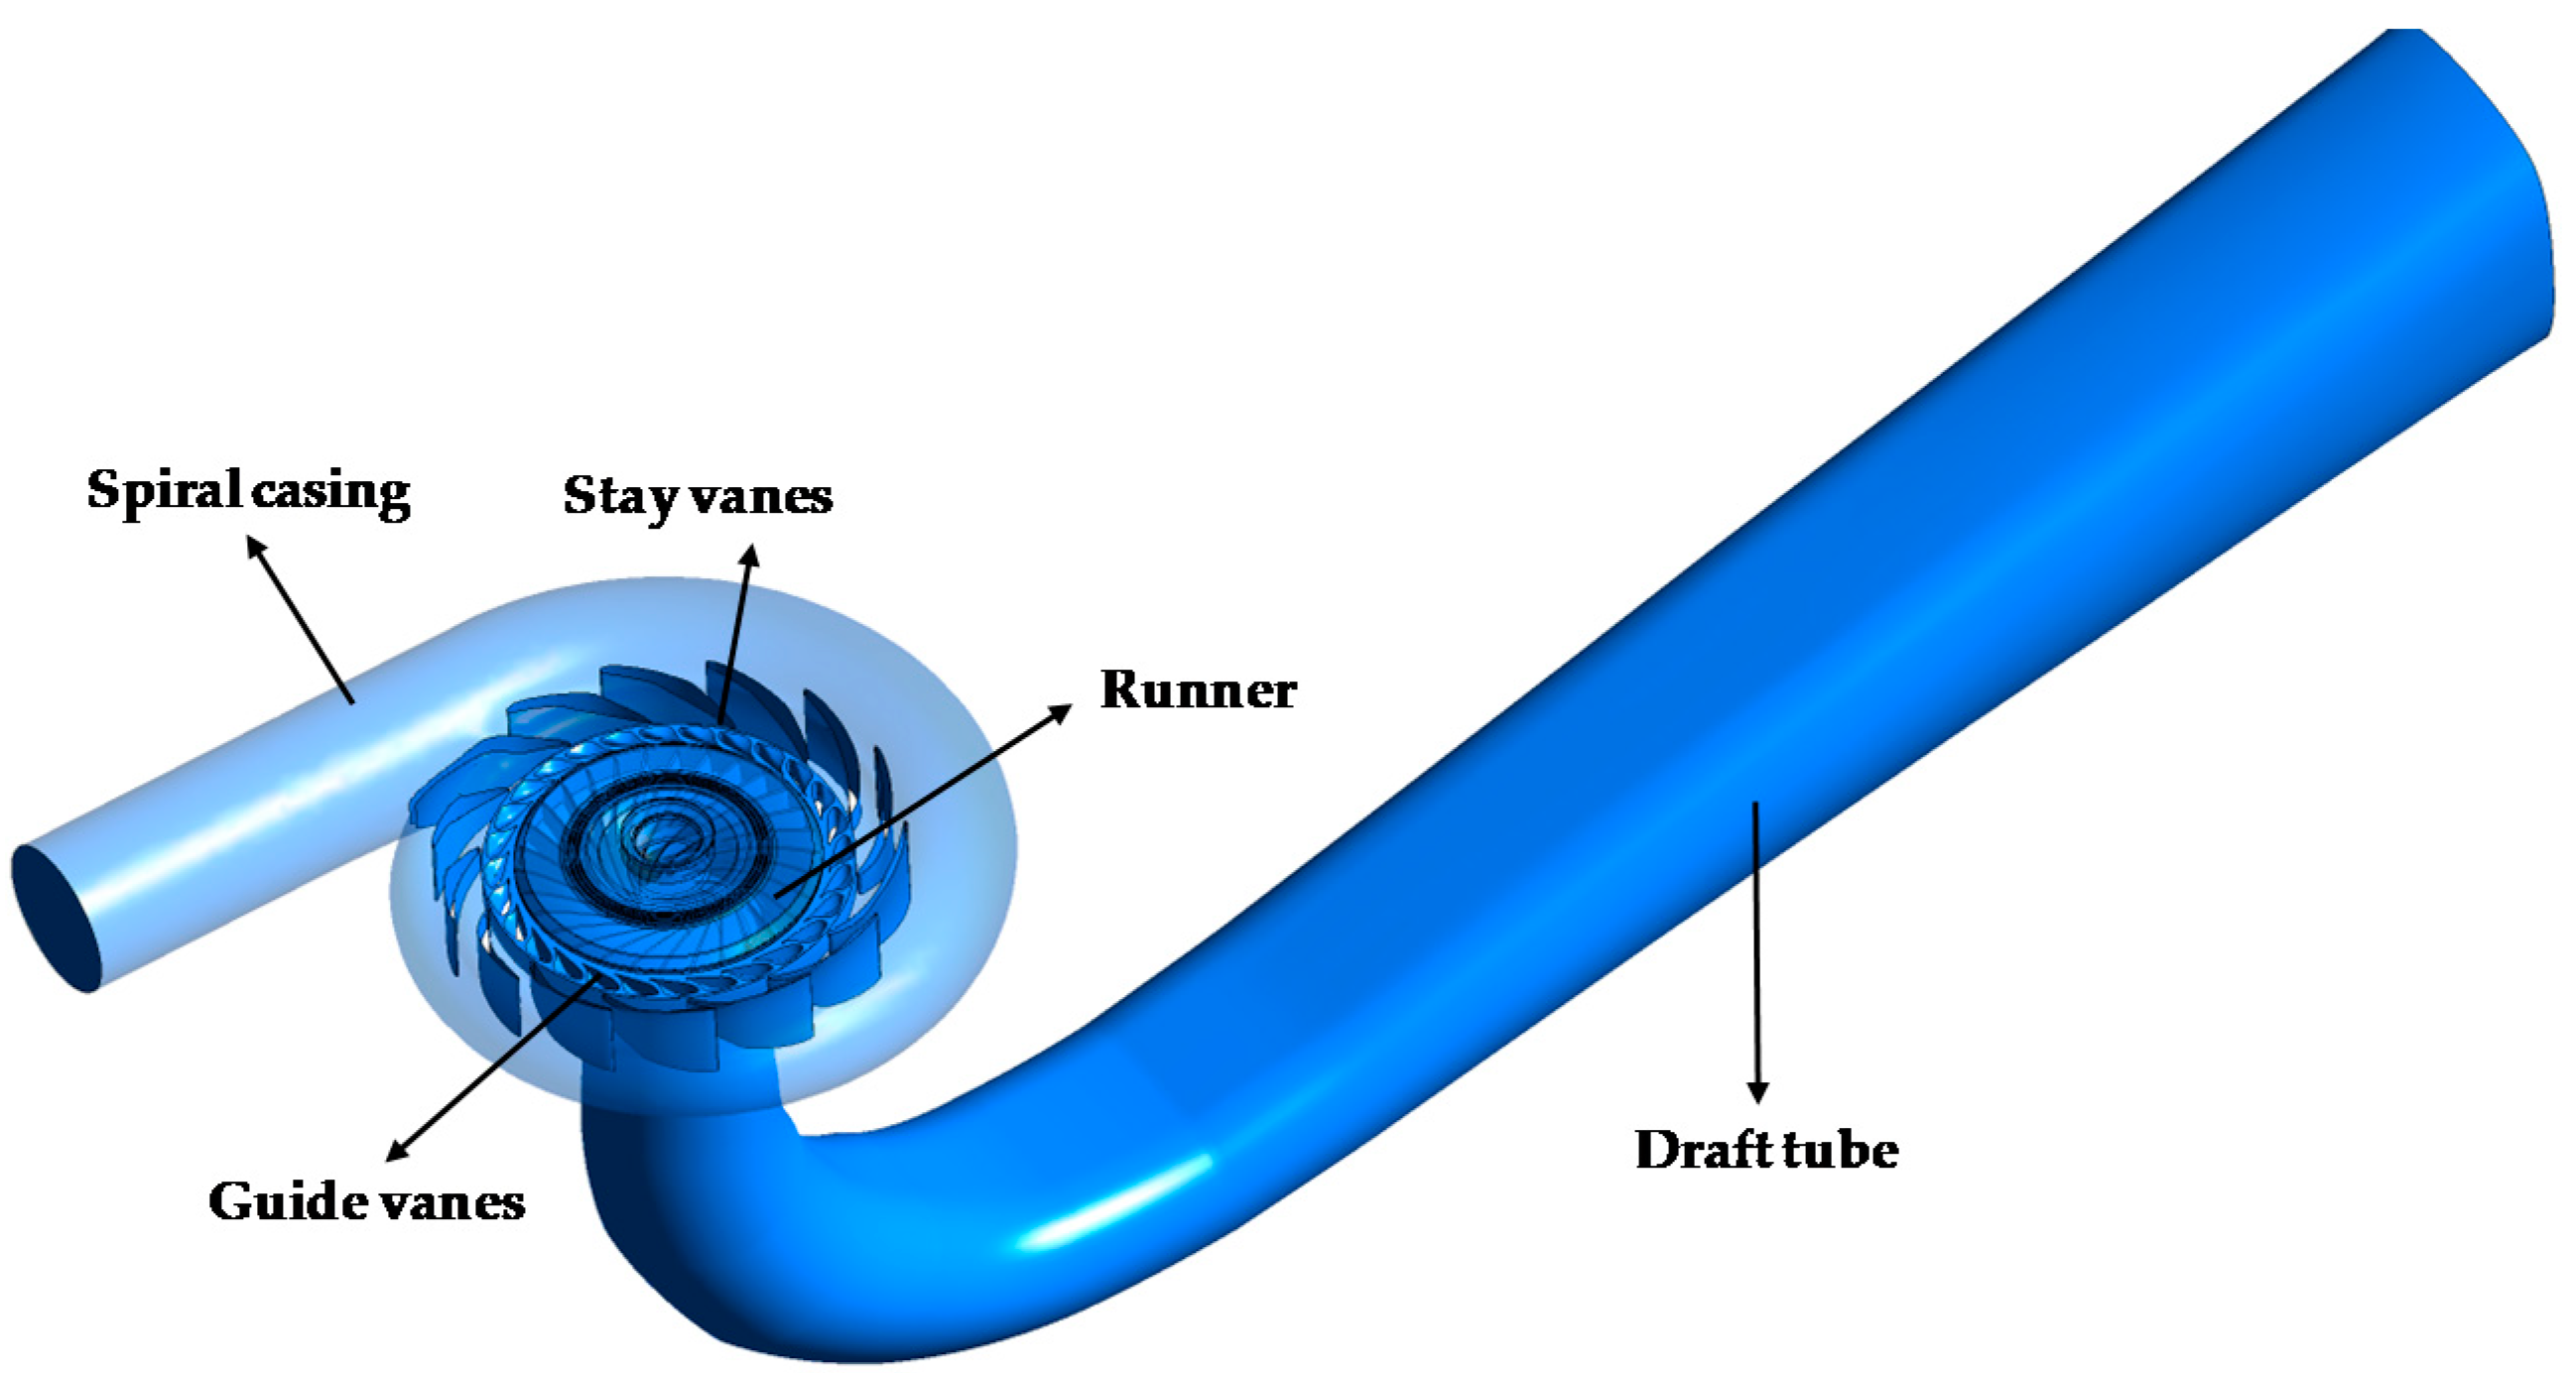
Figure 1. The computational domain of the whole Francis turbine passage.
Energies 12 00716 g001
Figure 2. Partially enlarged passage and pressure measurement point locations at the passage. (a) Partially enlarged longitudinal section view of the microscale clearance passage, (b) Pressure measurement points P1–P6 at the upper seal ring clearance (USRC); and, (c) Pressure measurement points P7–P12 at the lower seal ring clearance (LSRC).
Energies 12 00716 g002
Figure 3. Meshing scheme of the multiscale passage computational domain.
Energies 12 00716 g003
Figure 4. Mesh motion of guide vanes with respect to time t from an opening angle of 9.84° to 0.8° over an 8 s period. (a) t = 0 s; (b) t = 2 s; (c) t = 6s; and, (d) t = 9 s.
Energies 12 00716 g004
Figure 5. Numerical simulation and experimental model test results for the Francis turbine with and without a seal ring (SR) clearance under a load rejection condition. (a) The mass flow rate Q across the spiral casing inlet. (b) The torque T of the runner.
Energies 12 00716 g005
Figure 6. Numerical simulation and experimental model test results for the Francis turbine with and without an SR clearance under a load rejection condition. (a) The pressures p in the vaneless zone; and, (b) The pressures p in the draft tube.
Energies 12 00716 g006
Figure 7. Numerical simulation of the mass flow rate Q across the USRC and LSRC for the Francis turbine under a load rejection condition.
Energies 12 00716 g007
Figure 8. Numerical simulation of the pressures P for the Francis turbine under a load rejection condition. (a) The pressure measurement points at the USRC; and, (b) The pressure measurement points at the LSRC.
Energies 12 00716 g008
Figure 9. Numerical simulation of the axial forces on the runner, blades, and head cover of the Francis turbine under a load rejection condition. (a) Total axial water thrust on the blades and runner; and, (b) Axial forces on the crown and band/head cover.
Energies 12 00716 g009
Table 1. Model testing parameters applied during steady-state measurements conducted under the designed load (DL) condition and the minimal load (ML) condition.
ConditionsDLML
Parameters
Guide vane angle (°)9.840.8
Net head (m)11.9412.14
Discharge (kg/s)20022
Torque to the generator (N·m)616.1311.16
Runner angular speed (rpm)332.59332.8
Hydraulic efficiency (%)92.3920.94
Table 2. Dependency analysis for the number of mesh cells.
Scheme Number1234Test *
Number of mesh cells N (×104)353487660887-
Hydraulic efficiency ηM (%)94.392.691.891.992.4
* Values obtained from the Water Power Laboratory, NTNU [34].
Table 3. Dependency analysis for the time step.
Time Step Δt (s)0.010.0050.0020.001Test *
Mass flow rate Q (kg/s)188.3190.1192.7193.2200.0
Runner torque T (N·m)488.1523.2585.8590.1616.1
* Values obtained from the Water Power Laboratory, NTNU [34].