Article

Improving Energy Efficiency in a Synchronized Road-Transportation System by Using a TFMC (Transportation Fleet-Management Control) in Finland

1
Faculty of Science and Forestry, University of Eastern Finland, P.O. Box 111, FI-80101 Joensuu, Finland
2
Stora Enso Wood Supply Finland, P.O. Box 309, FI-00101 Helsinki, Finland
*
Author to whom correspondence should be addressed.
Energies 2019, 12(4), 670; https://doi.org/10.3390/en12040670
Submission received: 24 December 2018 / Revised: 14 February 2019 / Accepted: 15 February 2019 / Published: 19 February 2019

Abstract

:
Previous studies have suggested that the use of high-capacity transportation (HCT) can lead to low-carbon road-transportation in the forest industry. This study shows the impacts (in terms of energy efficiency) of a three-year adaptation process of transportation (2014–2016) towards HCT that took place in a synchronized transportation system (STS). The use of three transportation fleet-management control (TFMC) methods was analyzed in various road infrastructures. Energy-efficiency calculations were undertaken based on the HCT vehicles’ mass limits (64, 68 and 76 t). The use of 76 t vehicles increased energy efficiency by 13.4% and reduced CO2 emissions by 3.5% (to 49.6 g/tkm). In addition, the results show that the energy efficiency of the STS could be improved by a further 3.1%. In this respect, the proposed TFMC was used to adjust the STS towards vehicle-group transportation while meeting the road-class constraints of local wood supply chains. Forest-industry companies in Finland and abroad can use the tailored TFMC to optimize the STS in the near future and to achieve the energy-efficient STS and the regulations of the European Commission in wood-procurement logistics.

1. Introduction

The European Commission seeks efficient solutions to help Europe consume less energy. The ultimate goal is for the European Commission to have a low-carbon, circular economy [1]. To reach this goal, the Commission seeks to cut the exhaust emissions to 80% below its 1990 level by 2050. According to the road map for this goal, the major steps towards achieving this target are to reach a 40% cut by 2030 and a 60% cut by 2040 [2]. In addition, the road map emphasizes that the change from fossil fuels to a low-carbon economy is feasible if all industrial sectors contribute towards reaching the targets. This means that the transportation sector of the European forest-product industry needs to implement energy-efficiency measures to ensure that these climate goals will be attained. Furthermore, the transportation sector’s adaptation process is important towards environmental sustainability because the European Commission has anticipated that, without regulations, the quantity of road transportation (ton-kilometer, tkm) will increase to 80% above its 2005 level by 2030 [3,4].
As a response to the road map, the Finnish forest industry has advanced environmental sustainability through the development of fossil-fuel monitoring of the production process and the biofuel supply cycles in the circular economy [5,6]. In this respect, road-freight transportation is already a main source of human-caused impact on Finnish industrial ecosystems [6,7,8]. Several researchers have reported that there are energy-related environmental problems to manage, both in the European Union and in Scandinavia, as road transportation contributes to more than 20% impact in the forest industry [9,10], and trucks cause almost one third of total exhaust emissions from transportation [11,12]. It is evident that road-freight transportation is a globally significant carbon source [13,14], but, on the other hand, this type of transportation includes the necessary service from forests to mills in the Finnish forest industry [7,8]. There is pressure to increase timber transportation so as to satisfy the increasing demand for wood in the growing bio-economy in Finland. Thus, there is also an urgent need to adapt the transportation fleet to meet environmental requirements, such as by increasing energy efficiency using effective fleet-management methods.
Increased use of larger and heavier vehicles for road-freight transportation may increase the risk of certain environmental disturbances, while timber truck’s engines comply with the legal energy-efficiency requirements. In Finland, the Euro VI is now being used for heavy trucks [15]. However, environmental emissions of timber transportation are often calculated for diesel fuel consumption using an old environmental standard of air pollution [16]. Furthermore, the European Commission introduced the standard for heavy-duty diesel engines in 2013, which sets the maximum emission values of environmental contaminants for CO, HC, NOx and PM, respectively, 1.5, 0.13, 0.4 and 0.01 g/kWh [17]. This standard can be used to calculate a maximum level of air emissions in terms of transportation distance and timber quantity (g/tkm) transported. On the other hand, emission calculation from transport is practical by using new emission factors per liter fuel consumed, respectively, 0.13, 0.06, 0.09 and 0.01 g/L [18]. The values are primarily used for Volvo trucks, but the factors are applicable for energy efficiency calculations of trucks in the fleet management of this study. It is worth remembering that the calculation of CO2 emissions is a straightforward task because diesel has a fixed CO2 content of 2.66 kg/L when used in fuel consumption [10,12,19]. Therefore, energy efficiency values can be calculated accurately to allow for comparison of the fleet-management methods in various logistics transport situations in Finland.
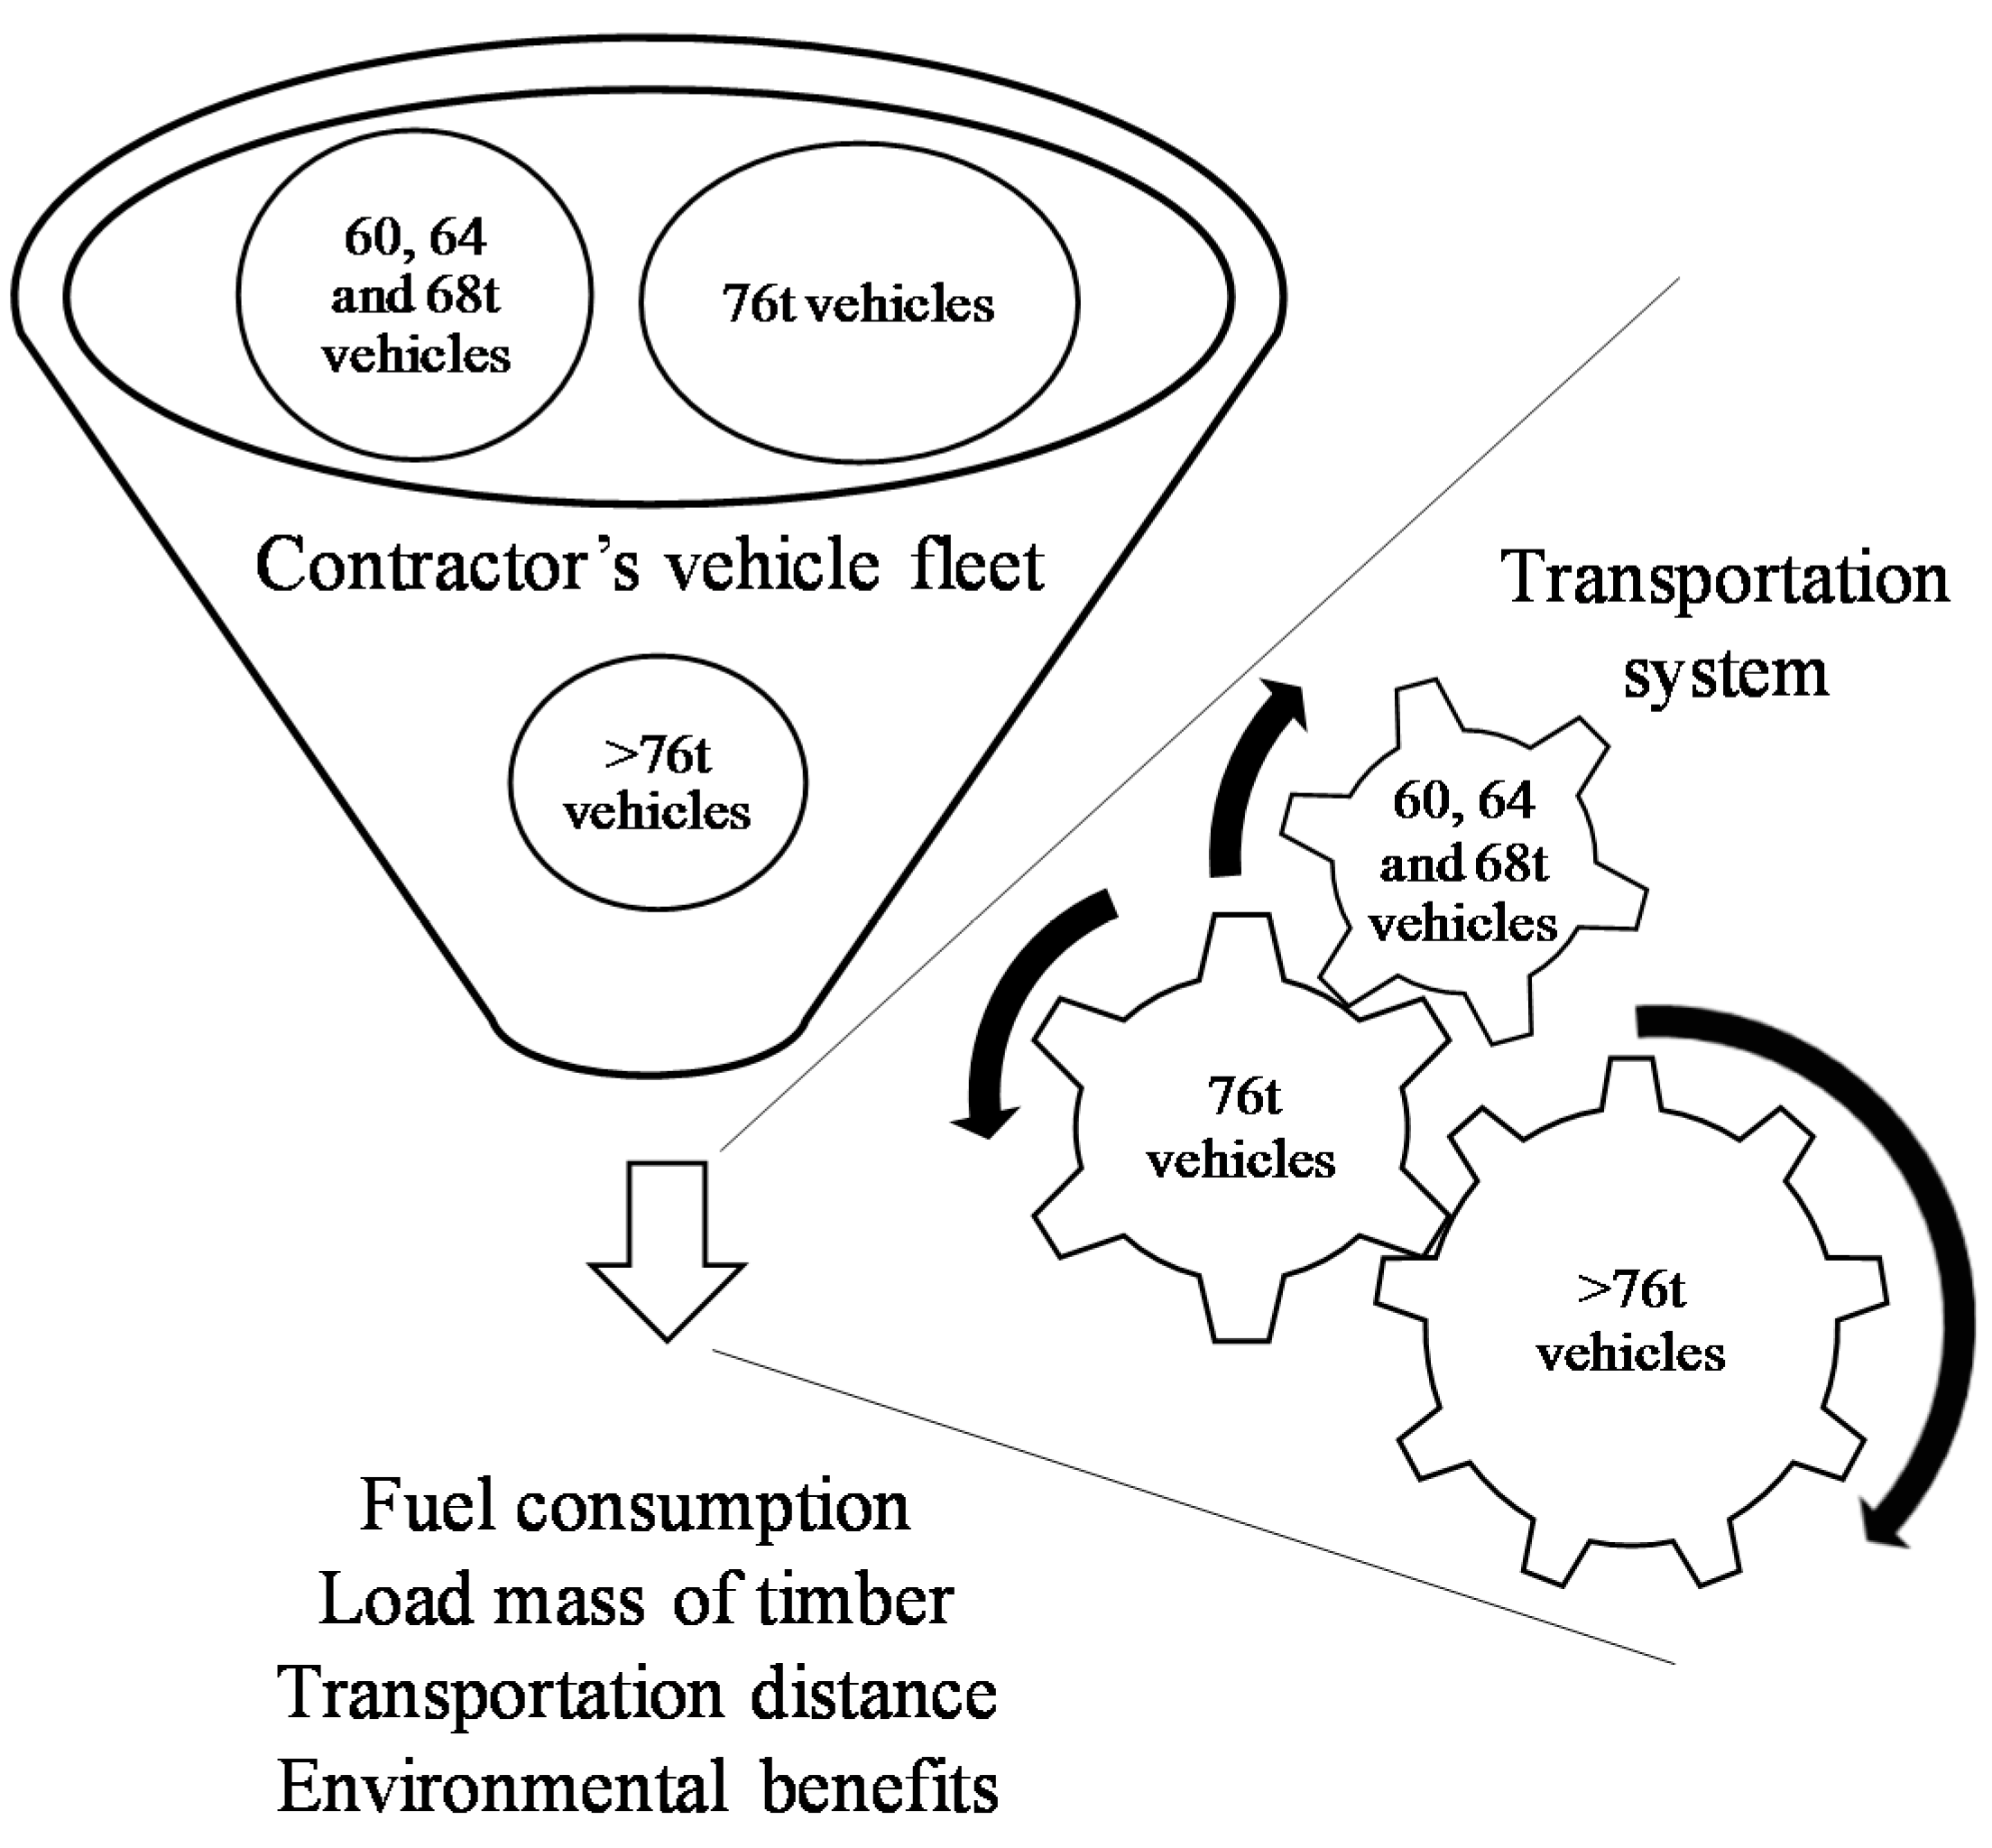
In 2016, the total wood volumes supplied by the wood-procurement organizations from forests to internal and external mill customers were about 70 million·m3 (solid over the bark) in Finland. As an example of three largest organizations of Finland, Stora Enso is a global forest-product company that is committed to continuous improvement in the issue of energy efficiency [20,21,22]. Its wood procurement region includes municipalities in the whole country, except south-western Finland (Figure 1). Stora Enso’s Wood Supply Finland (SEWSF) manages timber-transportation services (23 million·m3 roundwood, wood chips and bark) in its wood procurement region using a synchronized transportation system (STS) (Figure 2), but the company does not have its own timber-transportation fleet. Currently, 34 small and medium-sized timber-trucking entrepreneurs (with more than 200 trucks) transport roundwood from forests to mills for SEWSF [23,24], and the STS is used to manage several issues of energy efficiency, e.g., environmental emissions of HCT (high-capacity transportation). The STS includes tools that can be used for calculating energy efficiency in separate phases of the adaptation process of the transportation fleet.
Since 2000, the forest industry has improved the cost efficiency of road transportation by optimizing routes, minimizing haulage costs and maximizing the vehicles’ net loads [25,26]. Currently, increased domestic supply to pulp mills and climate change are affecting haulage by causing regional local disturbances (e.g., due to need for better road infrastructure) in the fleet management of timber transportation [27,28,29]. In this respect, scholars have recommended that entrepreneurs adjust their fleets to increase the vehicles’ maximum mass towards high HCT [8]. In practice, the adaptation of transportation fleets to changed conditions reduces the amount of vehicle traffic intensity on the road infrastructure that is required to deliver the timber amount demanded by the mills. It is also argued that HCT can also increase energy efficiency of the STS. Although total fuel consumption has been reduced to some extent, HCT can provide further energy-efficiency benefits on a good road infrastructure even without continual optimization of wood flow and transportation operations [10,11].
In the forest industry in Europe, timber trucks’ fuel consumption when procuring wood has been the subject of numerous studies in the 21st century [30,31]. However, these trucks’ energy efficiency during wood procurement has only seldom been a research topic [16,32]. By contrast, in the pulp and paper industry, there have been plenty of such efficiency studies for a long time, among others the international large scale-modelling [33], the large scale models in Spain [34], Sweden [35,36], in Germany [37], in Brazil [38], in USA [39], and in China [40]. Furthermore, the small-scale energy-efficiency models are used in Scandinavia [41,42,43]. These studies have developed energy-efficiency calculations methods, which can be developed for energy-efficiency assessments of timber transportation in wood procurement organizations.
On the other hand, environmental-emission assessments have been used by life-cycle models to examine several other efficiency-related decision-making issues in the forest industry [44,45,46,47]. The energy efficiency calculations of these studies are focused on balancing CO2-emissions for reducing climate change. There have also been critical discussions about efficiency assessment methods [48]. Palander [10] stated that “the commonly used impact assessment metric, the emission efficiency, and how it is applied in environmental assessments, has been criticized for insufficiently accounting for locally located carbon sequestration and timing of emissions [49,50]. They suggest that road transportation of wood procurement contribute to environmental problems at different geographical scales, ranging from local emissions to global climate change [13]. Therefore, this study uses the assumption that increasing energy efficiency may require tailored transportation fleet-management control (TFMC) to ensure the effective scheduling of transportation operations at the local level of a wood procurement organization.
Since 2014, road-transportation vehicle fleets have moved towards greater use of HCT, as the Finnish forest industry has come to prefer heavier timber loads [6]. To meet the needs of that industry and follow the environmental regulations of the European Union, the Ministry of Transport and Communications of Finland (2013) increased the maximum mass and transport capacity of HCT for those with nine axles e.g., four axles in the truck and five axles in the trailer (Table 1) [51]. Recently (22 January 2019), HCT was allowed to increase the maximum length (34.5 m) in Finland, but that is outside the scope of this study.
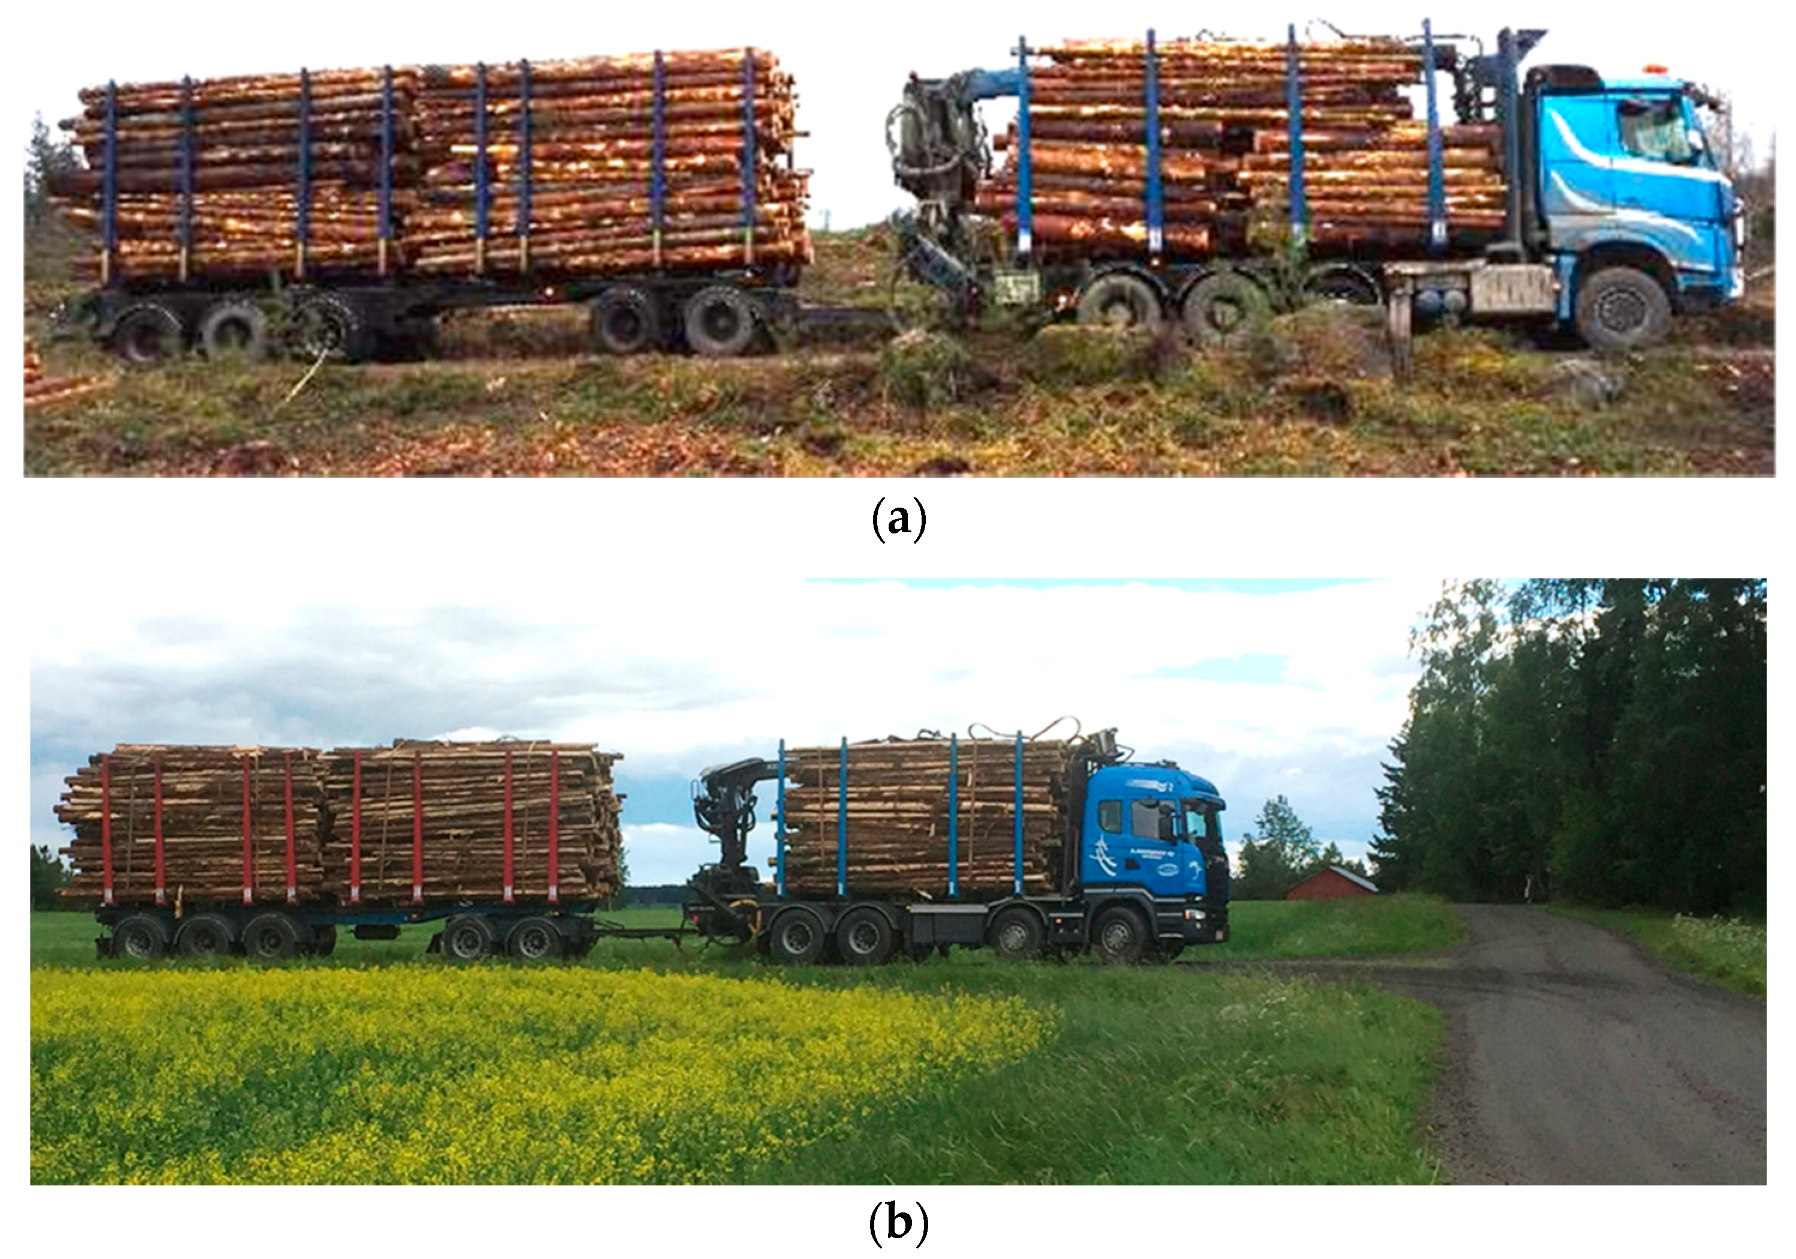
The increase in the maximum mass has provided lower haulage costs and meant more acceptable global logistics and fuel economy [52,53]. The change to larger vehicle combinations has also contributed to the adoption of energy efficient vehicle technologies [11]. The HCT has another advantage: the smaller fleet-management risk of disturbances in old roads’ infrastructure, as HCT vehicles have stronger road safety than smaller ones because of their better weight ratio between truck and trailer [52,54]. This is partly due to the increased number of axles in the vehicles (Table 1 and Figure 3). However, since 2014, HCT fleets have been managed using conventional TFMC on various transportation routes. Therefore, novel information and understanding regarding HCT is needed to determine the most efficient TFMC for main roads’ transportation infrastructures. To do so, relative energy-efficiency calculations are needed, and research should be focused on local-road categories (forest roads and roads with speed <60 km/h). The fuel consumption of trucks depends on the road conditions [4,13,55]. It is clear that a vehicle’s technical efficiency and the distance that it spends running empty also affect its fuel consumption and environmental benefits [11,12]. Furthermore, in the STS (Figure 2), the applied TFMC and information of load constraints may impact on HCT’s benefits. On the other hand, the degree of empty running may be dependent on the transportation modes of synchromodal supply systems [56], but that is outside the scope of this study.
As mentioned previously, the adoption of more efficient vehicle technologies is part of the adaptation process of the transportation fleet. In the early phase of this process (2013–2014), the efficiencies of STSs depended on transportation entrepreneurs’ desire to buy and use larger and heavier trucks and trailers [15]. In later phase, the increase in energy efficiency depended largely on the road-transportation infrastructure. In practice, loads carried on the HCT are limited by local logistics and physical road constraints. Therefore, increased energy efficiency is dependent on information about the fleet-management options to avoid arbitrary scaling down of the road-dependent constraints on vehicle loading. In this respect, this study compares fleet-management methods to reveal how energy efficiency can be increased after the three-year (2014–2016) process in which SEWSF’s fleet adapted to the 76 t mass limits. Furthermore, making a deeper collaboration and forming future plans with the entrepreneurs who are contracted to wood procurement organization require a profound understanding of the situation regarding energy efficiency in important road-transportation conditions. Currently, this kind of information on TFMC is not available. Overall, this study is focused on the energy efficiency of STS to intensify TFMC of the Finnish forest industry. This study aims to
  • investigate the extent to which HCT configurations are insufficiently loaded during timber transportation;
  • determine the impacts that HCT have on the energy efficiency of the STS in respect to the EURO-VI diesel engines; and
  • recommend most effective options of TFMC to enable HCT to carry their maximum weights.
In this introduction section state of the art analysis is provided regarding timber trucks’ emissions, energy efficiency, fuel consumption and fleet management. Next, the content of the article is structured into two main sections:
  • data collection and method description regarding the energy efficiency of road-freight transportation in the STS;
  • results and discussion based on the potentiality of TFMC to increase the energy efficiency.

2. Material and Methods

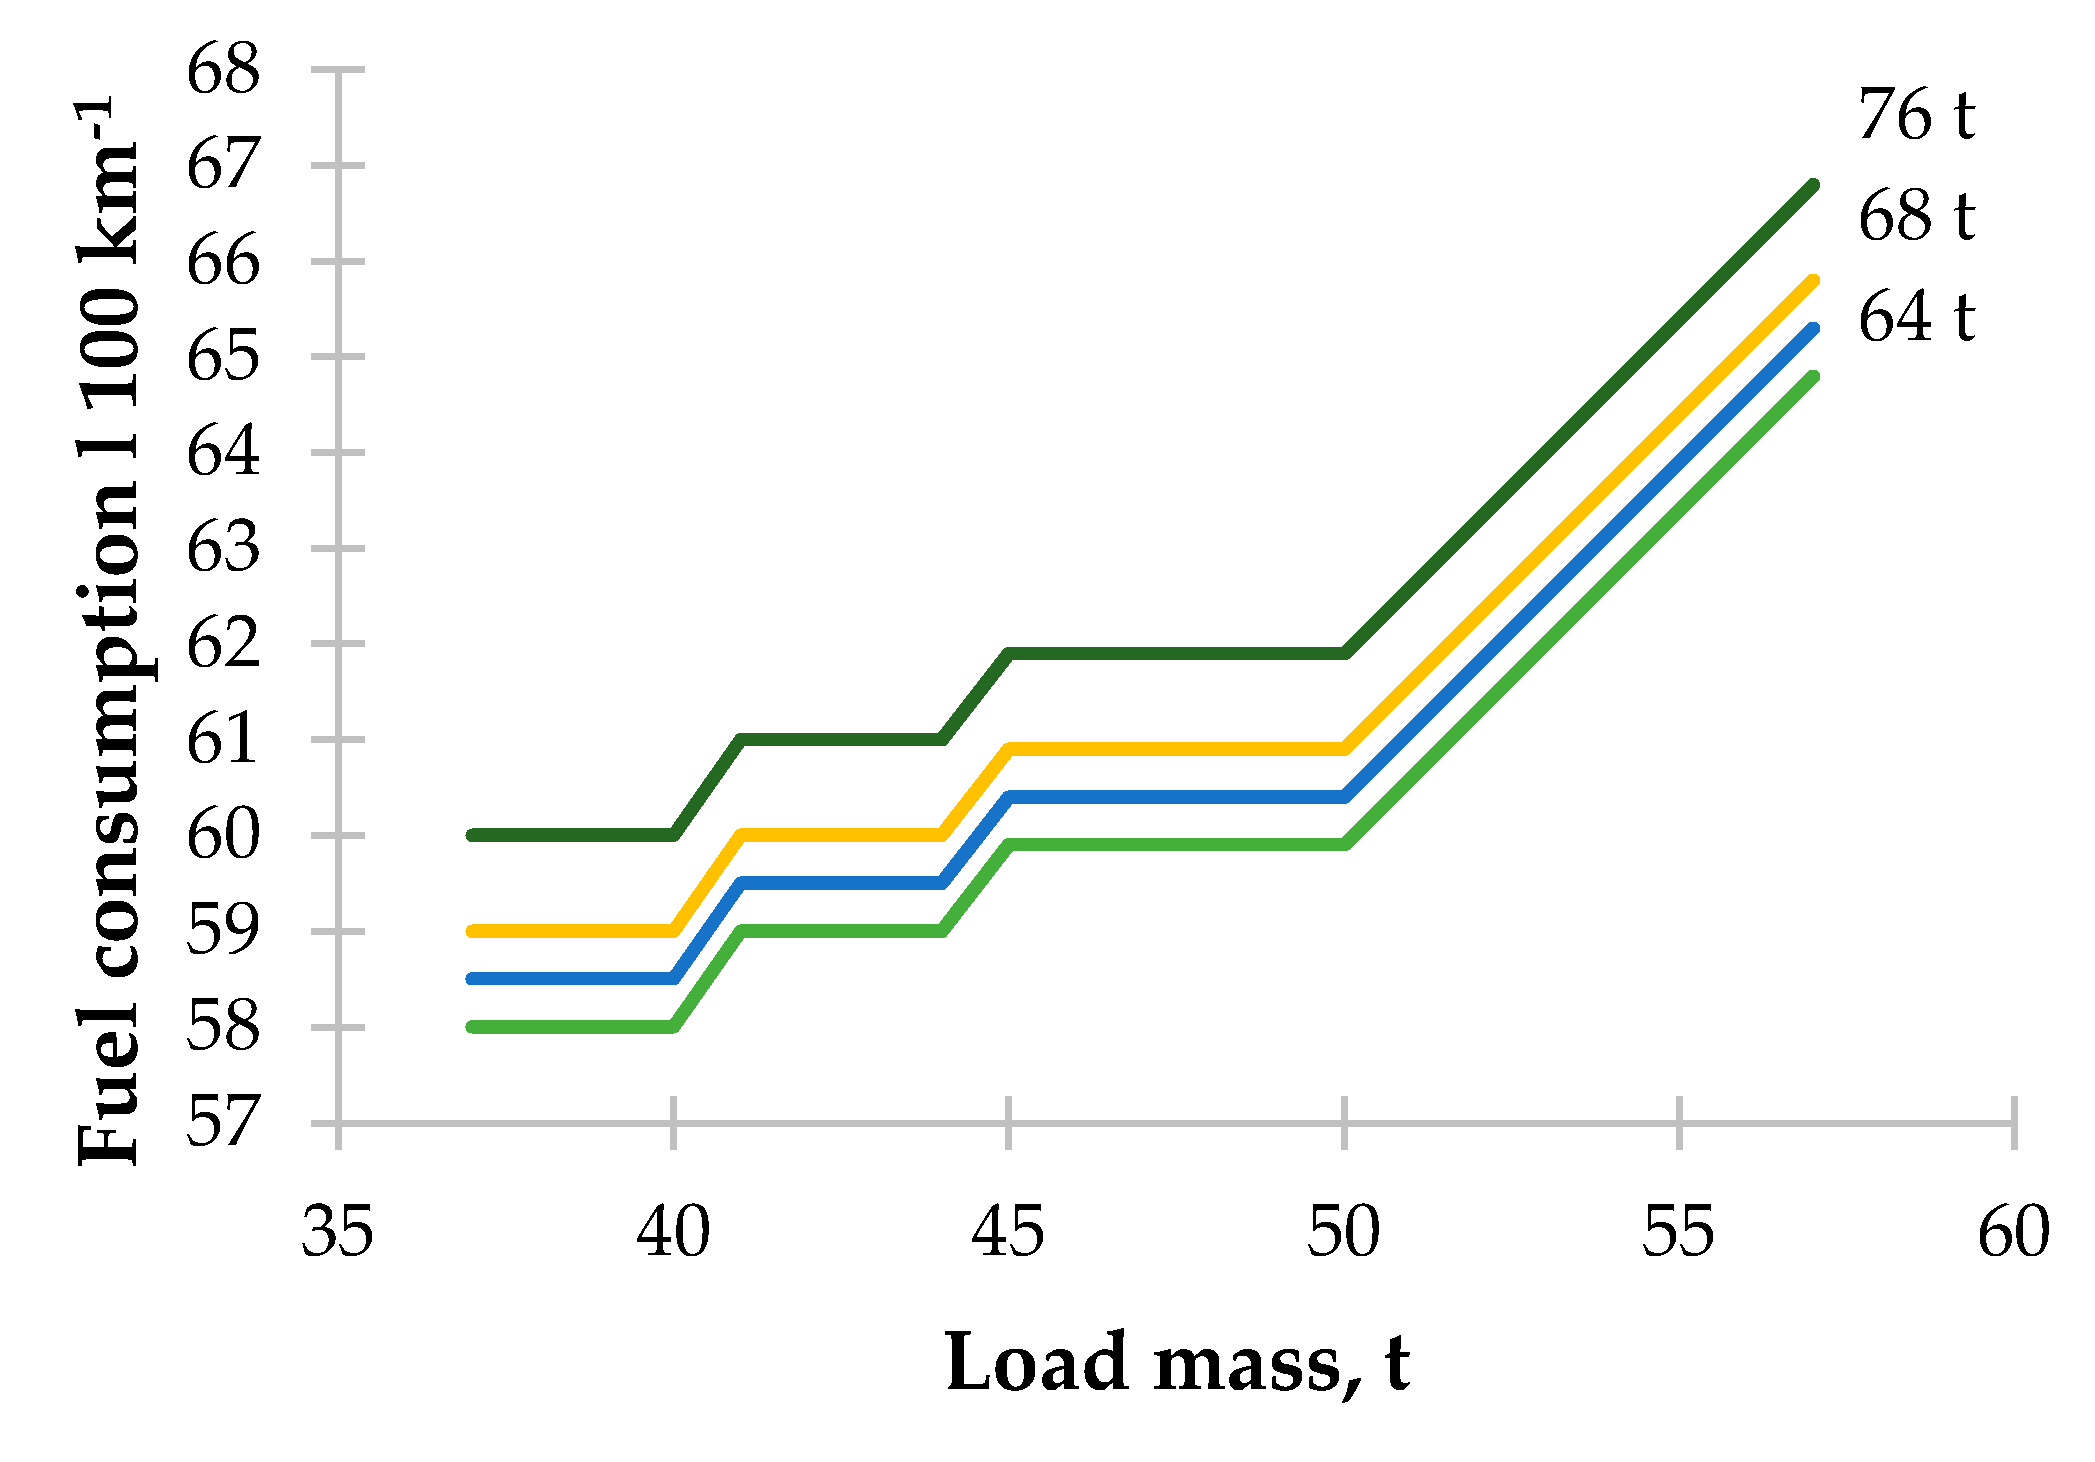
The enterprise resource planning (ERP) system of SEWSF was utilized to collect automatically real digital big data in 2017. The vehicles’ real measurements data include results from fuel consumption (e.g., Figure 4), air emissions, maximum and load-constraint mass, transport distances, logistics transport situation, etc, from 363,850 timber assortment deliveries from forests to mills during 2016. In addition to the real vehicle data, national road freight statistics from the year 2016 were used for the energy efficiency calculations of the STS in SEWSF [19].
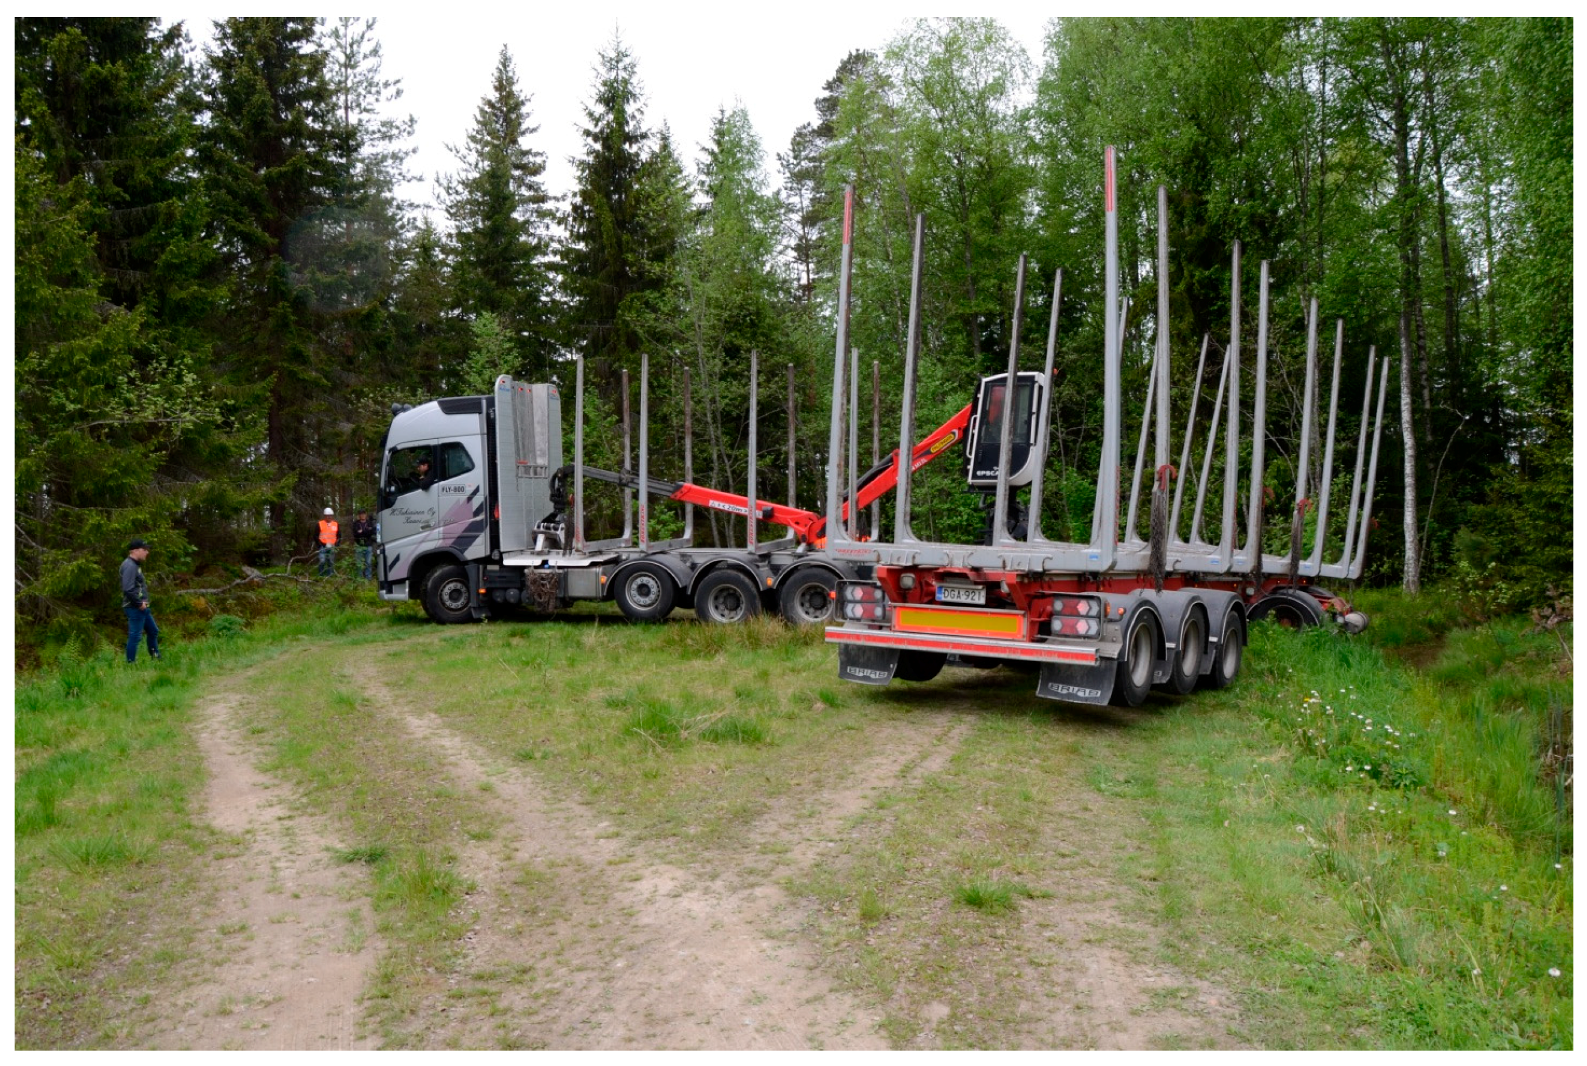
To facilitate comparisons between three TFMC options in SEWSF, the emission data from the Traffic Emissions Database [19] and Mårtensson [18] were combined with the ERP data. HCT fleets’ transportation routes consist of travelling on highways, and local and forest roads (100%). The TFMC options describe transportation situations for various road networks for HCT travelling on forest roads: A = 40, 4 and 2% for 64, 68 and 76 t, respectively (Figure 5); B = 15, 15 and 15%, respectively (Figure 2); and C = 5, 5 and 5%, respectively (Figure 6). Option A is the group transportation method; option B is the method that was used most often for the typical Finnish road infrastructure in SEWSF, without good road network (highway, local and forest road); and option C is the method that uses a good future road network constructed between important industrial ecosystems of Finland. In addition to improved highways and local roads, HCTs (76 t with crane) need larger turning place on forest roads (Figure 7).
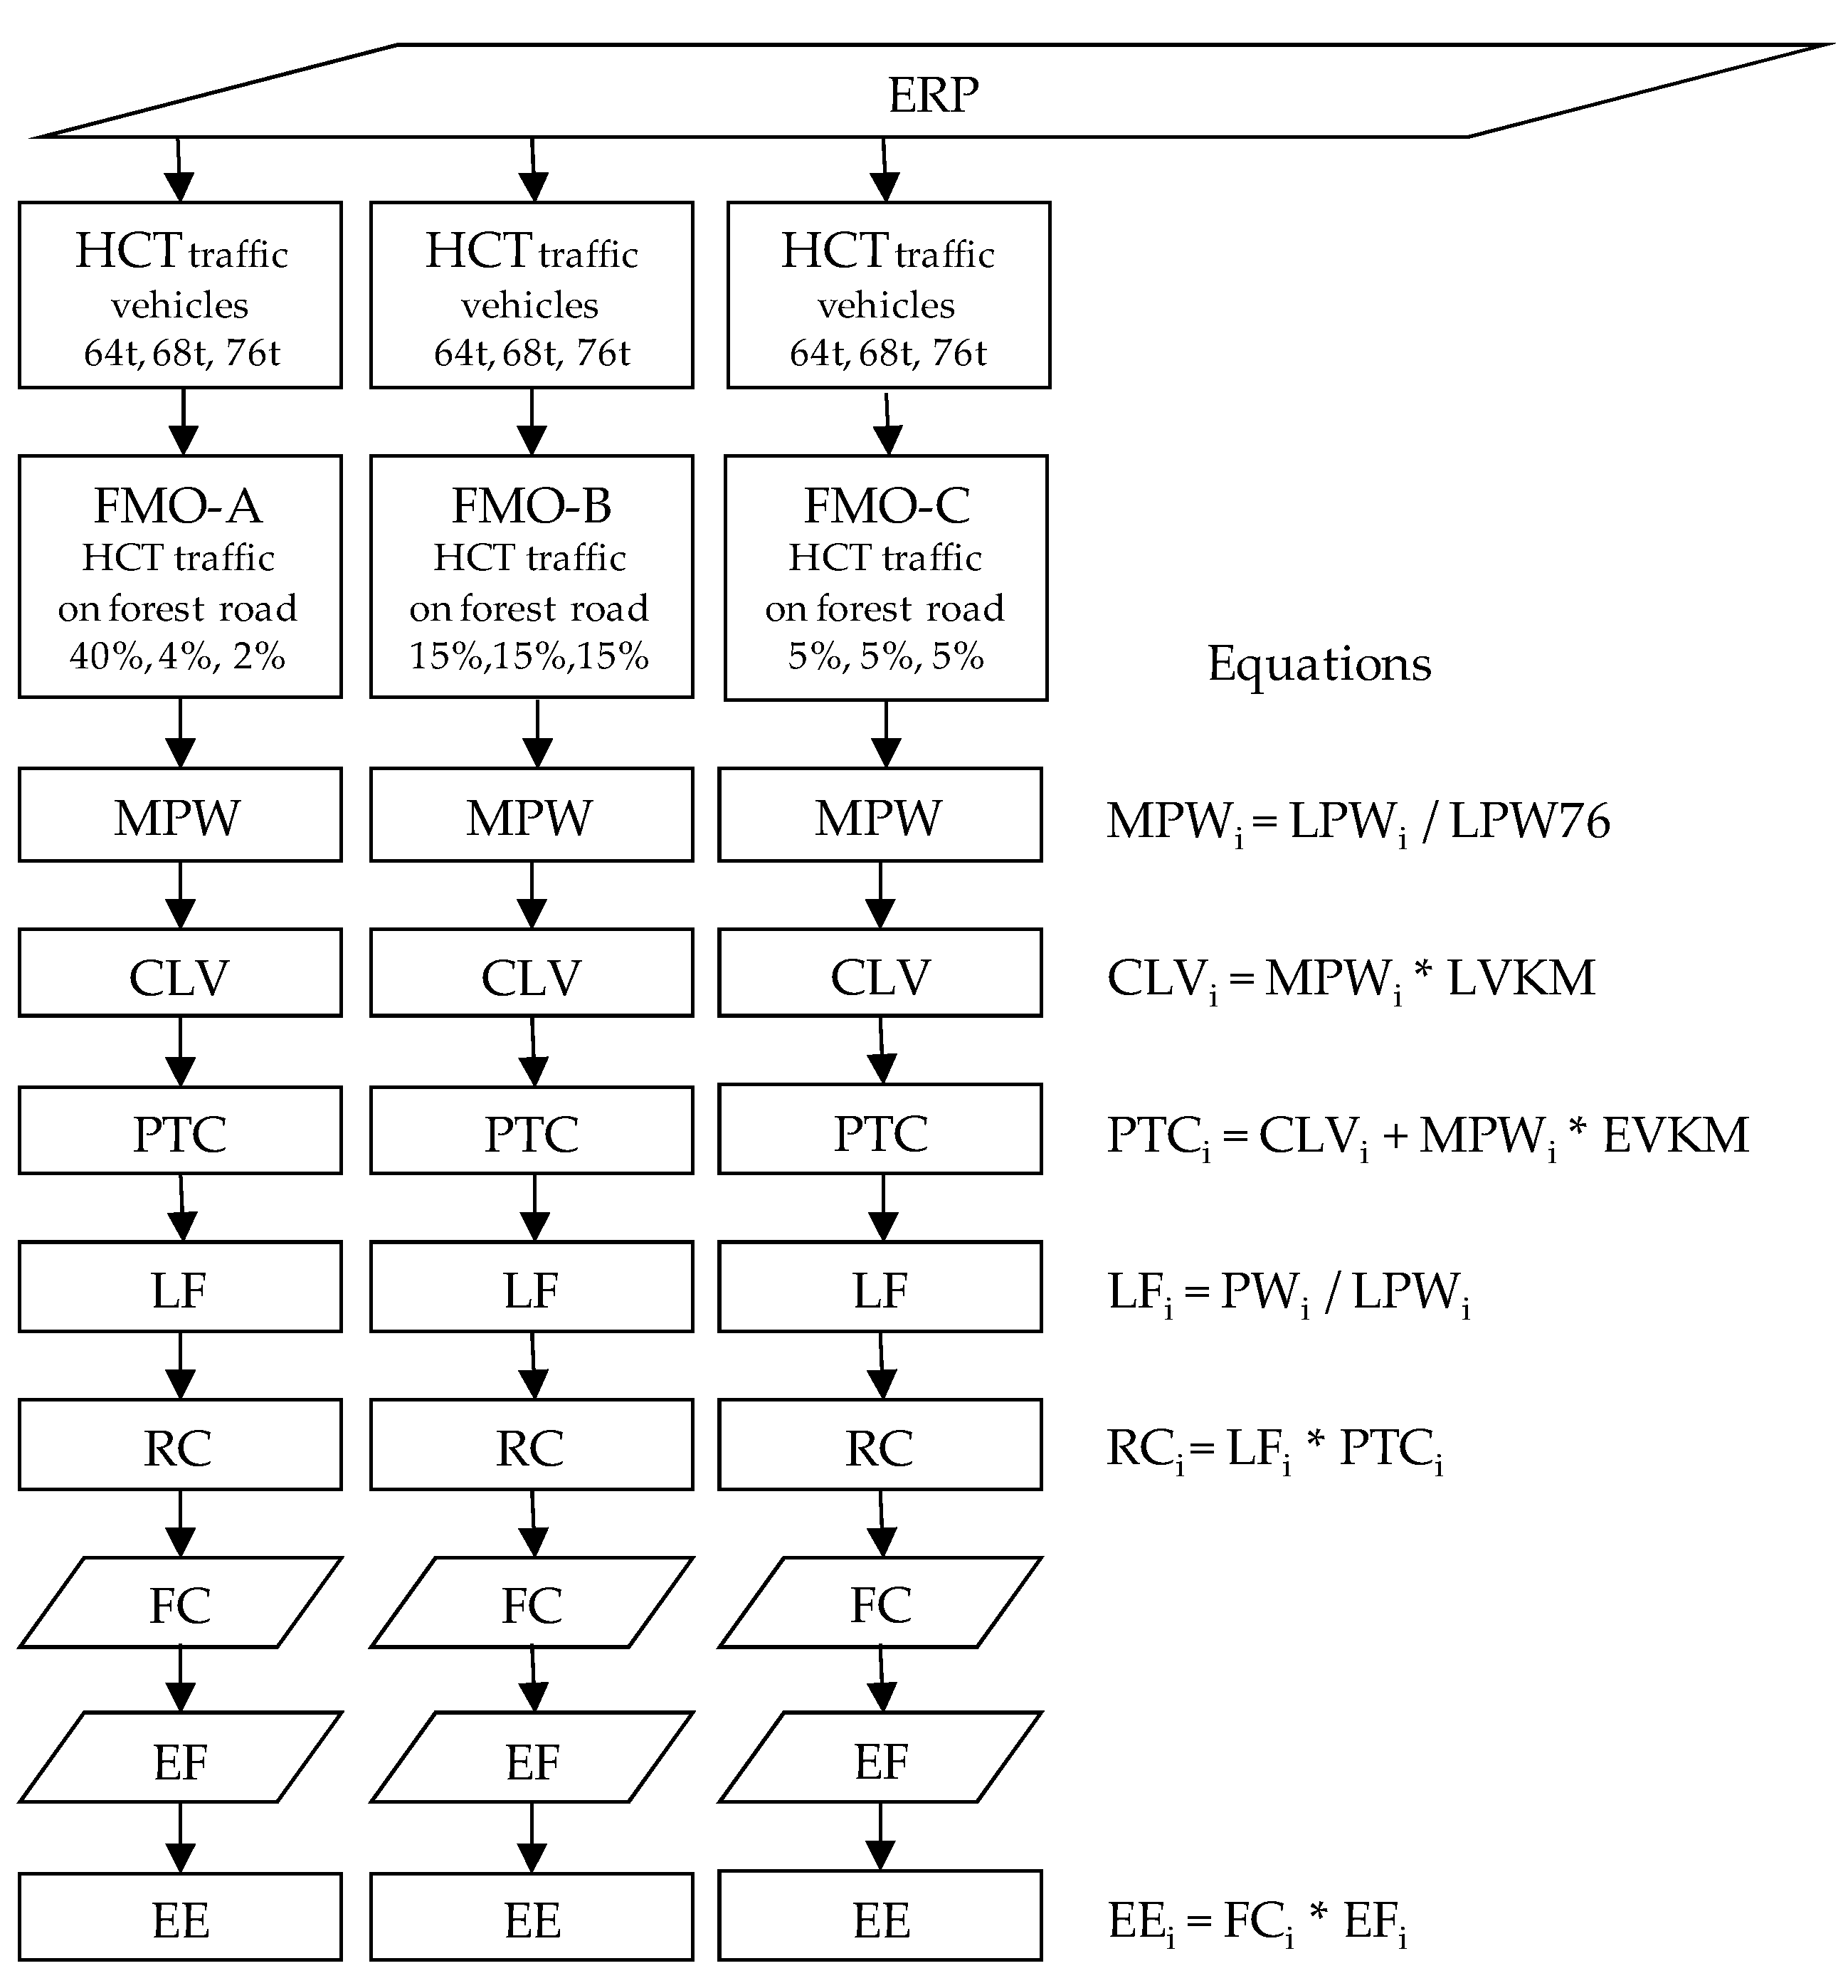
The ERP data of the energy efficiency analysis are obtained regarding the distances that each vehicle combination travelled with empty loads, mass-constrained loads and the timber quantity moved over these distances (Table 2). The fleet-management options (FMO) are quantified as HCT’s travelling percentages on forest road from logistics data of SEWSF’s ERP (Figure 8). The maximum payload weight (MPW) ratio is calculated as the average ratios of the legal maximum payload weight (LPW) that can be carried on 64, 68 and 76 t vehicles to that of a 76 t vehicle combination [11]. Each vehicle’s kilometers travelled is multiplied by its MPW ratio to estimate the change in laden-vehicle-kilometers (CLV). The potential total change (PTC) is measured in relation to the trip distances length by summing the travelled with empty and maximum loads. Next, the load factor (LF) is applied to the reduced change (RC) in recognition of the fact that the loads of some vehicle combinations are limited by volume, road infrastructure, scheduling or other constraints. On the other hand, vehicles may be loaded over its legal mass. The fuel consumption (FC) is calculated based on monitoring fuel data in stages of timber transportation trip. The energy efficiency (EE) on these trips—as well as the changes in vehicle-kilometers, fuel consumption and vehicle exhaust emissions—are calculated for each of the levels of load migration towards the maximum load weights.
The follow-up method was used to monitor the progress of road-freight transportation. In this stage of the analysis, the quantitative impacts of the HCT were investigated; mass limits for various vehicle combinations in SEWSF’s road-transportation fleet had after a three-year adaptation process. In the next stage of the analysis, the impact of the HCT on the energy efficiency was assessed using the calculation method of STS (Figure 2 and Figure 8) subjected to load constraints which are formulated in accordance with the EU’s statistical directive in the European Modular Systems [11,57]. The method combines the timber-transportation and fuel-consumption data using the multistep model that is applied to Finnish transportation conditions (Figure 8). The flowchart was translated into VBA (Visual Basic for Applications) of Excel, which provides highly flexible programming capabilities for both input and output data of STS.

3. Results

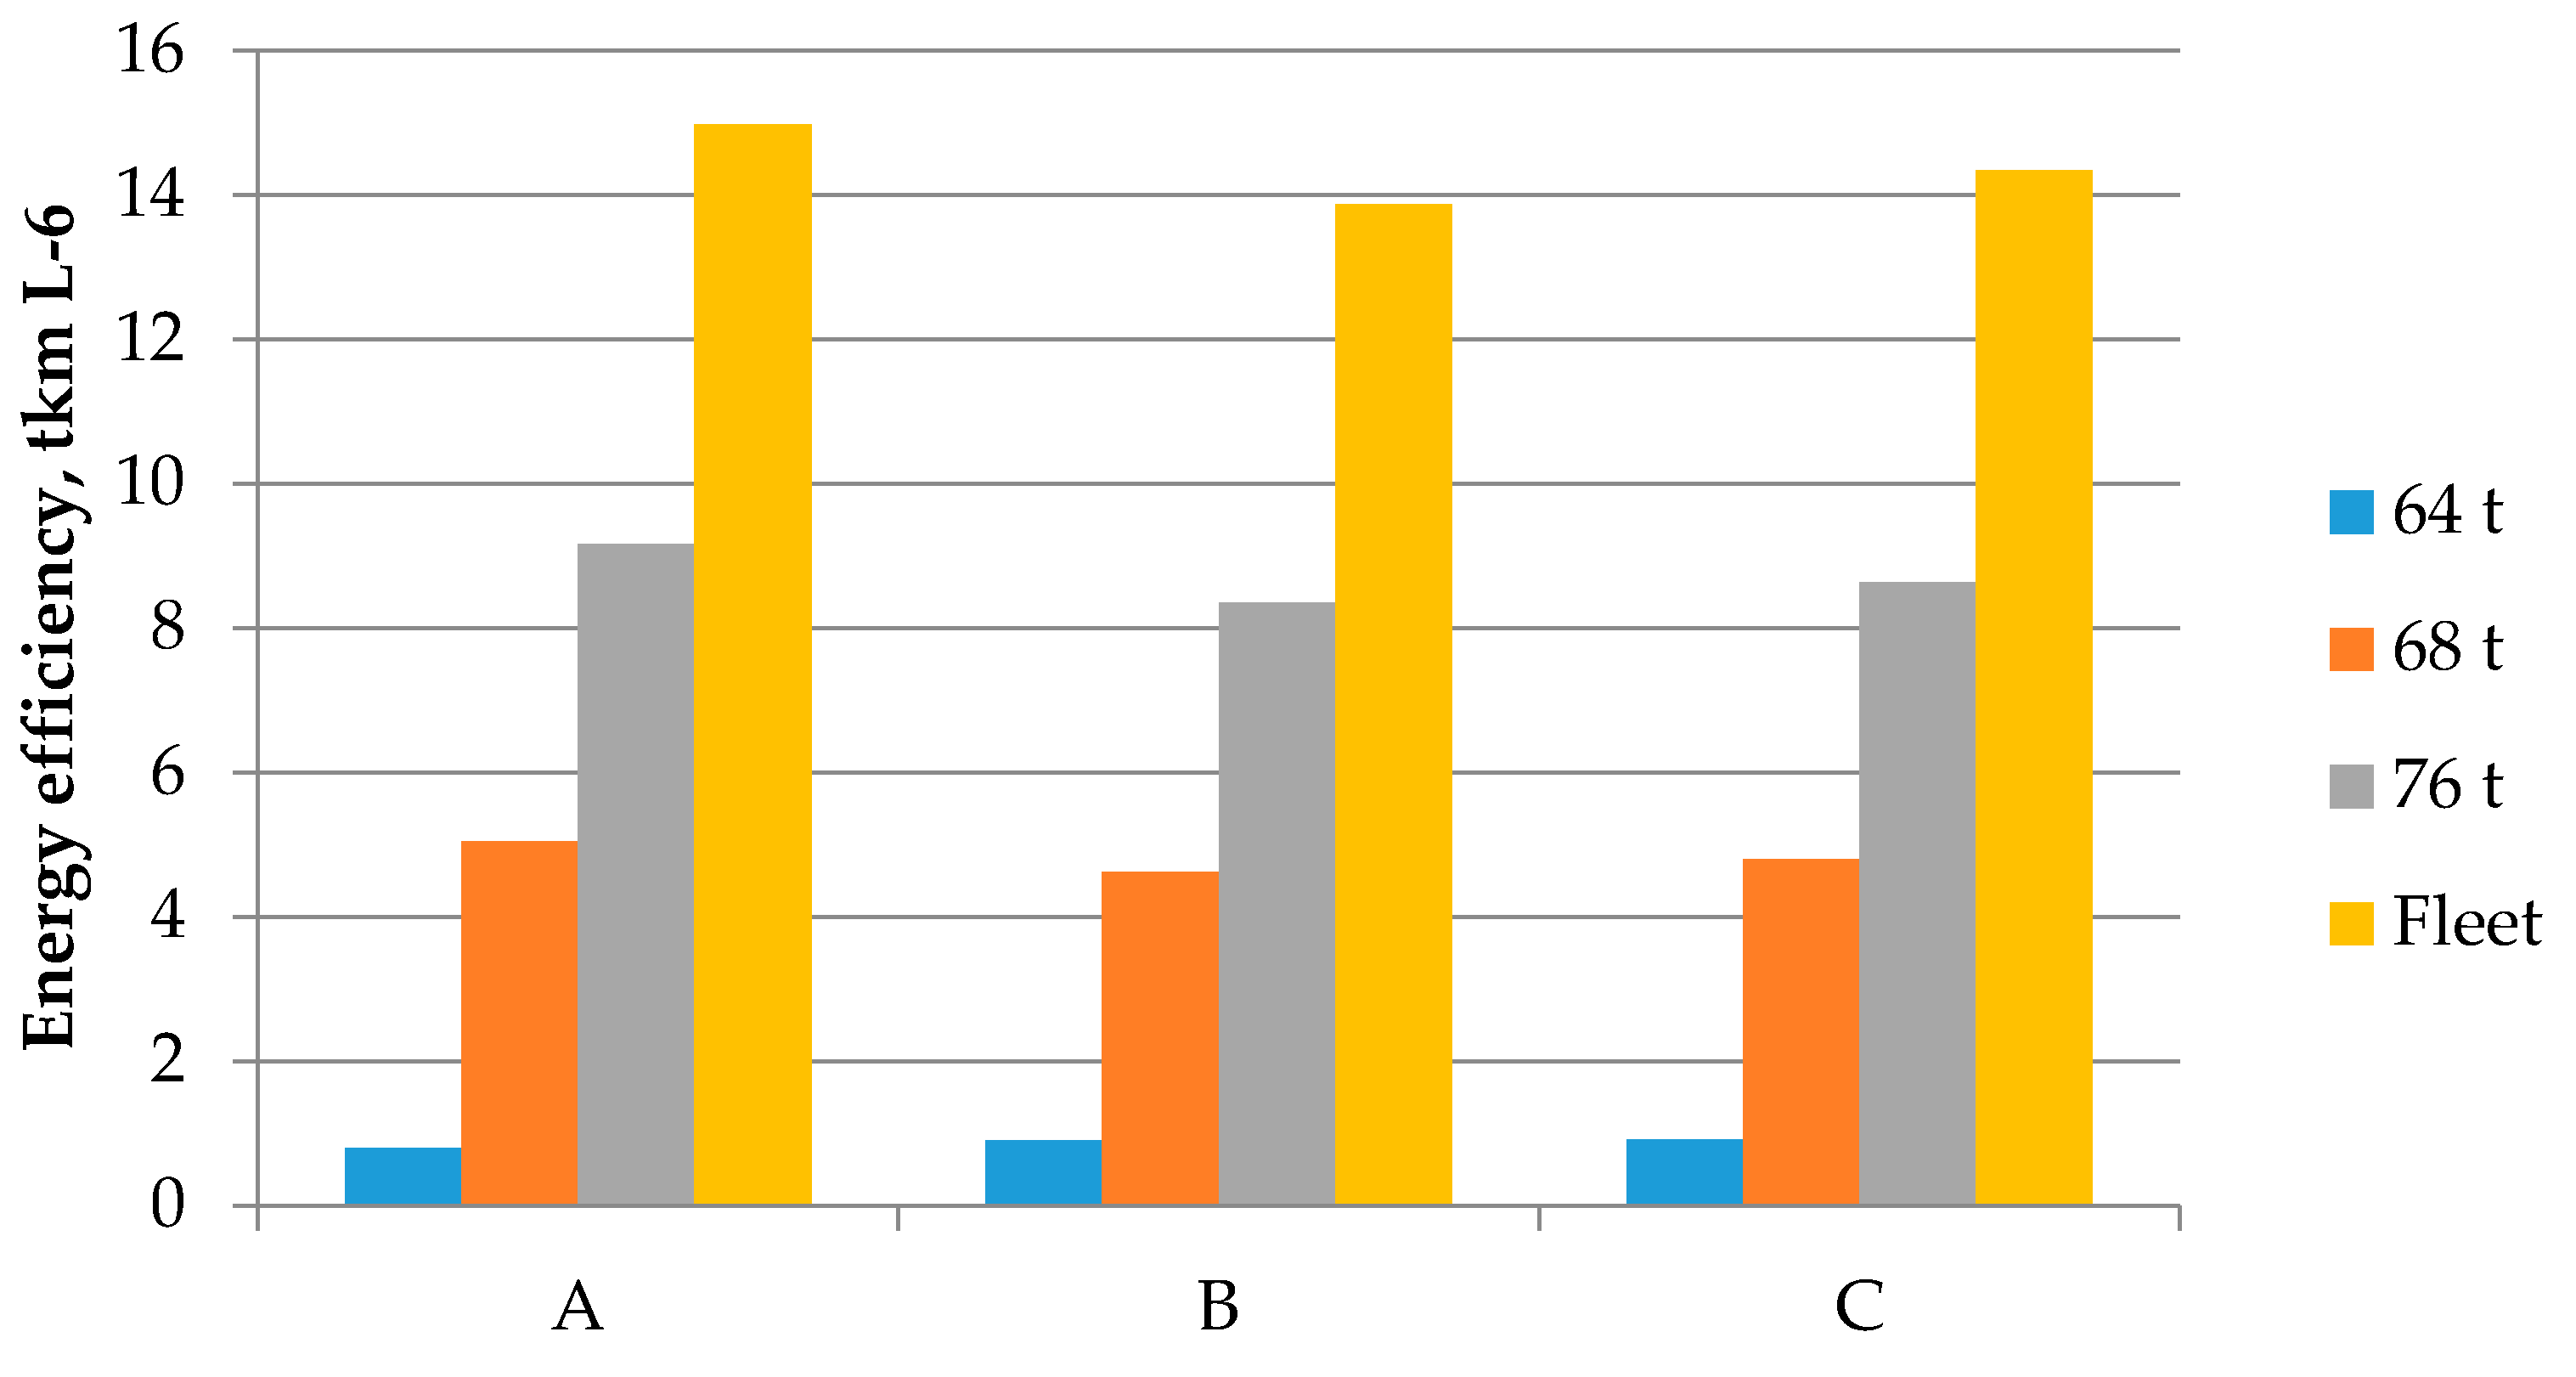
The changes in the energy efficiency of three TFMC options in SEWSF were calculated based on the changes in the total measurements of timber transportation (timber, distance and fuel) that resulted from the vehicle combinations’ maximum mass increase (Figure 9). Actually, various local changes were made by the entrepreneurs from the timber-transportation fleet of 60 t vehicles to a vehicle mix of 64, 68 and 76 t combinations in wood procurement regions. A follow-up analysis of the CLV-quantity (laden-tkm) was used to reveal how an increase in vehicle mass changed the corresponding payload after the completion of the three-year adaptation period towards HCT in which the STS moved towards the mass limit of 76 t. At the beginning of the adaptation process, the 60 t vehicles’ share of the total transport quantity (laden-tkm) was 100%. After one year, the shares for the 64, 68 and 76 t vehicles were calculated as, respectively, 61.7, 26.1 and 12.2%. At the end of the three-year period, the 64, 68 and 76 t shares were 5.8, 31.4 and 62.8%, respectively.
In 2016, the 64, 68 and 76 t vehicle combinations made 19,800, 70,800 and 121,600 trips, respectively. The transport distance varied from 1 to 441 laden-km, and the operational fuel consumption was about 10,628,459 L for measured trips. Due to HCT’s higher timber load capacity, their energy efficiency during timber transportation was 13.4% higher per tkm for measured loads in the entire fleet of the STS. There is also the theoretical potential for a further 3.1% increase in energy efficiency within the STS, if all timber is transported from forest to mill using 76 t vehicles. Compared to the results for 64 t vehicle combinations the average CO2 emissions of 76 t vehicles were 3.5% higher per load’s vehicle-kilometer. The CO2 emissions of road-transportation vehicles (kg) were calculated for PTC-quantity of the vehicle combination in the STS in the efficient highway network, i.e., in FMO-C.
Table 3 illustrates the effects that the road infrastructures have on the RC-quantities. Table 3 also describes transportation solutions from applied options of the TFMC for these infrastructures with respect to actual (and, a priori, equal) transportation quantity from forest to mills. Thus, the various options (A, B and C) can be compared by calculating the reduced changes (RCs) in vehicle-kilometers, fuel consumption and vehicle exhaust emissions for energy efficiency. In fact, SEWSF’s transportation entrepreneurs operate on a road network that consists of several road classes simultaneously.
Table 4 reports the changes of the fuel consumption and air emissions for all three vehicle combinations in respect to the EURO-0 and EURO-VI diesel engines. Table 4 also compares the energy efficiency of the STS for the fleet-management methods A, B and C applied for driving on forest roads and with a priori equal total RC-quantities of timber transportation distance. For example, it shows how the reduction in fuel consumption (780,922 L) and corresponding diesel exhaust emissions of 76 t vehicles was smaller (7.5%) for the fleet-management method A (group) compared to B (current), as SEWSF’s fleet adjusted to the 76 t mass limit. As another example, if SEWSF’s total consumption of diesel is reduced by 3.5%, as from B (current) to C (future), the CO2 emissions decrease 910,860 kg during the adjustment process.

4. Discussion

In this study, three options of TFMC were analyzed for the management of transportation fleets’ vehicle combinations (64, 68 and 76 t). The results suggest that the tailored fleet-management methods are needed to achieve all of HCT’s benefits in local wood transportation systems and supply chains. Furthermore, the results suggest that the efficient TFMC could be used to increase the attained level of energy efficiency of the STS from HCT. So far, based on the three-year adaptation process of the STS to use HCT, there has been a remarkable reduction in fuel consumption and in environmental emissions in the STS of SEWSF and the whole industrial ecosystem, as Korhonen [7,8] suggested. SEWSF is the wood procurement organization of the large forest industry company in Finland, which delivered one third of used wood resources to mills (23 million·m3) in 2016. Therefore, this study is a good representative of the homogenous situation of timber transportation in Finland.
The impact that the HCT had on energy efficiencies was compared by coupling the vehicles’ mass limits and size limits, as researchers have done in past experiments [11,13,16]. In addition, this study’s data were large real measurements data of transportation operations collected from the ERP system, which were then combined with emission data from the literature and from databases. As the novel research issue, the impact of the fleet-management methods (FMO-A and C) on energy efficiencies was compared against the current fleet-management method (FMO-B) in the same data. Figure 9 and Table 4 illustrate these energy efficiency calculations—for example, the energy efficiencies of the 76 t group vehicles that worked together with 64 and 68 t vehicles in SEWSF’s road-transportation conditions (FMO-A). The investigation revealed that trips’ relative energy efficiency was high (+7.5%) with the group management method (FMO-A). It was also higher than the efficiency in the future road infrastructure option (FMO-C). The overall results of the TFMC indicated positive impacts, which confirm that HCT can serve as an environmentally friendly transportation system. This result is consistent with suggestion made by Palander [10].
Since 2014, the loads for vehicles increased quite remarkably from 64 to 76 t, and the load factor (LF) was relatively high. The drivers did load the trucks close to the maximum load weight. However, the drivers of the 76 t vehicles did not reach the maximum permitted gross weight (Table 2), attaining a load utilization of 97%. It is unclear why a higher figure was not attained, but one possible explanation involves volume limitations (e.g., logs that were bucked in lengths that were too short), thus requiring additional time during careful loading, as several scholars have suggested (Figure 3). Another important explanation involves the 76 t vehicles. In the group transportation method of TFMC, several trucks must collaborate if the 76 t vehicles have no cranes or do not use forest roads and storage. Therefore, the smaller vehicles with cranes (64 and 68 t) must be used to load the group (76 t) vehicles, which are capable of carrying a 10% heavier load. Sometimes, in local-wood inventory conditions, in particularly, if a crane is used, the fleet-management options of the TFMC can experience difficulties in reaching the maximum permitted gross weight of 76 t.
The energy efficiency of trips increased 13.4% in SEWSF’s STS relative to the efficiency for the year 2014. Furthermore, this study revealed a 3.1% potential increase in energy efficiency. These figures underestimate the prediction of the Finnish government for the road freight sector [52] regarding a full adjustment to the maximum mass limit of 76 t. In this respect, the predicted 32% increase of 76 t vehicles with regards to the energy efficiencies is an overestimate. It is important to note that, instead of the legal load mass of 60 t vehicle, the 66 t vehicle (64 t + 2 t of overload) is the reference for SEWSF in practice. In this regard, this study suggests that, in the industrial ecosystems of Finland, the use of 76 t vehicles can reduce CO2 emissions by about 20% relative to the legal load mass of 60 t vehicles. The more positive environmental impacts are probably based on overly optimistic assumptions. The calculation method used in this study could be used to improve the accuracy of energy efficiency and emission assessments. So far, wood procurement optimization problems like the STS have been solved using the minimization of operation costs (cost efficiency) as the criterion [25,26]. In addition to costs, the STS can be robustly optimized in the near future to increase the STS’s energy efficiency and to reduce trucks’ exhaust emissions. Furthermore, the STS can also be solved as a multiple criteria solution (cost and energy efficient solution) by using an optimization program with the calculation method of this study.
In addition to CO2 emissions, the HCT’s impact on several diesel exhaust emissions were calculated, which associated with potential fleet-management methods and road-class constraints within SEWSF’s wood-procurement region. For transportation, pollutants such as SO2 and NOX might be much more harmful to the environment than CO2 and it would be much more valuable to study the changes in pollutants such as SO2 and NOX than CO2. It is also argued that for diesel engines the most critical emissions have been NOX and particulates. Table 4 shows that since the Euro I for diesel engines was introduced in 1992, the NOX and SO2 emissions have been decreased by more than 96% and the particulate emission by 99%. Therefore, since 2014, European standards on exhaust emissions (Euro IV) really mean that timber trucks are cleaner now than they have ever been in Finland.
The load-carrying capacity needs to be discussed in this paper, because it is increased and targeted by the regulations of the Ministry of Transport and Communications of Finland [52]. The load-carrying capacity can be increased in three ways, with increases in load width, height or length. Prior to considering these possibilities for highway use, their impact on vehicle dynamics was examined to ensure that the designs would be safe for drivers. Each vehicle combination that is designed for increasing the load-carrying capacity must also be safe for other road users. By the same token, the vehicle dynamics should be evaluated before the vehicles can be considered for use on forest roads. Furthermore, stakeholders should be educated and trained to maximize log payloads for operating longer, higher and wider log trucks on forest roads. Maximizing payloads is not the solution for all the challenges in the transportation sector, but it can increase energy efficiency and prolong trucks’ economic viability without adding costs. A data analysis of this study revealed that seven- (64 t) and eight-axle (68 t) vehicle combinations are able to reach maximum axle weights. The excessive-weight problem was more evident with the seven-axle configurations because of their smaller payload capacity. Overloading can reduce cost efficiency and result in lost revenue for the hauling contractor, as load controls have tightened, and overloads of greater than 5% have been sanctioned. On the other hand, if a vehicle reaches its volumetric limit before reaching its weight capacity, the transportation company will not receive the full rate (€/tkm) for its hauling costs, so underweight loads lead to lost revenue because they prevent entrepreneurs from taking advantage of payload capacities above the minimum level, on which the rate is based. This problem can be avoided by using longer trailers in the future, because recently (22.1.2019) HCT was allowed to increase the maximum length (34.5 m) in Finland.
Due to the pressure to increase timber transportation in Finland, the STSs of the forest industry are changing towards HCT. The results of this study support these development targets. Actually, the Finnish forest industry is developing synchromodal supply chains and network, which are focused on flexible transportation modes as a new option for local supply chain managers to increase the total energy efficiency [56]. Here, the most important mode of the supply chain was studied from the timber buyer’s perspective. It is also important to compare energy efficiencies from a transportation entrepreneur’s perspective, perhaps by comparing these findings more comprehensively in a collaborative study in which service providers and timber buyers manage fleets of HCT together. In this respect, both road conditions and cost efficiency should be discussed a lot as the important issues, but cost efficiency is outside the scope of this study. For an additional road infrastructure investment, the Trans-European Transport Network (TEN-T) guidelines identify certain requirements and development priorities, as well as the instruments for their implementation [55]. The TEN-T guidelines are to be applied in the future transportation network of the European Union. In this respect, new highways between Finland’s main industrial ecosystems are required to create a 100% carbon-neutral energy base for the Finnish distributed forest industry [6]. In addition to new highways, local road-transportation conditions (e.g., road network) should also be improved. However, due to the TEN-T guidelines, it is unlikely that the transportation network will increase to the same degree that the requirements of HCT will increase [27,28]. Therefore, the group transportation method (FMO-A) will be the most efficient option of the TFMC in the future.

5. Conclusions

The Finnish forest-product companies provide renewable products and can address their environmental sustainability burdens by developing carbon neutral transportation operations. An approach using TFMC for the STS adjustment is proposed in increasing the energy efficiency of the STS of wood procurement. The study revealed that the forest industry has almost reached HCT’s full potential related to the STS’s energy efficiency. During the adaptation period (2014–2016), the energy efficiency increased by 13.4% for the measured loads. Based on the results, there remains a 3.1% potential increase in the STS‘s energy efficiency. Therefore, the energy efficiency analysis provides novel insights into the impacts of the TFMC on HCT’s benefits. The group transportation method (FMO-A) was the most efficient TFMC (+7.5%) in the STS of Finland; thus, tailored TFMC should be used in wood-procurement logistics. This method is also suggested for other companies in the forest industry, both in Finland and abroad, because the STS and its road-class constraints can be robustly optimized in the near future to increase the STS’s energy efficiency and to reduce trucks’ exhaust emissions.

Author Contributions

T.P. and K.K. designed the study; T.P. and K.K. performed the TFMC calculations; T.P. analyzed the data; T.P. and K.K. contributed materials/analysis tools; T.P. wrote paper; T.P. and K.K. corrected the paper.

Funding

This research received no external funding.

Acknowledgments

The authors are grateful to University of Eastern Finland for technical support.

Conflicts of Interest

The authors declare no conflict of interest.

References

  1. EUR-Lex. A Roadmap for Moving to a Competitive Low Carbon Economy in 2050. Available online: https://eur-lex.europa.eu/legal-content/EN/ALL/?uri=CELEX%3A52011AE1389 (accessed on 22 November 2018).
  2. EUR-Lex. A Policy Framework for Climate and Energy in the Period from 2020 to 2030. Available online: https://eur-lex.europa.eu/legal-content/EN/TXT/PDF/?uri=CELEX:52014DC0015&from=EN (accessed on 22 November 2018).
  3. Korzhenevych, A.; Dehnen, N.; Bröcker, J.; Holtkamp, M.; Meier, H.; Gibson, G.; Varma, A.; Cox, V. Update of the Handbook on External Costs of Transport; European Commission, DG Mobility and Transport: Ispra, Italy, 2014. [Google Scholar]
  4. OECD. Moving Freight with Better Trucks: Improving Safety, Productivity and Sustainability. 2011. Available online: http://www.oecd-ilibrary.org/transport/ (accessed on 22 November 2018).
  5. Palander, T.; Kärhä, K. Characteristics of energy performance measures for 100% carbon-neutral wood procurement of forest industry. In New Trends in Nanotechnology, Material and Environmental Sciences; Zhu, J., Jin, A., Zhu, D., Eds.; AV AkademikerVerlag: Berlin, Germany, 2018; pp. 304–332. [Google Scholar]
  6. Palander, T.; Haavikko, H.; Kärhä, K. Towards sustainable wood procurement in forest industry—The energy efficiency of larger and heavier vehicles in Finland. Renew. Sustain. Energy Rev. 2018, 96, 100–118. [Google Scholar] [CrossRef]
  7. Korhonen, J. Four ecosystem principles for an industrial ecosystem. J. Clean. Prod. 2001, 9, 253–259. [Google Scholar] [CrossRef]
  8. Korhonen, J. A material and energy flow model for co-production of heat and power. J. Clean. Prod. 2002, 10, 537–544. [Google Scholar] [CrossRef]
  9. Ghose, A.; Chinga-Carrasco, G. Environmental aspects of Norwegian production of pulp fibres and printing paper. J. Clean. Prod. 2013, 57, 293–301. [Google Scholar] [CrossRef]
  10. Palander, T. The environmental emission efficiency of larger and heavier vehicles—A case study of road transportation in Finnish forest industry. J. Clean. Prod. 2017, 155, 57–62. [Google Scholar] [CrossRef]
  11. McKinnon, A. The economic and environmental benefits of increasing maximum truck weight: The British experience. Transp. Res. Part D Transp. Environ. 2005, 10, 77–95. [Google Scholar] [CrossRef]
  12. McKinnon, A.C.; Piecyk, M. Measurement of CO2 emissions from road freight transport: A Review of UK Experience. Energy Policy 2009, 37, 3733–3742. [Google Scholar] [CrossRef]
  13. Handler, R.M.; Shonnard, D.R.; Lautala, P.; Abbas, D.; Strivastava, A. Environmental impacts of roundwood supply chain options in Michigan: Life-cycle assessment of harvest and transport stages. J. Clean. Prod. 2014, 76, 64–73. [Google Scholar] [CrossRef]
  14. Sonne, E. Greenhouse gas emissions from forestry operations: A lifecycle assessment. J. Environ. Qual. 2006, 35, 1439–1450. [Google Scholar] [CrossRef]
  15. Palander, T. Environmental benefits from improving transportation efficiency in wood procurement systems. Transp. Res. Part D Transp. Environ. 2016, 44, 211–218. [Google Scholar] [CrossRef]
  16. Lijewski, P.; Merkisz, J.; Fuć, P.; Ziółkowski, A.; Rymaniak, L.; Kusiak, W. Fuel consumption and exhaust emissions in the process of mechanized timber extraction and transport. Eur. J. For. Res. 2017, 136, 153–160. [Google Scholar] [CrossRef]
  17. Commission Regulations (EU). No 582/2011. 2011. Available online: http://eur-lex.europa.eu/LexUriServ/LexUriServ.do?uri=OJ:L:2011:167:0001:0168:EN:PDF (accessed on 22 November 2018).
  18. Mårtensson, L. Emissions from Volvo’s Trucks. Volvo Truck Corporation, 2018. Available online: https://www.volvotrucks.com/content/dam/volvo/volvo-trucks/markets/global/pdf/our-trucks/Emis_eng_10110_14001.pdf (accessed on 22 November 2018).
  19. Traffic Emissions Database. Road Traffic Emissions and Energy Consumption in Finland. 2017. Helsinki. Available online: http://www.lipasto.vtt.fi/ (accessed on 22 November 2018).
  20. Stora Enso. Stora Enso’s Policy for Energy and Carbon. 2017. Available online: https://www.storaenso.com/download-centre/ (accessed on 22 November 2018).
  21. Stora Enso. Stora Enso Sustainability Report 2016. 2017. Available online: https://www.storaenso.com/download-centre/ (accessed on 22 November 2018).
  22. Stora Enso. Progress Book. Part of Stora Enso’s Annual Report 2017. 2018. Available online: https://www.storaenso.com/download-centre/ (accessed on 22 November 2018).
  23. Hope, K. Annual Report on European SMEs 2016/2017, Focus on Self-Employment. SME Performance Review 2016/2017; Final Report; European Commission, Internal Market, Industry, Entrepreneurship and SMEs: Ispra, Italy, 2017. [Google Scholar]
  24. Haavikko, H.; Kärhä, K.; Hourula, M.; Palander, T. Attitudes of Small and Medium-Sized Enterprises towards Energy Efficiency in Wood Procurement: A Case Study of Stora Enso in Finland. Croat. J. For. Eng. 2019, 40, 107–123. [Google Scholar]
  25. Palander, T.; Väätäinen, J. Impacts of inter-enterprise collaboration and backhauling on wood procurement in Finland. Scand. J. For. Res. 2005, 20, 177–183. [Google Scholar] [CrossRef]
  26. Palander, T.; Vainikka, M.; Yletyinen, A. Potential mechanisms for co-operation between transportation entrepreneurs and customers: A case study of regional entrepreneurship in Finland. Croat. J. For. Eng. 2012, 33, 89–103. [Google Scholar]
  27. Marttila, V.; Granholm, H.; Laanikari, J.; Yrjölä, T.; Aalto, A.; Heikinheimo, P.; Honkatuki, J.; Järvinen, H.; Liski, J.; Merivirta, R.; et al. National strategy for Adapting Climate Change; Report 1; The Ministry of Agriculture and Forestry: Helsinki, Finland, 2005.
  28. Saarelainen, S.; Makkonen, L. Adaptation to Climate Change in Road Maintenance, Preliminary Report; Report 4; Finnish Road Administration: Helsinki, Finland, 2007.
  29. Tiehallinto. The Affect of Climate Change to Road Maintenance; Report 8; Finnish Road Administration: Helsinki, Finland, 2009.
  30. Holzleitner, F.; Kanzian, C.; Stampfer, K. Analyzing time and fuel consumption in road transport of round wood with an onboard fleet manager. Eur. J. For. Res. 2011, 130, 293–301. [Google Scholar] [CrossRef]
  31. Svenson, G.; Fjeld, D. The impact of road geometry, surface roughness and truck weight on operating speed of logging trucks. Scand. J. For. Res. 2017, 32, 515–527. [Google Scholar] [CrossRef]
  32. Liimatainen, H.; Pöllänen, M. Trends of energy efficiency in Finnish road freight transport 1995–2009 and forecast to 2016. Energy Policy 2010, 38, 7676–7686. [Google Scholar] [CrossRef]
  33. Thollander, P.; Backlund, S.; Trianni, A.; Cagno, E. Beyond barriers—A case study on driving forces for improved energy efficiency in the foundry industries in Finland, France, Germany, Italy, Poland, Spain, and Sweden. Appl. Energy 2013, 111, 636–643. [Google Scholar] [CrossRef]
  34. del Río González, P. Analysing the factors influencing clean technology adoption: A study of the Spanish pulp and paper industry. Bus. Strategy Environ. 2005, 14, 20–37. [Google Scholar] [CrossRef]
  35. Thollander, P.; Ottosson, M. An energy efficient Swedish pulp and paper industry—Exploring barriers to and driving forces for cost-effective energy efficiency investment. Energy Effic. 2008, 1, 21–34. [Google Scholar] [CrossRef]
  36. Thollander, P.; Danestig, M.; Rohdin, P. Energy policies for increased industrial energy efficiency: Evaluation of a local energy programme for manufacturing SMEs. Energy Policy 2007, 35, 5774–5783. [Google Scholar] [CrossRef] [Green Version]
  37. Fleiter, T.; Fehrenbach, D.; Worrell, E.; Eichhammer, W. Energy efficiency in the German pulp and paper industry—A model-based assessment of saving potentials. Energy 2012, 40, 84–99. [Google Scholar] [CrossRef]
  38. Fracaro, G.; Vakkilainen, E.; Hamaguchi, M.; de Souza, S.N.M. Energy efficiency in the Brazilian pulp and paper industry. Energies 2012, 5, 3550–3572. [Google Scholar] [CrossRef]
  39. Martin, N.; Angliani, N.; Einstein, D.; Khrushch, M.; Worrell, E.; Price, L.K. Opportunities to Improve Energy Efficiency and Reduce Greenhouse Gas Emissions in the U.S. Pulp and Paper Industry; Ernest Orlando Lawrence Berkeley National Laboratory LBNL 46141; Ernest Orlando Lawrence Berkeley National Laboratory: Berkeley, CA, USA, 2000.
  40. Peng, L.; Zeng, X.; Wang, Y.; Hong, G.-B. Analysis of energy efficiency and carbon dioxide reduction in the Chinese pulp and paper industry. Energy Policy 2015, 80, 65–75. [Google Scholar] [CrossRef]
  41. Hämäläinen, E.; Hilmola, O.P. Energy efficiency at the paper mill—Dilemma of improvement. Energy Effic. 2017, 10, 809–821. [Google Scholar] [CrossRef]
  42. Joelsson, J.M.; Gustavsson, L. CO2 emission and oil use reduction through black liquor gasification and energy efficiency in pulp and paper industry. Resour. Conserv. Recyc. 2008, 52, 747–763. [Google Scholar] [CrossRef]
  43. Kilponen, L.; Ahtila, P.; Parpala, J.; Pihko, M. Improvement of pulp mill energy efficiency in an integrated pulp and paper mill. In Proceedings of the 2001 ACEEE Summer Study on Energy Efficiency in Industry “Increasing Productivity through Energy Efficiency”, Hilton Tarrytown, Tarrytown, NY, USA, 24–27 July 2001; pp. 363–374. [Google Scholar]
  44. Berg, S.; Lindholm, E.L. Energy use and environmental impacts of forest operations in Sweden. J. Clean. Prod. 2003, 13, 33–42. [Google Scholar] [CrossRef]
  45. Gonzales-Garcia, S.; Moreira, M.T.; Dias, A.C.; Mola-Yudego, B. Cradle-to-gate Life Cycle Assessment of forest operations in Europe: Environmental and energy profiles. J. Clean. Prod. 2014, 66, 188–198. [Google Scholar] [CrossRef]
  46. Han, H.-S.; Oneil, E.; Bergman, R.D.; Eastin, I.L. Cradle-to-gate life cycle impacts of redwood forest resource harvesting in northern California. J. Clean. Prod. 2015, 99, 217–229. [Google Scholar] [CrossRef]
  47. Tikkanen, L.; Ovaskainen, H.; Palander, T.; Vesa, L. TimberLink as a tool for measuring the fuel consumption of a harvester. In The Nordic-Baltic Conference on Forest Operations—Copenhagen; Suadicani, K., Talbot, B., Eds.; Forest & Landscape Working Papers 30; Forest & Landscape: Aalborg, Denmark, 2008; pp. 70–71. [Google Scholar]
  48. Fan, Y.V.; Perry, S.; Klemeš, J.J.; Lee, C.T. A review on air emissions assessment: Transportation. J. Clean. Prod. 2018, 194, 673–684. [Google Scholar] [CrossRef]
  49. Rodrigue, J.P. The Geography of Transport Systems, 3rd ed.; Routledge: New York, NY, USA, 2013; p. 416. [Google Scholar]
  50. Royne, F.; Penaloza, D.; Sandin, G.; Berlin, J. Climate impact assessment in life cycle assessments of forest products: Implications of method choice for results and decision-making. J. Clean. Prod. 2016, 116, 90–99. [Google Scholar] [CrossRef]
  51. Finlex 407/2013. Valtioneuvoston Asetus Ajoneuvojen Käytöstä Tiellä Annetun Asetuksen Muuttamisesta. 2013. Available online: https://www.finlex.fi/fi/laki/alkup/2013/20130407 (accessed on 22 November 2018).
  52. Ministry of Transport and Communications. Better Competitiveness through New Masses and Dimensions for Heavy Goods Vehicles; Ministry of Transport and Communications: Helsinki, Finland, 2013. Available online: https://vayla.fi/web/en/-/mintc-better-competitiveness-through-new-masses-and-dimensions-for-heavy-goods-vehicles (accessed on 22 November 2018).
  53. Korhonen, J.; Pätäri, S.; Toppinen, A.; Tuppura, A. The role of environmental regulation in the future competitiveness of the pulp and paper industry: The case of the sulfur emissions directive in Northern Europe. J. Clean. Prod. 2016, 108, 864–872. [Google Scholar] [CrossRef]
  54. Finnish Transport Safety Agency (TRAFI). Finnish Road Statistics 2018. Helsinki; 2018. Available online: http://www.trafi.fi/tieliikenne/luvat_ja_hyvaksynnat/hct-rekat (accessed on 22 November 2018).
  55. EUR-Lex. Decision No 1692/96/EC of the European Parliament and of the Council of 23 July 1996 on Community Guidelines for the Development of the Trans-European Transport Network. 1996. Available online: https://eur-lex.europa.eu/legal-content/EN/TXT/?uri=CELEX%3A31996D1692 (accessed on 22 November 2018).
  56. Farahani, N.Z.; Noble, J.S.; Klein, C.M.; Enayati, M. A decision support tool for energy efficient synchromodal supply chains. J. Clean. Prod. 2018, 186, 682–702. [Google Scholar] [CrossRef]
  57. EMSs, European Modular Systems. EU Directive 96/53/EC. 2013. Available online: https://eur-lex.europa.eu/legal-content/EN/TXT/PDF/?uri=CELEX:52013SC0108&from=EN (accessed on 22 November 2018).
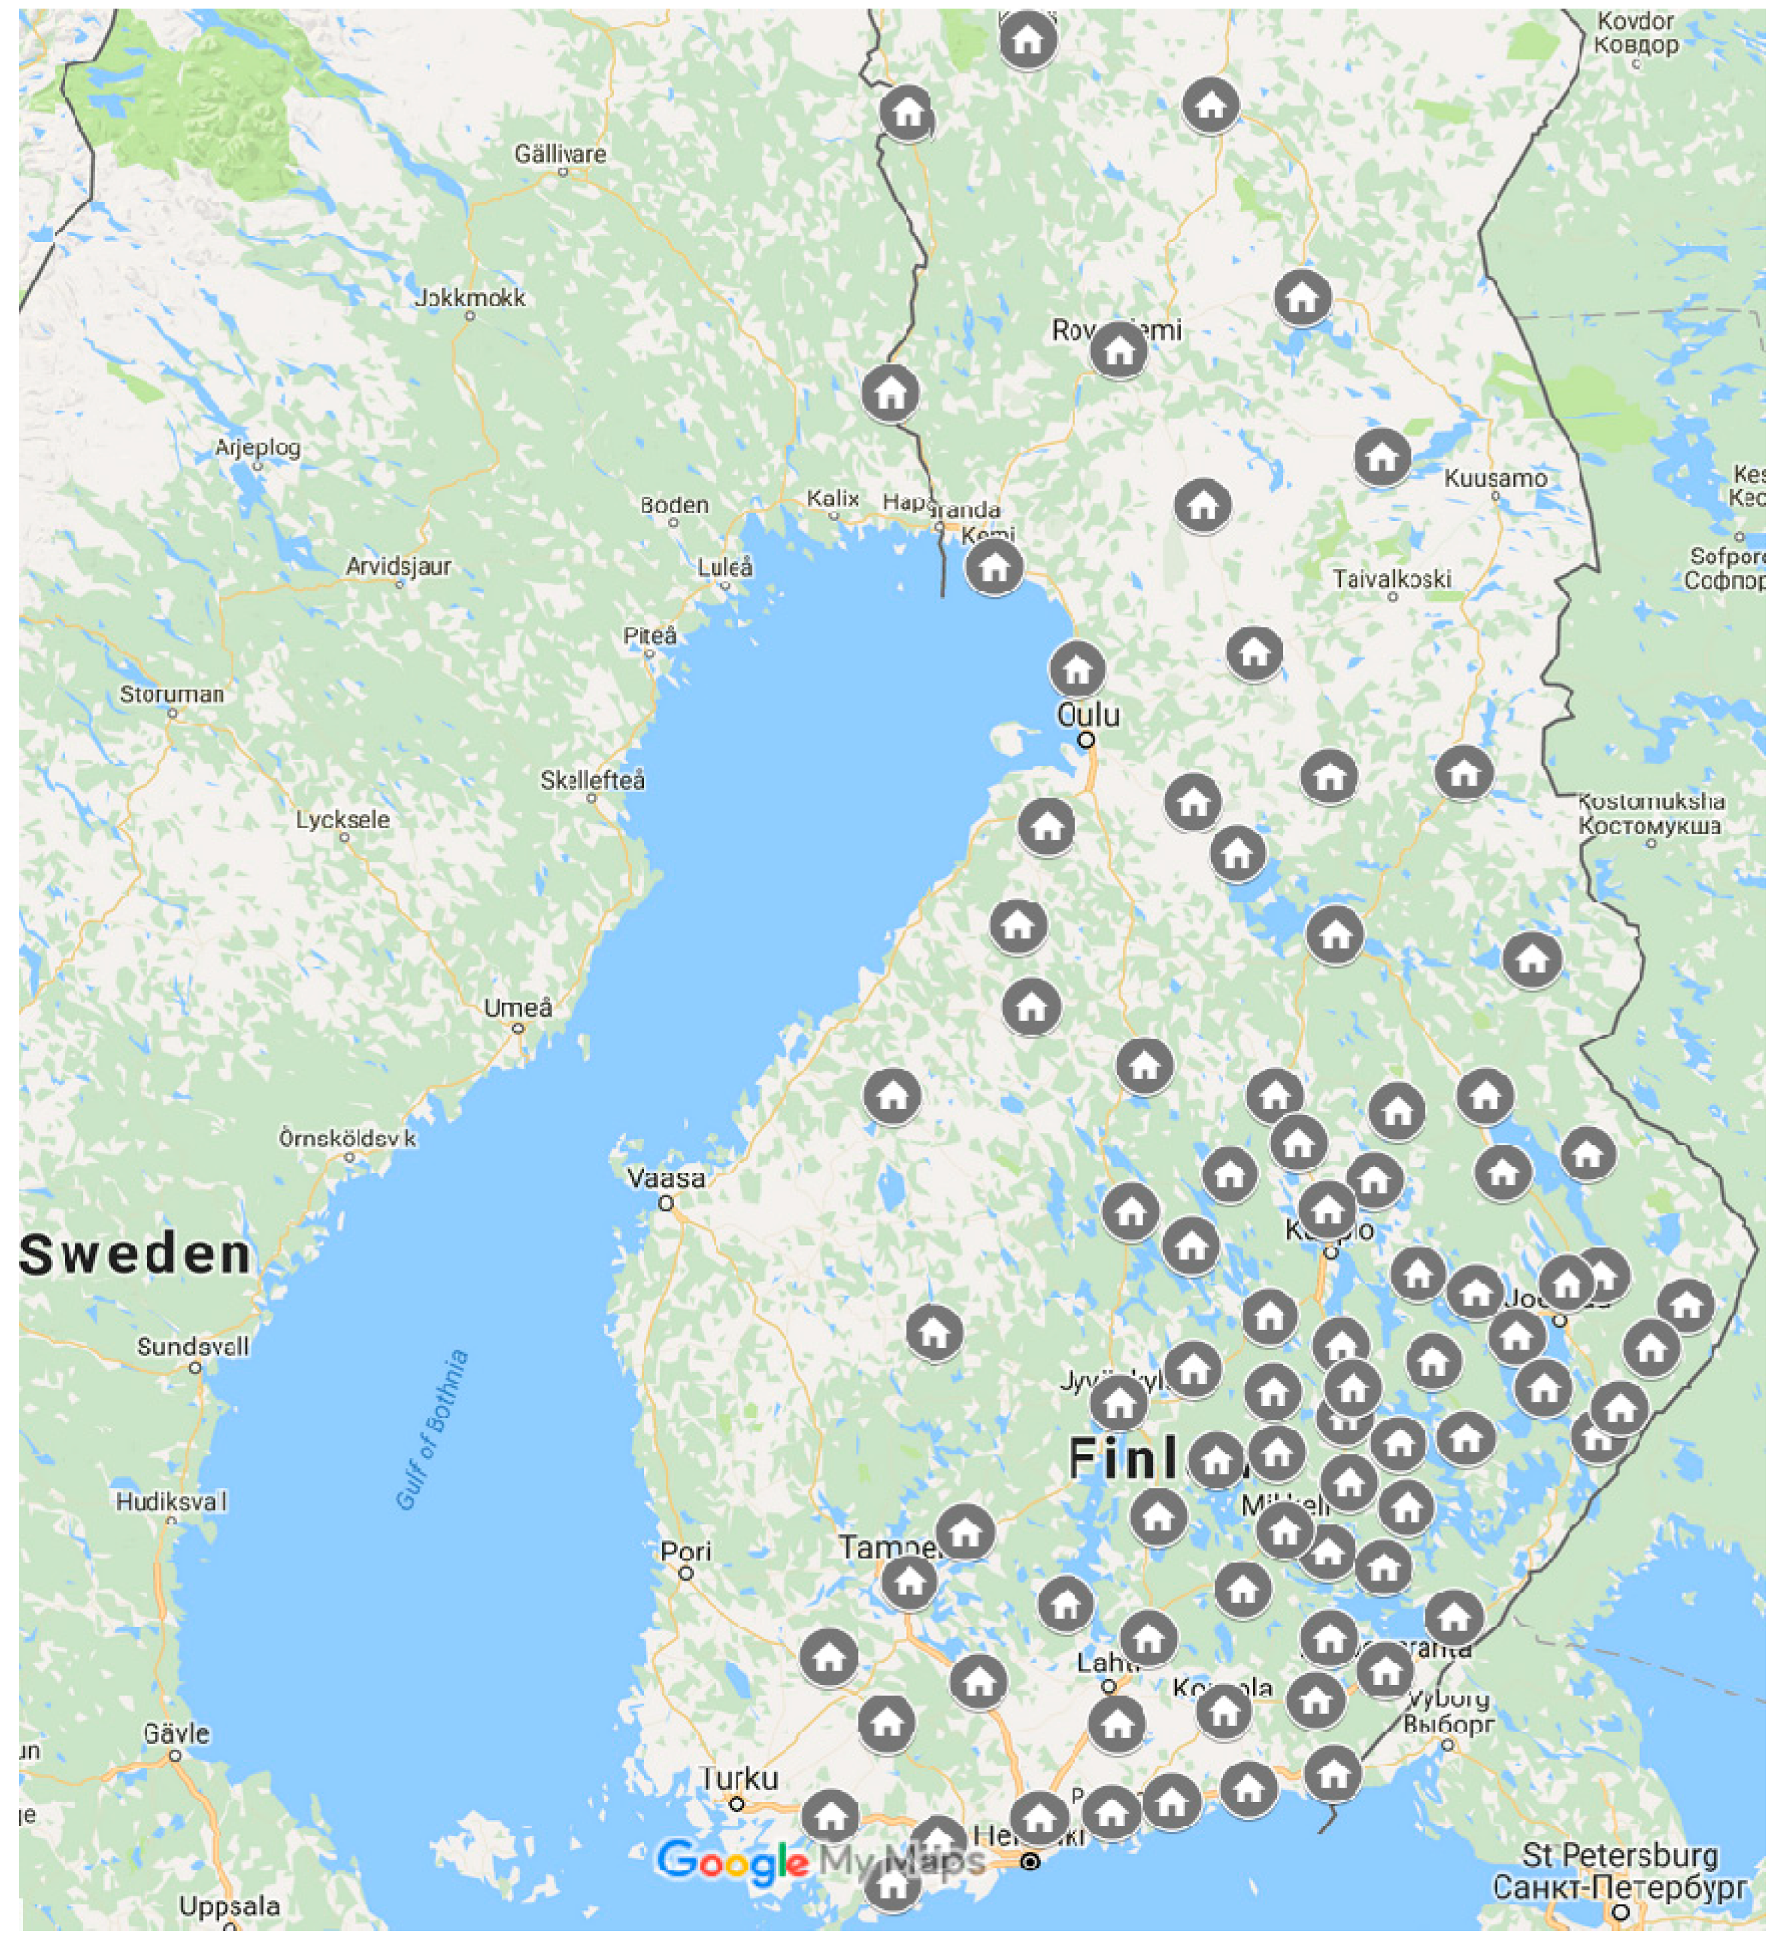
Figure 1. Wood procurement region and office locations of a forest industry company in Finland.
Energies 12 00670 g001
Figure 2. Energy-efficiency criteria of synchronized transportation system (STS). A high-capacity transportation (HCT) fleet of small-scale transportation company (system inputs) generates costs, emissions, revenues and services (system outputs) in STS of the wood procurement organization.
Energies 12 00670 g002
Figure 3. A transportation vehicle (76 t with crane) delivers timber from forest to mills on forest road conditions: (a) mass-constraint payload with short cut-to-length logs on truck load, (b) fully loaded vehicle with long logs on truck load (photos: Joonas Hyypiä (a) and Kalle Kärhä (b)).
Energies 12 00670 g003
Figure 4. Average fuel consumption of timber transportation vehicles.
Energies 12 00670 g004
Figure 5. The group transportation method of timber. A 64 t vehicle operates on forest roads for delivering a fully loaded trailer (1) from forest to local terminal, and loads ≥76 t vehicles (3,4,5) from truck (2) or terminal’s piles, and takes an empty trailer (4) back to forest; ≥76 t vehicles deliver loads from terminals to mills.
Energies 12 00670 g005
Figure 6. Highway network in Finland [54].
Energies 12 00670 g006
Figure 7. HCTs (76 t with crane) need larger turning places on forest roads (photo: Markus Strandström).
Energies 12 00670 g007
Figure 8. Flowchart of the energy efficiency analysis of the synchronized transportation system: ERP = enterprise resource planning data, HCT = 64, 68 and 76 t, FMO = fleet-management option, MPW = legal maximum payload weight (LPW) ratios of HCT with legal maximum payload weight of LPW76, CLV = change in total laden-vehicle-kilometres (LVKM) with legal maximum loads, PTC = potential total change in empty-vehicle-kilometres (EVKM) and laden-vehicle-kilometres with legal maximum loads, LF = load factor ratios of HCT between payload weights (PW) and legal maximum loads (LPW), RC = reduced total change with different load factors for mass-constraint loads, FC = fuel consumption, EF = energy factors and EE = energy efficiency: i = 1,2,3; 1 = 64 t, 2 = 68 t, 3 = 76 t.
Energies 12 00670 g008
Figure 9. Energy efficiency of the timber transportation fleet (tkm·L−1). The vehicle combinations (64, 68 and 76 t) are managed using TFMC A, B and C for driving on forest roads: A = 40, 4 and 2% for 64, 68 and 76 t vehicles, respectively; B = 15, 15 and 15%, respectively; and C = 5, 5 and 5%, respectively.
Energies 12 00670 g009
Table 1. Changes in maximum mass (t) and number of axles for vehicle combinations in Finland (adapted from [11]).
Old Mass LimitNew Mass LimitAxlesNew PayloadPayload Increase (%)Decree of Change
6060 (64)74410Temporary
606884718Permanent
607695435Permanent
6090126563Temporary (*
60104137280Temporary (*
(* temporary mass increase is in force until the end of the traffic license.
Table 2. Road-freight transportation data in 2016. The maximum mass limit of HCT, average timber quantity, quantitative difference between empty vehicle distance and laden vehicle distance, difference in load factor, number of trips and the average mass of the empty vehicle combinations.
Maximum Mass Limit (kg)QuantityEmpty RunningLoad FactorTripsVehicleTruckTrailer
(tkm/1000)(km)(%)(t)(%)(kg)
64,00032,168+16,116+7.5+1860+4.519,80019,78812,3197469
68,000173,112+46,939+0.5+1343+2.970,80020,45912,1658294
76,000441,079−235,160−1.5−1352−2.7121,60021,73013,3308400
Table 3. The transportation quantities (RC) of the vehicle combinations (64, 68 and 76 t) due to three fleet-management methods for travelling on forest roads: A = 40, 4 and 2% for 64, 68 and 76 t, respectively; B = 15, 15 and 15%, respectively; and C = 5, 5 and 5%, respectively. F = forest roads and roads with speed <60 km/h, H = Highways and other roads with speed ≥60 km/h.
Maximum Mass Limit (t)ABC
FHFHFH
64241,952362,92890,732514,14830,244574,636
68129,5423,109,004485,7822,752,764161,9273,076,619
76120,5285,905,853903,9575,122,423301,3195,725,061
Total mass (t)492,0229,377,7851,480,4718,389,336493,4909,376,317
Table 4. Energy efficiency of timber transportation (EURO-0 and EURO-VI engines) for diesel fuel consumption (L) and environmental emissions in respect to the distance travelled in the STS. The vehicle combinations (64, 68 and 76 t) are managed using TFMC A, B and C for driving on forest roads: A = 40, 4 and 2% for 64, 68 and 76 t vehicles, respectively; B = 15, 15 and 15%, respectively; and C = 5, 5 and 5%, respectively. Emissions include carbon dioxide (CO2), sulphur dioxide (SO2), nitrogen oxides (NOx), particulate matter (PM), carbon monoxide (CO), hydrocarbons (HC), water (H2O), methane (CH4).
EmissionsABC
646876646876646876
EURO-0 (kg)
CO21,949,1998,270,40815,803,2841,715,1199,018,89017,352,5261,708,3958,690,6051,6776,675
SO2291252362613525926130251
NOx20,44086,727165,72017,98694,576181,96617,91591,134175,928
PM11,52748,91093,45910,14353,337102,62110,10351,39699,216
CO2289971618,565201510,59520,384200710,20919,708
HC391916,63031,776344918,13534,891343517,47533,733
H2O582474735127051951260502
CH4131130424911161422273526913702645
EURO-VI (kg)
CO21,948,7738,268,59815,799,8261,714,7449,016,91617,348,7281,708,0218,688,70316,773,003
SO20.62.44.60.52.65.10.52.54.9
NOx663.82816.75382.2584.13071.65909.9581.82959.85713.7
PM95.9406.9777.484.4443.7853.684.0427.5825.3
CO7.431.359.86.534.165.76.532.963.4
HC44.3187.8358.838.9204.8394.038.8197.3380.9
H2O0.62.44.60.52.65.10.52.54.9
CH40.62.44.60.52.65.10.52.54.9
Fuel (L)737,6133,129,6745,980,252649,0333,412,9136,566,513646,4883,288,6846,348,601
Distance (km)973,1404,875,9819,093,960973,1404,875,9819,093,960973,1404,875,9819,093,960