1. Introduction
The global wind power market remained above 50 GW in 2017. Total installations in 2017 were 52,492 MW, bringing the global total to 539,123 MW. The annual market was in fact down 3.8% on from 2016’s 54,642 MW, while the cumulative total was up 11% over 2016’s year-end total of 487,279 MW. Today we have commercial wind operations in more than 90 countries around the world, nine of them, including China, the US, Germany, India, Spain, the UK, France, Brazil and Canada, with more than 10,000 MW. Thirty countries across Europe, Asia, North America, Latin America and Africa have more than 1000 MW [
1].
Wind power generation is one of the most mature and large-scale developments in new energy generation technologies. However, due to the randomness and volatility of wind power, and lack of the frequency regulation capability, the large-scale high penetration wind power integration is adverse to the frequency stability of the power system. For this reason, the world’s major developed wind power countries and regions have standardized the frequency regulation capability of wind power by the grid code and make explicit requirements [
2,
3].
At present, DFIG is the trunk stream model of a large-scale wind farm [
4]. In the traditional control mode, the DFIG operates at the maximum power point tracking (MPPT) mode, with only downward regulation capability (regulating the positive frequency difference), and cannot regulate in two directions. At present, there are three control methods for DFIGs participating in primary frequency regulation, including virtual inertia control, rotor speed control and pitch control. References [
5,
6,
7] studied the virtual inertial control of the WT and realize the virtual inertial response of the system. It is verified that the virtual inertial control reduces the frequency fluctuation and improves the system frequency transient stability. References [
8,
9] pointed out that the WT can only participate in frequency regulation for a short time by the virtual inertia control, because there is no reserved power in the WT, so it is impossible to support system frequency in a long term. References [
10,
11,
12,
13] verified that the WT can realize the system primary frequency regulation under the rotor speed control strategy, so the problem that the WT can only participate in the short term frequency regulation and easily cause secondary frequency drops under the traditional inertial control is avoided. References [
14,
15,
16,
17] studied the frequency control method of the WT based on pitch control, and verified the effectiveness of the method.
The virtual inertial control uses the rotor’s kinetic energy to provide an inertial response, which has the advantage of quick response to any system frequency changes. However, after the inertial response, the wind power will be lower than the initial value as the speed decreases, which increases the additional demand for regulation power [
18]. For this reason, this paper does not consider the virtual inertia control frequency regulation method. Rotor speed control is based on the control technology of the converter. The control speed is faster than pitch control, but it is limited by the rated rotor speed, which is applicable to the below-rated wind speeds [
19,
20]. The pitch control is applicable to a wide range of wind speeds, but the pitch actuator is a mechanical component, which frequent use will aggravate the mechanical losses, increase overhaul costs and reduce the service life of the WT [
21,
22,
23]. Therefore, based on the principle of giving full play to the role of rotor speed regulation and minimizing the frequency and amplitude of pitch angle action, a rotor speed and pitch coordinated control strategy with different wind speeds is designed in this paper.
Most related studies by domestic and foreign scholars are on the dynamic response of the WT participating in frequency regulation at a certain wind speed, when a single frequency disturbance occurs. This verifies the feasibility of the WT participating in the system frequency regulation. However, the system frequency regulation is a long term dynamic process, so it is necessary to investigate the capacity and effects of the WT participating in frequency regulation under continuous frequency disturbance conditions. Therefore, this paper studies the bidirectional power constraints under the rotor speed frequency regulation, and the time scale constraints under the pitch frequency regulation of the WT. The effects of regulation power constraints on the WT participating in frequency regulation during the long term frequency regulation process is pointed out. The rotor speed and pitch coordinated control strategy with different wind speeds is proposed. Based on 24-hour measured data of a wind farm, the bidirectional regulation power constraints and its effects are simulated and analyzed in the continuous frequency disturbances process. The research of this paper provided a theoretical basis for WTs participating in the long term continuous frequency regulation, especially for the primary frequency regulation research of high penetration wind power system.
2. Mathematical Model of DFIG
The expression of the WT mechanical power
Pm is as follows [
24,
25]:
where
ρ is the air density;
S is the rotor sweep area;
v is the wind speed and
CP is the wind energy utilization coefficient.
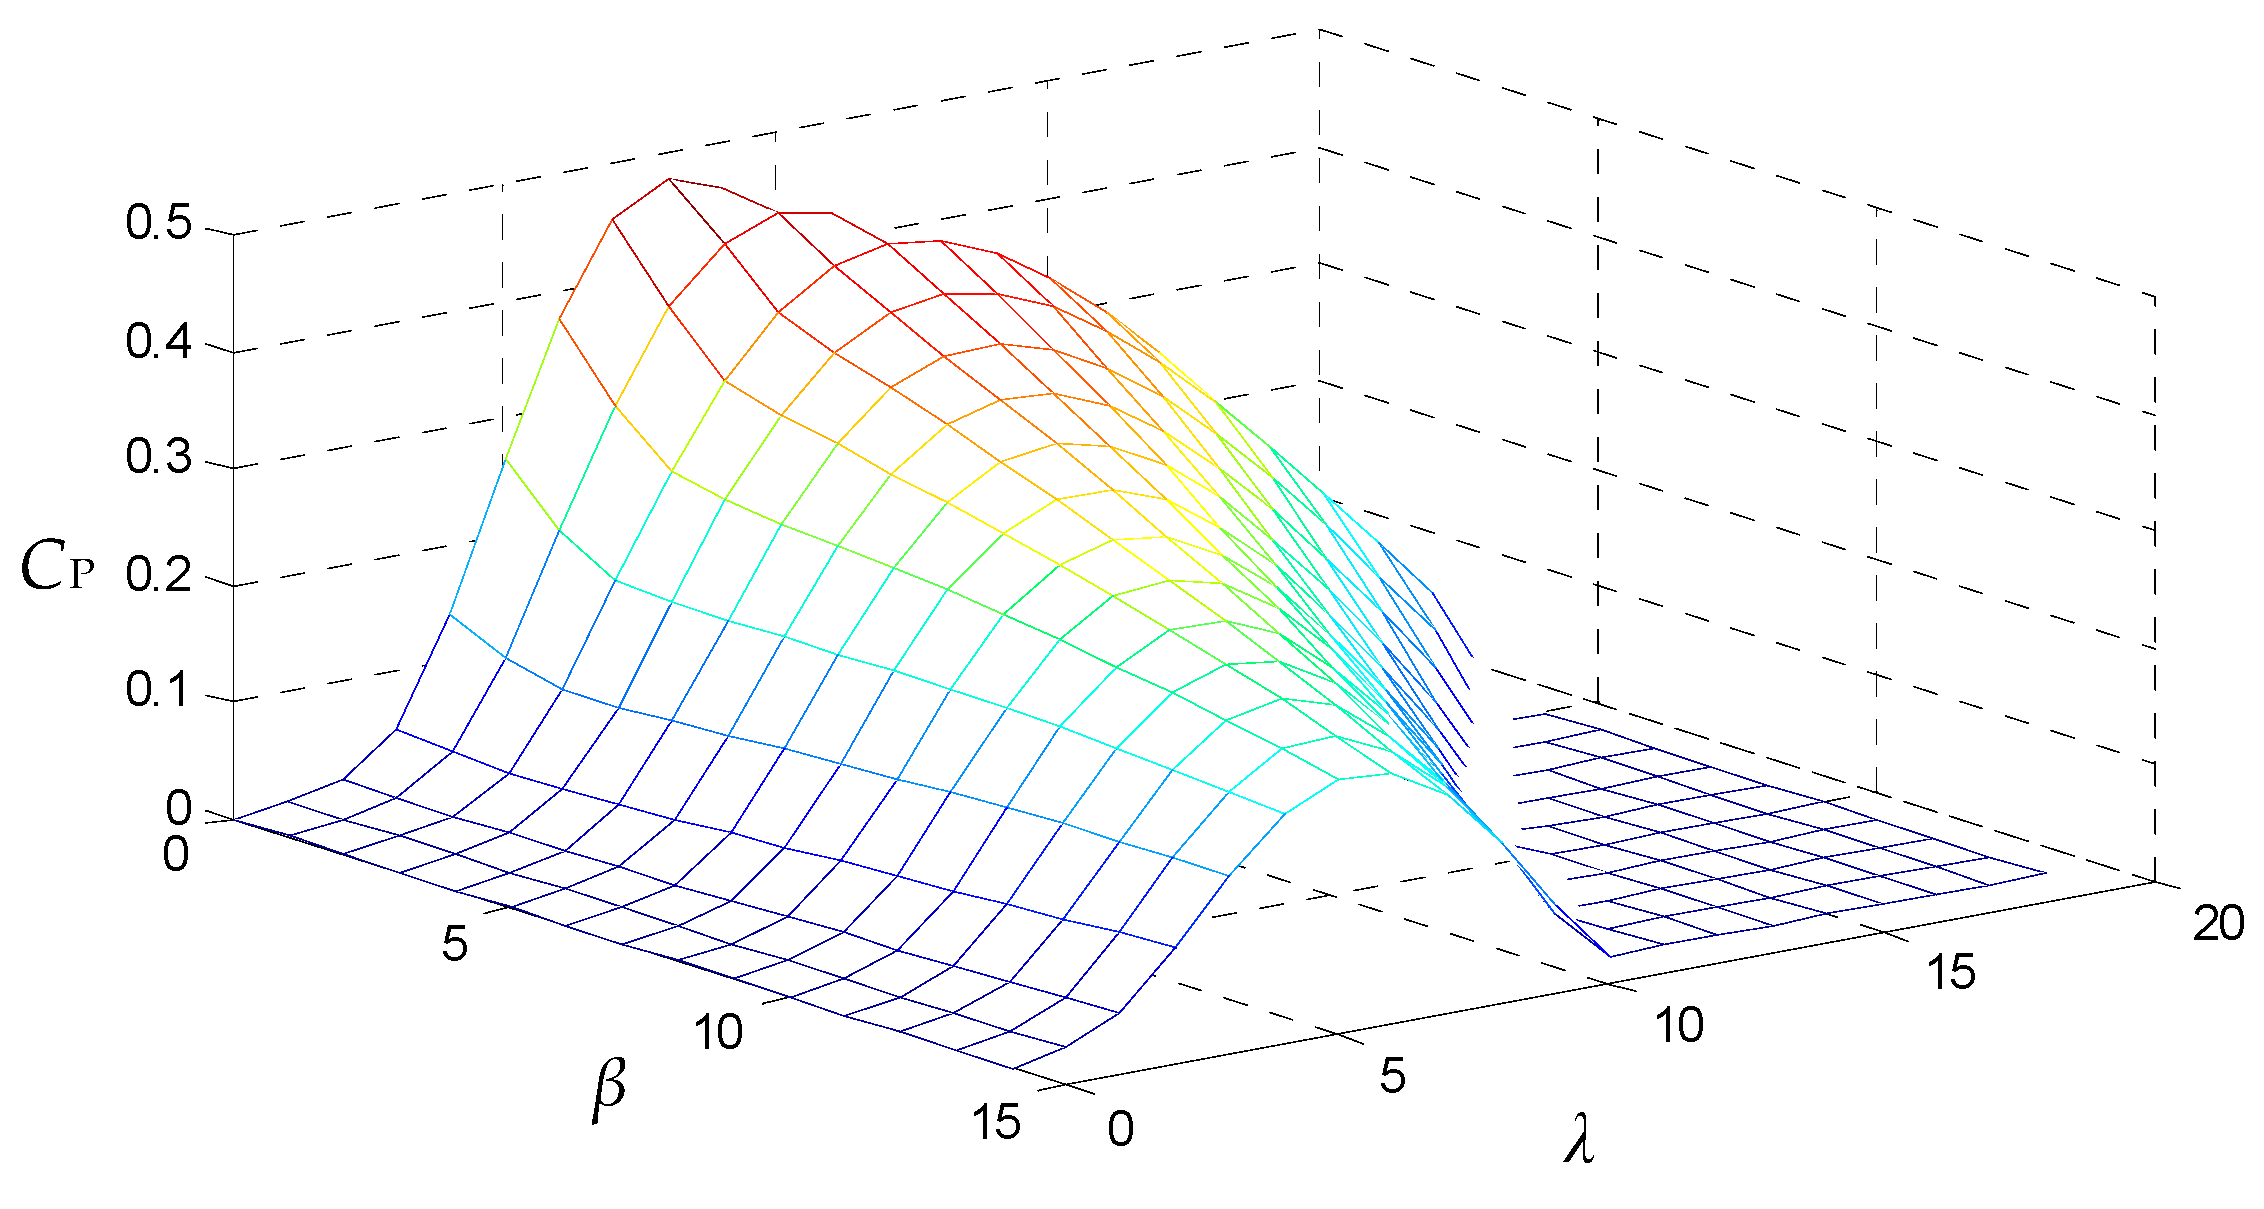
Under a certain wind speed, the mechanical power of the WT is determined by
CP, which is a function of the tip speed ratio
λ and the pitch angle
β. It is approximated by the following equation [
26]:
where
λi is intermediate variables;
c1–
c8 are polynomial coefficients. The values of
c1–
c8 of FD-77-1500III DFIG after fitting and setting are
c1 = 0.5176,
c2 = 116,
c3 = 0.4,
c4 = 5,
c5 = 21,
c6 = 0.0068,
c7 = 0.08,
c8 = 0.035, respectively.
CP curves are shown in
Figure 1. When
β is constant, there is an optimal tip speed ratio which maximizes the
CP value.
The tip speed ratio λ is defined as the ratio of the tip circumferential velocity of the WT blade to the wind speed, which is given by [
27]:
where
ωr is the angular frequency of WT;
R is the radius of WT.
In the traditional control mode, the value of ωr is changed so that the ratio of ωr to v is maintained at optimal tip speed ratio to achieve maximum captured power at different wind speeds.
3. Analysis of Frequency Regulation Method of DFIG with Different Wind Speeds
3.1. Conditions of DFIG Participating in Bidirectional Frequency Regulaiton
The DFIG has no reserve active power, and cannot regulate upwards the frequency of the system under the traditional control mode. The WT participating in the bidirectional frequency regulation is bound to reduce the initial operation point, then reserve part of power to provide bidirectional frequency support for the system. As shown in Equations (1)–(3), changing CP can adjust the mechanical power of the WT. CP is a function of ωr and β, therefore, adjusting ωr and β can change the WT output power, and then the WT achieves bidirectional regulation capability.
When the wind speed is
v, the power reservation coefficient
d can be expressed as:
where:
PWopt(
v) is the maximum captured power at the wind speed
v,
PWre(
v) is the initial operation power at the wind speed
v.
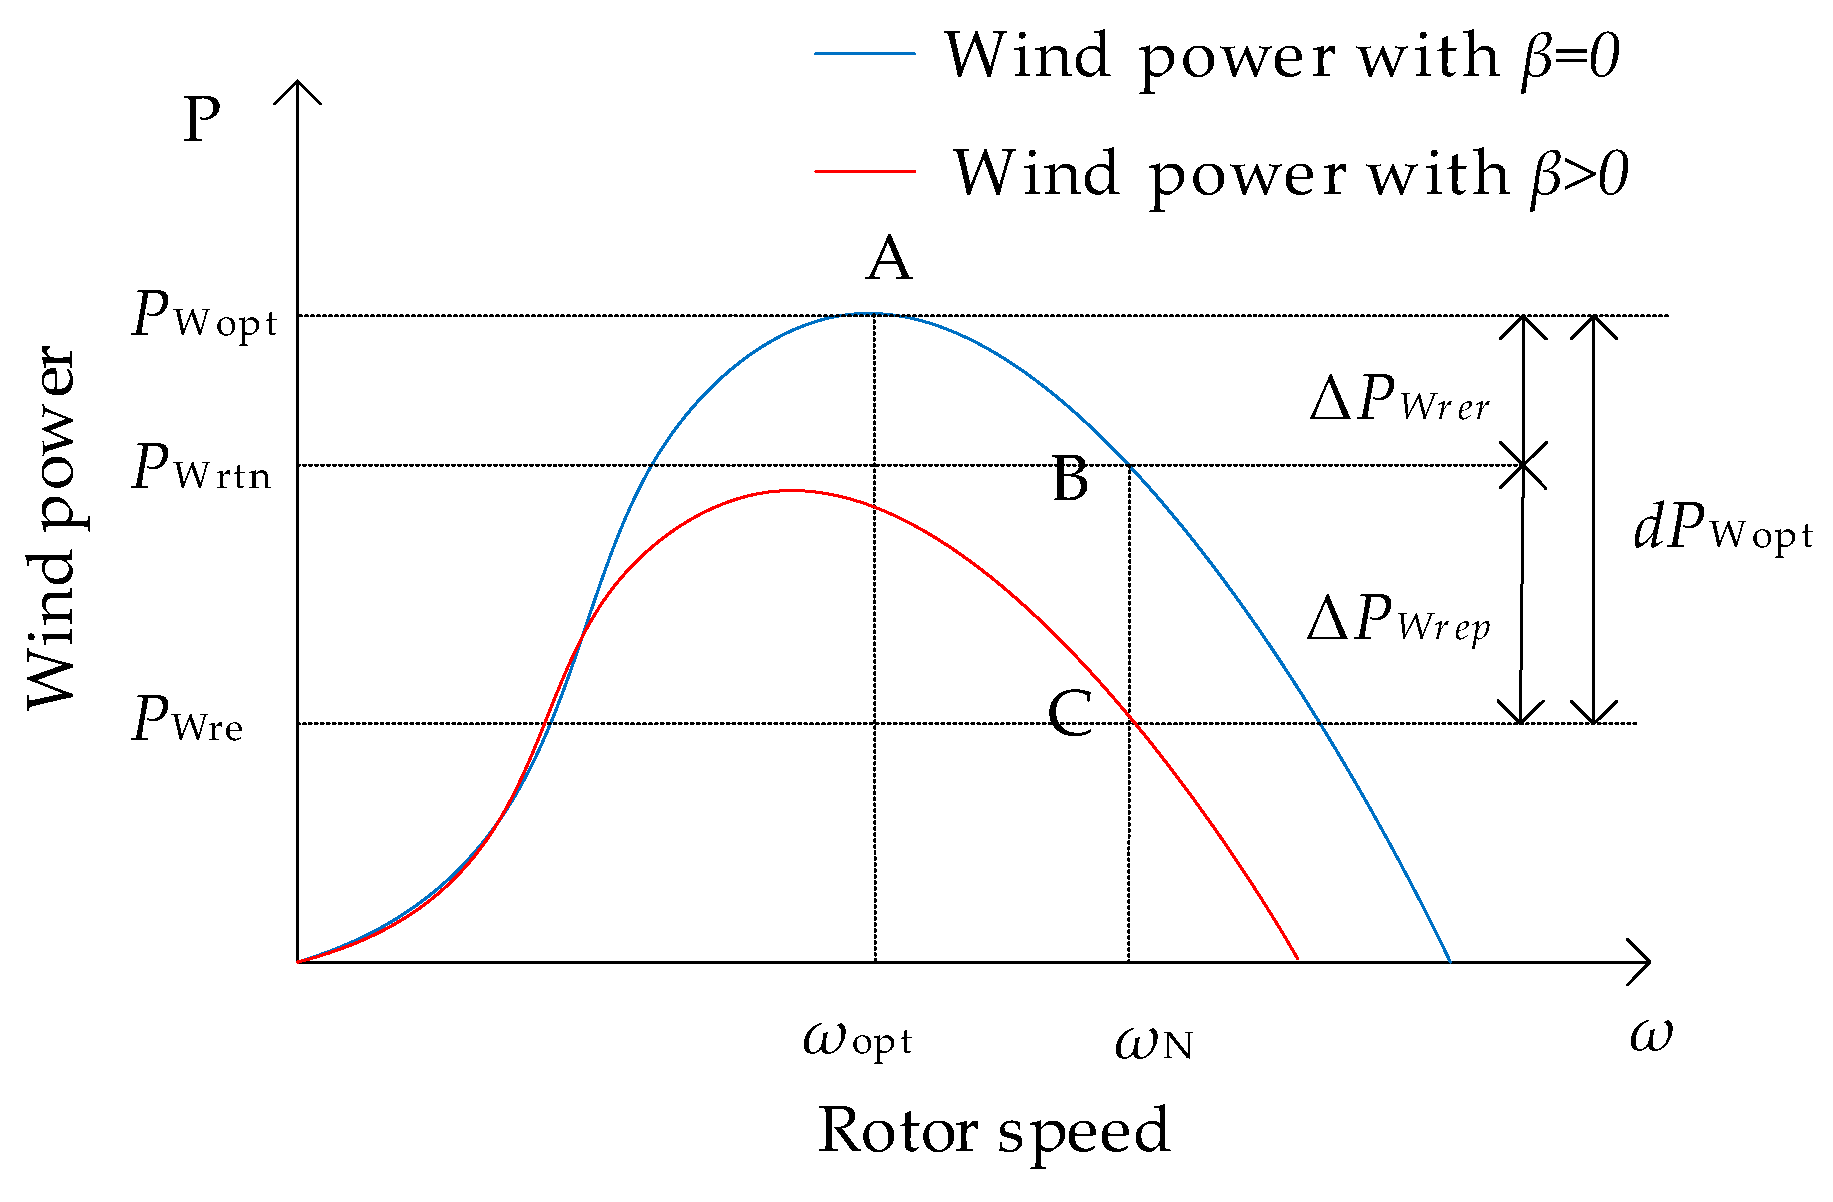
With the WT is operating in maximum power tracking area as an example, the schematic diagram of the WT deloading operation at wind speed
v is shown in
Figure 2: The maximum power point is at point A, the corresponding rotor speed is
ωopt and the output power is
PWopt. When the rotor overspeeds to point B, the rotor speed reaches the rated rotor speed
ωN, and the output power is
PWrtn, then the reservation power is Δ
PWrer. In order to further increase the reservation power to get the
d level, adjust the pitch angle to be greater than 0
o, then the WT operates to point C, and the additional reservation power is Δ
PWrep through the pitch regulation. Therefore, under different wind speeds,
PWre(
v) can be expressed as:
If the WT operates at low wind speeds, the rotor speed regulation is sufficient to reach the power reservation coefficient level, then ΔPWrep(v) = 0. If the WT operates in a constant speed area or constant power area, the rotor speed has reached the rated rotor speed, and the rotor over-speed operation cannot reserve power, in this case ΔPWrer(v) = 0.
3.2. Bidirectional Regulation Power Constraints under Rotor Speed Regulation
As shown in Equations (2) and (3), the WT output power is a function of
ω and
β at a certain wind speed, it can be expressed as
f(
ω,
β). When the WT participates in the frequency regulation through rotor speed regulation, the regulation power is Δ
PWfr(
v), and the corresponding rotor speed
ωr is:
where
Cpmax is the wind energy utilization coefficient when the WT operates in the MPPT mode.
Cpr is the wind energy utilization coefficient after the WT regulates the frequency through rotor speed regulation. Due to the self-operating characteristics of the WT, the regulation power Δ
PWfr(
v) under rotor speed regulation is constrained. The specific constraints are analyzed as follows.
As shown in
Figure 2, the available regulation power is constrained by the rated speed through rotor speed regulation. With the different wind speeds, the maximum regulation power Δ
Pos(
v) under the rotor speed regulation is expressed as:
The available upward regulation power Δ
PWup(
v) and the available downward regulation power Δ
PWdn(
v) of the WT are constrained by Δ
Pos(
v), the constraints are as follows:
When the power reservation coefficient is
d, Δ
PWup(
v) and Δ
PWdn(
v) are expressed as:
As shown in Equations (8) and (9): The WT reserves power and have the available upward regulation power (supporting the negative frequency difference events of the system), but at the same time, it reduces the available downward regulation power and weakens the ability of regulating the positive frequency difference events of the system.
The optimal rotor speed of the WT is close to the rated speed at high wind speeds, and the reservation power cannot get the power reservation coefficient
d level through the rotor speed regulation. At this time, Δ
PWup(
v) and Δ
PWdn(
v) are expressed as:
Equation (10) shows that the reservation power is the maximum regulation power, and the available downward regulation power is zero at high wind speeds. In this case, as the power reservation coefficient increases, the wind speed interval without available downward regulation power will increase. If a positive frequency difference event occurs at this time, the WT cannot participate in the frequency regulation and cause the loss of reservation power.
The above analysis indicates that the available upward and downward regulation power are constrained by the maximum regulation power and the power reservation coefficient. Therefore, the bidirectional regulation power constraints should be taken into account when designing the power reservation coefficient.
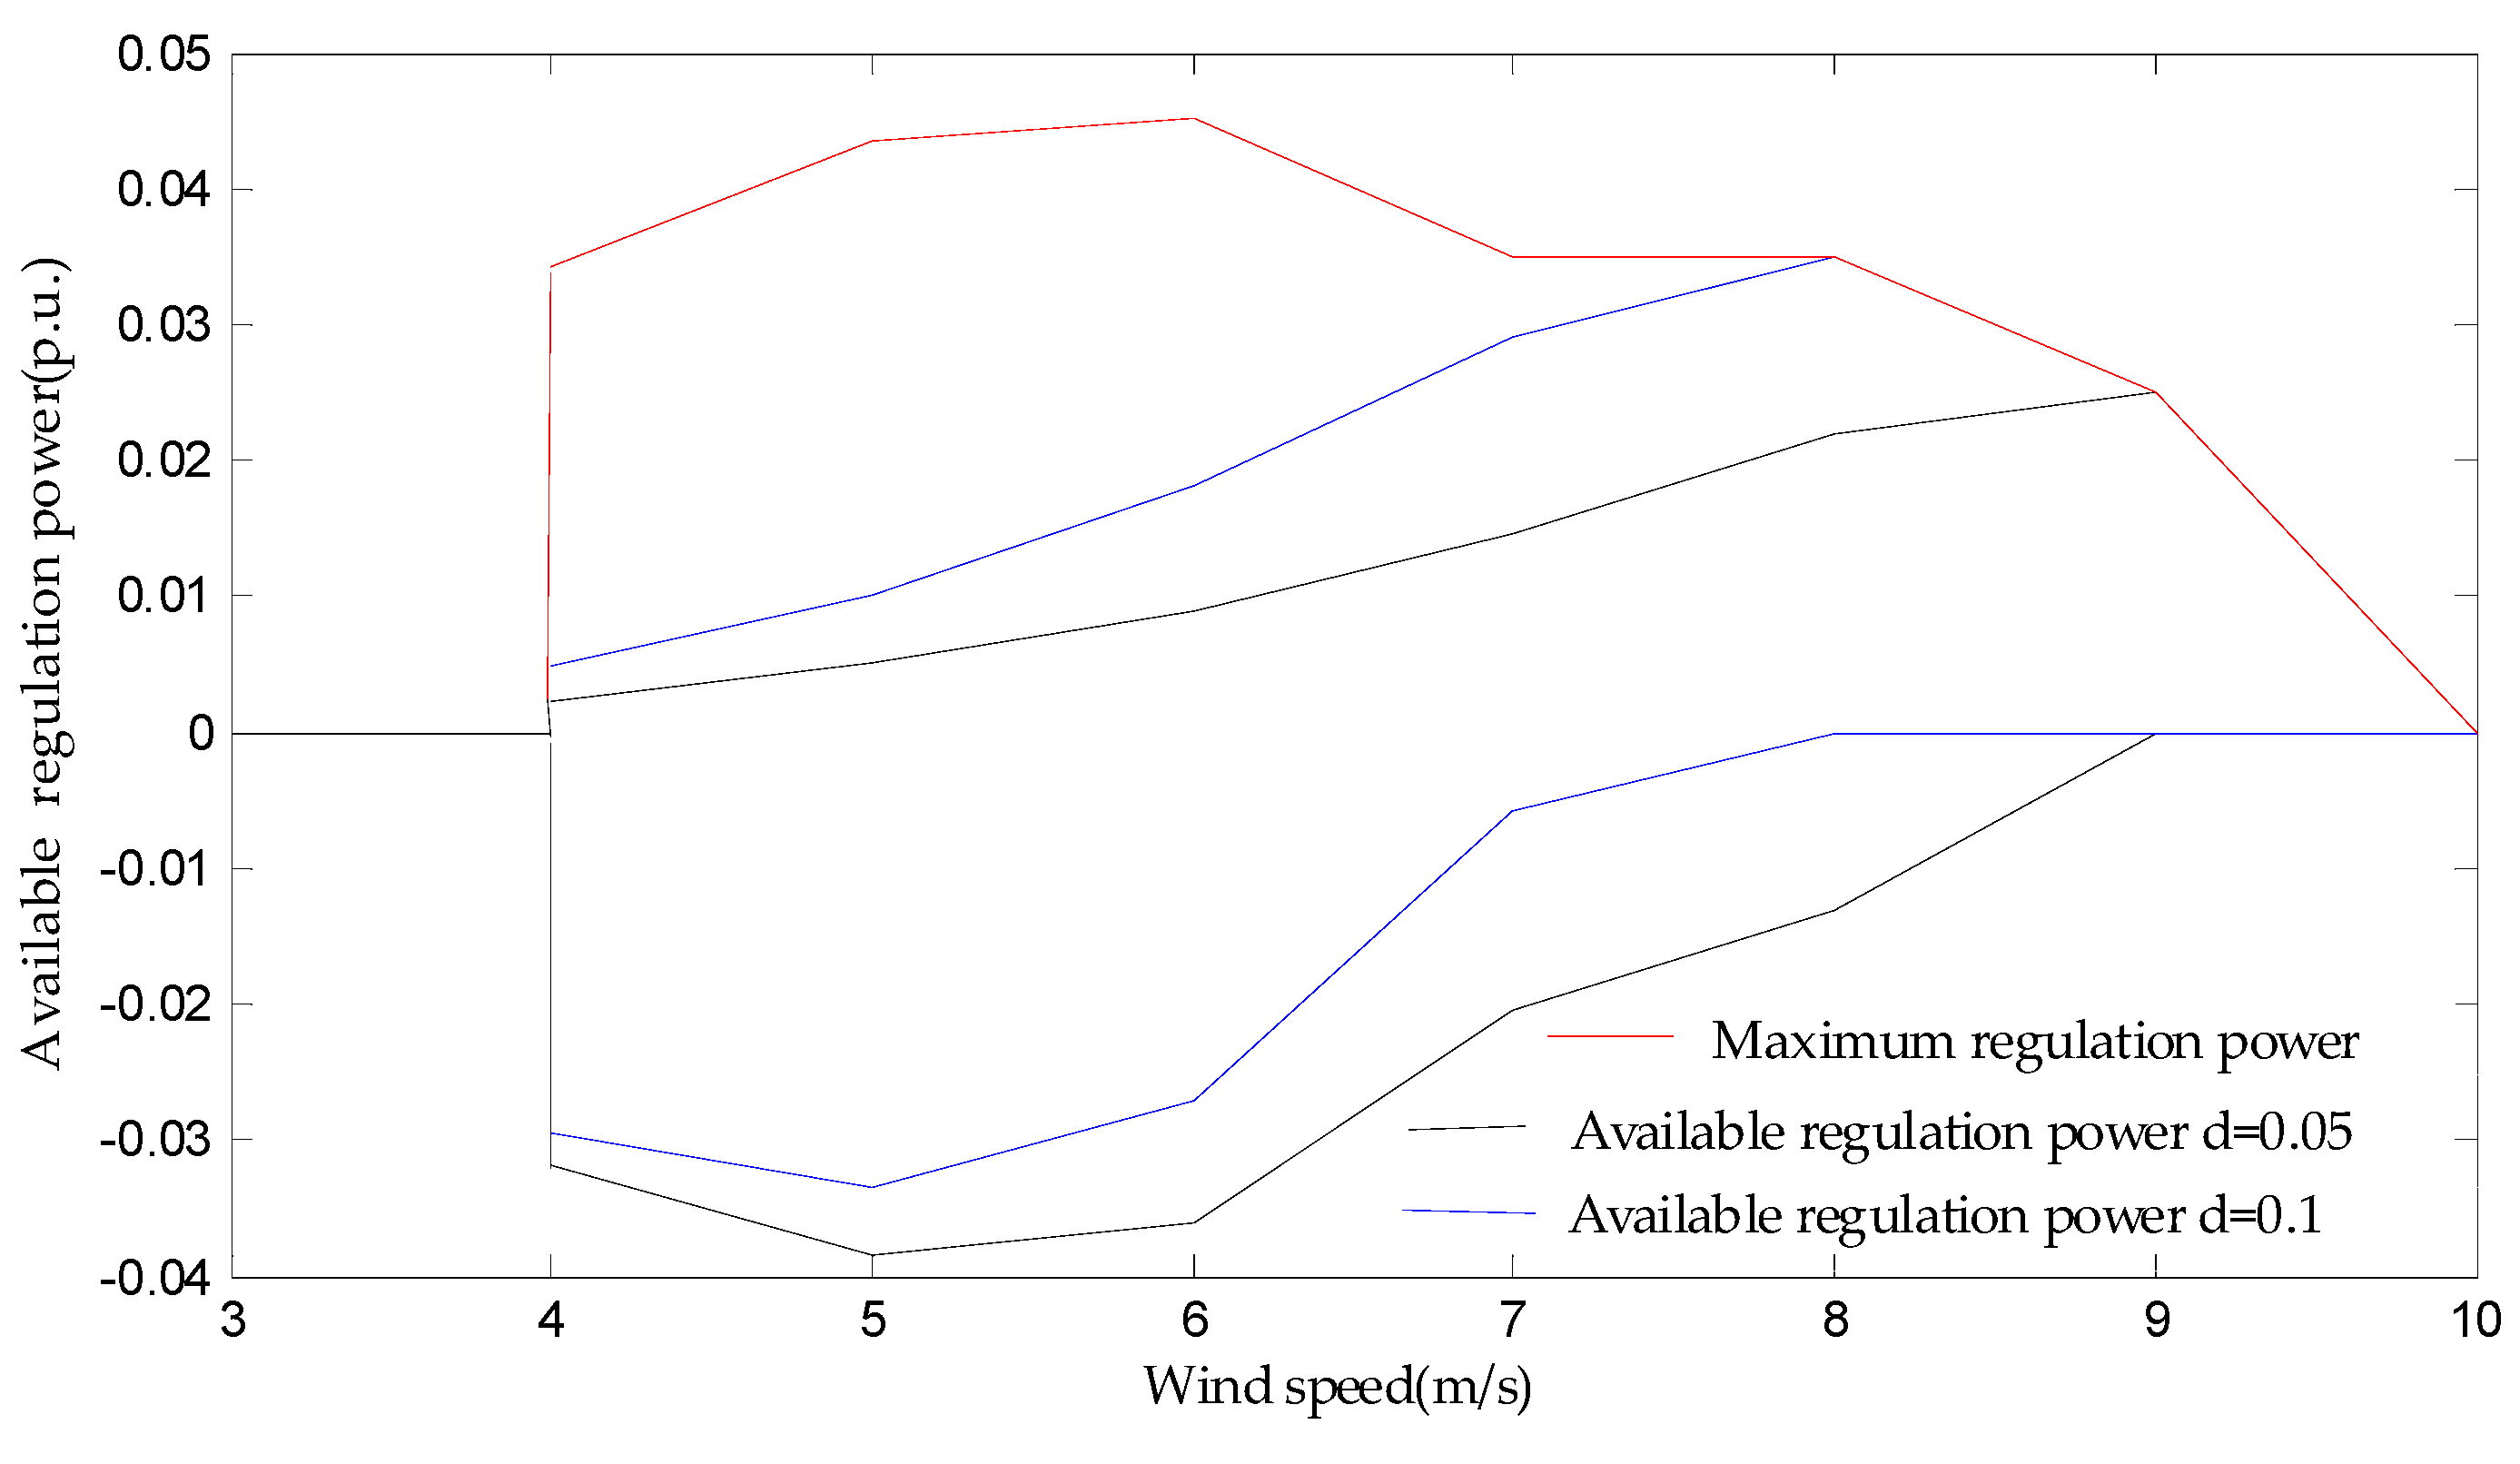
The available regulation power of the FD-77-1500III DFIG with different reservation coefficients is shown in
Figure 3. When the wind speed is 6 m/s, the maximum regulation power is the largest (0.044 p.u.). When the wind speed is greater than 8 m/s, the maximum regulation power is significantly reduced, and the frequency regulation capability is reduced. The available upward and downward regulation power are related to the wind speed and the reservation coefficient. At a certain wind speed, the larger the reservation coefficient is, the lower the available downward regulation power is.
3.3. Regulation Power Constraints under Pitch Regulation
The above analysis shows that the available bidirectional regulation power of the WT obtained by the rotor speed regulation is small at medium wind speeds, and in order to get larger regulation power, the pitch angle should be adjusted to meet the demand of larger regulation power. At high wind speeds, it is impossible to get bidirectional regulation power through rotor speed regulation, in this case, the pitch regulation should be adopted.
The rotor speed has reached
ωN when the pitch is regulated. When the regulation power is Δ
Pwfp(
v) through the pitch regulation, the calculation of pitch angle
β is as follows:
where
Cpp is the wind energy utilization coefficient after rotor speed and pitch angle regulation.
The pitch angle adjustment of DFIG is accomplished by a hydraulic pitch actuator. The pitch action has a certain degree of hysteresis, which leads to a certain delay in primary frequency regulation with pitch regulation. At present, the delay of hydraulic pitch mechanism has not exceeded 1 s, the pitch speed can reach 5°/s under the maximum load [
28]. The duration of primary frequency regulation of the power system is 10–30 s [
29]. In order to meet the primary frequency regulation requirements of the power system on the time scale, it is necessary to avoid the excessive regulation of pitch angle, which will lead to regulation time too long.
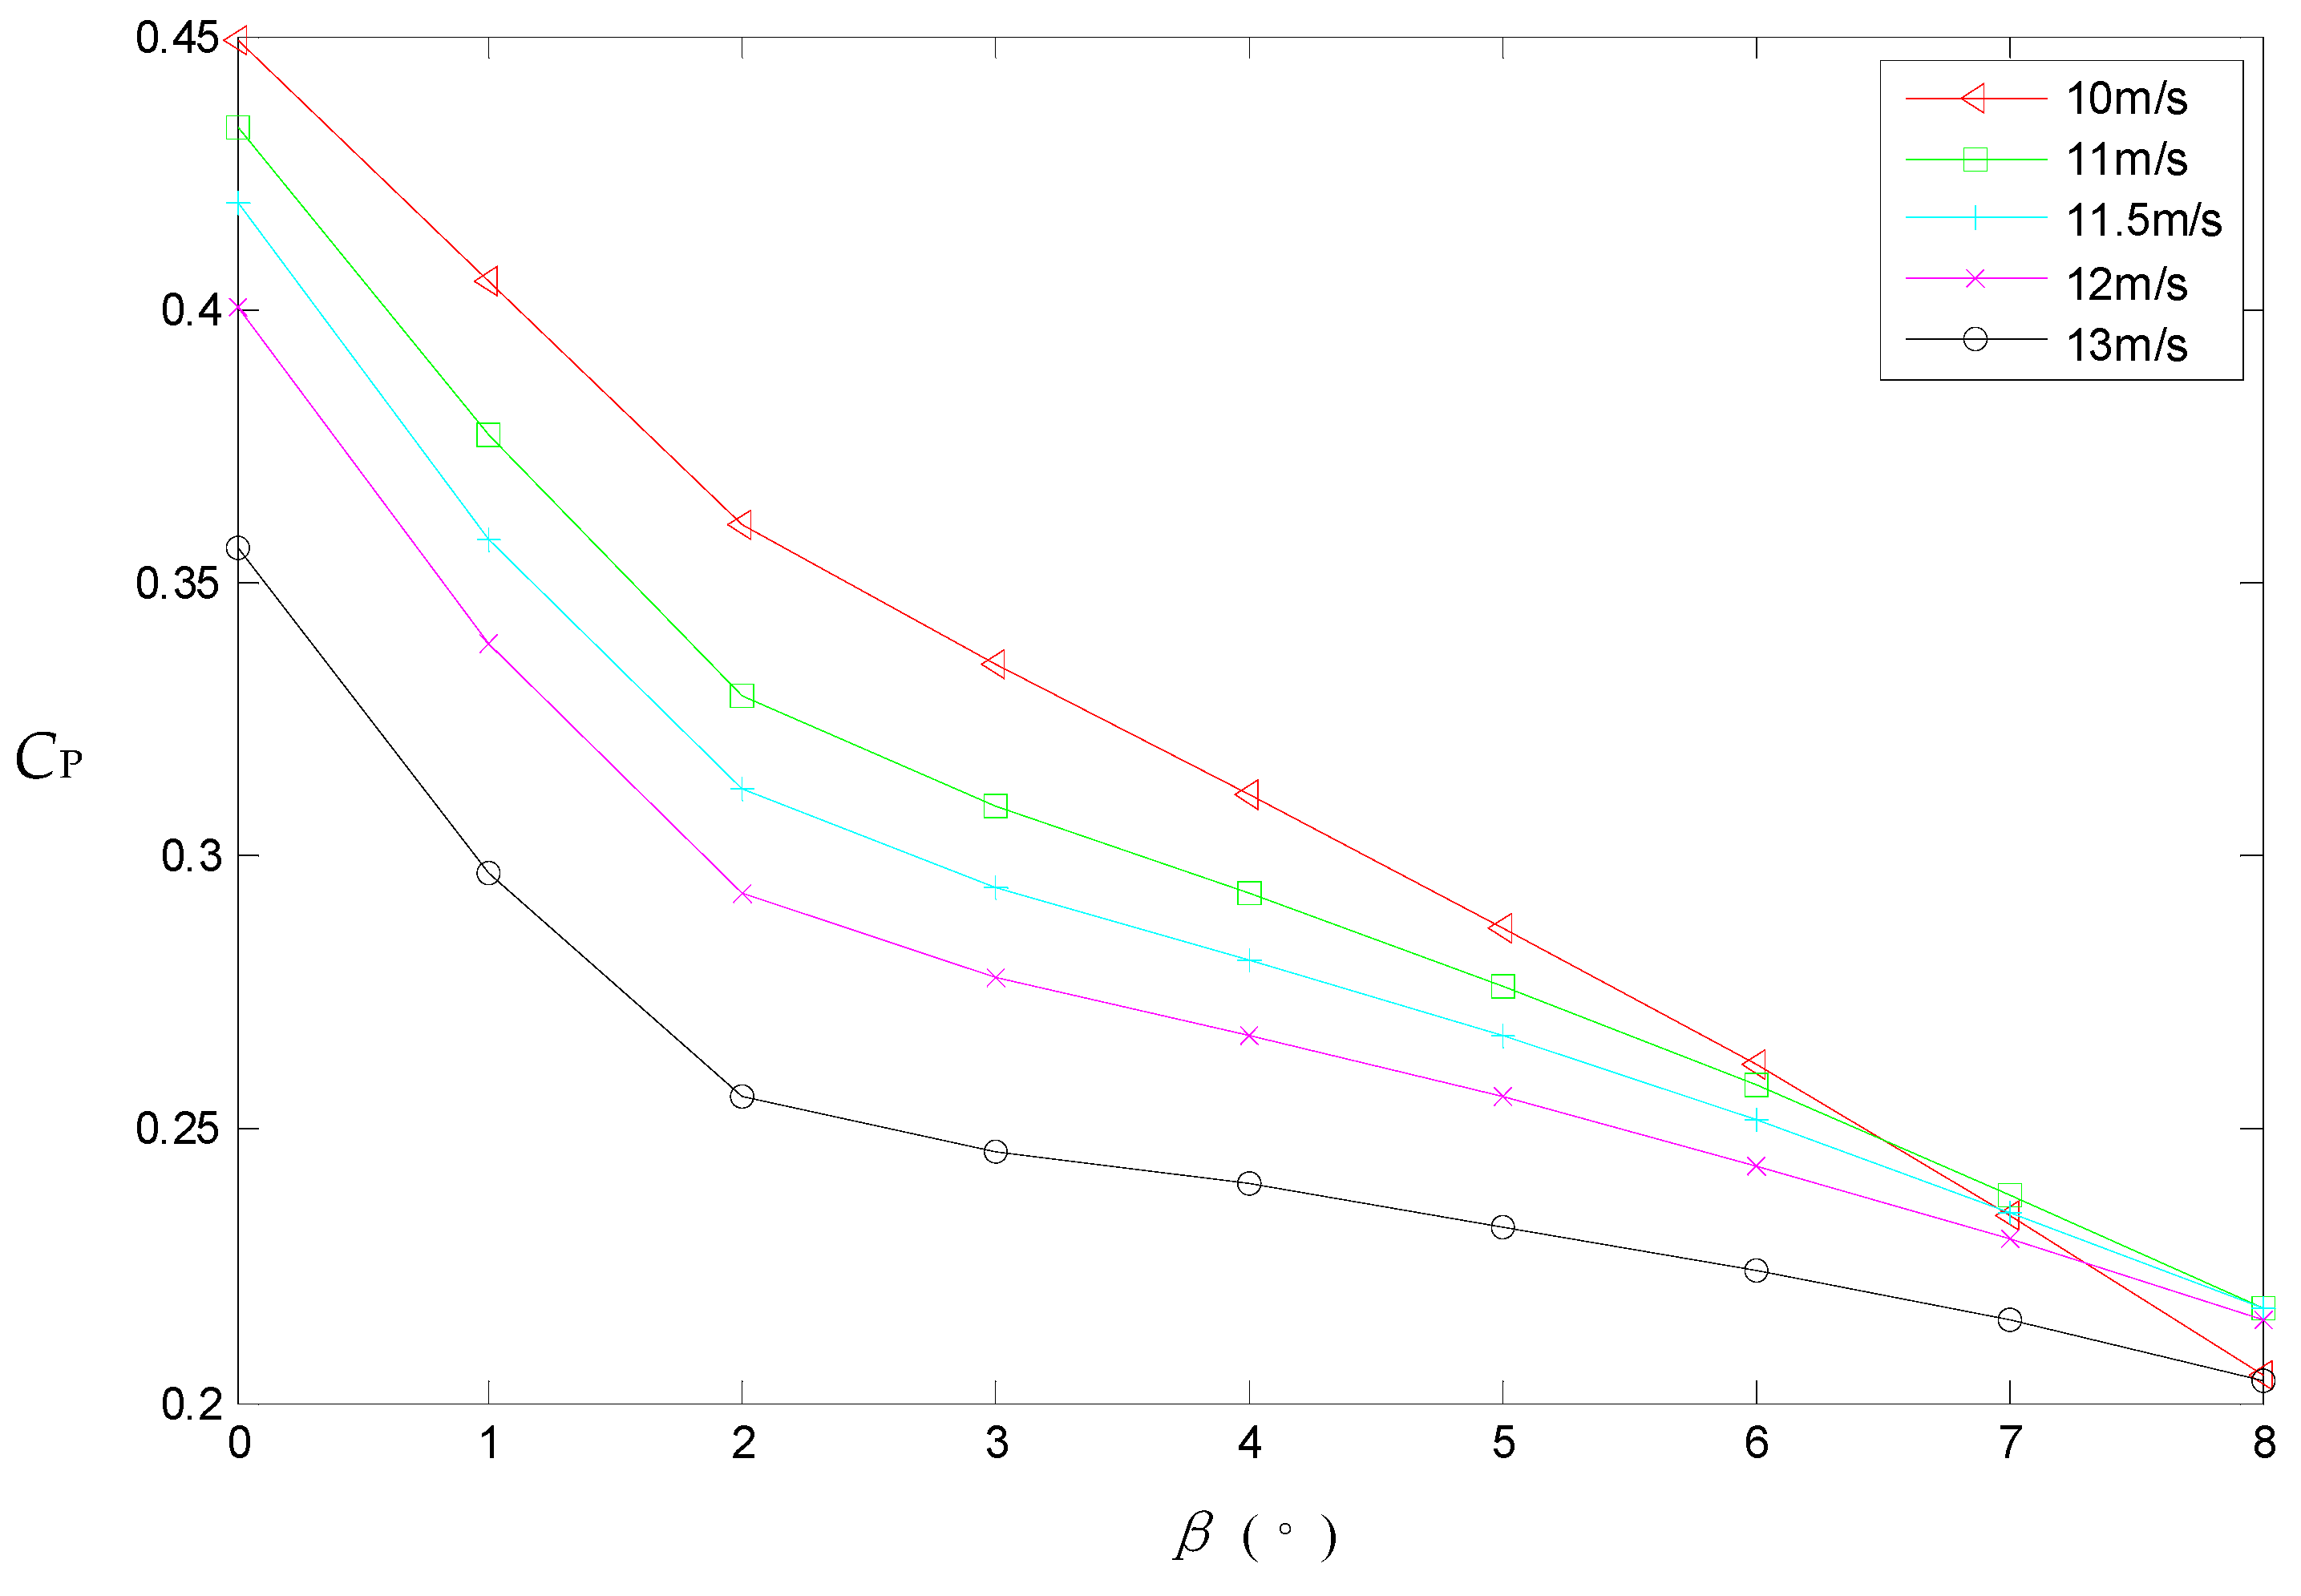
When the rotor speed at the rated speed, the curve of
CP-
β with different wind speeds of the FD-77-1500III DFIG is shown in
Figure 4. The tip speed ratio decreases with the increase of wind speed. Therefore, at a certain pitch angle, the greater the wind speed is, the smaller the
CP is.
As shown in
Figure 4, under the different wind speeds, the
CP-
β curve is an approximate linear relationship. Through linear fitting calculating, when
βchanges 4°, the
CP is about 0.7 times of the traditional control mode’s value, that is, the wind power is reduced by about 30%. The data of different wind speeds when the pitch increases by 4° as shown in
Table 1. In the table,
CP of pitch increasing 4° represents the
CP of pitch increasing by 4° on the basis of traditional control. Regulation power (%) represents the percentage of the regulation power to the maximum captured power.
The time of pitch angle action 4° is generally about 1 s, which can meet the requirements of primary frequency regulation of the power system on time scale. Therefore, this paper conservatively designs that the pitch regulation angle constraint is 4°, and the regulation power constraint is about 30%.
4. Control Strategy of DFIG Participating in Frequency Regulation with Different Wind Speeds
4.1. Effects of Regulation Power Constraints on DFIG Participating in Frequency Regulation
The traditional synchronous generator participates in the primary frequency regulation of the system, adjusts the output power by the governor changing the opening value of the intake. The synchronous generators in the system divide the active regulation power according to the value of the adjustment coefficient. The smaller the adjustment coefficient is, the larger regulation power will be distributed. The adjustment coefficient of synchronous generator
σG is defined as [
30]:
where
PGN is the rated power of synchronous generator, Δ
PG is the regulation power when the frequency difference is Δ
f,
fN is the rated frequency of system. Δ
f * is the per-unit value of Δ
f, Δ
PG* is the per-unit value of Δ
PG. In general, the turbo-generator
σG is set at 3%–5%, and the hydro-generator
σG is set at 2%–4%.
We design the adjustment coefficient of the DFIG to participate in primary frequency regulation of the system with the similar power-frequency characteristics as the traditional synchronous generator. The adjustment coefficient of the WT is defined as:
where
PWN is the rated power of WT, Δ
PW is the regulation power of WT when the frequency difference is Δ
f, Δ
PW* is the per-unit value of Δ
PW.
The WT is affected by the bidirectional regulation power constraints. In some wind speed-frequency difference events, the WT cannot provide regulation power according to the adjustment coefficient, which reflects the increase of actual adjustment coefficient. At a certain wind speed, when the available upward and downward regulation power are Δ
PWup(
v) and Δ
PWdn(
v) respectively, the frequency difference range is [Δ
fdn,min(
v),Δ
fup,max(
v)], in which the WT can provide regulation power according to adjustment coefficient. Δ
fdn,min(
v) and Δ
fup,max(
v) can be expressed as:
where Δ
fdn,min(
v) is the lower limit of the range, and Δ
fup,max(
v) is the upper limit of the range.
If the frequency difference is between Δfdn,min(v) and Δfup,max(v), the actual adjustment coefficient is the setting coefficient. Beyond this range, the actual coefficient is greater than the setting coefficient. This frequency difference range is different with different wind speeds, because the bidirectional frequency regulation power is different under different wind speeds.
4.2. Control Strategy of DFIG Participating in Frequency Regulation
The synchronous generators in the system divide the active regulation power according to the adjustment coefficient value. However, unlike the primary frequency regulation of the synchronous generator, the WT is affected by the bidirectional regulation power constraints, when the frequency difference exceeds the range of Δfdn,min(v) and Δfup,max(v), the regulation power of the WT is less than the divided active regulation power, which leads to the degradation of the WT frequency regulation effects. Therefore, when the WT participates in primary frequency regulation, new control links should be added, and according to different wind speeds, corresponding control strategy needs to be adopted.
As shown in
Figure 3, when the wind speed is in the range of 4 m/s to 6 m/s (low wind speed range), the available bidirectional regulation power has a large regulation range, so the rotor speed control strategy is adopted in this wind speed range. When the wind speed is in the range of 6 m/s to 10 m/s (medium wind speed range), the available bidirectional regulation power is small, so the rotor speed and pitch coordinated control strategy is adopted in this wind speed range. When the wind speed is greater than 10 m/s (high wind speed range), the bidirectional regulation power cannot be obtained by the rotor speed regulation, so the pitch control strategy is adopted in this wind speed range.
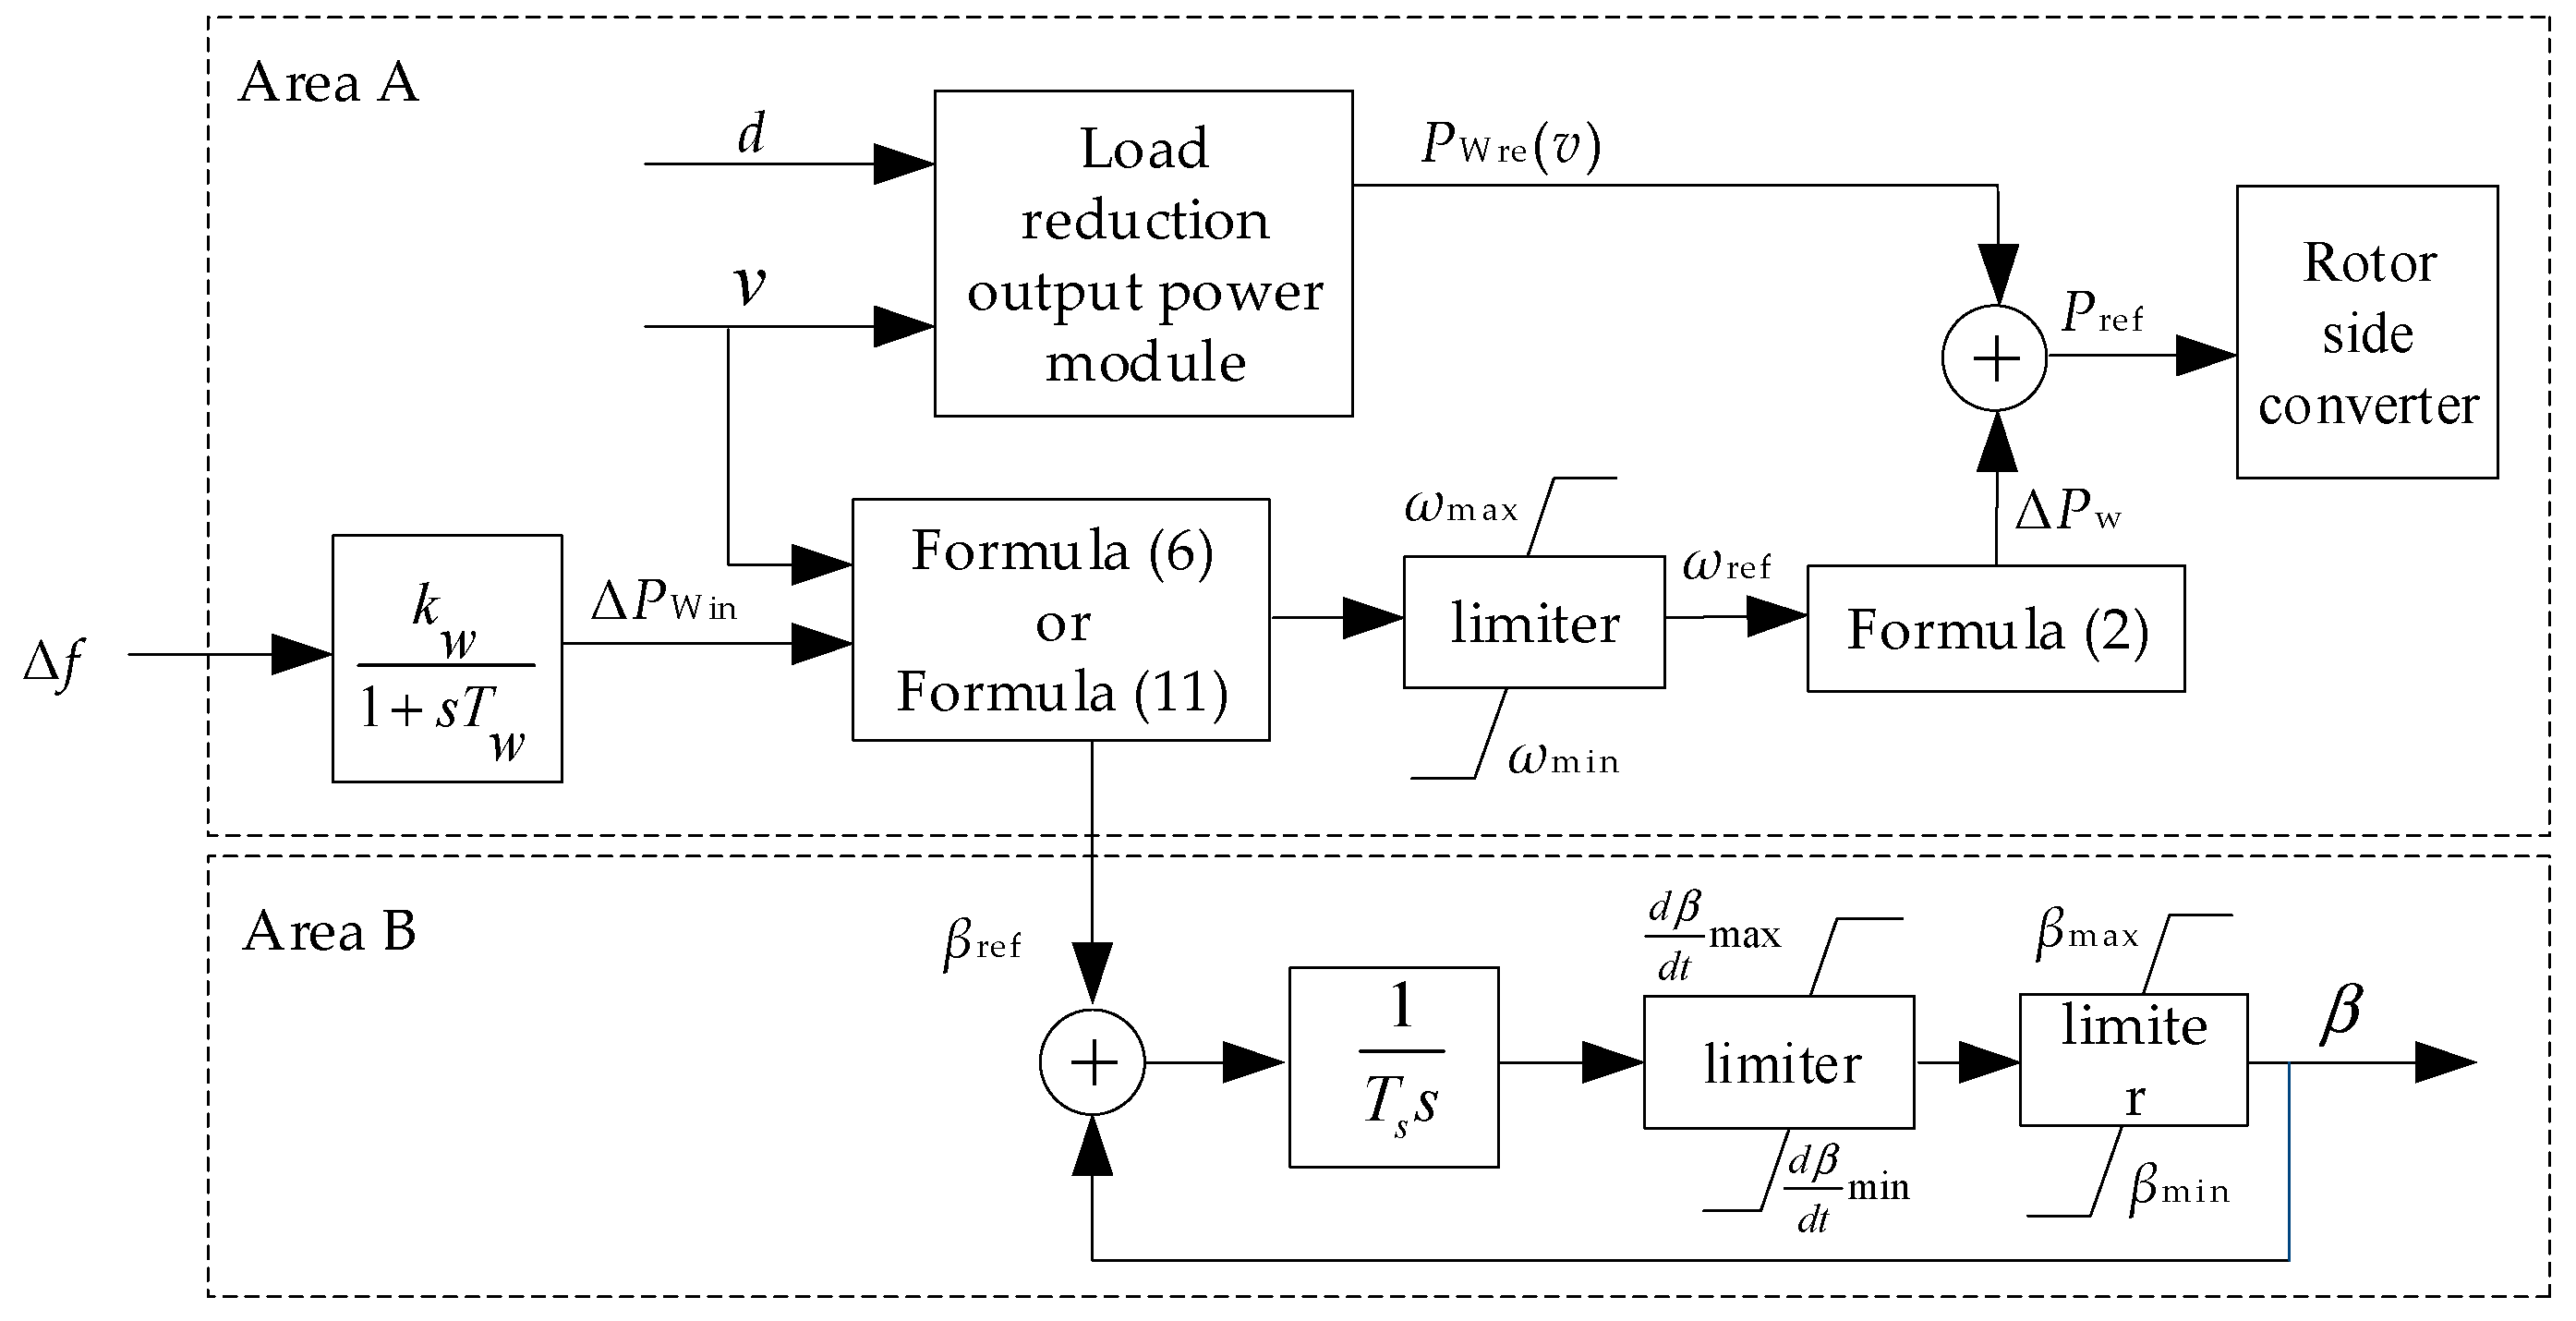
The control structure diagram of the DFIG participating in frequency regulation with different wind speeds is shown in
Figure 5.
TW is the inertia time constant.
KW is the frequency characteristic coefficient, which is the reciprocal of
σW.
ωmax,
ωmin are the rotor speed limit values.
Ts is the delay of pitch servo drive system.
,
are the pitch rate limits.
βmax,
βmin are the pitch amplitude limits.
As shown in
Figure 5, there are two areas of the control structure diagram. Area A is the WT output power module. When the system frequency difference is Δ
f, the regulation power of the WT distributed by the setting adjustment coefficient is Δ
PWin. When the wind speed is
v, the regulation power provided by the WT is Δ
PW under the regulation power constraints. Δ
PW is added to the initial operation power
PWre(
v) as the active power reference value of the rotor-side converter. Area B is the pitch angle regulation module. The reference value
βref of the pitch angle is calculated according to the Equation (11). The pitch angle
β is obtained by the servo drive delay system, the pitch rate limiting link, and the pitch amplitude limiting link.
5. Simulation Verification and Analysis
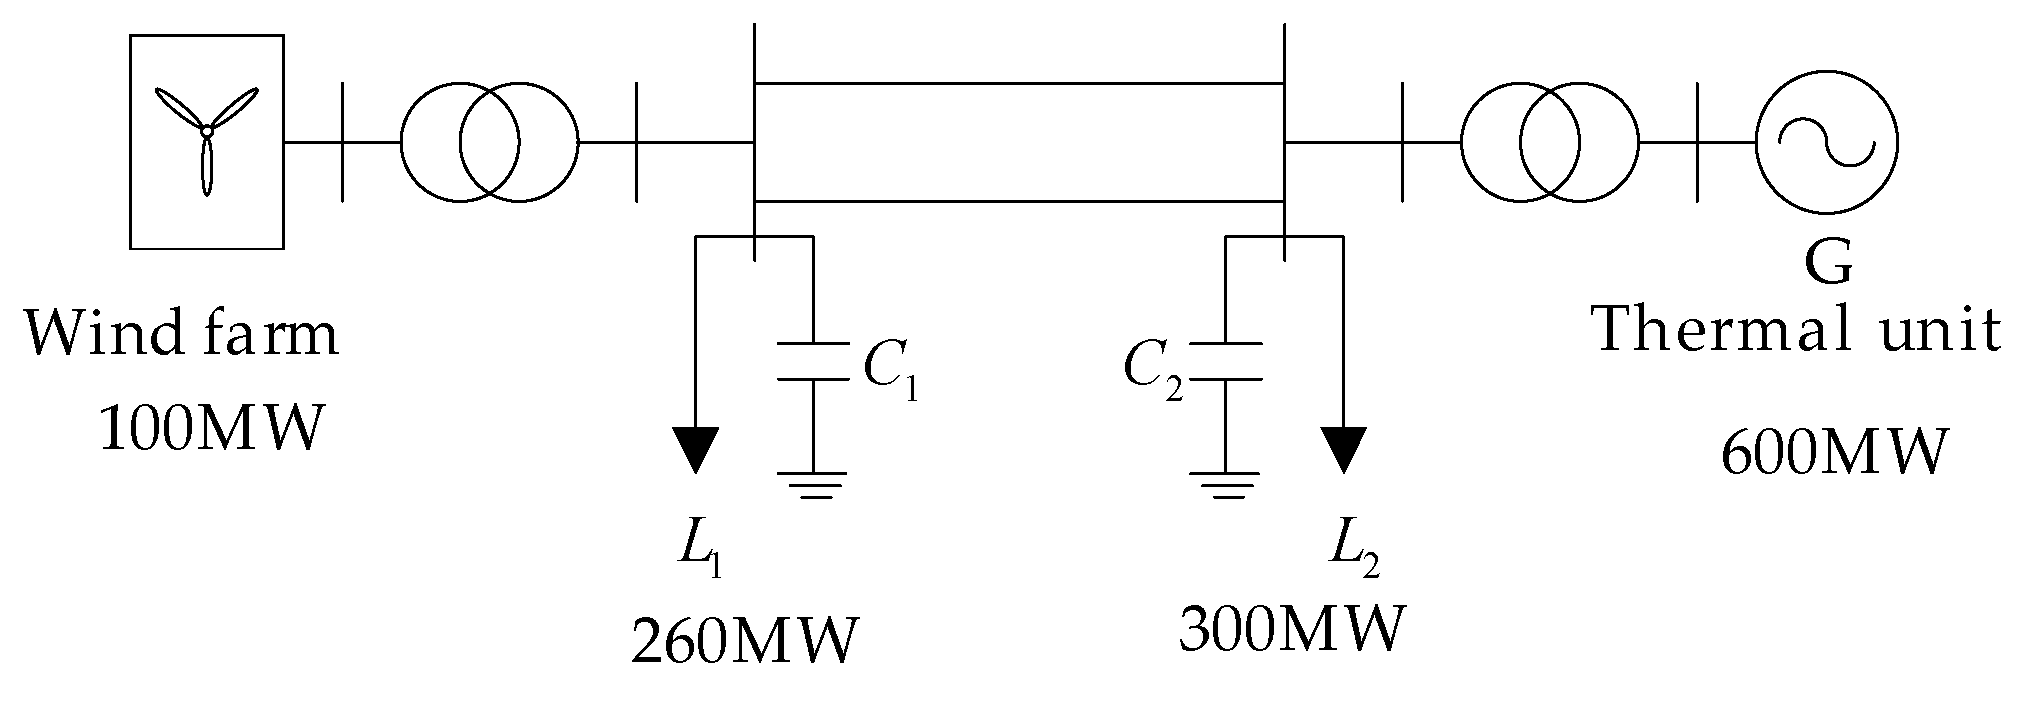
In order to verify the frequency regulation capability and effects of WTs participating in the long-term continuous frequency regulation process, the equivalent model including a wind farm and a thermal power unit is constructed. The wind farm consists of 66 DFIGs, and single capacity is 1.5 MW. The capacity of thermal power unit is 600 MW. The total load is 560 MW. The simulation model of the system is shown in
Figure 6. Thermal power unit inertia time constant is 8.84 s,
σG = 4%. Loads L1 and L2 are 260 MW and 300 MW, respectively. The unit regulation power coefficient of load is 1.5. The WT inertia time constant is 2 s. Design
σW = 4%, which makes the DFIG have the equivalent power-frequency characteristics as the synchronous generator. The delay of pitch servo drive system
Ts = 0.25 s [
31].
In addition, the difference characteristics of the WTs in wind farm and the difference of control time is neglected in this paper, and the characteristics of one WT are equivalent to a wind farm.
5.1. Frequency Dynamic Process Simulation under Single Frequency Disturbance
5.1.1. Simulation Verification of Rotor Speed Frequency Regulation Control Strategy
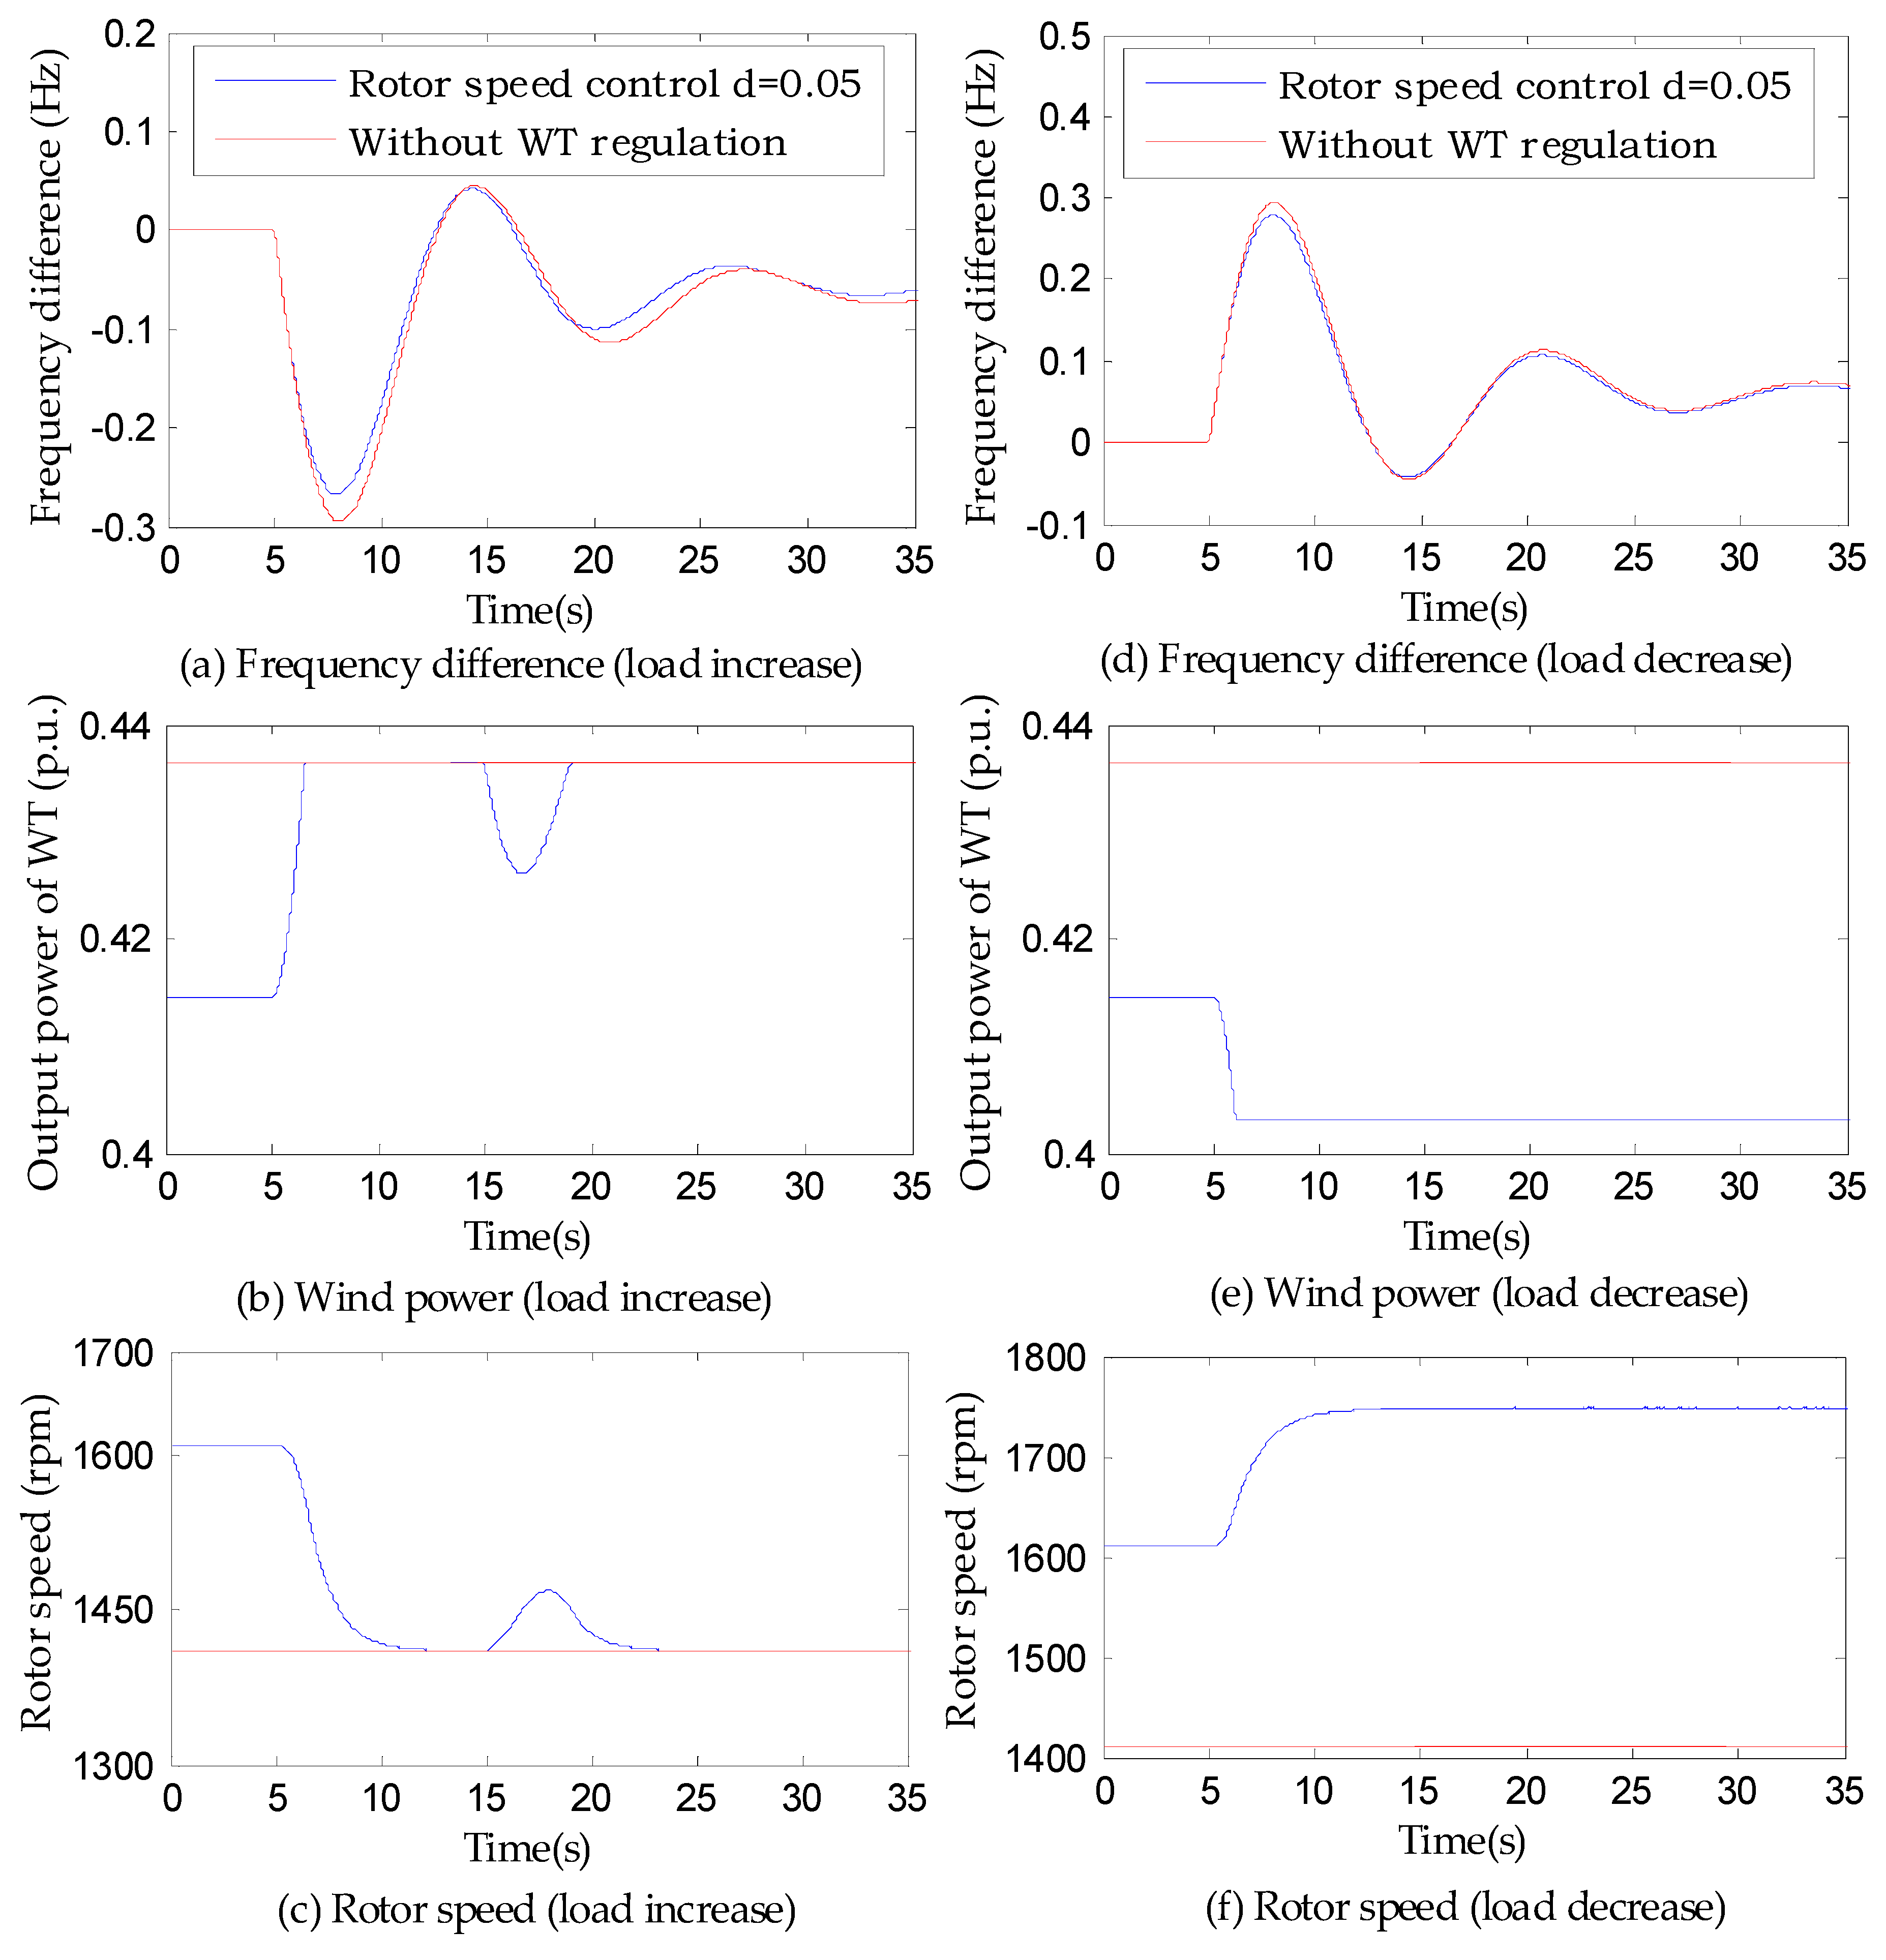
We set the wind speed to 8 m/s, power reservation coefficient
d = 0.05. The simulation results of the load step change are shown in
Figure 7, where when the WT does not participate in the frequency regulation, the initial rotor speed (optimal rotor speed) is 1410 rpm, and the output power (maximum captured power) is 0.4363 p.u. (654.45 kW). When the WT participates in frequency regulation, the initial rotor speed is 1610 rpm, and the output power is 0.4146 p.u. (621.9 kW), and the reservation power is 5%.
The load step increase by 20 MW at 5 s, as shown in the
Figure 7a–c: The system frequency decreases. When the WT participates in the frequency regulation, the WT operates at the maximum power point after the system is stable, releases all the reservation power to participate in frequency regulation, the frequency difference is stable at −0.0563 Hz, which is 10.8% less than that of the WT without frequency regulation.
The load step decrease by 20MW at 5s, as shown in the
Figure 7d–f: The system frequency increases. When the WT participates in frequency regulation, the rotor speed is accelerated to the rated rotor speed 1750 rpm, the output power is reduced to 0.4031 p.u. (604.65 kW) after the system is stable, the frequency difference is stable at 0.0599 Hz, which is 5.8% less than that of the WT without frequency regulation.
5.1.2. Simulation Verification of Pitch Frequency Regulation Control Strategy
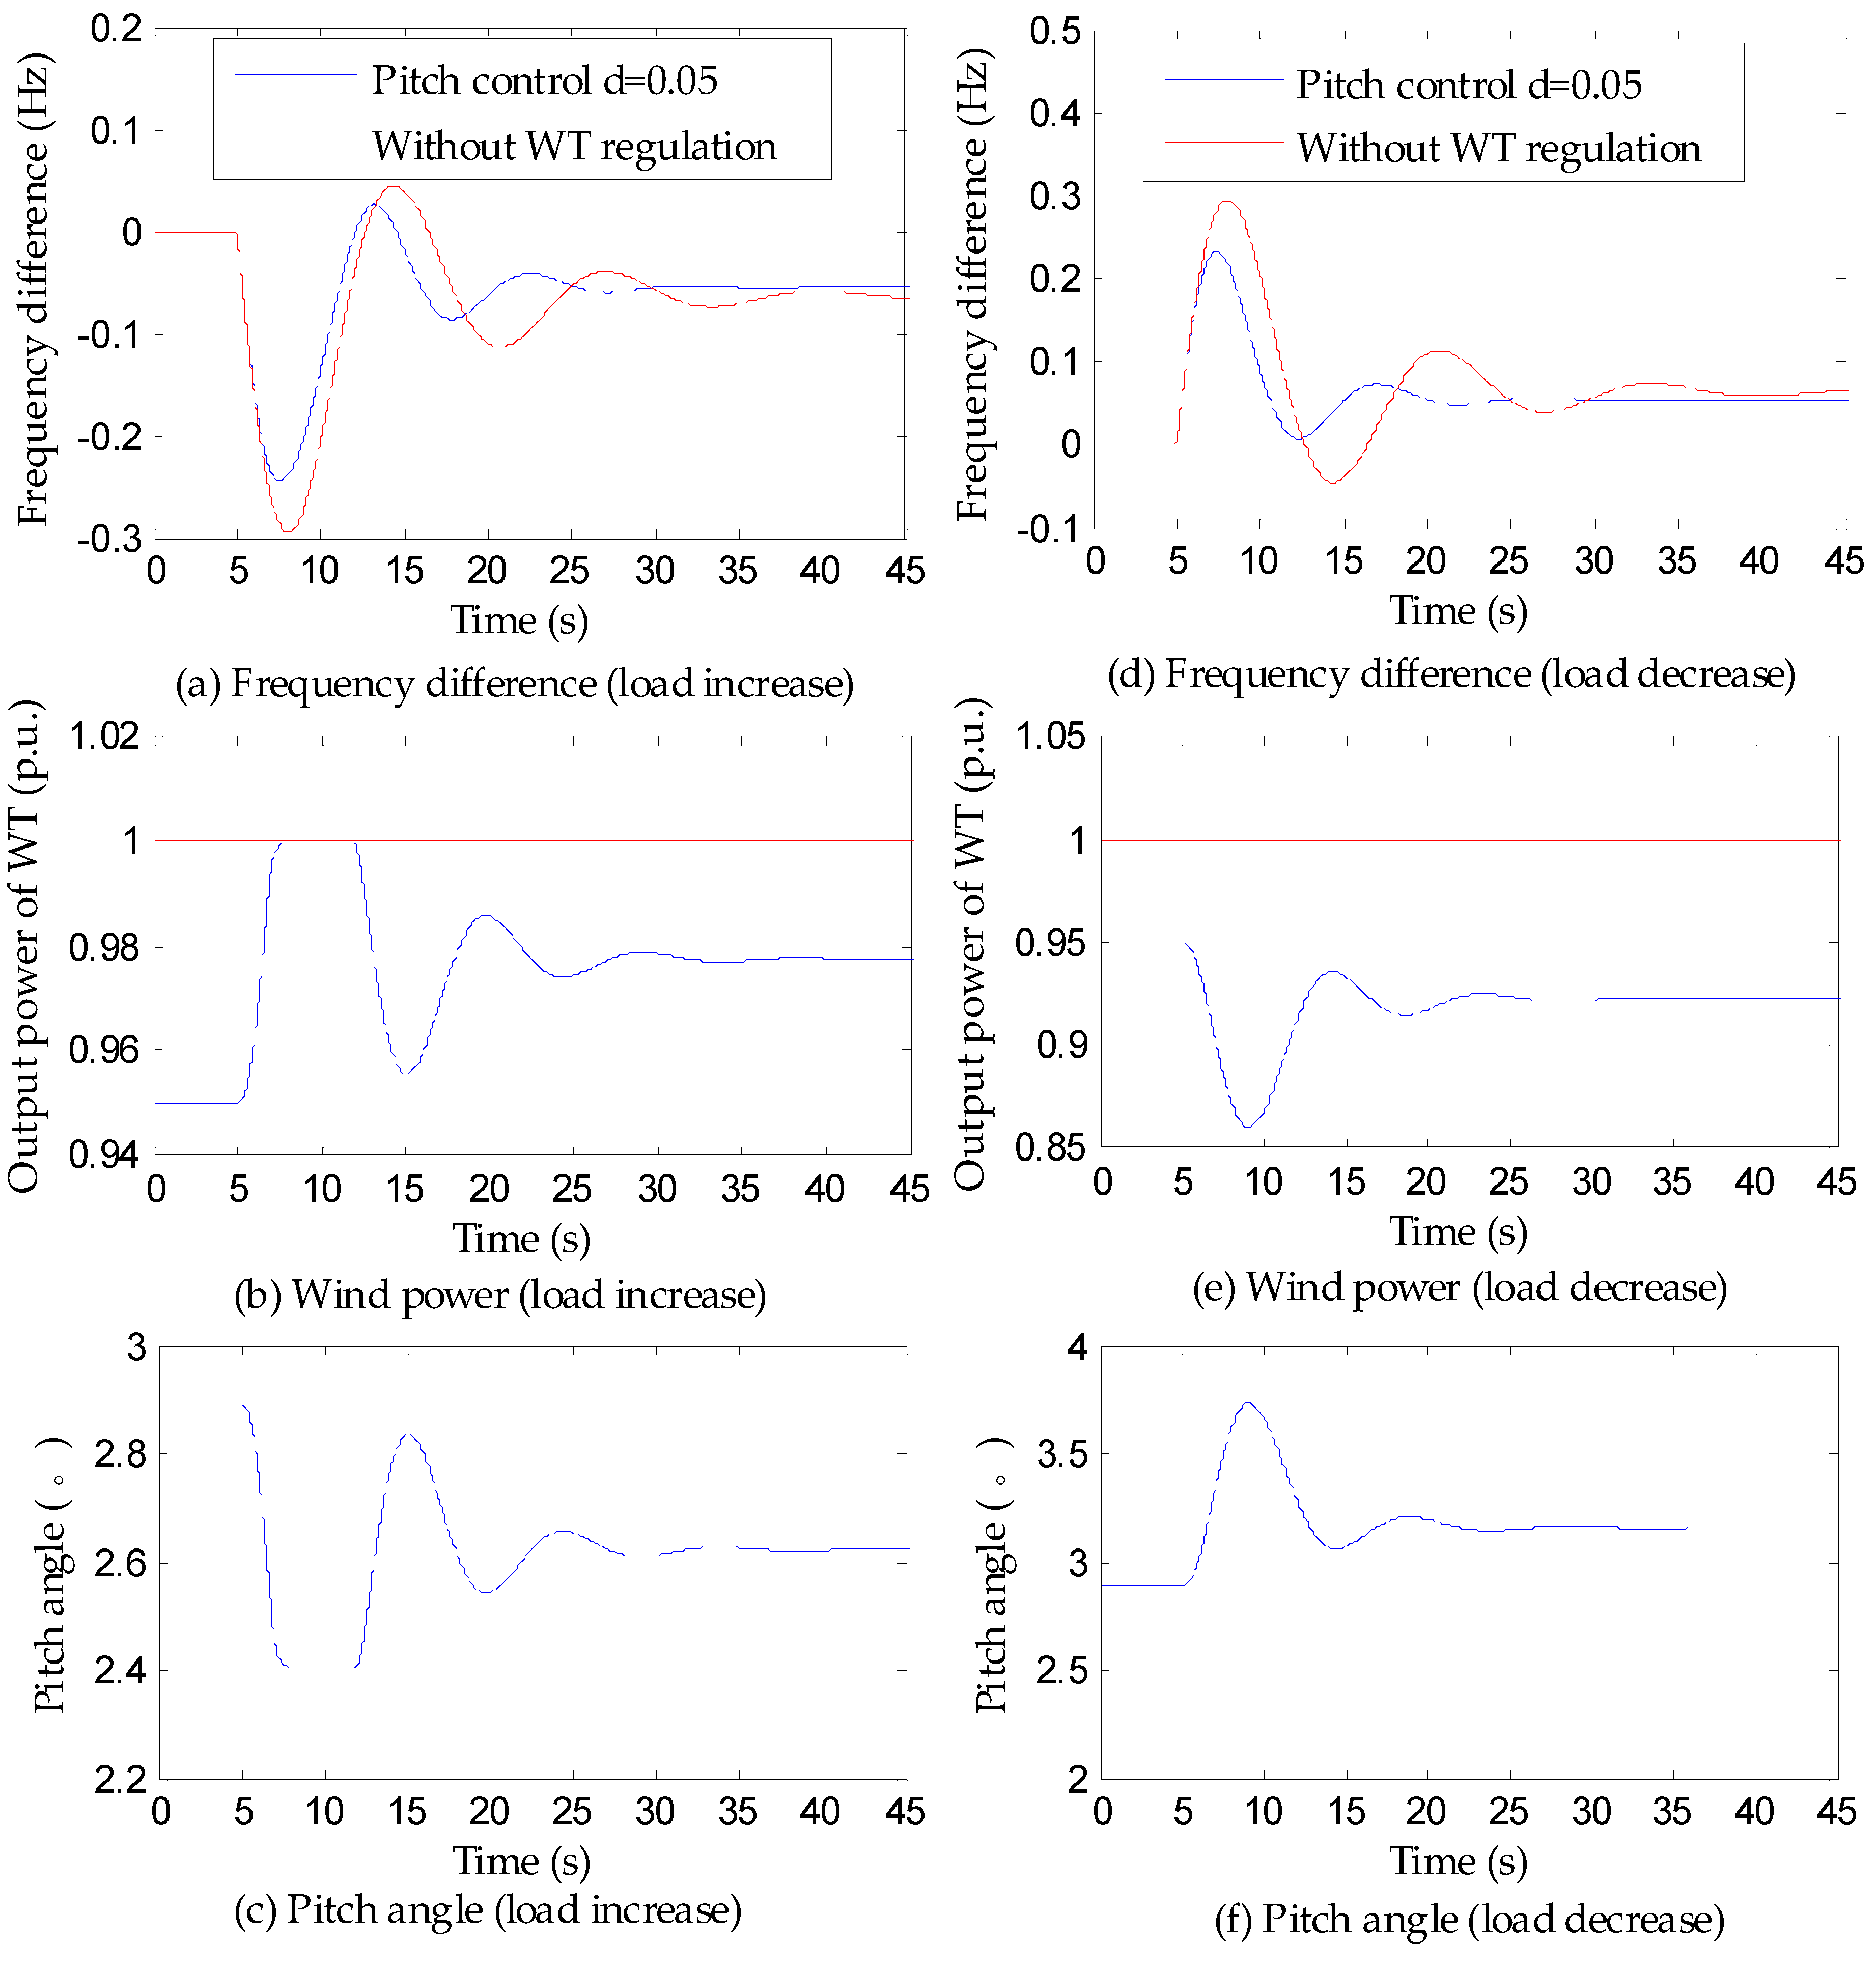
Set wind speed to 12 m/s and the power reservation coefficient to
d = 0.05. The simulation results of the load step change are shown in
Figure 8.
As shown in the
Figure 8, when the WT does not participate in frequency regulation, the pitch angle β = 2.4°, and the output power is 1 p.u. When the WT participates in frequency regulation, the initial pitch angle β = 2.9°, the output power is 0.95 p.u., and the reservation power is 5%.
The load step increase by 20 MW at 5 s, as shown in the
Figure 8a–c: The system frequency decreases. When the WT participates in frequency regulation, the output power of the WT is increased to 0.9775 p.u. and the pitch angle is 2.623° after the system is stable, the frequency difference is stable at −0.0546 Hz, which is 16.51% less than that of the WT without frequency regulation.
The load step decrease 20 MW at 5s, as shown in the
Figure 8d–f: The system frequency increases. When the WT participates in the frequency regulation, the output power of WT is reduced to 0.9225 p.u. and the pitch angle is 3.1578° after the system is stable, the frequency difference is stable at 0.0546 Hz, which is 15.87% less than that of the WT without frequency regulation.
5.2. Initial Operation Data of DFIG Participating in Frequency Regulation
Long term continuous frequency regulation of WTs is a set of wind speed-frequency difference combination events, the combination affects the frequency regulation effects. Single frequency disturbances cannot characterize the capacity and effects of WTs participating in long term continuous frequency regulation. For this reason, this paper investigates the regulation power constraints of WTs and effects in the actual scenario of wind power fluctuation and frequency fluctuation on one day time scale.
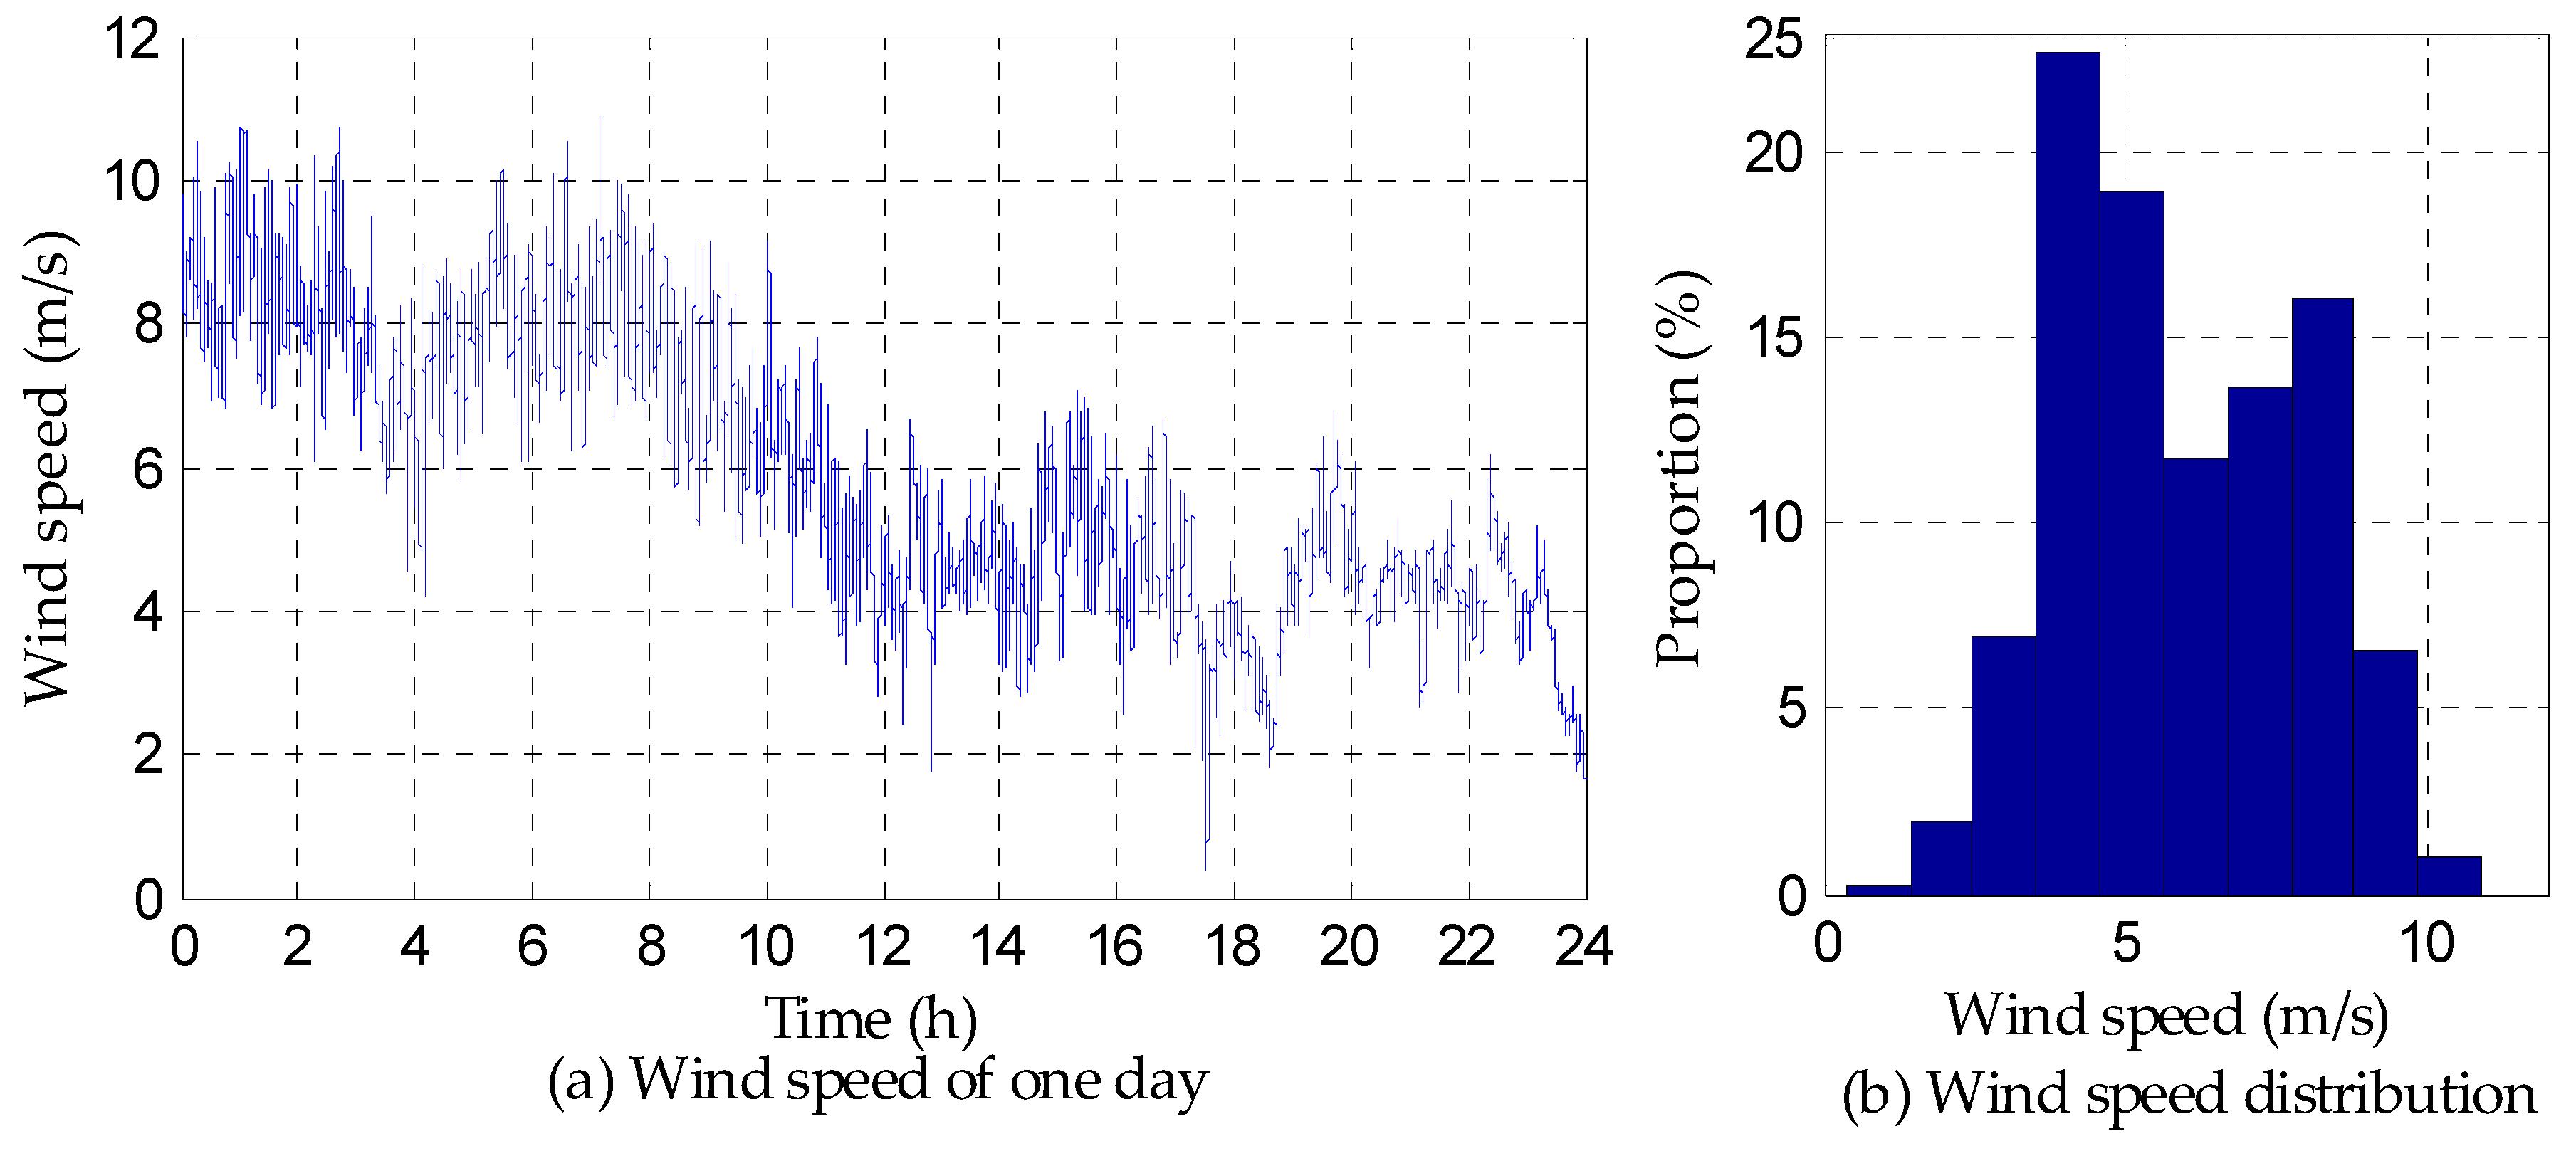
One day wind speed of a wind farm is selected as the simulation data. Its intensity is equivalent to the annual utilization hours of typical wind farm (about 2000 hours [
32]). The wind speed curve and statistical distribution are shown in
Figure 9.
As shown in
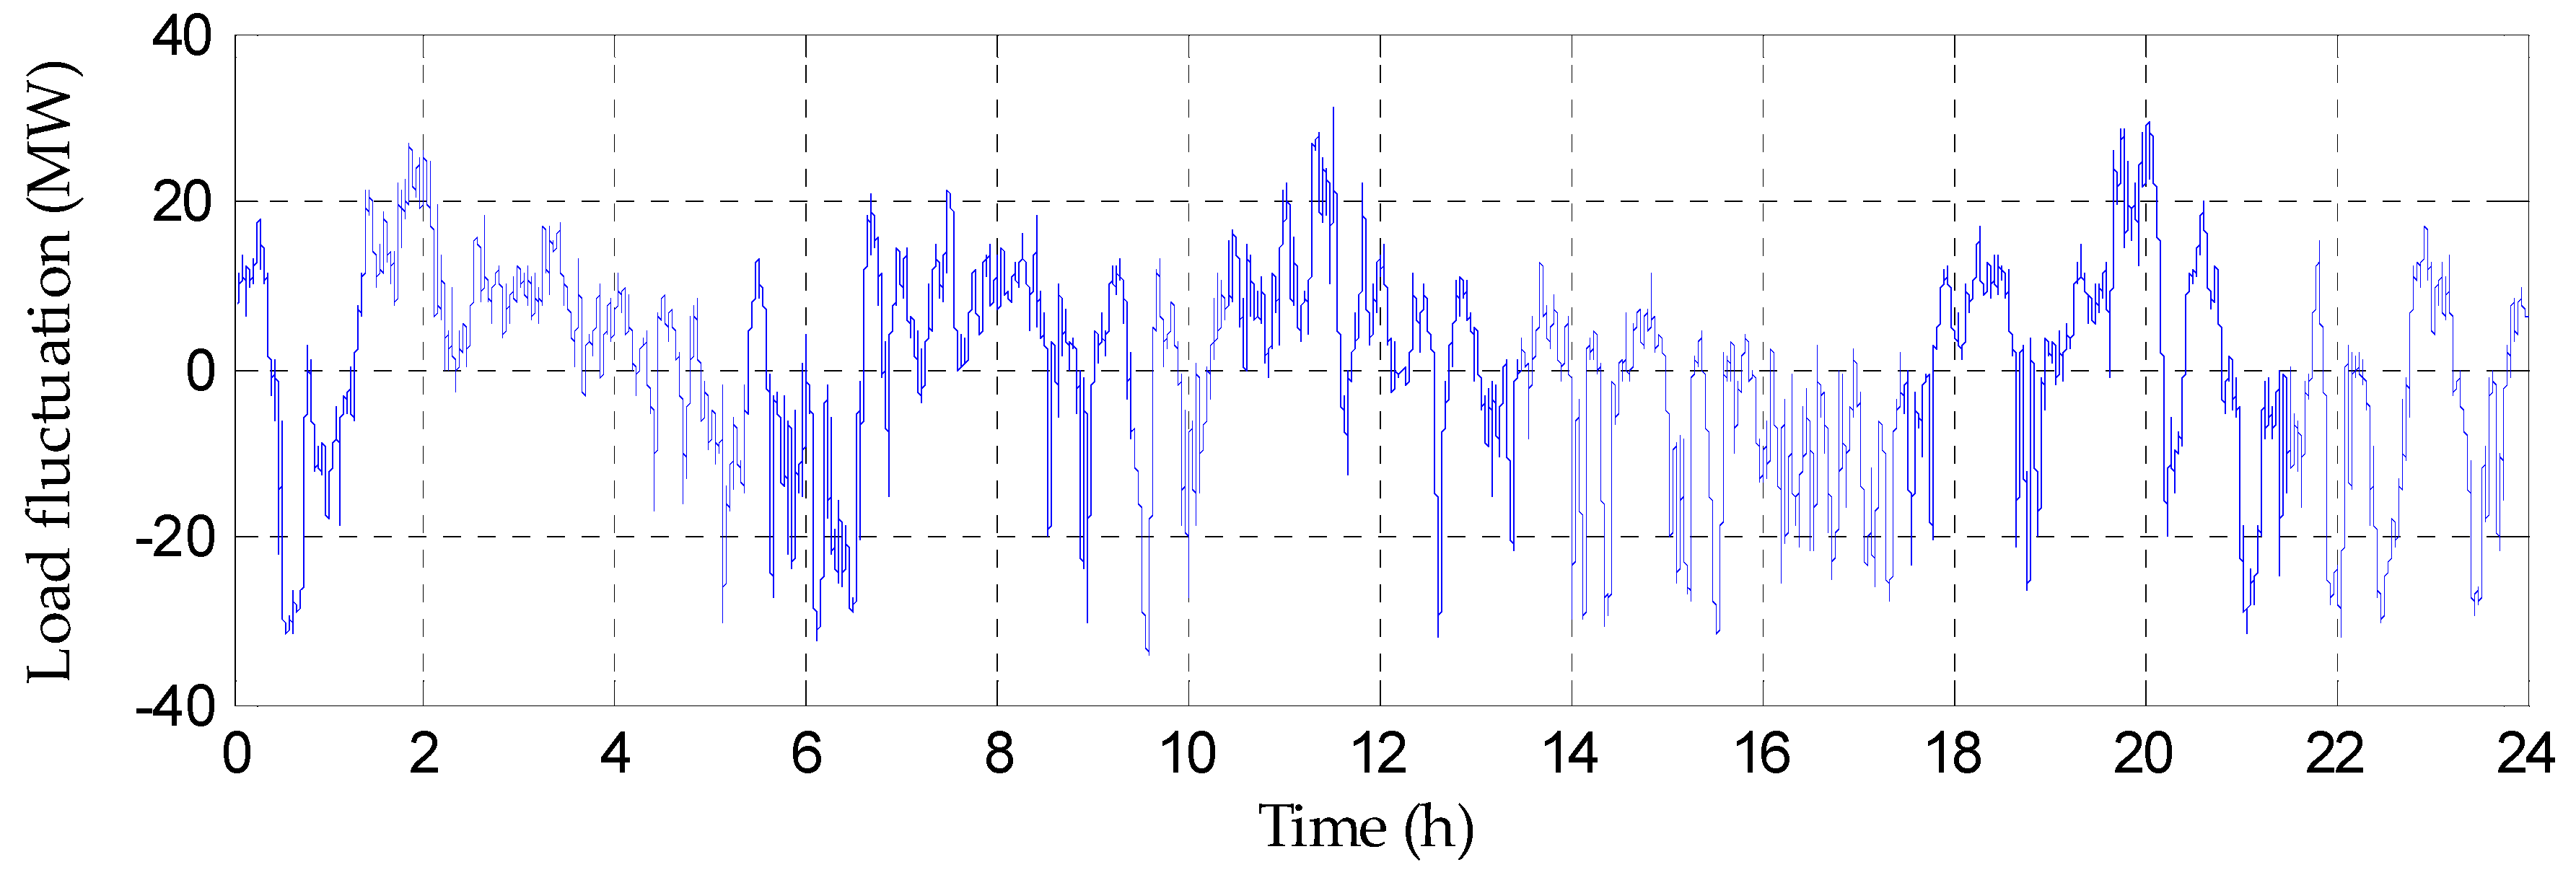
Figure 9 the cumulative time of wind speed less than 4 m/s is about 16.12%, the wind speed between 4 m/s and 6 m/s is about 39%, the wind speed between 6–10 m/s is about 44.21%, the wind speed is greater than or equal to 10 m/s, which is about 0.67%. The equivalent load fluctuation curve is shown in
Figure 10. The average value of equivalent load fluctuation absolute is 0.0011 MW, the maximum is 31.1717 MW, the minimum is −34.3940 MW.
5.3. Simulation Analysis of Regulation Power Constraints and Effects under Rotor Speed Control Strategy
The simulation results of different reservation coefficients under the rotor speed control strategy are shown in
Table 2.
In
Table 2 is the average power reservation coefficient,
is the average value of frequency difference absolute,
is the average value of wind farm regulation power absolute,
is the average adjustment coefficient of WT.
The data in
Table 2 shows that compared with the WTs that do not participate in frequency regulation, when
d = 0.05 and
d = 0.1,
decreases by 8.63% and 8.31, respectively. Compared with
d = 0.05, when
d = 0.1,
decreases by 3.57%, and
increases by 4.72%.
The above data analysis shows that from the three aspects of frequency quality, regulation power and average adjustment coefficient, WTs participating in frequency regulation improves frequency quality of the system under the rotor speed control strategy, but the frequency regulation effects are not further improved with the increase of reservation coefficient. The main reason why the frequency regulation effects of
d = 0.1 is worse than that of
d = 0.05 is that: when
d = 0.1,
get 78.6% of the d level (85.4% when
d = 0.05), although
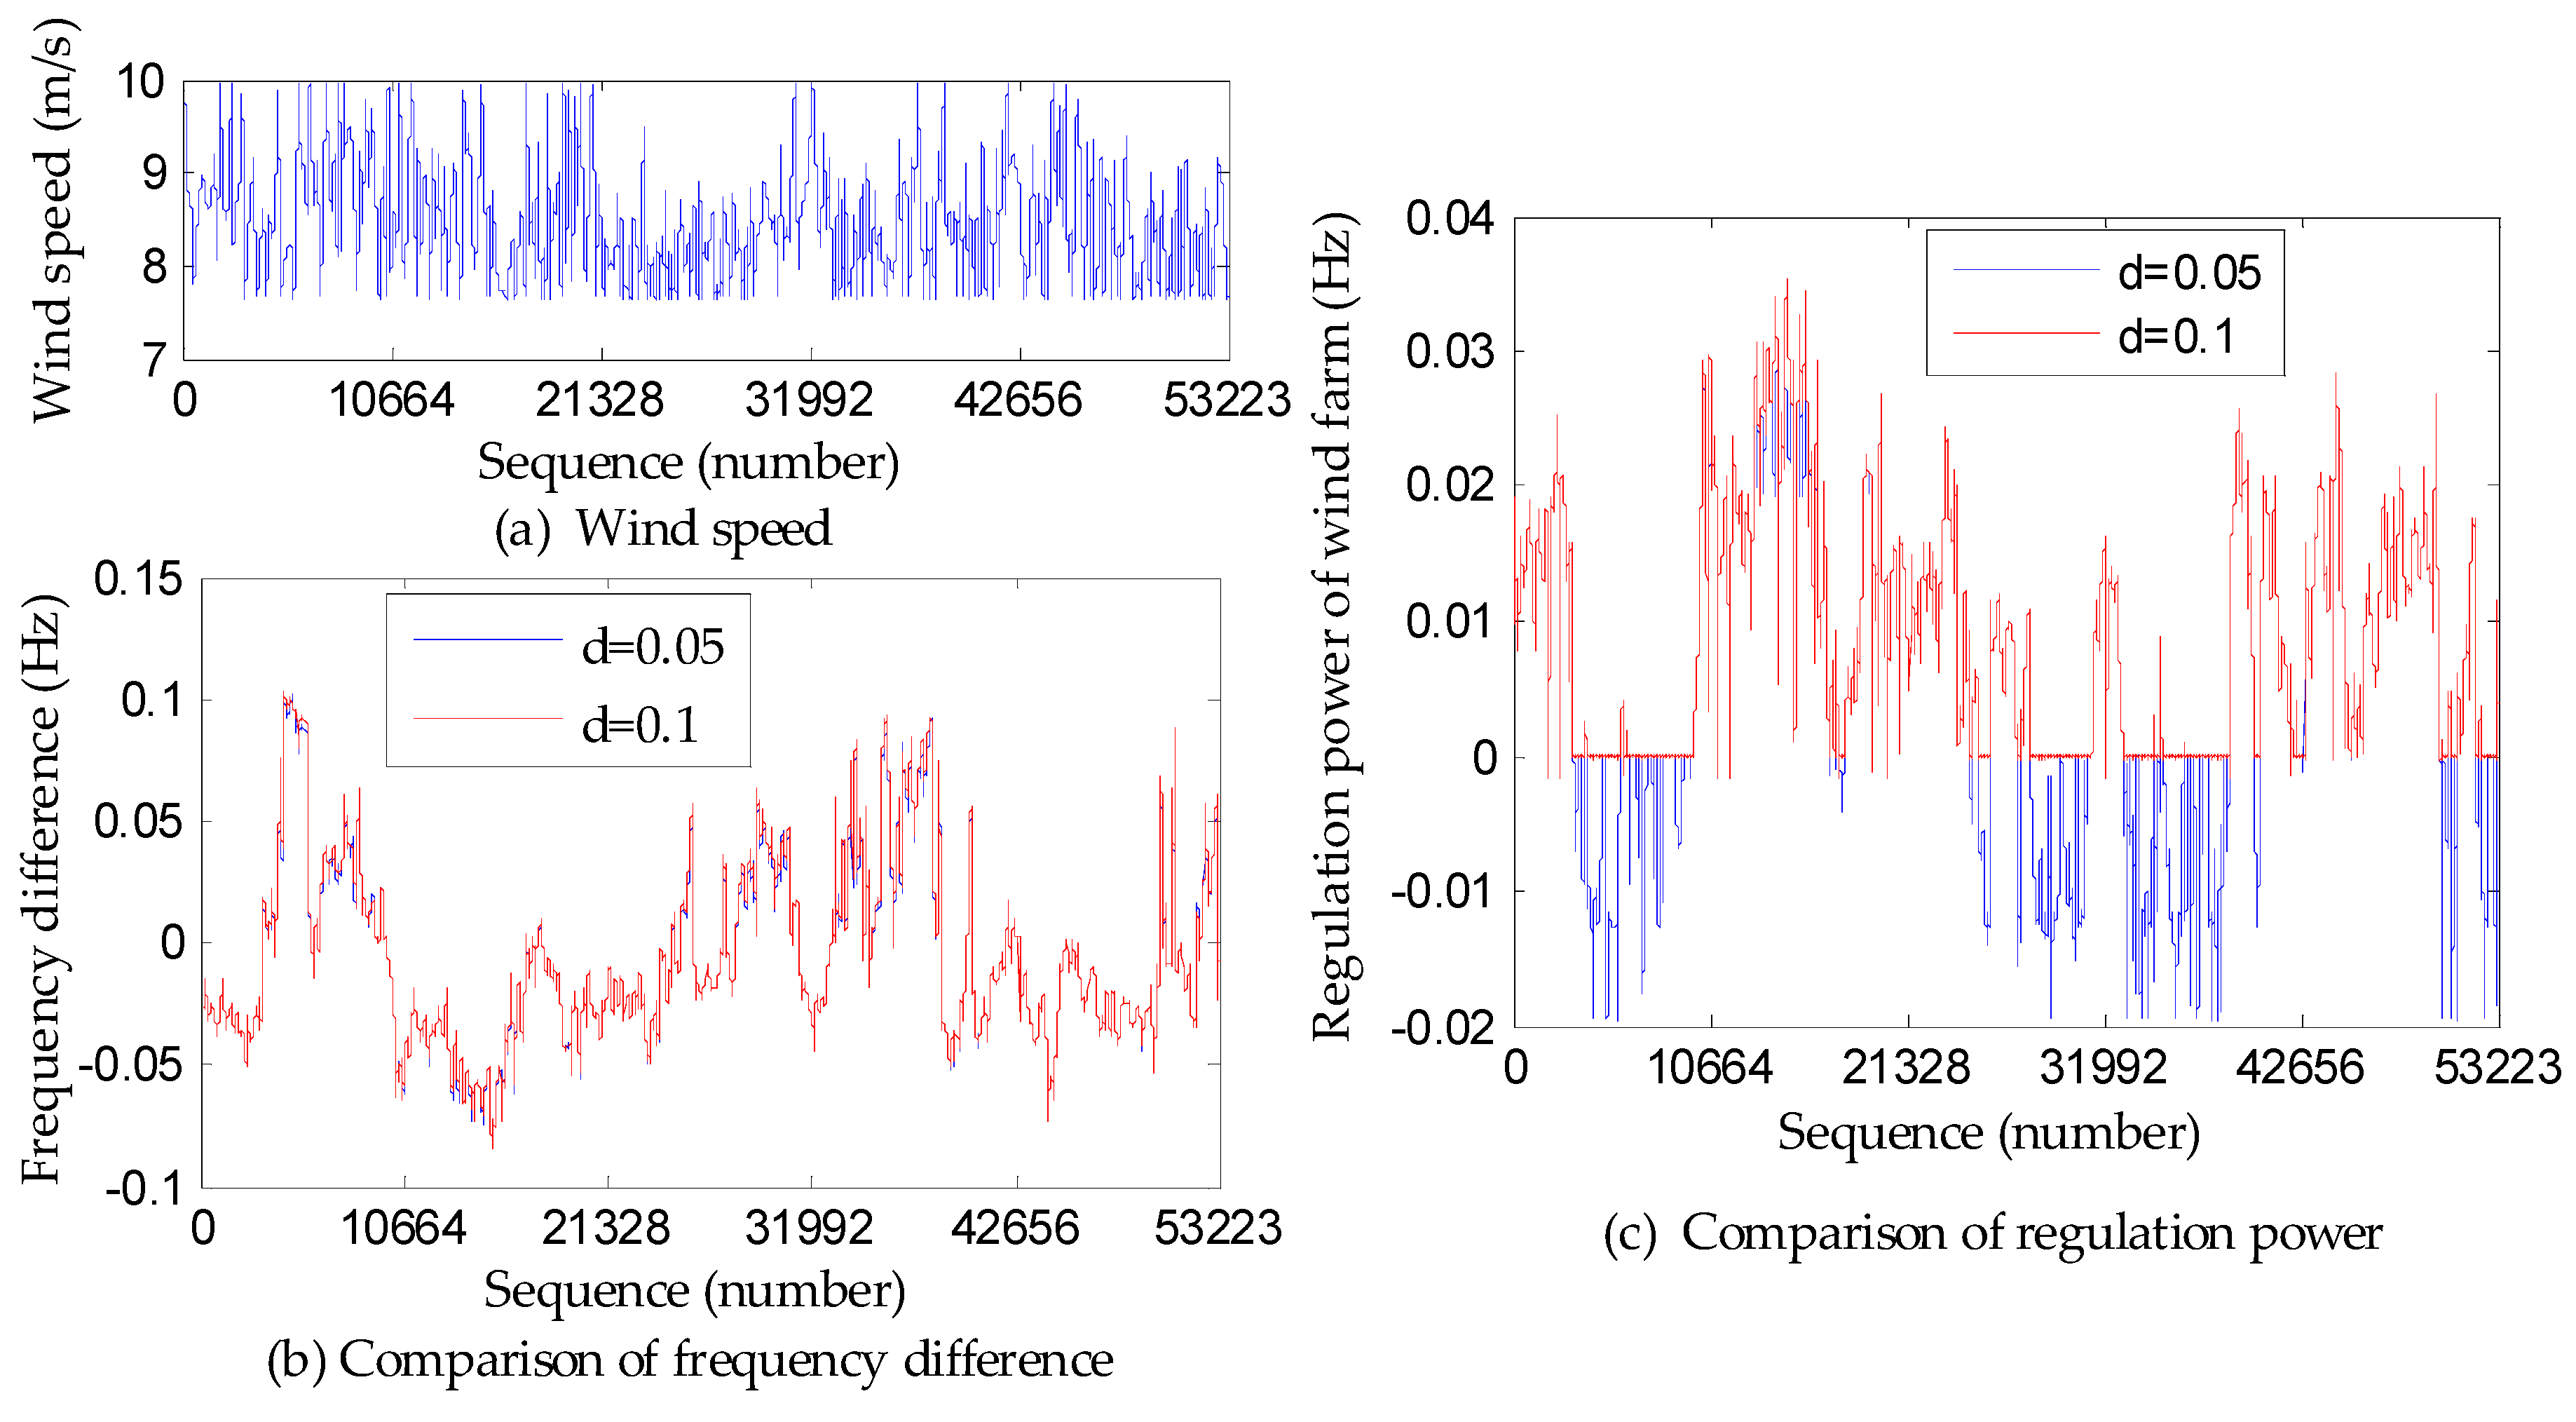
d increases, but the reservation power cannot be further increased at medium and high wind speeds, which limits the further improvement of the available upward regulation power. The increase of the reservation coefficient decreases the available downward regulation power. The data sequence of WTs without available downward regulation power when
d = 0.1 is selected for analysis, as shown in
Figure 11.
As shown in
Figure 11, when
d = 0.1, although the upward regulation power increases in the negative frequency difference events at some moments, the downward regulation power is zero in the positive frequency difference events at more moments. If a positive frequency difference event occurs at this time, it will affect the frequency regulation effects. When
d = 0.1 and
d = 0.05, the case of no downward regulation power and the positive frequency difference event occurring, it accounts for 8.78% and 2.14% of the total time respectively,
d = 0.1 is nearly 4.1 times higher than
d = 0.05, which lead to the overall frequency regulation effects of
d = 0.1 are worse than that of
d = 0.05.
The above analysis shows that due to the regulation power constraints, the frequency regulation effects are not improved with the increase of the power reservation coefficient under the rotor speed control in the designed example.
5.4. Simulation Analysis under Rotor Speed and Pitch Coordinated Control Strategy
Under the rotor speed control strategy, the available bidirectional regulation power at medium and high wind speeds is small or zero. The rotor speed and pitch coordinated control strategy is suitable for the WT participating in frequency regulation under different wind speeds. Under the coordinated control strategy, the simulation results with different reservation coefficients are shown in
Table 3,
is the average pitch angle action degree.
5.4.1. Comparison of the Rotor Speed Control and Coordinated Control Strategy
As shown in
Table 2 and
Table 3, when
d = 0.05, compared with the rotor speed control,
decreases by 10.49%,
increases by 14.07% and
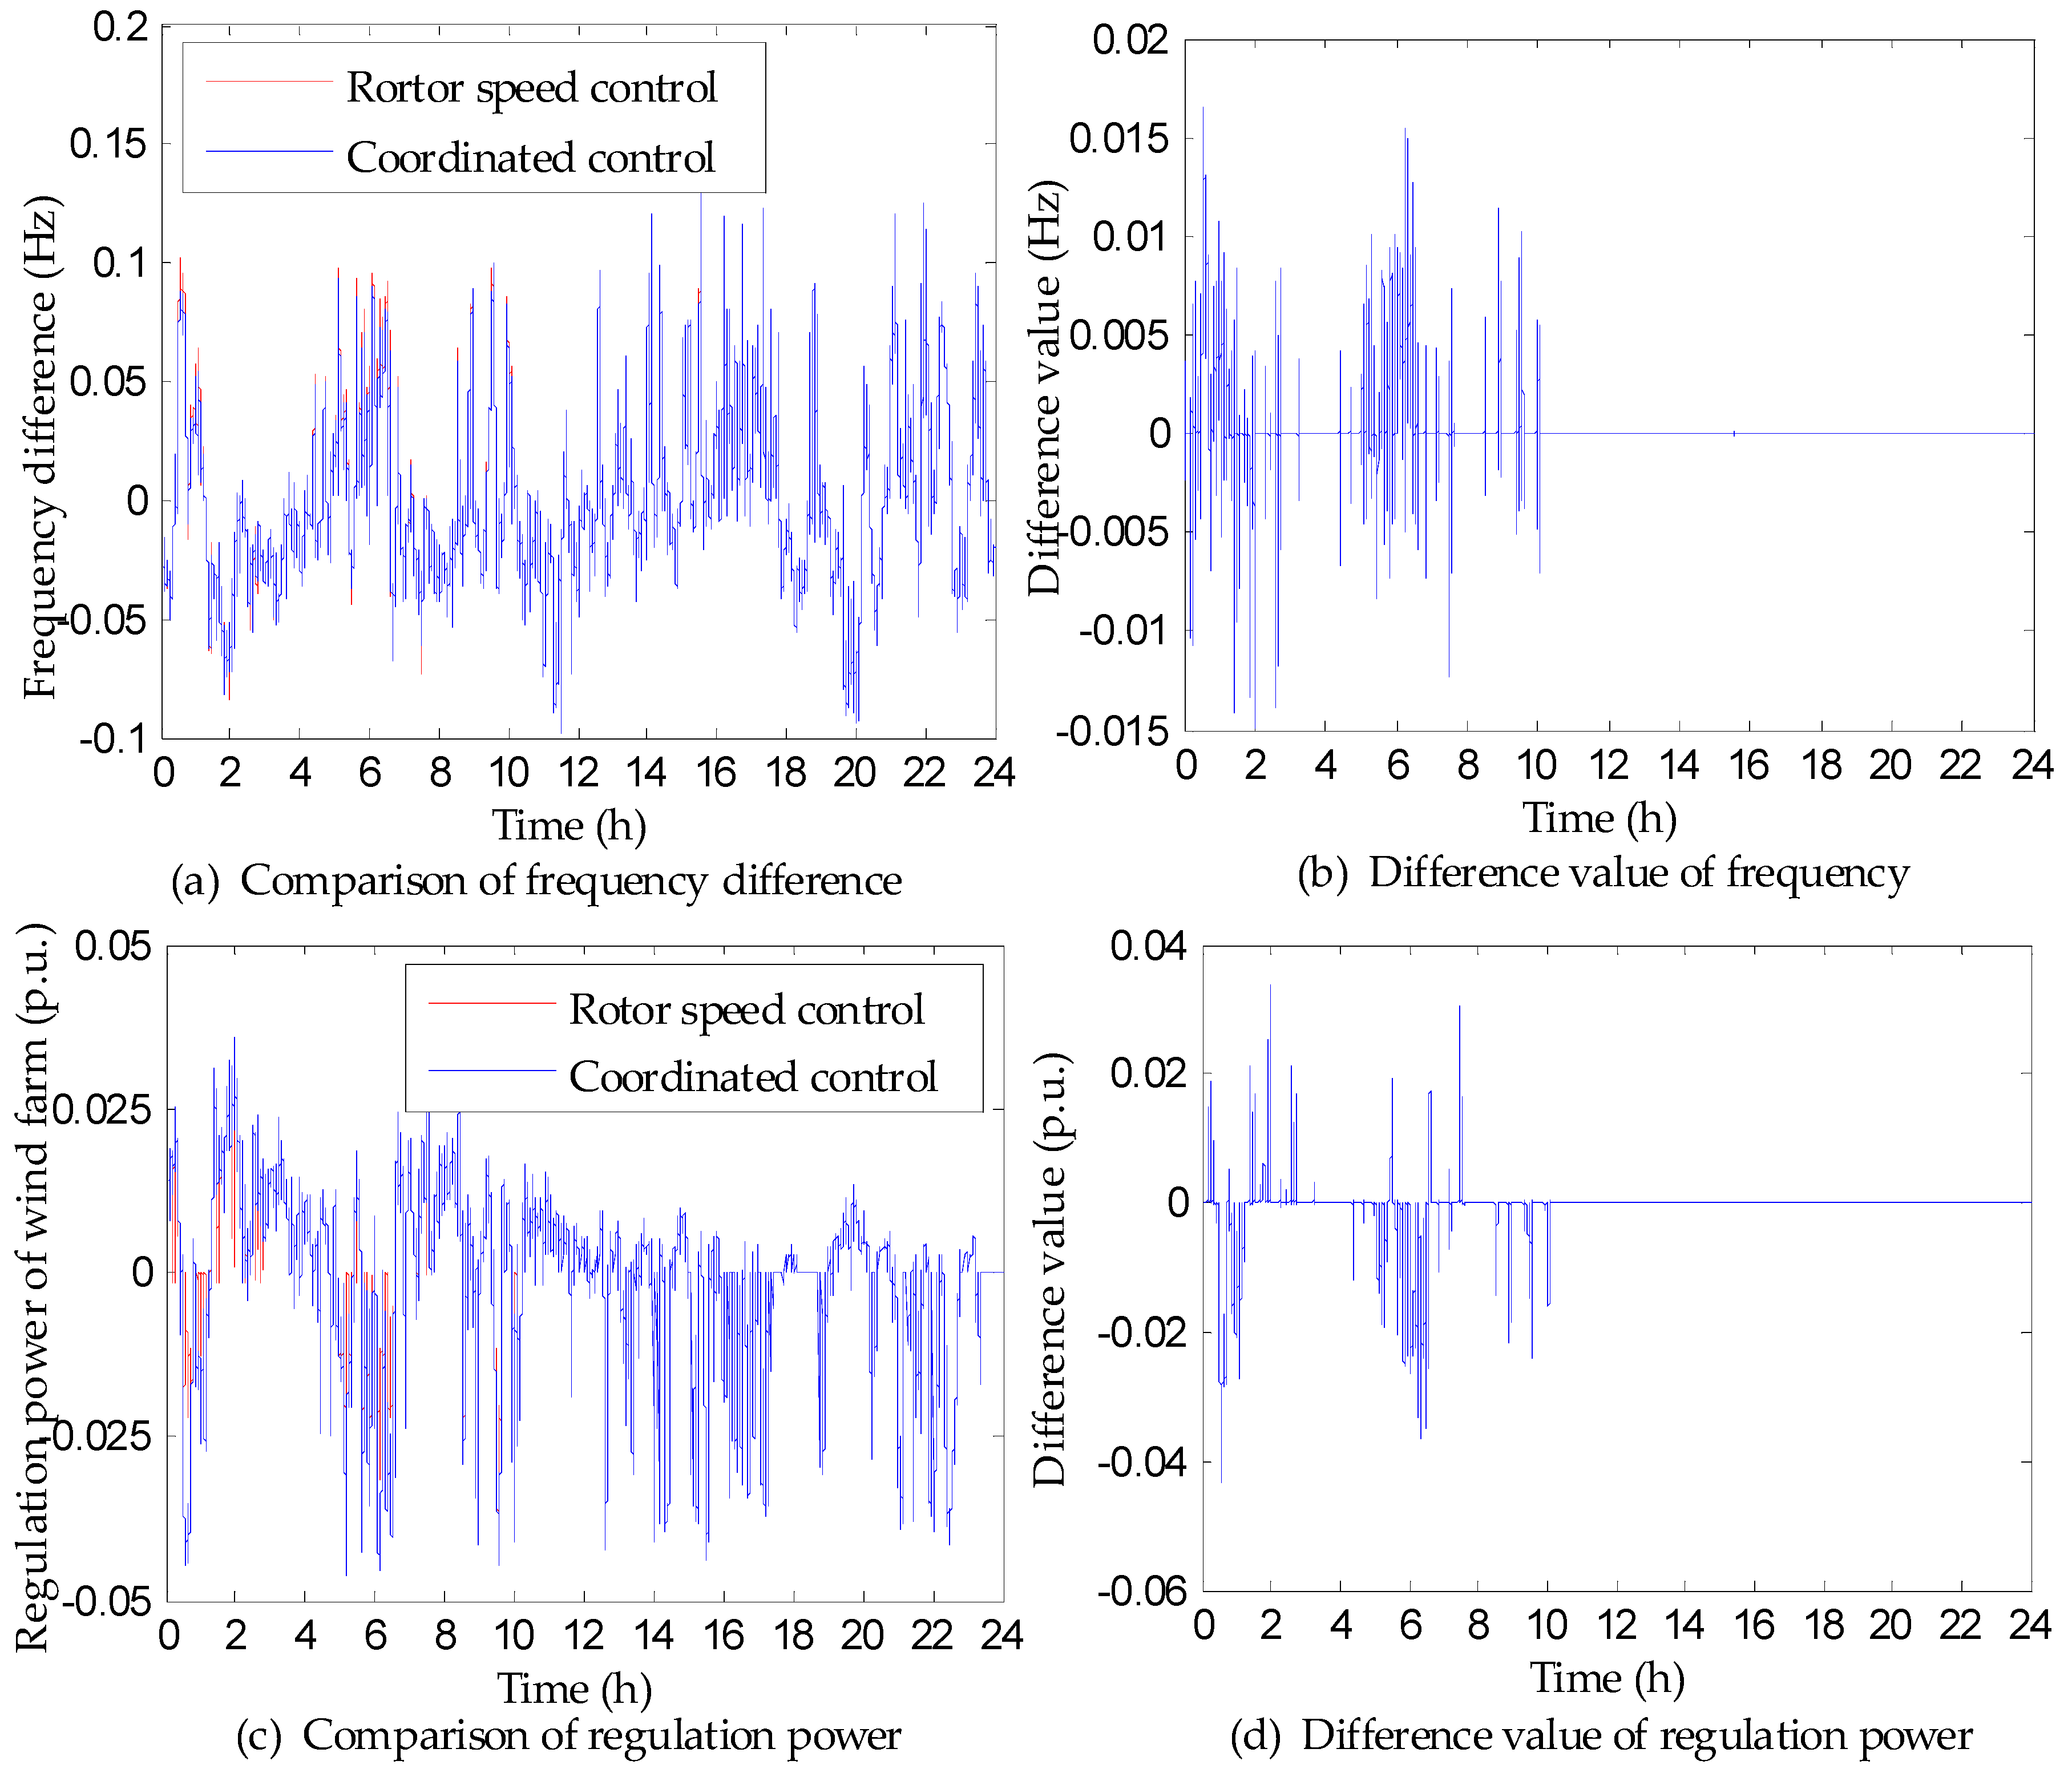
decreases by 13.27% under the coordinated control strategy. When
d = 0.05, the comparison of WTs participating in frequency regulation under the different control strategies is shown in
Figure 12.
As shown in
Figure 12, under the coordinated control strategy, the frequency difference of the system is significantly decreases and the regulation power of wind farm is significantly increases at medium and high wind speeds. According to statistics, when
d = 0.05, under the coordinated control strategy, the regulation power of wind farm does not get the adjustment coefficient, accounting for 23% of the total time, which is 12% less than that of rotor speed control strategy. Therefore, the average adjustment coefficient decreases under the coordinated control strategy.
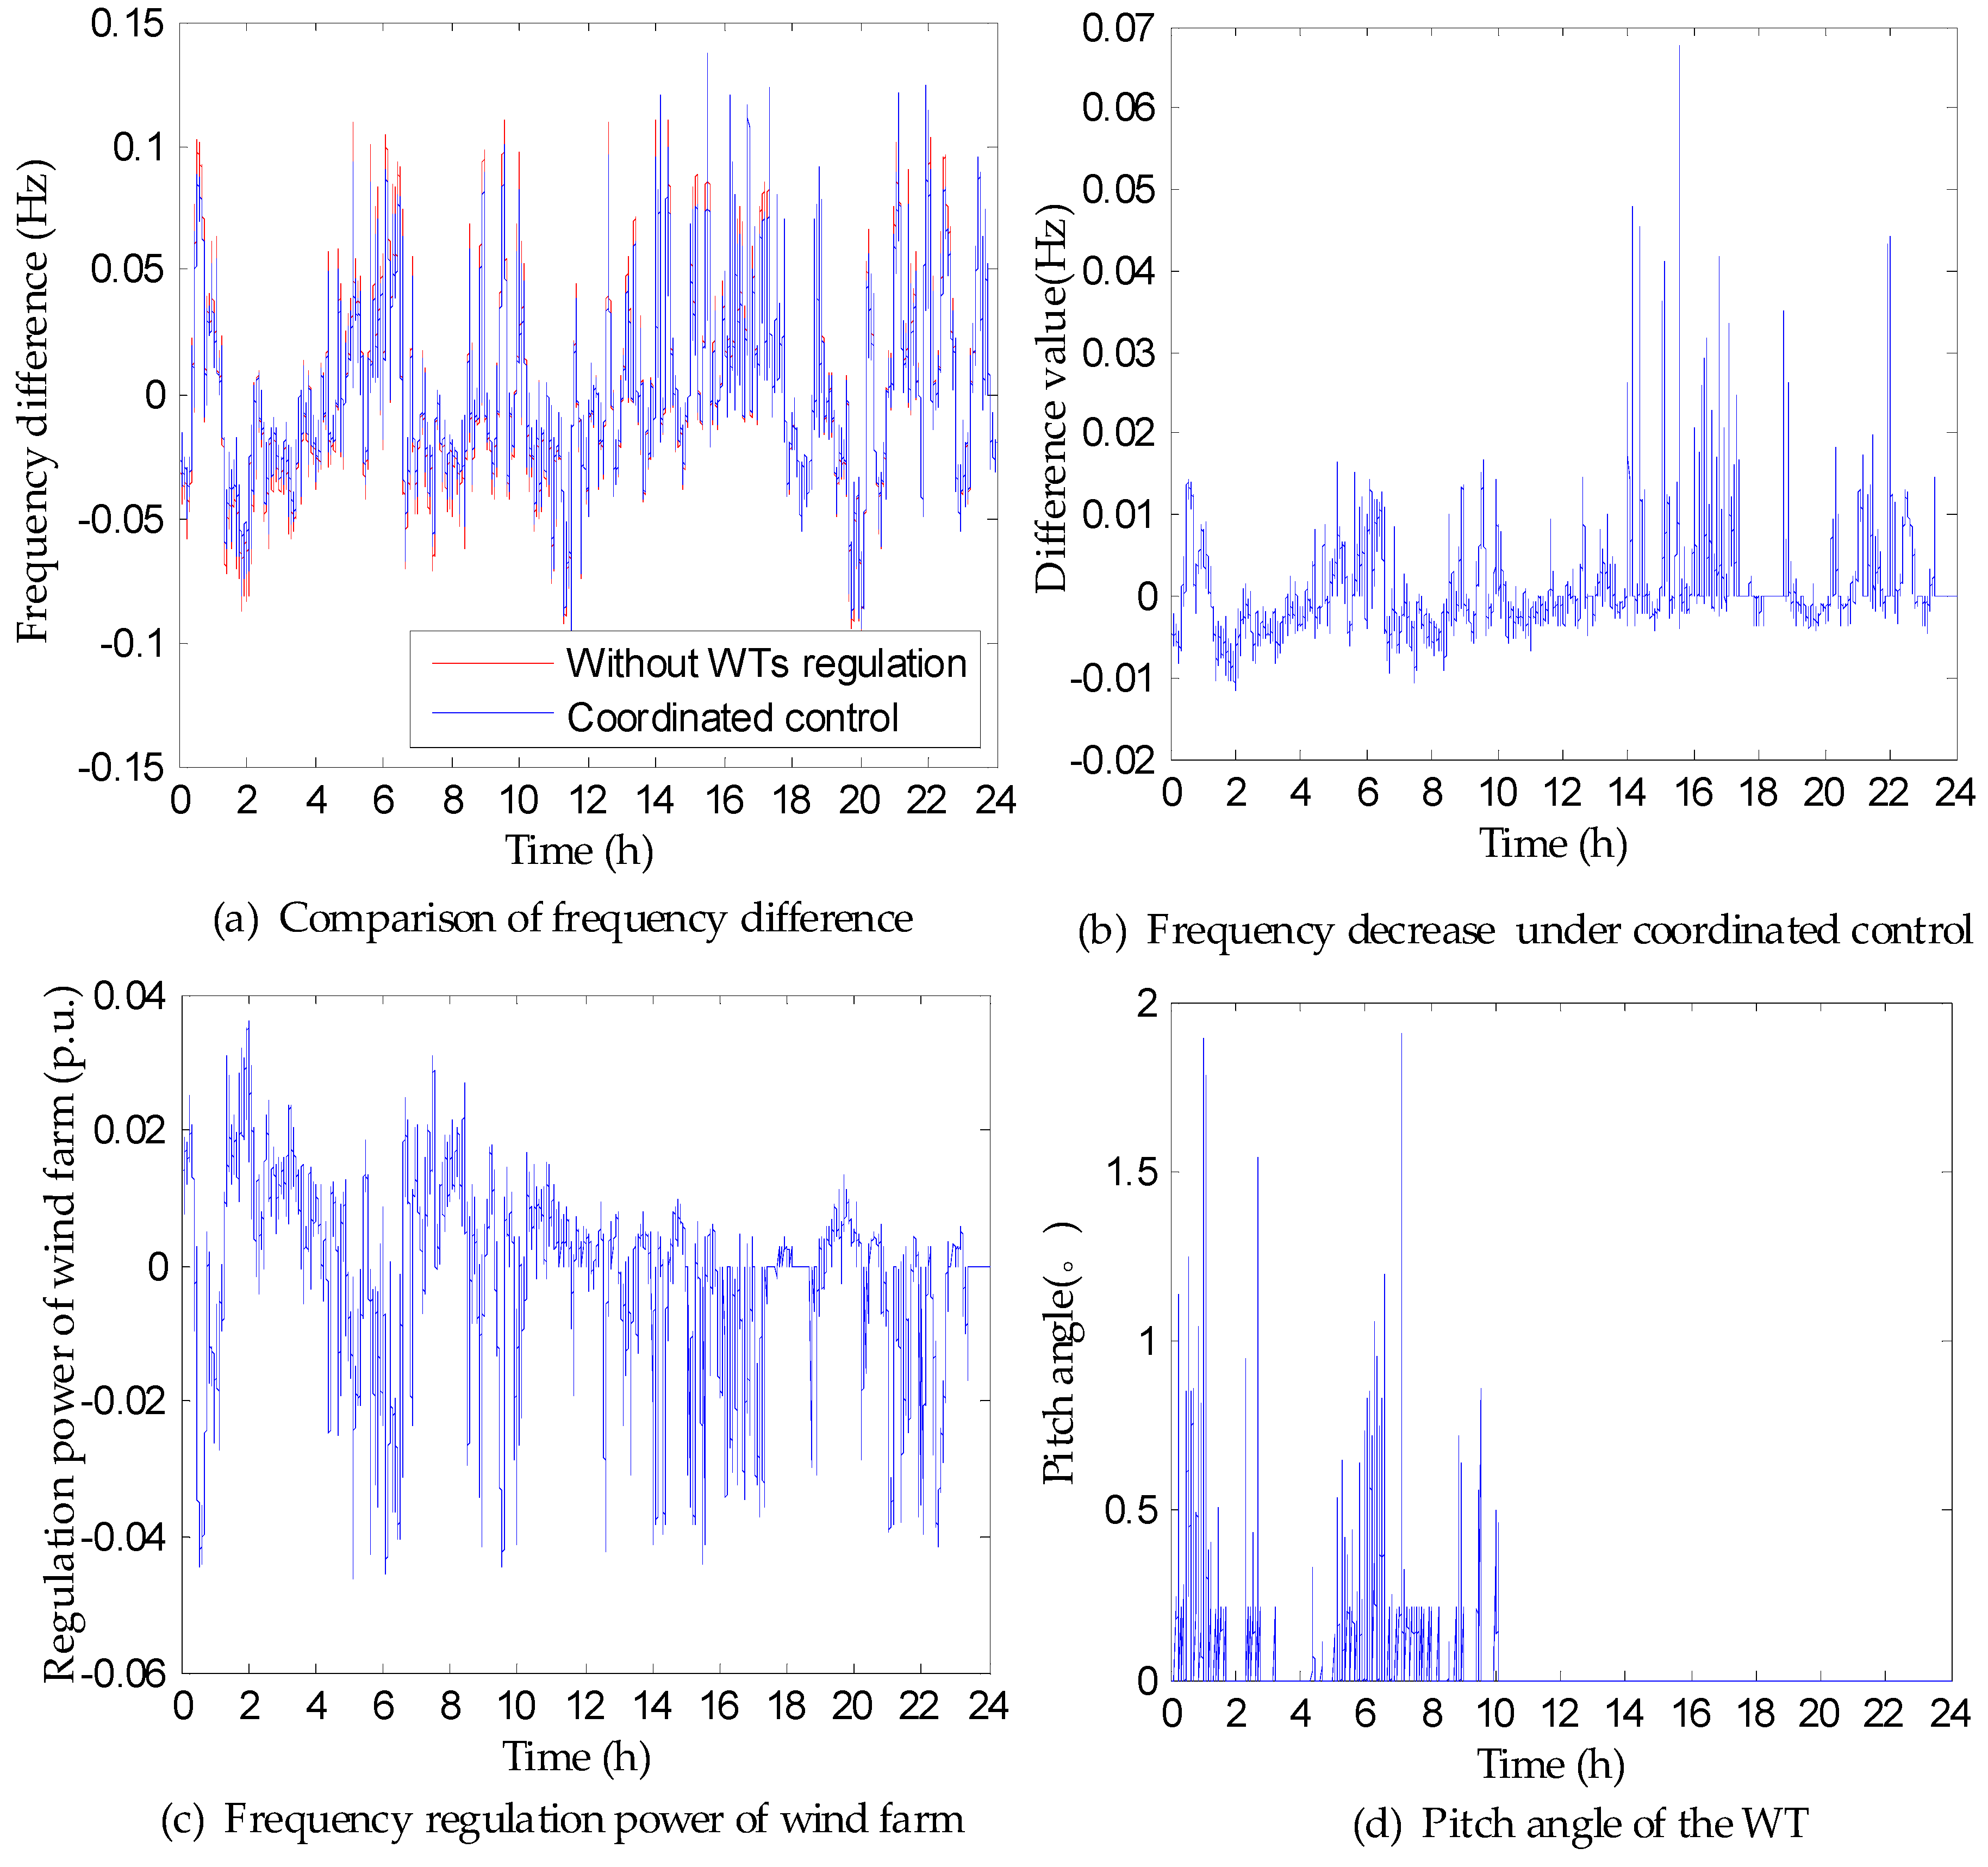
5.4.2. Frequency Regulation Effects under Rotor Speed and Pitch Coordinated Control Strategy
When
d = 0.05, under the rotor speed and pitch coordinated control strategy, the simulation results of the WTs participating in frequency regulation are shown in
Figure 13.
As shown in
Figure 13 and
Table 3:
is 0.0283 Hz, which is 9.58% lower than that of WTs non-participating in frequency regulation.
is 0.0096p.u., which is 23.47% of the average wind farm power, and the average pitch angle action degree
is 0.0344°.
The data in
Table 3 shows that as the reservation coefficient increases from
d = 0.05 to
d = 0.1,
decreases by 7.07%,
increases by 6.95%, and
increases by five times. Therefore, when designing the power reservation coefficient, the frequency regulation effects and the mechanical damage caused by the pitch angle action should be considered.
5.5. Analysis of Wind Power Utilization under Different Control Strategies
The WTs abandon the maximum power capture to participate in the bidirectional frequency regulation of the system. Because of the randomness of wind power and the system’s frequency, it is inevitable that reservation power is used less or even zero, and the WTs participate in downward frequency regulation, which result in the wind curtailment phenomenon.
The WTs participate in frequency regulation, the wind power utilization under different control strategies are shown in the
Table 4. Compared with the rotor speed control strategy
d=0.05, under the coordinated control strategy, when
d = 0.05 and
d = 0.1, the reservation power utilization decreases by 7.37% and 45.47%, respectively, and the wind curtailment power increases by 27.9% and 100.5%, respectively.
Based on the above analysis, under the designed example of this paper, considering the dual target optimization of frequency quality and wind curtailment power, power reservation coefficient d = 0.05 is more reasonable for WTs participating in the frequency regulation.


