Accelerated Particle Swarm Optimization for Photovoltaic Maximum Power Point Tracking under Partial Shading Conditions


Abstract
1. Introduction
2. Overview of Particle Swarm Optimization Algorithm
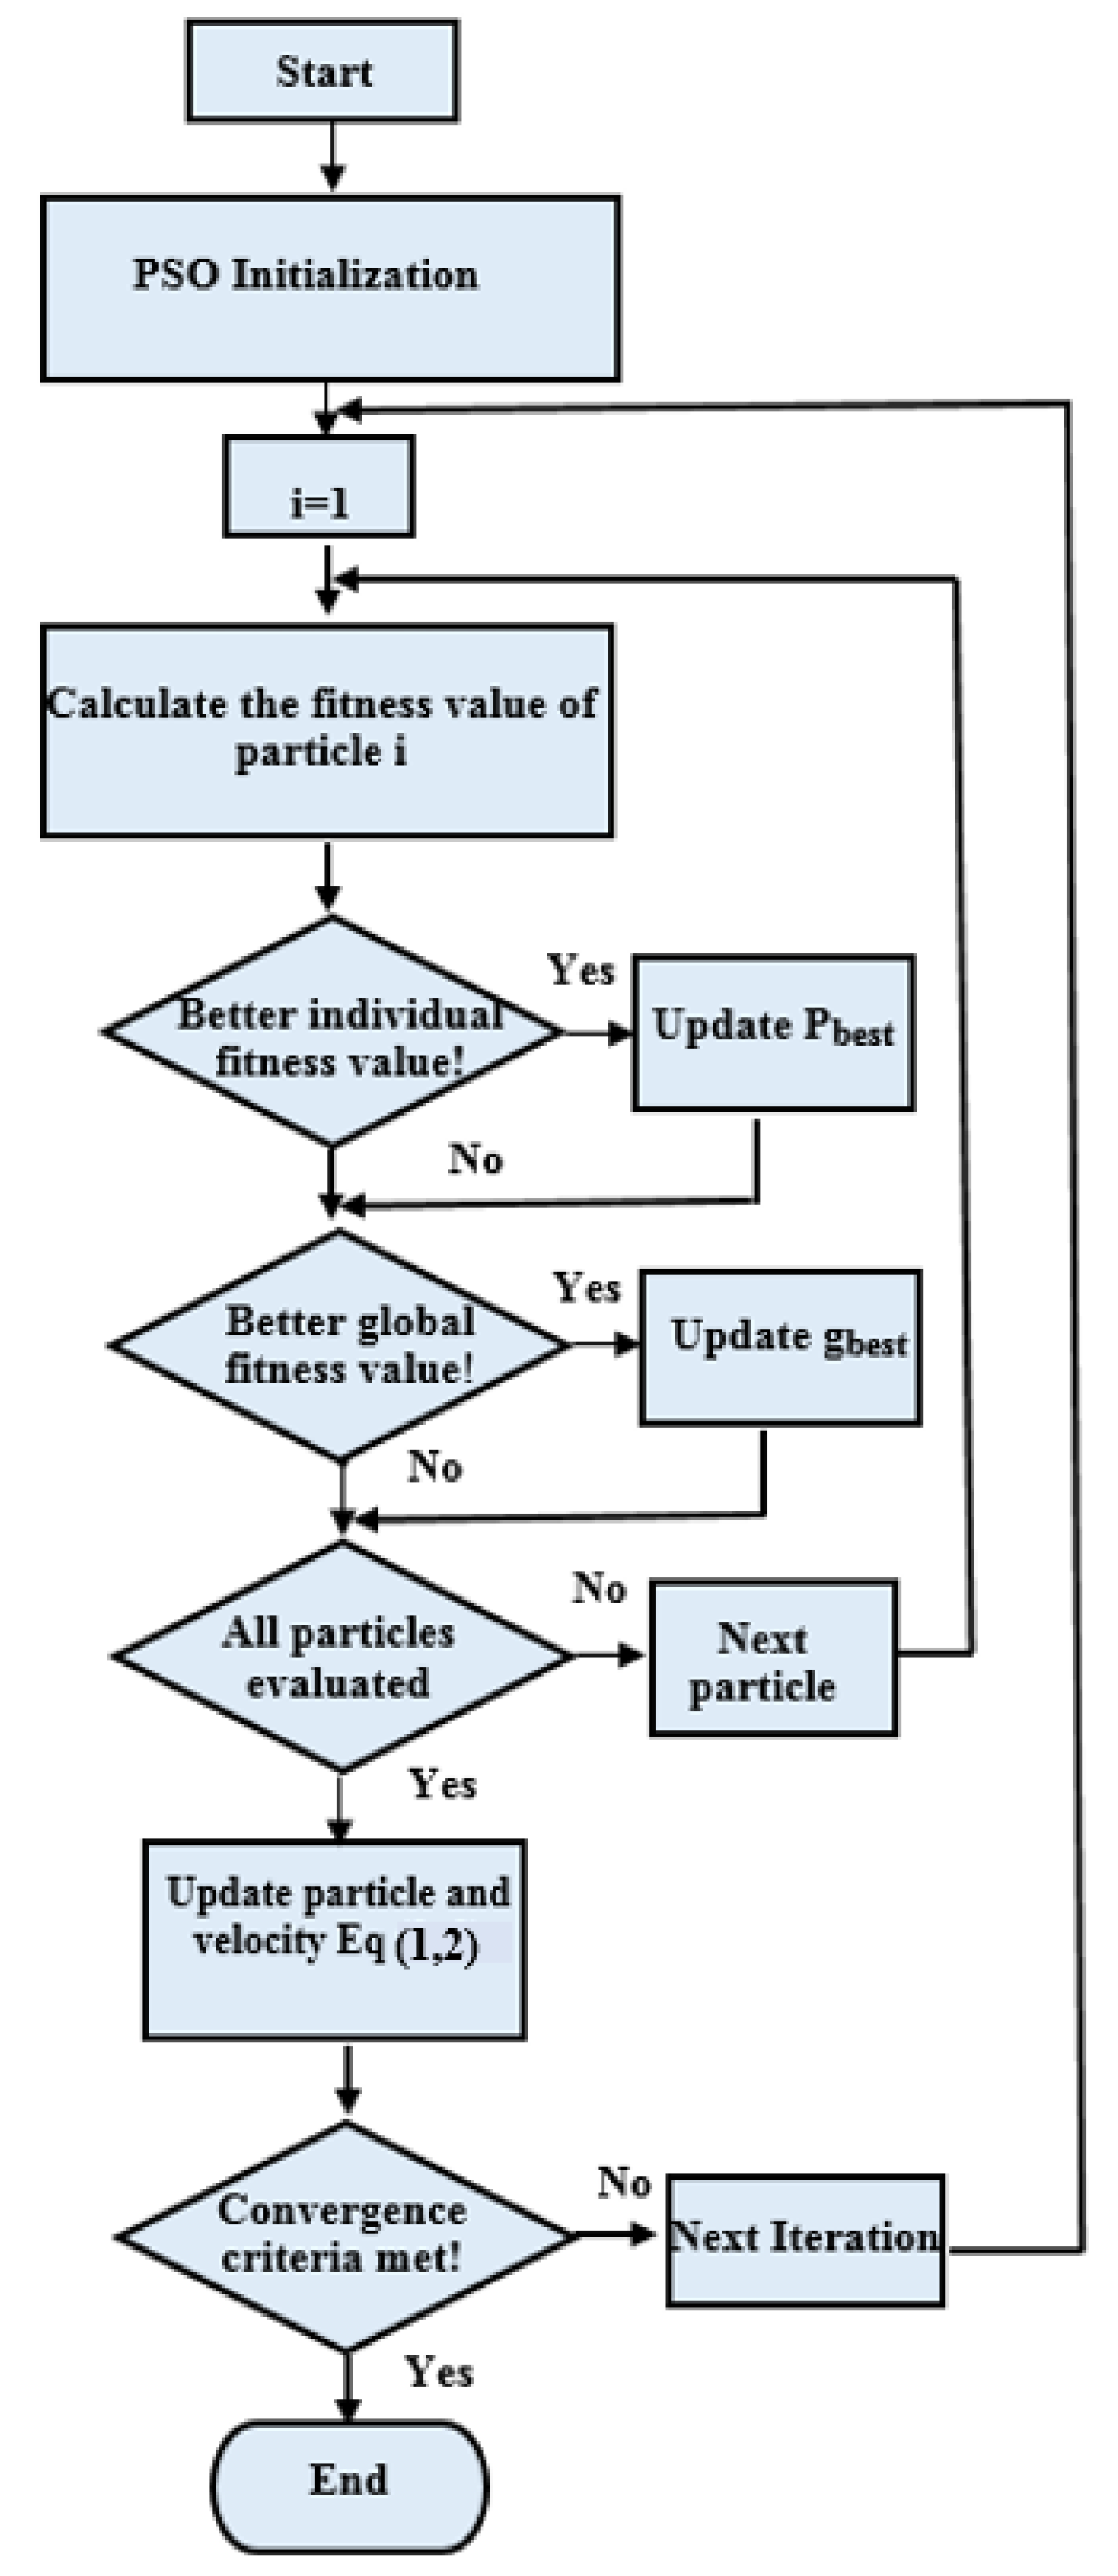
- Step 1:
- Initialize the particles randomly in the search space.
- Step 2:
- Evaluate the fitness value of each particle by sending the candidate solution to the objective function.
- Step 3:
- Update and .
- Step 4:
- Update the position and velocity of each particle.
- Step 5:
- Re-initialize the PSO algorithm unless the constrain is met. In other words, the algorithm stops when the is founded.
3. Proposed Accelerated PSO Algorithm
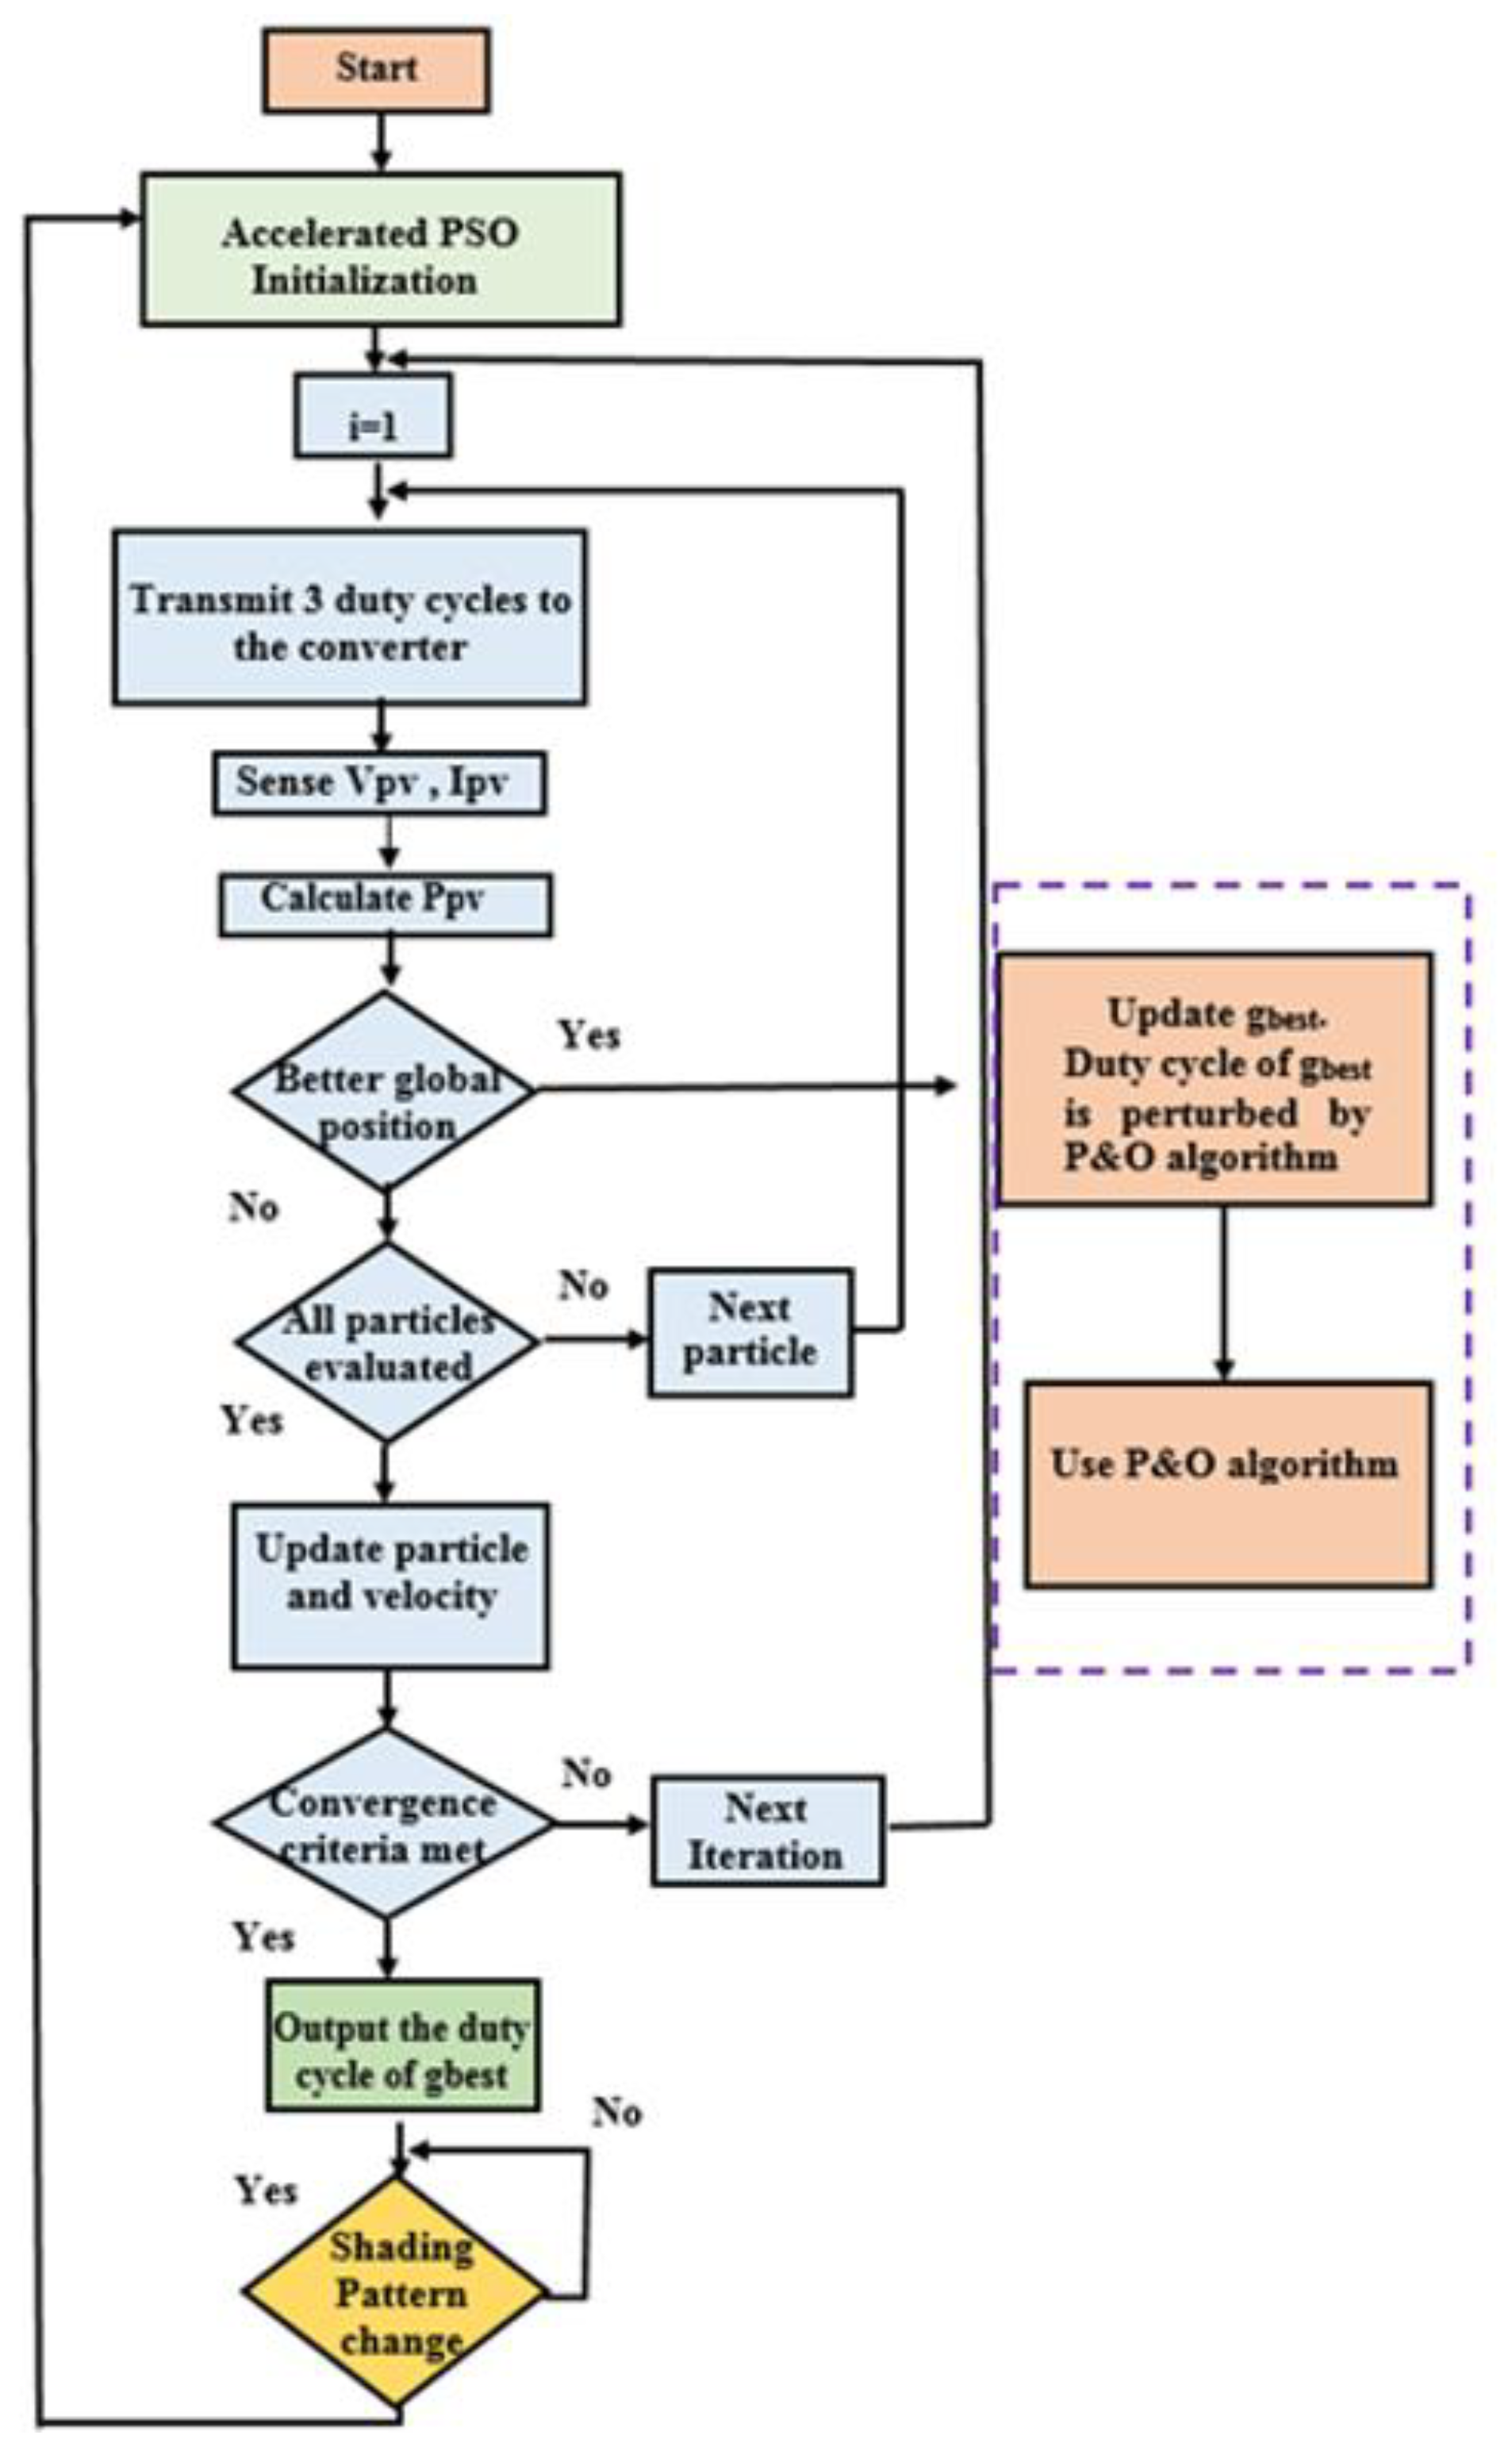
- Step 1
- (Parameter Selection): The number of particles is three. A complete optimization analysis has been done in [24], and it claimed that three particles deliver the best performance.
- Step 2
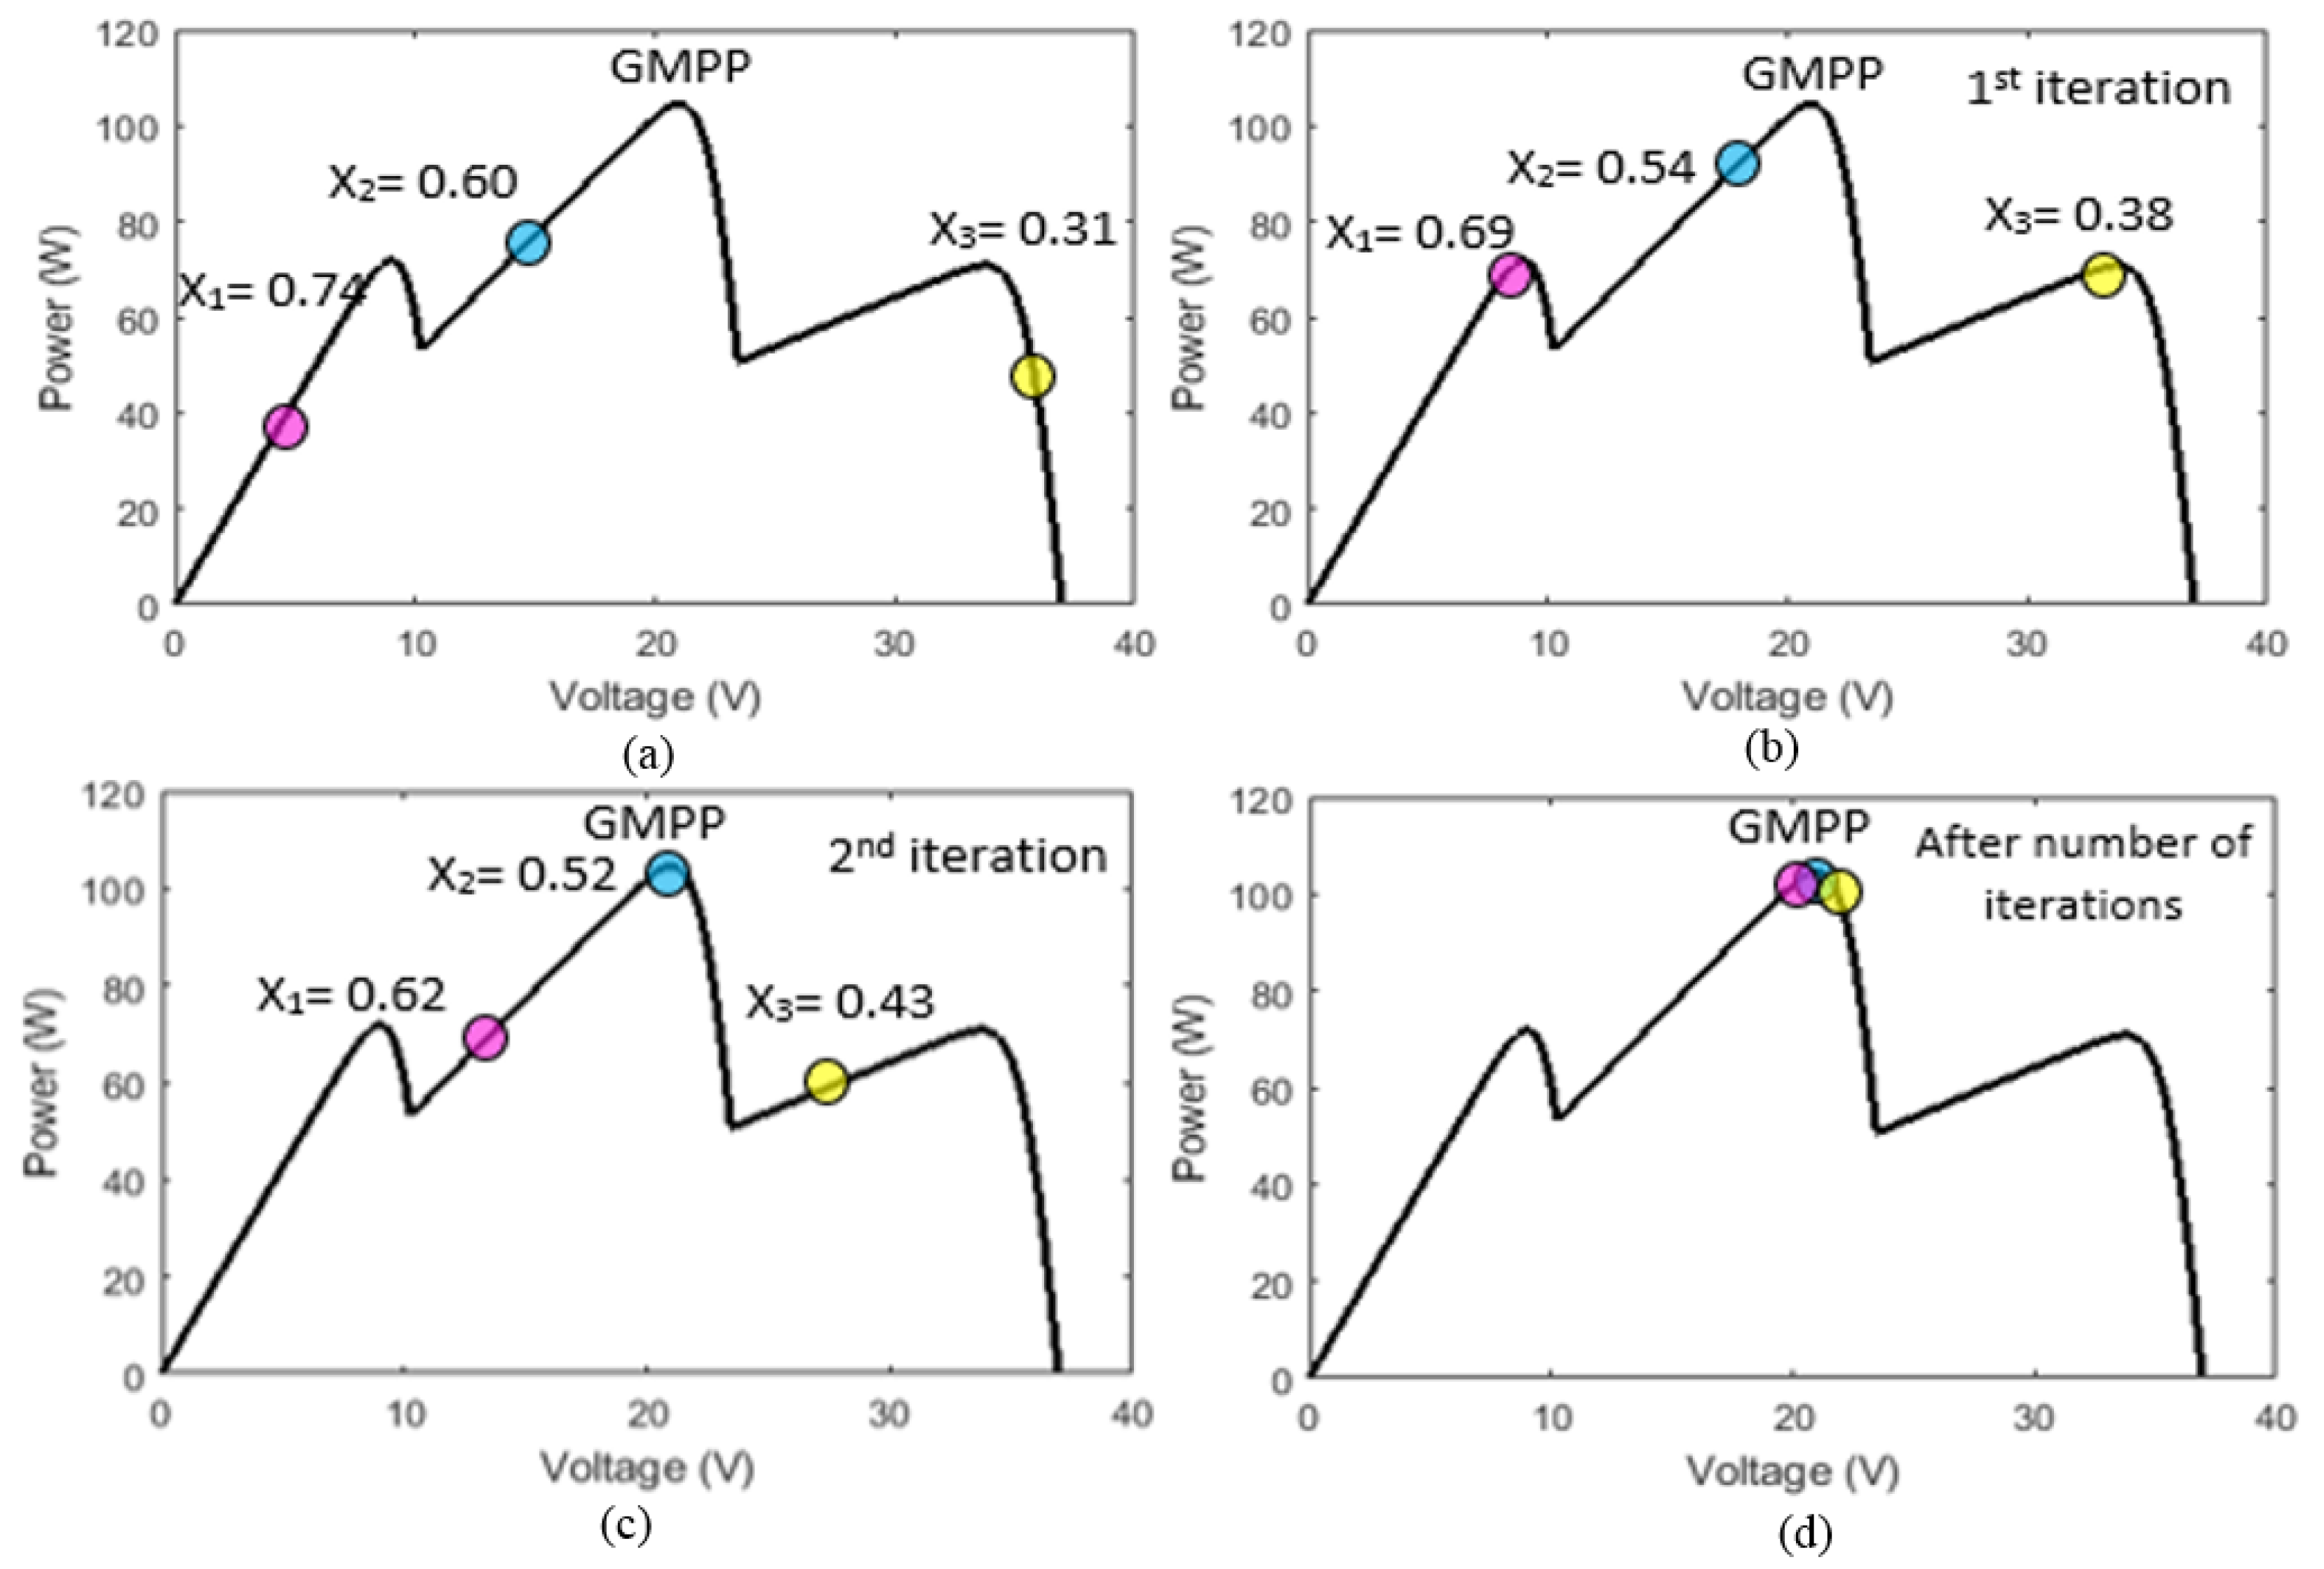
- (APSO Initialization): In the proposed APSO algorithm, the particles are placed on fixed positions. The first particle is set as 10% of the PV open circuit voltage (), the third particle is set as 90% of . The first and third particles defined the PSO search space. The second particle is randomly set between 10% and 90% of .
- Step 3
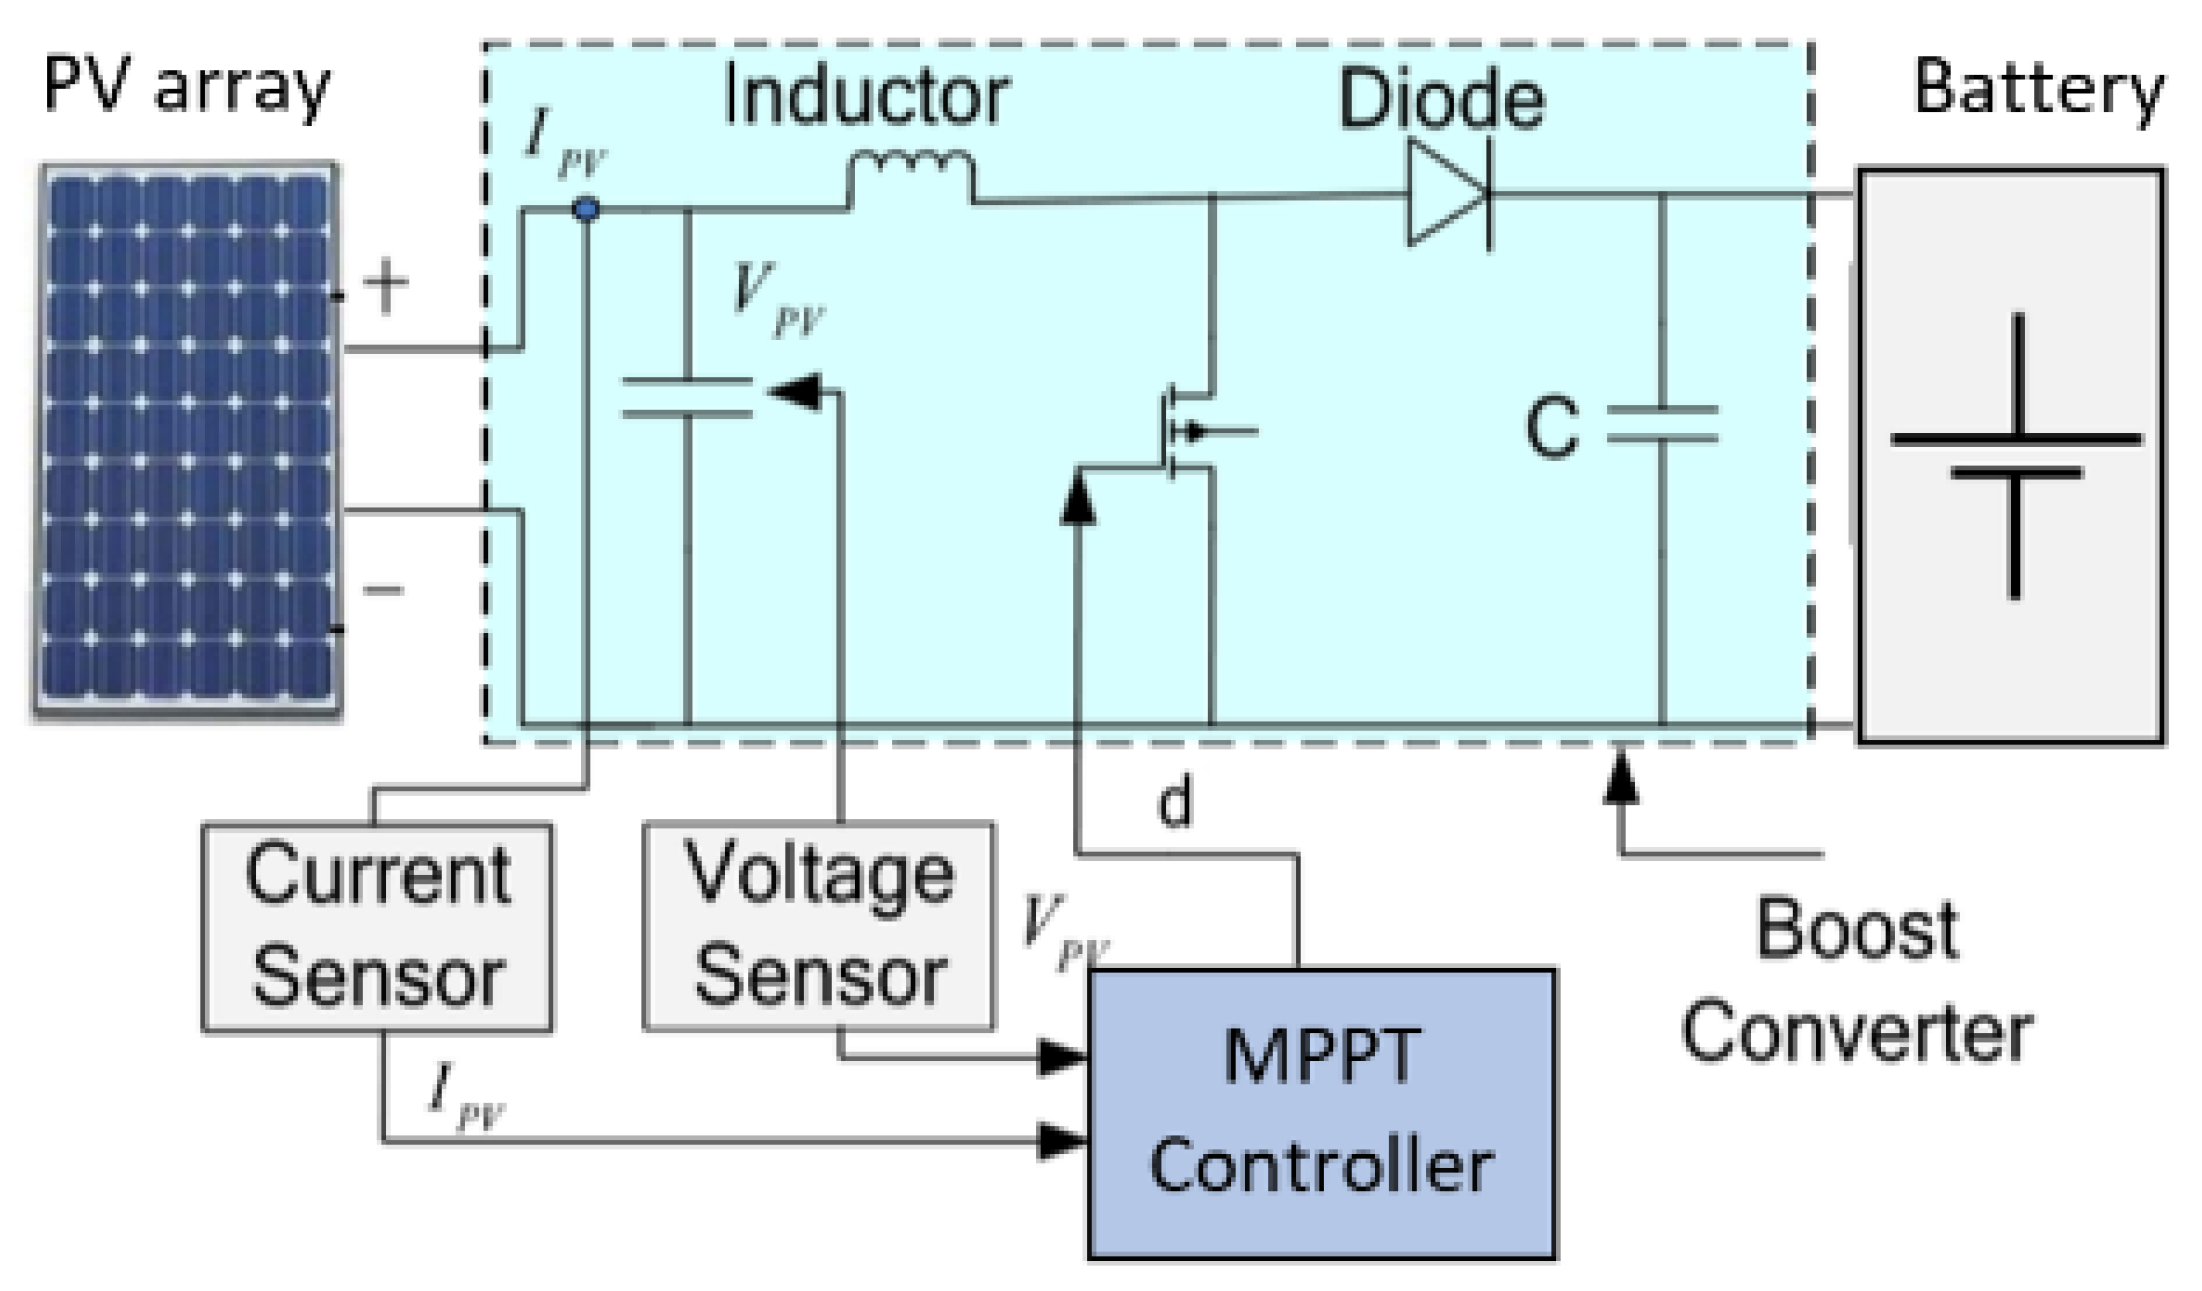
- (Fitness Evaluation): The purpose of the PSO-based MPPT method is to maximize the PV output power. PV voltage and current are measured to compute the PV output power as the fitness value for evaluation.
- Step 4
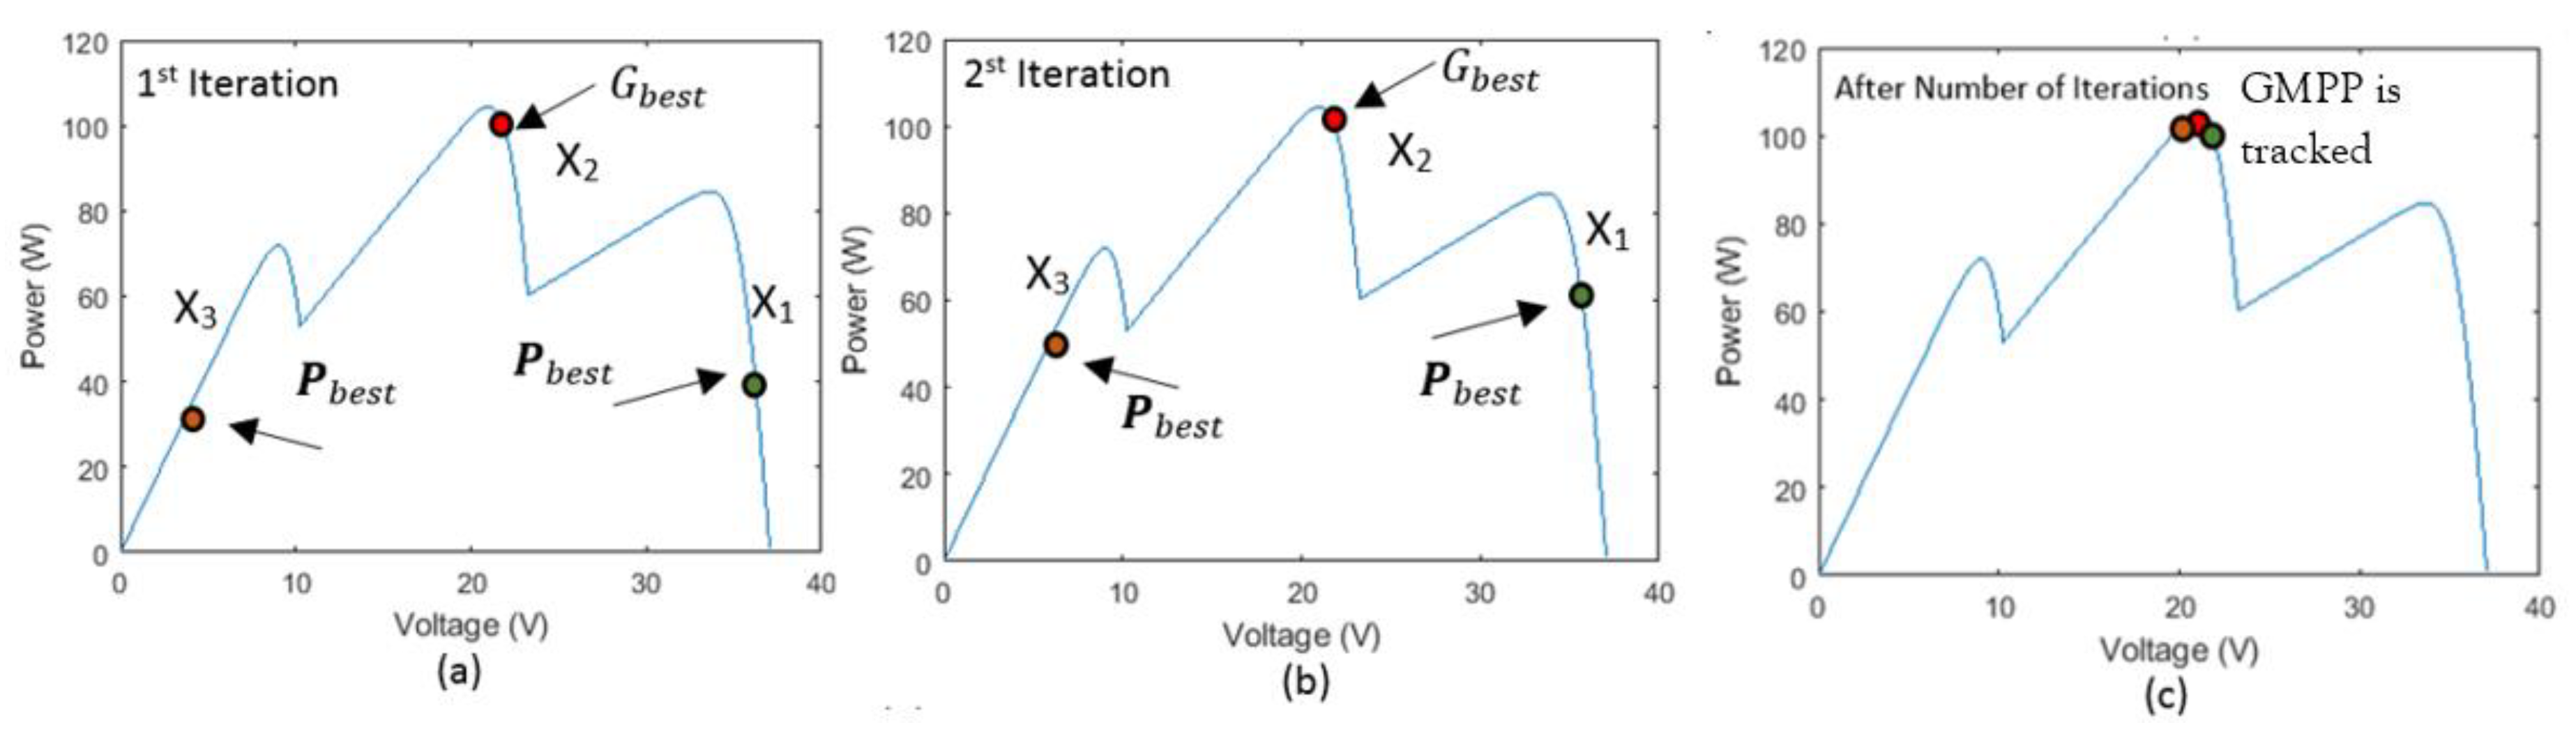
- (Update the Global Value): The particle which has the best fitness value is selected as the . In conventional PSO-based MPPT algorithms, is usually fixed. In this proposed APSO method, P&O MPPT algorithm is used to directly perturb the to accelerate the global MPP searching, so that will be moved towards a higher fitness value. In conventional PSO-based MPPT algorithms, the velocity of the particle is reducing when the particle is moving toward the . In this proposed APSO method, can move to a higher fitness value via P&O algorithm, and simultaneously attracts the remaining particle more rapidly to converge toward it. Therefore, the convergence time could be decreased.
- Step 5
- (Update the Velocity and Position of Each Particle): Once all the particles are assessed, the position and velocity of each particle need to be updated.
- Step 6
- (Convergence Determination): Two convergence criteria will be examined in this step. If the particle’s velocity becomes lower than a set value or if the maximum iteration number is reached, the algorithm computation will be stopped, and the global MPP is found.
- Step 7
- (Re-initialization): The global MPP position frequently changes with the environmental conditions. This requires the APSO algorithm to be reinitialized and search for the new global MPP. In this research, Equation (10) is used to identify the environmental conditions changes and reinitialize the APSO algorithm.
4. Experimental Results
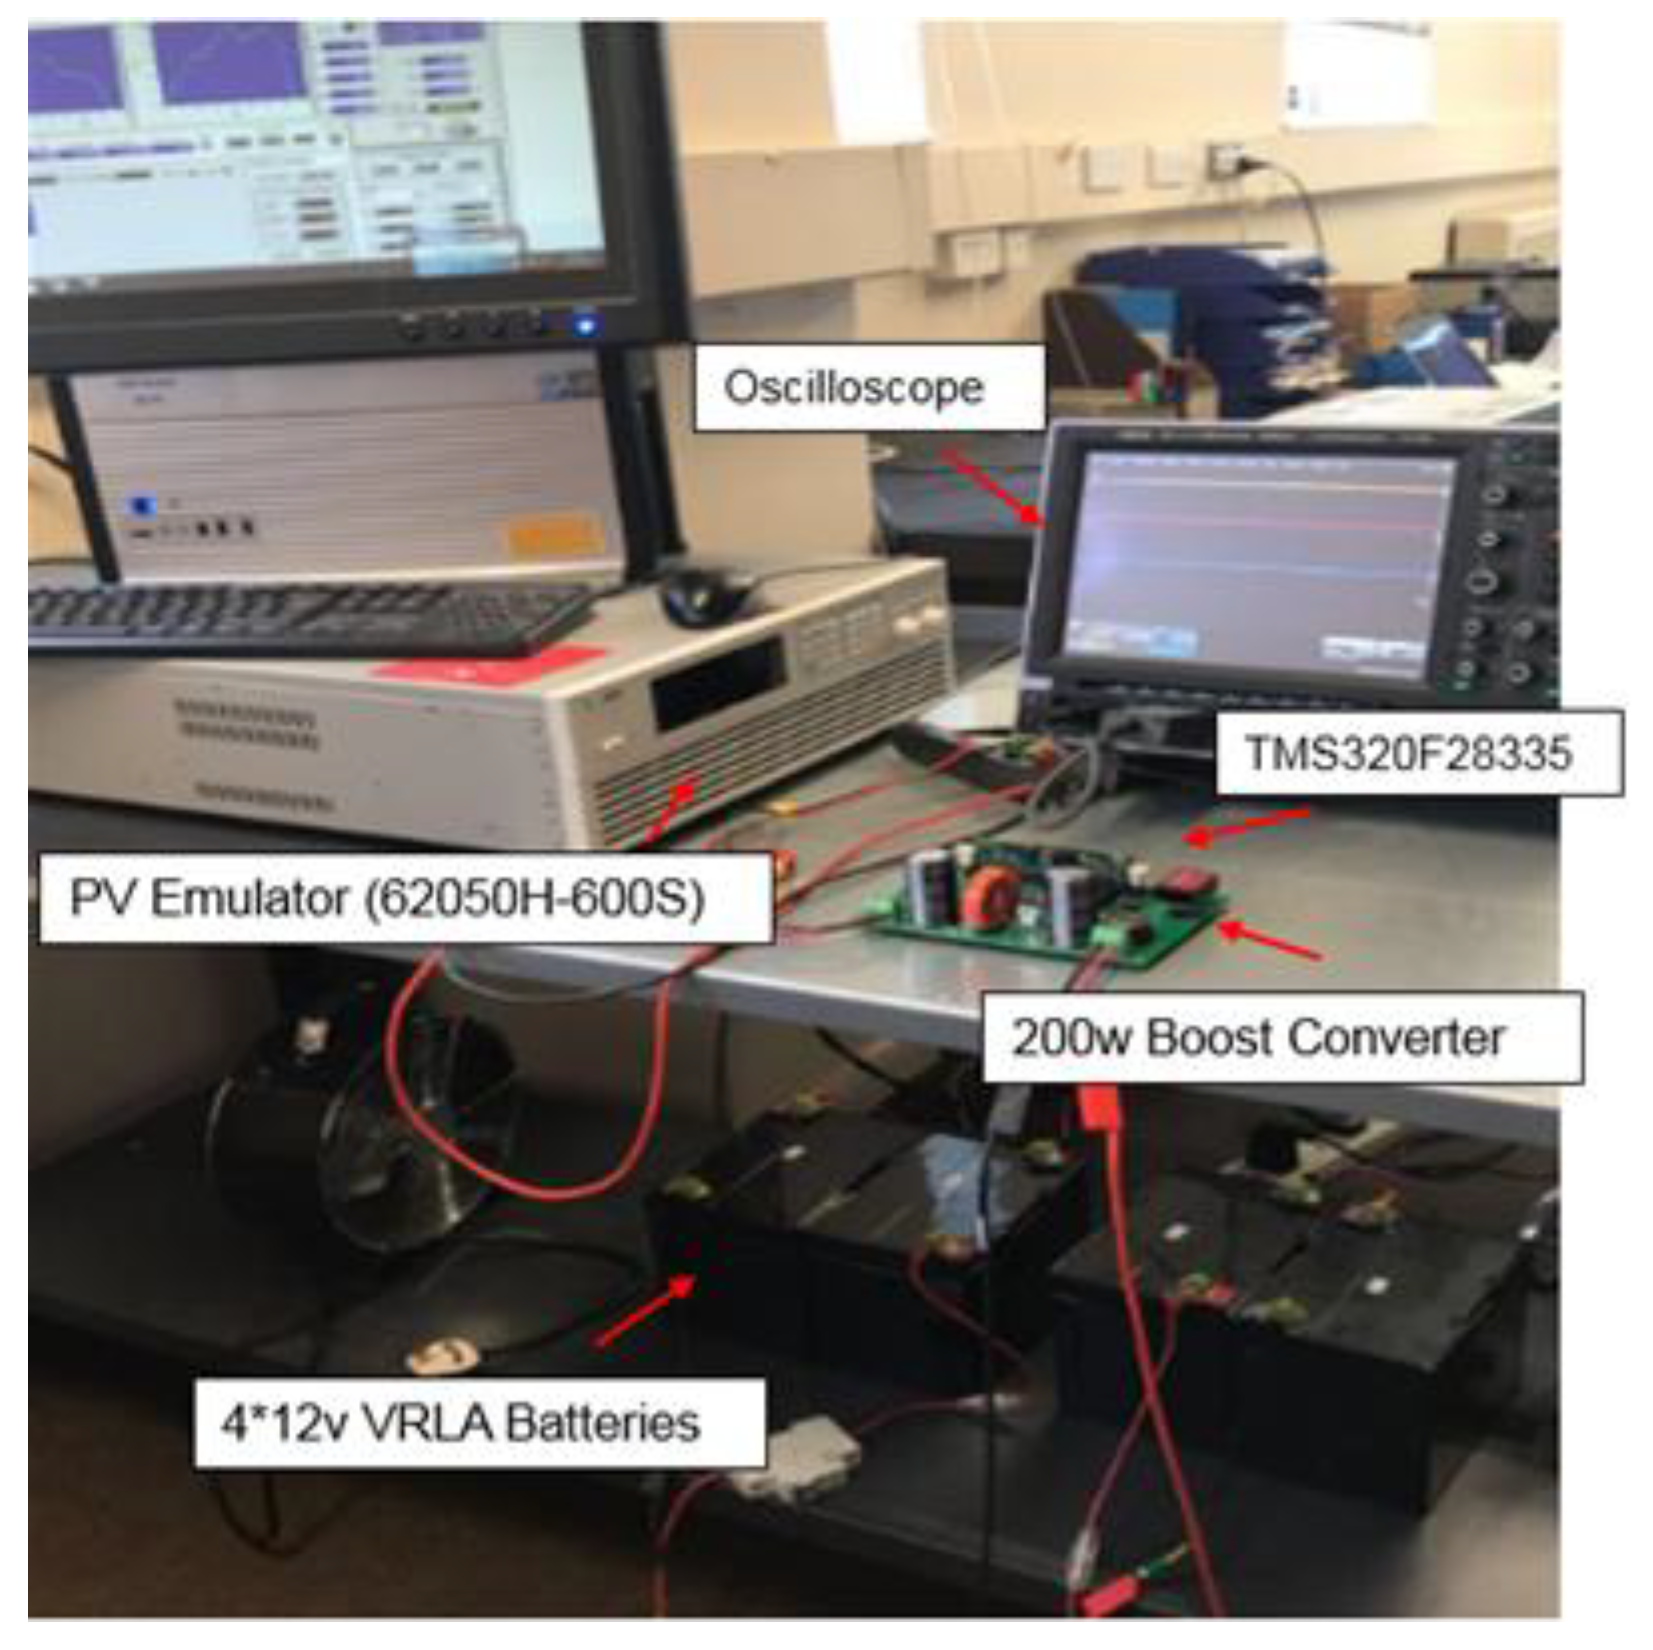
4.1. Experimental Setup Configuration
4.2. Setting the Parameter Values of the Particle Swarm Optimization Algorithm
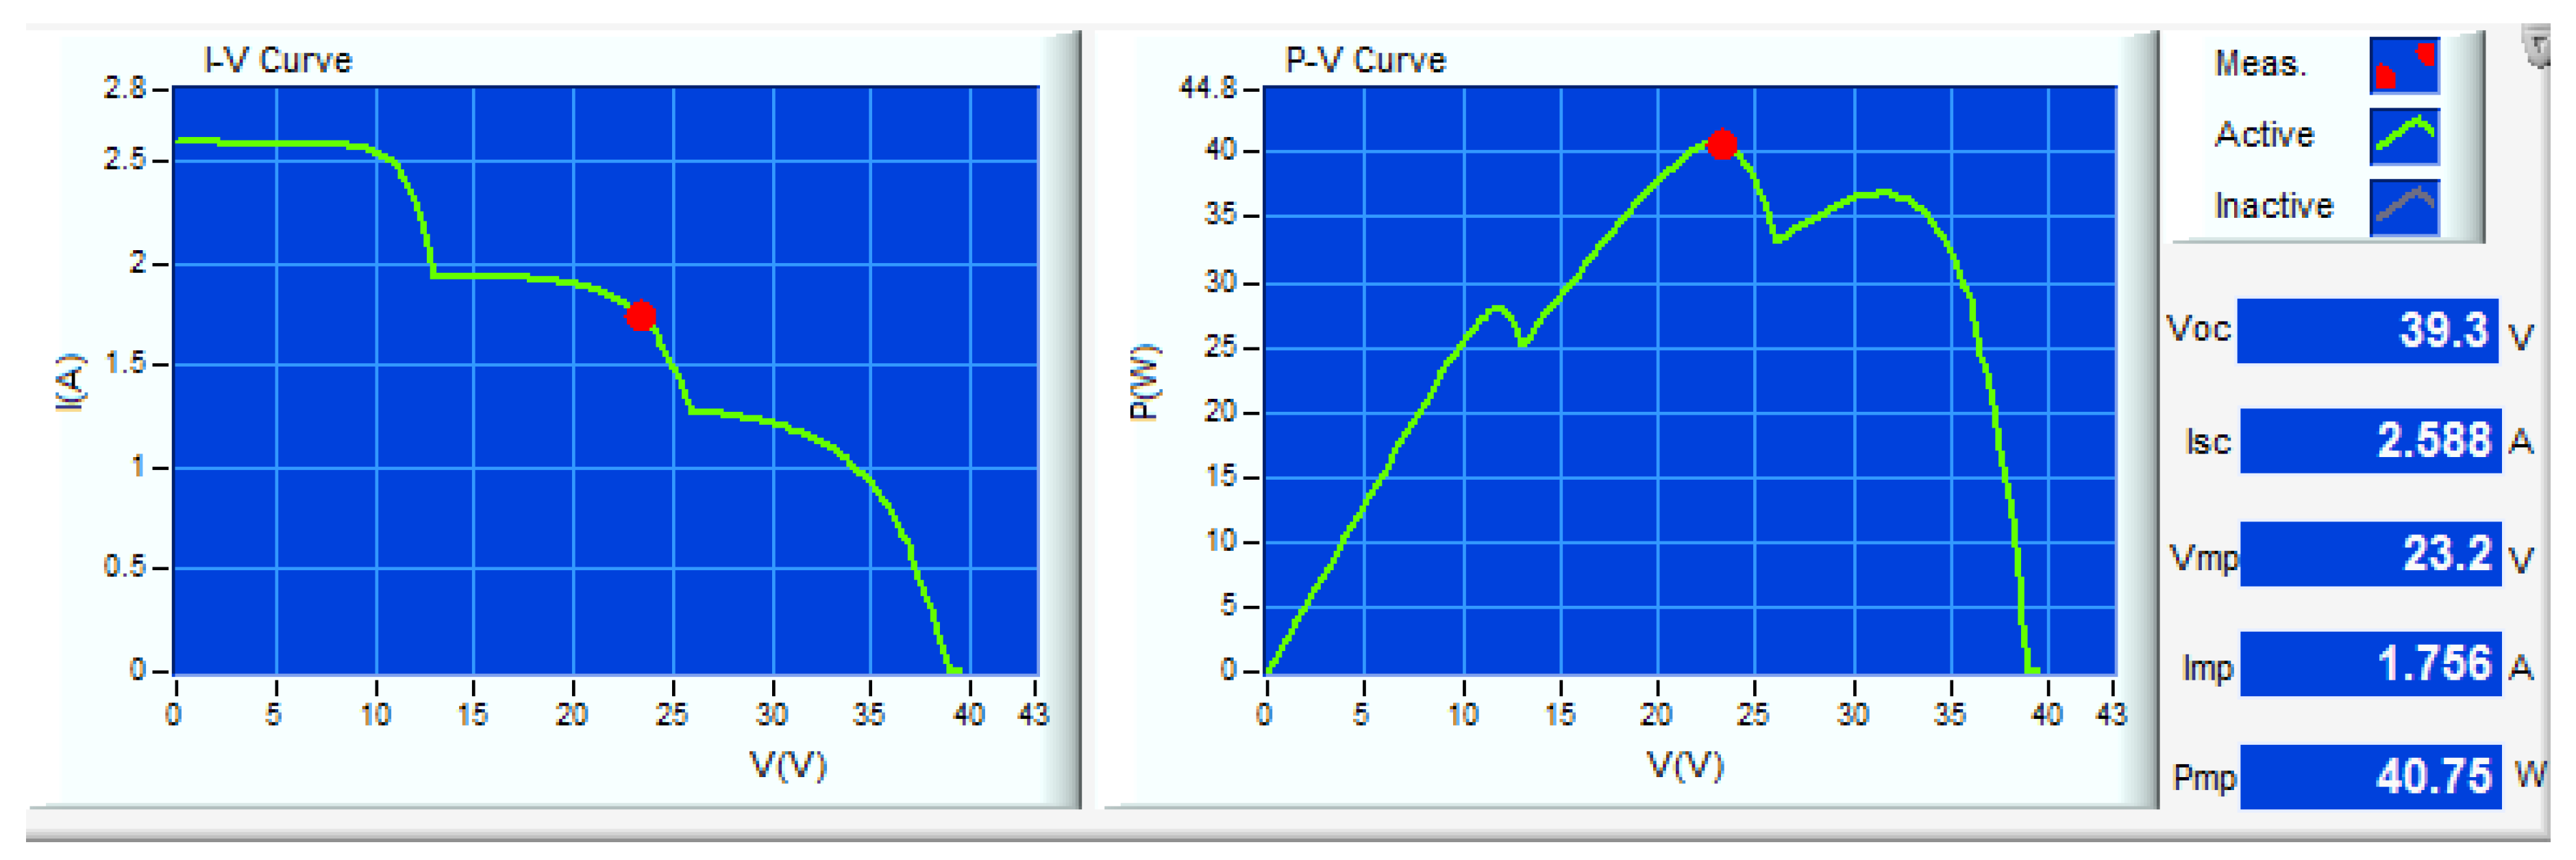
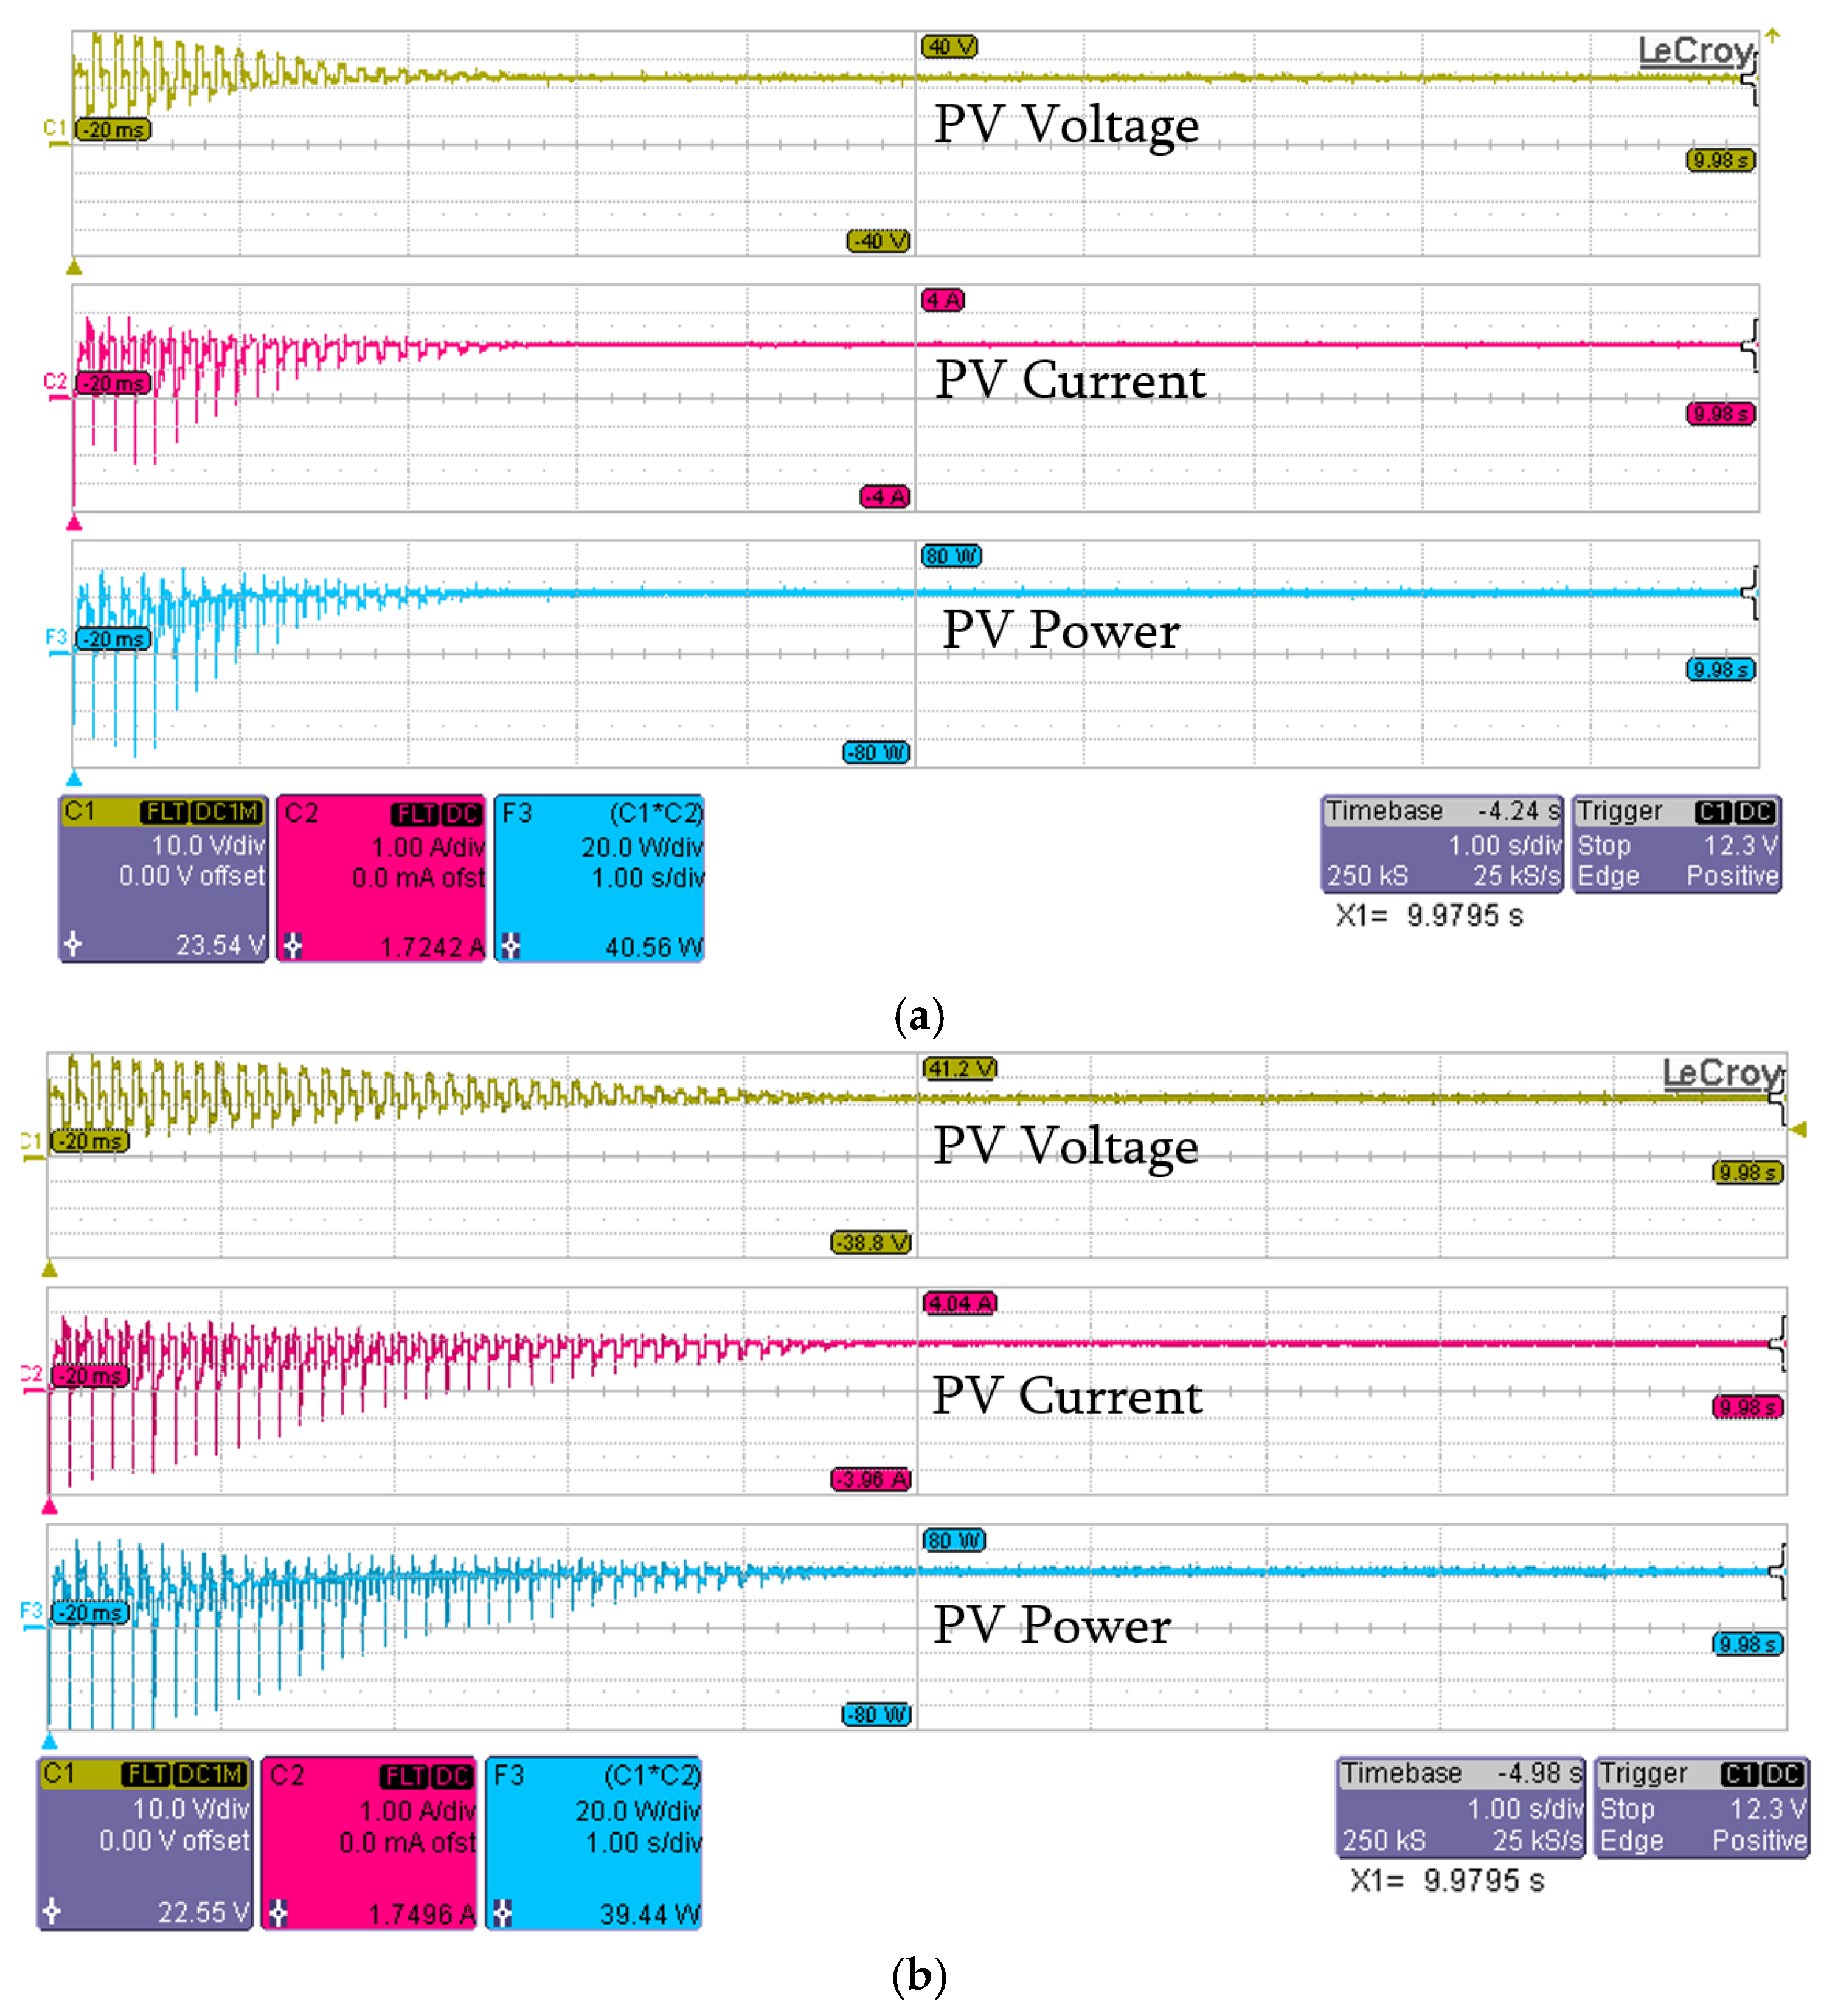
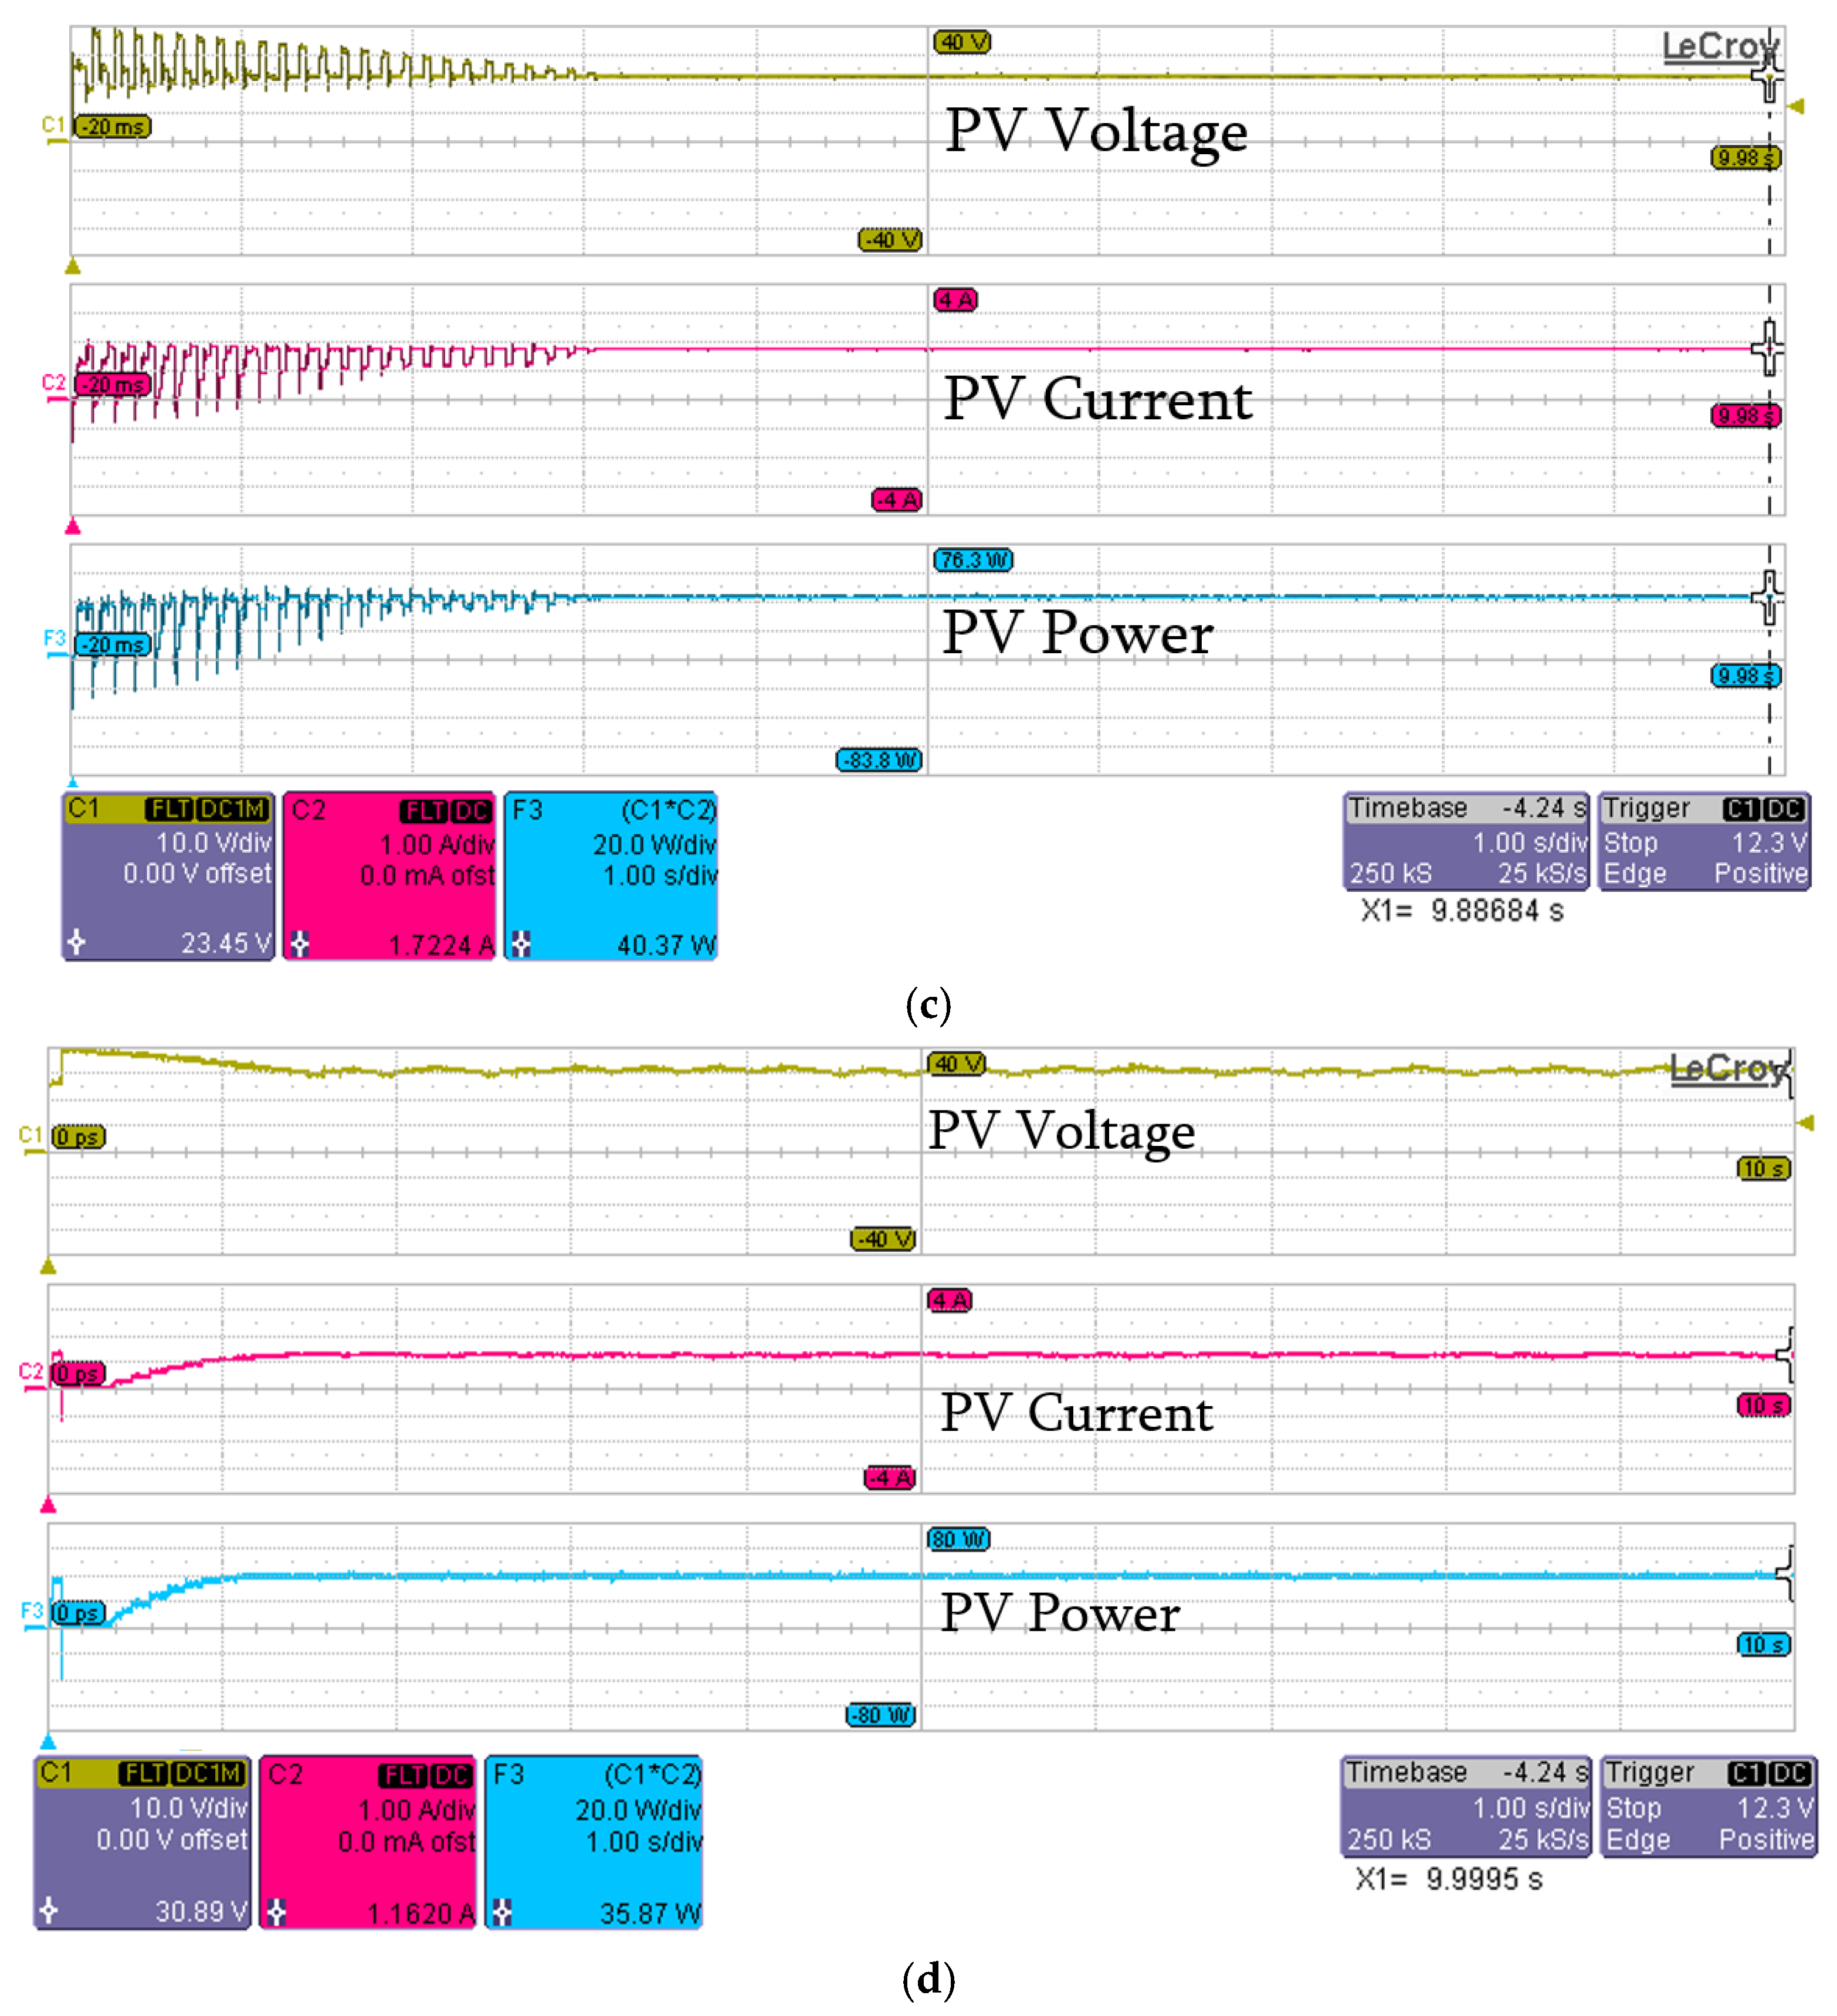
4.3. Case Studies
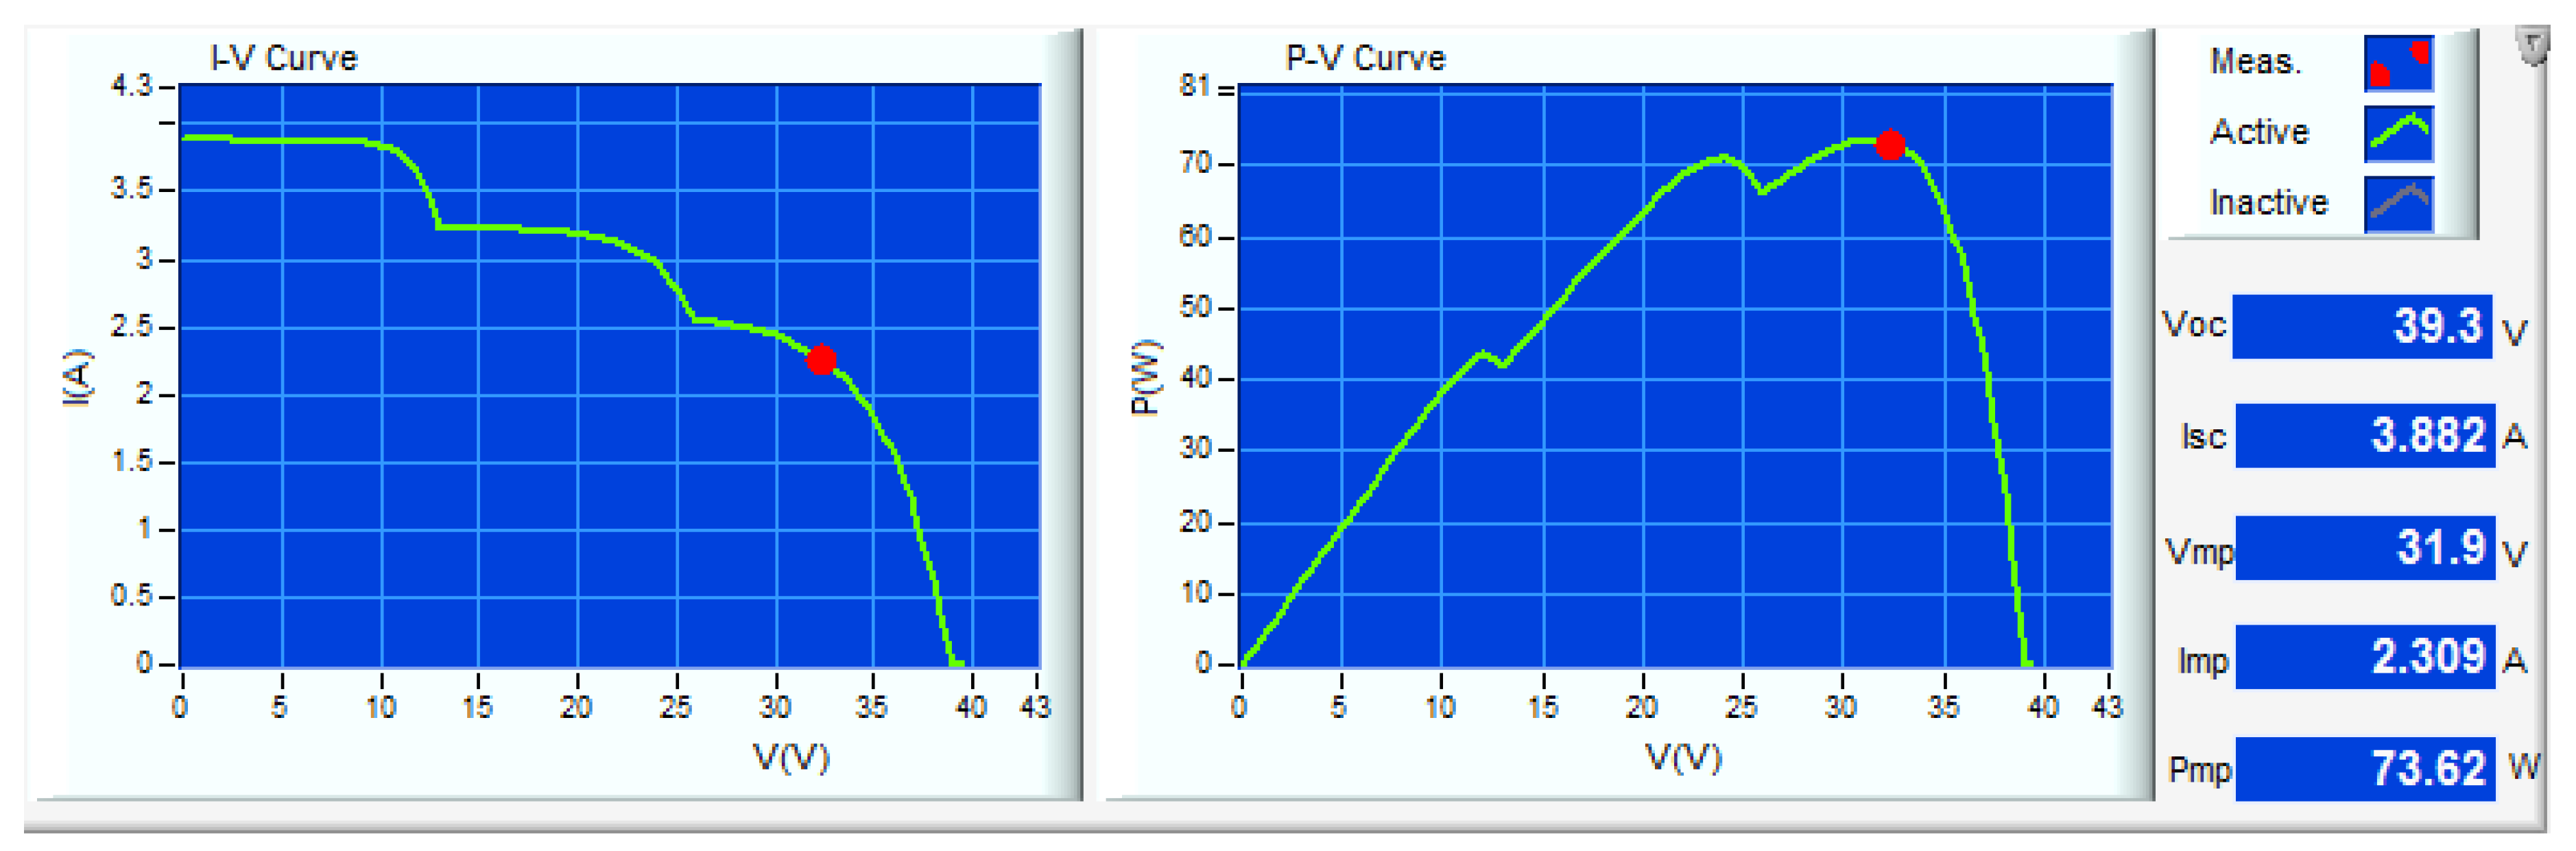
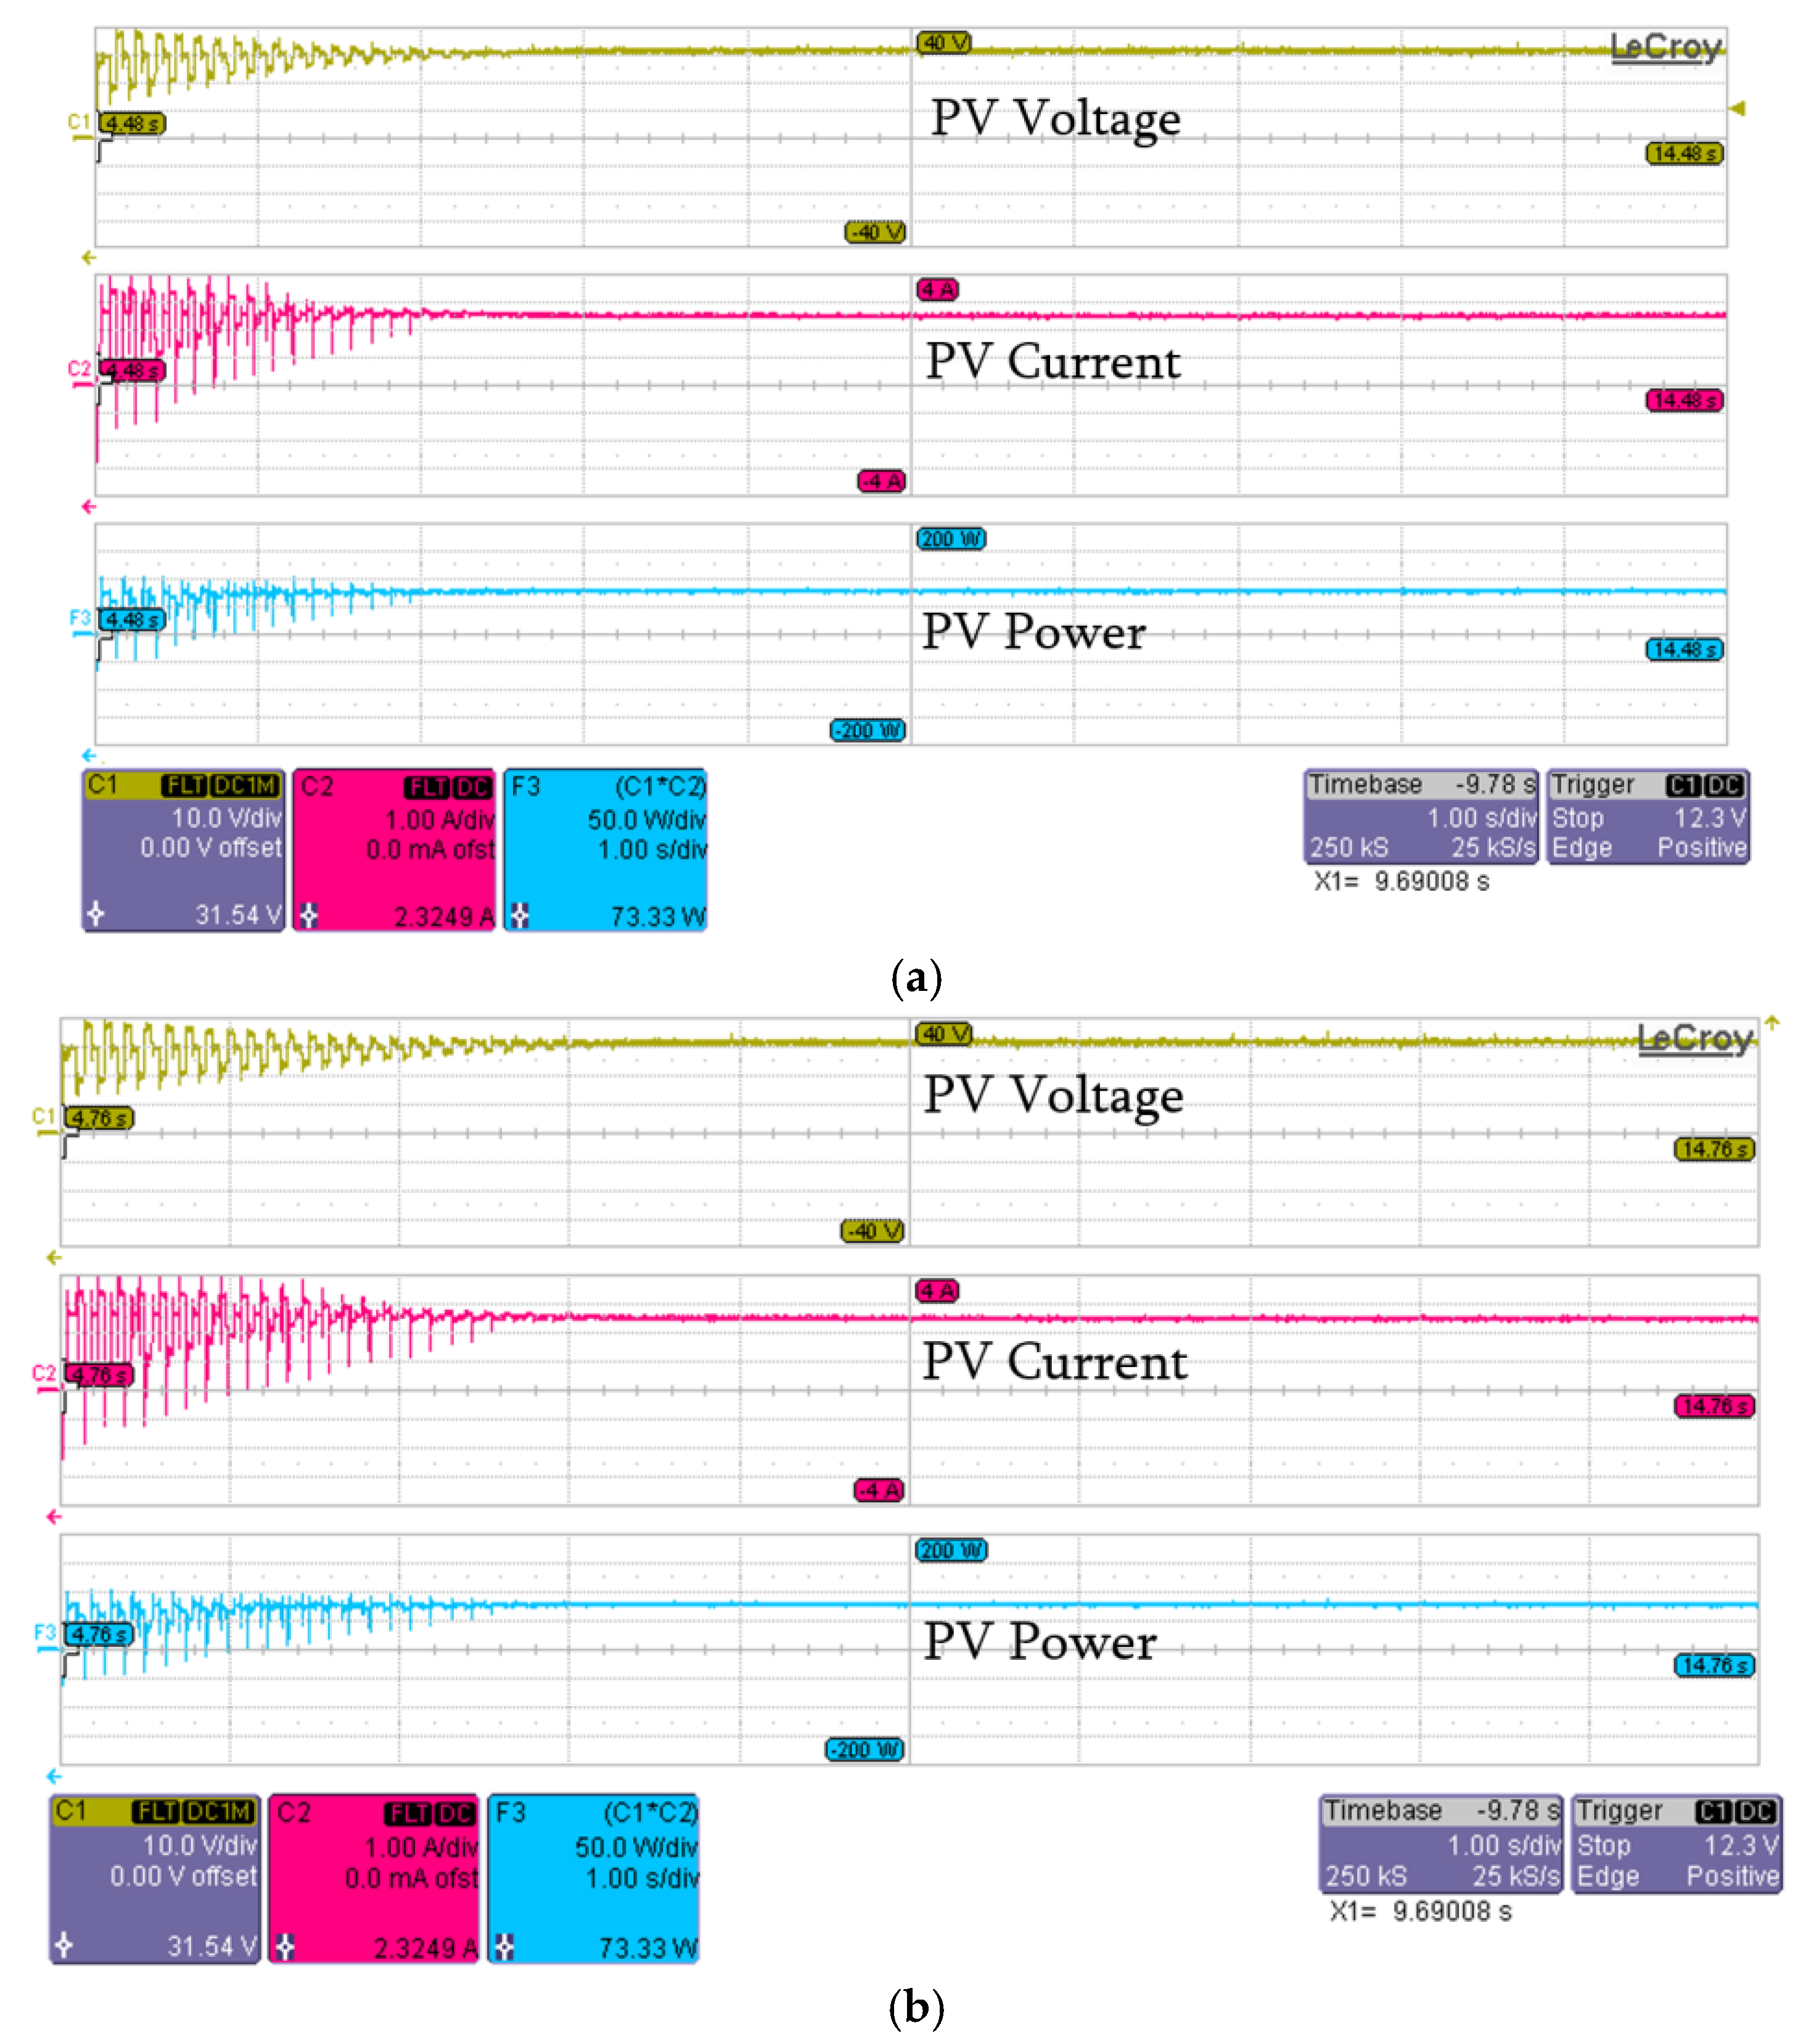
4.4. Test under Partial Shading Variations
5. Conclusions
Author Contributions
Funding
Conflicts of Interest
References
- Chiu, H.J.; Lo, Y.K.; Yao, C.J.; Lee, T.P.; Wang, J.M.; Lee, J.X. A Modular Self-Controlled Photovoltaic Charger with Inter Integrated Circuit (I2C) Interface. IEEE Trans. Energy Convers. 2011, 26, 281–289. [Google Scholar] [CrossRef]
- Farivar, G.; Asaei, B. A New Approach for Solar Module Temperature Estimation Using the Simple Diode Model. IEEE Trans. Energy Convers. 2011, 26, 1118–1126. [Google Scholar] [CrossRef]
- Lopez-Lapena, O.; Penella, M.; Gasulla, M. A Closed-Loop Maximum Power Point Tracker for Subwatt Photovoltaic Panels. IEEE Trans. Ind. Electron. 2012, 59, 1588–1596. [Google Scholar] [CrossRef]
- Mäki, A.; Valkealahti, S. Power Losses in Long String and Parallel-Connected Short Strings of Series-Connected Silicon-Based Photovoltaic Modules Due to Partial Shading Conditions. IEEE Trans. Energy Convers. 2012, 27, 173–183. [Google Scholar] [CrossRef]
- Thounthong, P. Model Based-Energy Control of a Solar Power Plant with a Supercapacitor for Grid-Independent Applications. IEEE Trans. Energy Convers. 2011, 26, 1210–1218. [Google Scholar] [CrossRef]
- Bidram, A.; Davoudi, A.; Balog, R. Control and Circuit Techniques to Mitigate Partial Shading Effects in Photovoltaic Arrays. IEEE J. Photovolt. 2012, 2, 532–546. [Google Scholar] [CrossRef]
- Soon, K.; Mekhilef, S.; Safari, A. Simple and low cost incremental conductance maximum power point tracking using buck-boost converter. J. Renew. Sustain. Energy 2013, 5, 023106. [Google Scholar]
- Kjær, S.B. Evaluation of the Hill Climbing and the Incremental Conductance Maximum Power Point Trackers for Photovoltaic Power Systems. IEEE Trans. Energy Convers. 2012, 27, 922–929. [Google Scholar] [CrossRef]
- Sera, D.; Mathe, L.; Kerekes, T.; Spataru, S.; Teodorescu, R. On the Perturb-and-Observe and Incremental Conductance MPPT Methods for PV Systems. IEEE J. Photovolt. 2013, 3, 1070–1078. [Google Scholar] [CrossRef]
- Salas, V.; Olias, E.; Barrado, A.; Lazaro, A. Review of the maximum power point tracking algorithms for stand-alone photovoltaic systems. Sol. Energy Mater. Sol. Cells 2006, 90, 1555–1578. [Google Scholar] [CrossRef]
- Kollimalla, S.K.; Mishra, M.K. Variable perturbation size adaptive P&O MPPT algorithm for sudden changes in irradiance. IEEE Trans. Sustain. Energy 2014, 5, 718–728. [Google Scholar]
- Kok Soon, T.; Mekhilef, S. Modified incremental conductance algorithm for photovoltaic system under partial shading conditions and load variation. IEEE Trans. Ind. Electron. 2014, 61, 5384–5392. [Google Scholar] [CrossRef]
- Lyden, S.; Haque, M.E. Comparison of the perturb and observe and simulated annealing approaches for maximum power point tracking in a photovoltaic system under partial shading conditions. In Proceedings of the 2014 IEEE Energy Conversion Congress and Exposition (ECCE), Pittsburgh, PA, USA, 14–18 September 2014; pp. 2517–2523. [Google Scholar]
- Ji, Y.H.; Jung, D.Y.; Kim, J.G.; Kim, J.H.; Lee, T.W.; Won, C.Y. A real maximum power point tracking method for mismatching compensation in PV array under partially shaded conditions. IEEE Trans. Power Electron. 2011, 26, 1001–1009. [Google Scholar] [CrossRef]
- Ahmed, N.A.; Miyatake, M. A novel maximum power point tracking for photovoltaic applications under partially shaded insolation conditions. Electr. Power Syst. Res. 2008, 78, 777–784. [Google Scholar] [CrossRef]
- Miyatake, M.; Inada, M.T.; Hiratsuka, I.; Zhao, H.; Otsuka, H.; Nakano, M. Control characteristics of a fibonacci-search-based maximum power point tracker when a photovoltaic array is partially shaded. In Proceedings of the 4th International Power Electronics Motion Control Conference (IPEMC’04), Xi’an, China, 14–16 August 2004; pp. 816–821. [Google Scholar]
- Kai, C.; Shulin, T.; Yuhua, C.; Libing, B. An improved MPPT controller for photovoltaic system under partial shading condition. IEEE Trans. Sustain. Energy 2014, 5, 978–985. [Google Scholar]
- Patel, H.; Agarwal, V. Maximum Power Point Tracking Scheme for PV Systems Operating Under Partially Shaded Conditions. IEEE Trans. Ind. Electron. 2008, 55, 1689–1698. [Google Scholar] [CrossRef]
- Spertino, F.; Ahmad, J.; Di Leo, P.; Ciocia, A. A method for obtaining the I-V curve of photovoltaic arrays from module voltages and its applications for MPP tracking. Sol. Energy 2016, 139, 489–505. [Google Scholar] [CrossRef]
- Kouchaki, A.; Iman-Eini, H.; Asaei, B. A new maximum power point tracking strategy for PV arrays under uniform and non-uniform insolation conditions. Sol. Energy 2013, 91, 221–232. [Google Scholar] [CrossRef]
- Ahmed, J.; Salam, Z. An improved method to predict the position of maximum power point during partial shading for PV arrays. IEEE Trans. Ind. Inform. 2015, 11, 1378–1387. [Google Scholar] [CrossRef]
- Tat Luat, N.; Kay-Soon, L. A global maximum power point tracking scheme employing direct search algorithm for photovoltaic systems. IEEE Trans. Ind. Electron. 2010, 57, 3456–3467. [Google Scholar]
- Syafaruddin, S.; Karatepe, E.; Hiyama, T. Artificial neural network polar coordinated fuzzy controller based maximum power point tracking control under partially shaded conditions. IET Renew. Power Gener. 2009, 3, 239–253. [Google Scholar] [CrossRef]
- Kobayashi, K.; Takano, I.; Sawada, Y. A study on a two-stage maximum power point tracking control of a photovoltaic system under partially shaded isolation conditions. In Proceedings of the IEEE Power Engineering Society General Meeting Conference, Toronto, ON, Canada, 13–17 July 2003; pp. 2612–2617. [Google Scholar]
- Femia, N.; Gianpaolo, L.; Giovanni, P.; Spagnuolo, G.; Vitelli, M. Distributed maximum power point tracking of photovoltaic arrays: Novel approach and system analysis. IEEE Trans. Ind. Electron. 2008, 55, 2610–2621. [Google Scholar] [CrossRef]
- Yetayew, T.T.; Jyothsna, T.R.; Kusuma, G. Evaluation of Incremental conductance and Firefly algorithm for PV MPPT application under partial shade condition. In Proceedings of the IEEE 6th International Conference on Power Systems (ICPS), New Delhi, India, 4–6 March 2016; pp. 1–6. [Google Scholar]
- Teshome, D.F.; Lee, C.H.; Lin, Y.W.; Lian, K.L. A Modified Firefly Algorithm for Photovoltaic Maximum Power Point Tracking Control under Partial Shading. IEEE J. Emerg. Sel. Top. Power Electron. 2017, 5, 661–671. [Google Scholar] [CrossRef]
- Phimmasone, V.; Endo, T.; Kondo, Y.; Miyatake, M. Improvement of the Maximum Power Point Tracker for photovoltaic generators with Particle Swarm Optimization technique by adding repulsive force among agents. In Proceedings of the International Conference on Electrical Machines and Systems, Tokyo, Japan, 15–18 November 2009; pp. 1–6. [Google Scholar]
- Li, F.; Deng, F.; Guo, S.; Fan, X. MPPT control of PV system under partially shaded conditions based on PSO-DE hybrid algorithm. In Proceedings of the 32nd Chinese Control Conference, Xi’an, China, 26–28 July 2013; pp. 7553–7557. [Google Scholar]
- Vysakh, M.; Azharuddin, M.; Vilas, H.; Muralidhar, K.; Paul, D.; Jacob, B.; Babu, T.S.; Rajasekar, N. Maximum power point tracking using modified PSO with CUK Converter. In Proceedings of the International Conference on Advances in Electrical Engineering (ICAEE), Vellore, India, 9–11 January 2014; pp. 1–6. [Google Scholar]
- Liu, J.; Li, J.; Wu, J.; Zhou, W. Global MPPT algorithm with coordinated control of PSO and INC for rooftop PV array. J. Eng. 2017, 2017, 778–782. [Google Scholar] [CrossRef]
- Ishaque, K.; Salam, Z.; Amjad, M.; Mekhilef, S. An improved particle swarm optimization (PSO)-based MPPT for PV with reduced steady state oscillation. IEEE Trans. Power Electron. 2012, 27, 3627–3638. [Google Scholar] [CrossRef]
- Liu, Y.H.; Huang, S.C.; Huang, J.W.; Liang, W.C. A particle swarm optimization-based maximum power point tracking algorithm for PV systems operating under partially shaded conditions. IEEE Trans. Energy Convers. 2012, 27, 1027–1035. [Google Scholar] [CrossRef]
- Ishaque, K.; Salam, Z. A deterministic particle swarm optimization maximum power point tracker for photovoltaic system under partial shading condition. IEEE Trans. Ind. Electron. 2013, 60, 3195–3206. [Google Scholar] [CrossRef]
- Ngan, M.S.; Tan, C.W. Multiple Peaks Tracking Algorithm using Particle Swarm Optimization Incorporated with Artificial Neural Network. Int. J. Electron. Commun. Eng. 2011, 5, 1325–1331. [Google Scholar]
- Rajendran, S.; Srinivasan, H. Simplified accelerated particle swarm optimization algorithm for efficient maximum power point tracking in partially shaded photovoltaic systems. IET Renew. Power Gener. 2016, 10, 1340–1347. [Google Scholar] [CrossRef]
- Alshareef, M.; Lin, Z. A Modified Particle Swarm Optimization based Maximum Power Point Tracking for PV Systems. In Proceedings of the 53th International Universities Power Engineering Conference (UPEC), Glasgow, Scotland, 4–7 September 2018; pp. 1–6. [Google Scholar]


| Parameter | P&O | PSO | Proposed APSO |
|---|---|---|---|
| Number of Particles | = 0.2 | 3 | 3 |
| w | = 0.01 | 0.4 | --- |
| --- | 1.2 | --- | |
| --- | 1.4 | --- | |
| --- | --- | 0.1–0.7 | |
| Sampling time | 0.12 s | 0.12 s | 0.12 s |
| Shading Scenario | Method | Vmpp (V) | Impp (A) | Pmpp (W) | Rated Power (W) | Efficiency (%) | Tracking Time (s) |
|---|---|---|---|---|---|---|---|
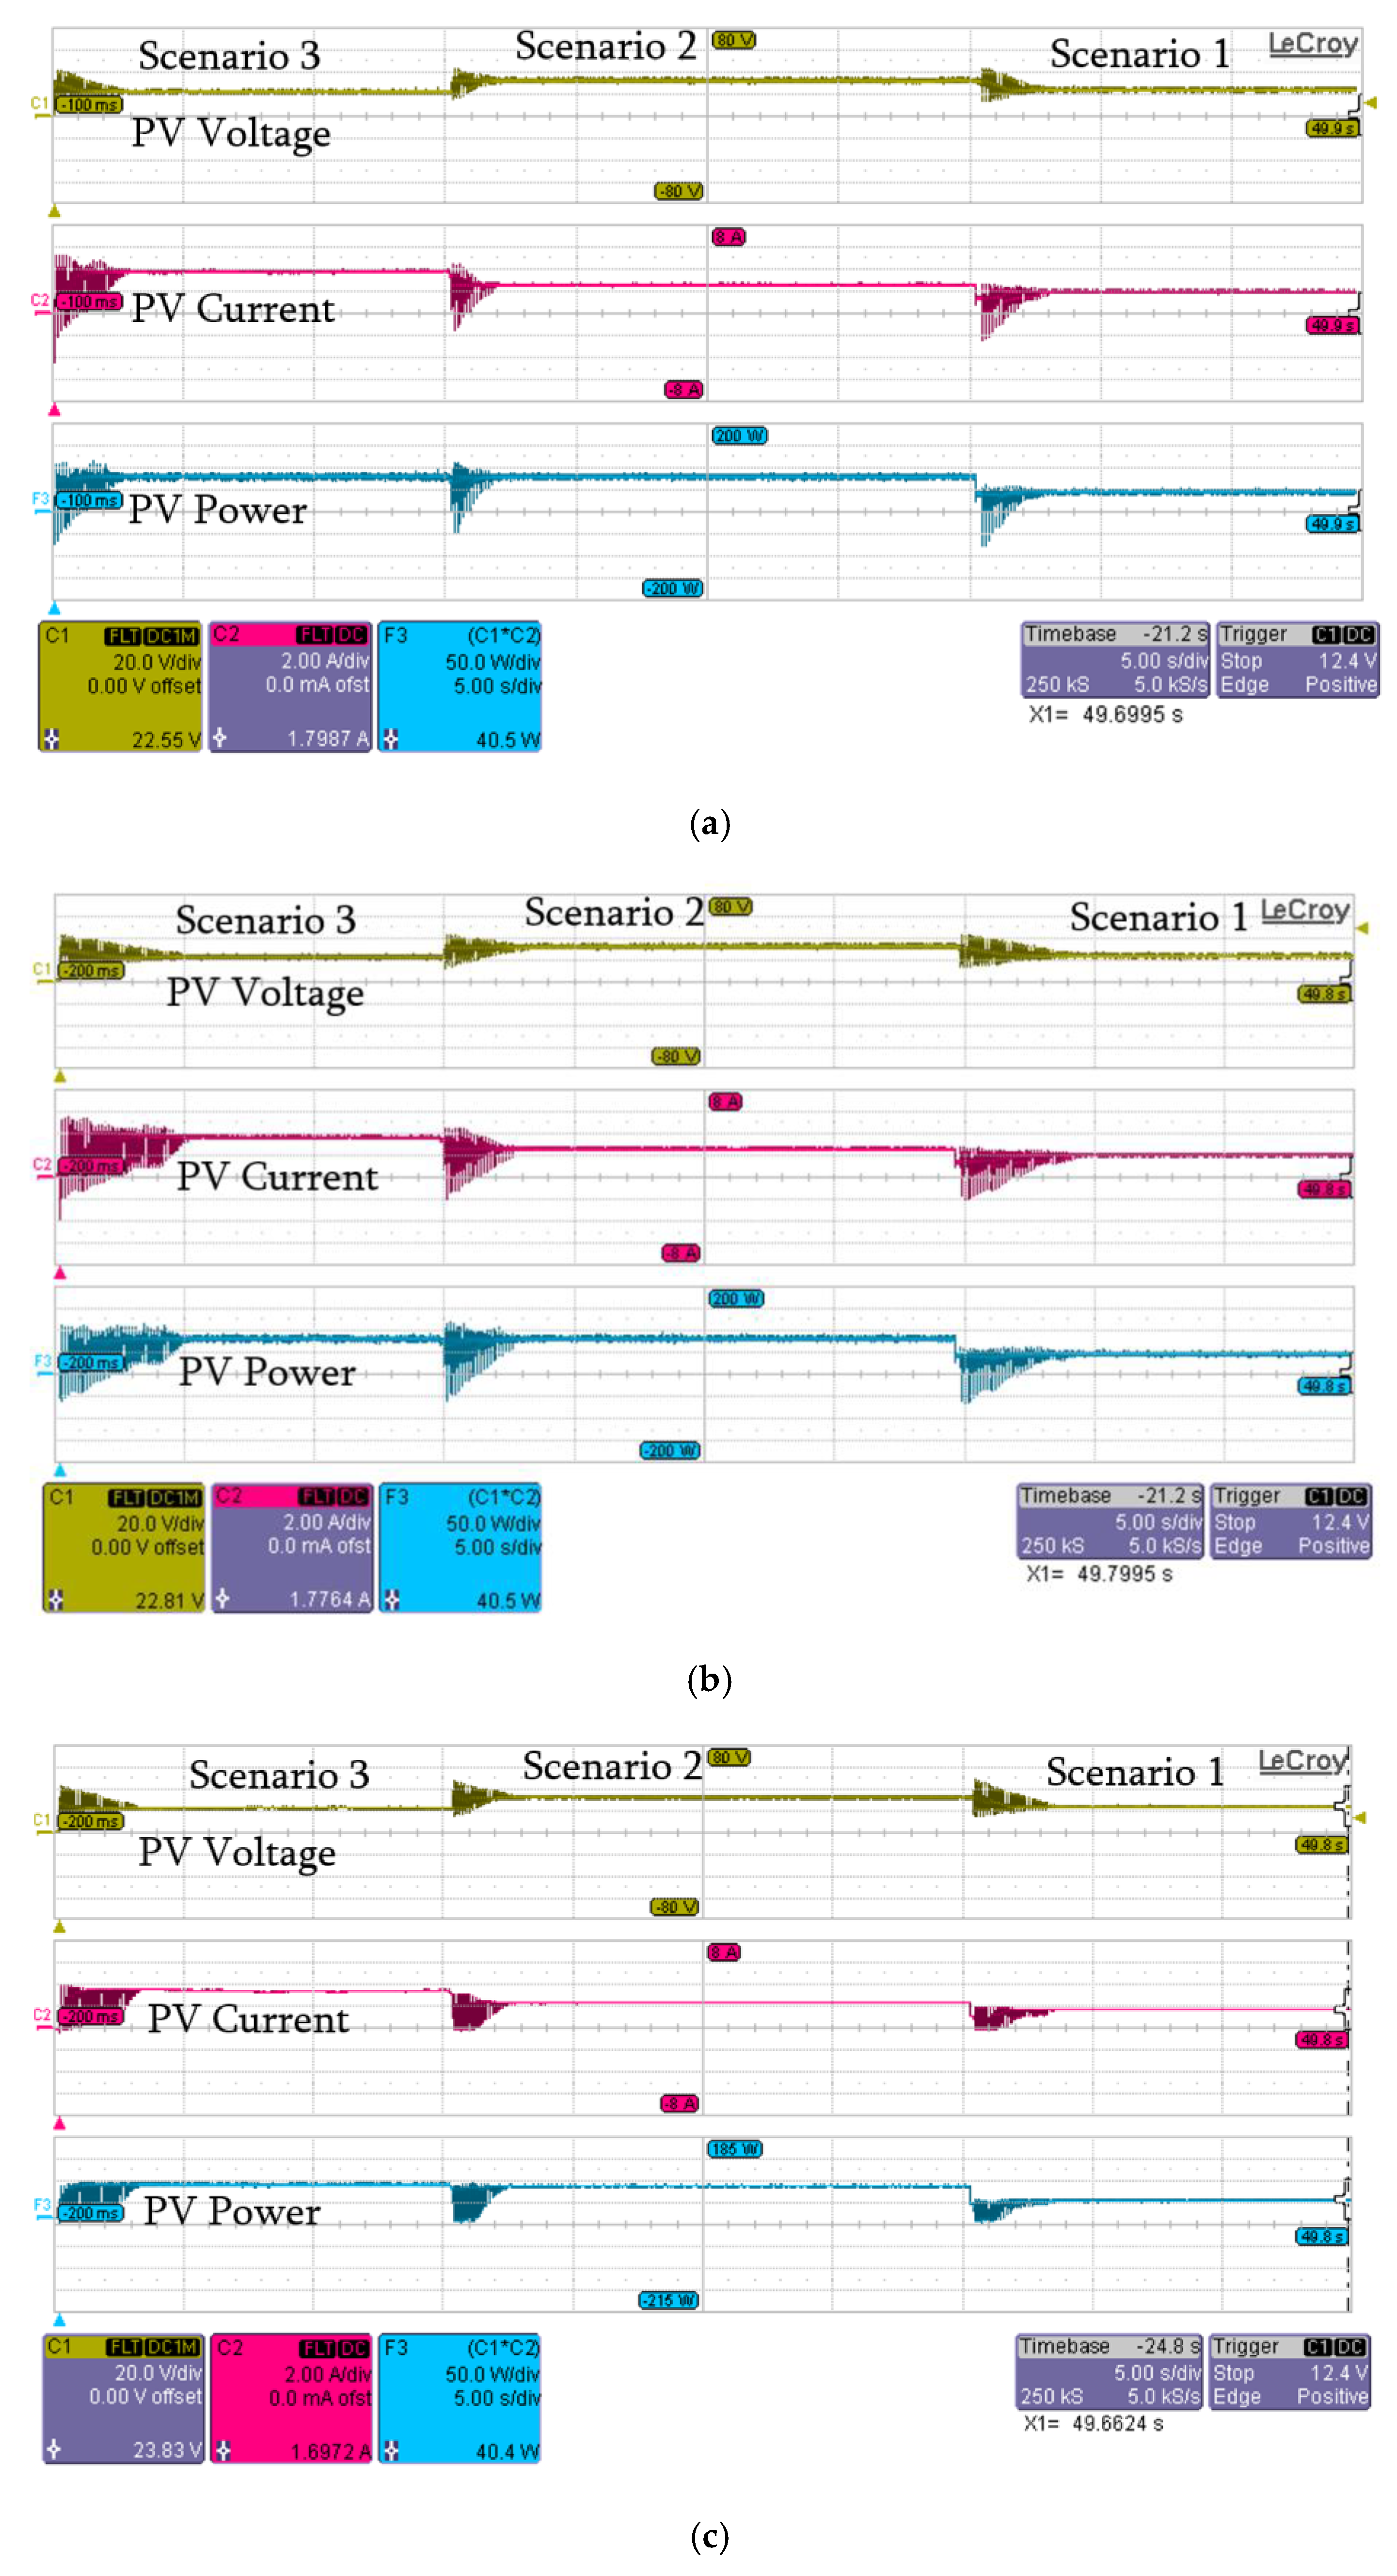
| Scenario (1) | APSO | 23.54 | 1.72 | 40.56 | 40.76 | 99 | 2.4 |
| PSO | 22.55 | 1.75 | 39.44 | 97 | 4.6 | ||
| PSO [36] | 23.45 | 1.72 | 40.37 | 99 | 3.2 | ||
| P&O | 30.89 | 1.16 | 35.87 | 76 | 1.1 | ||
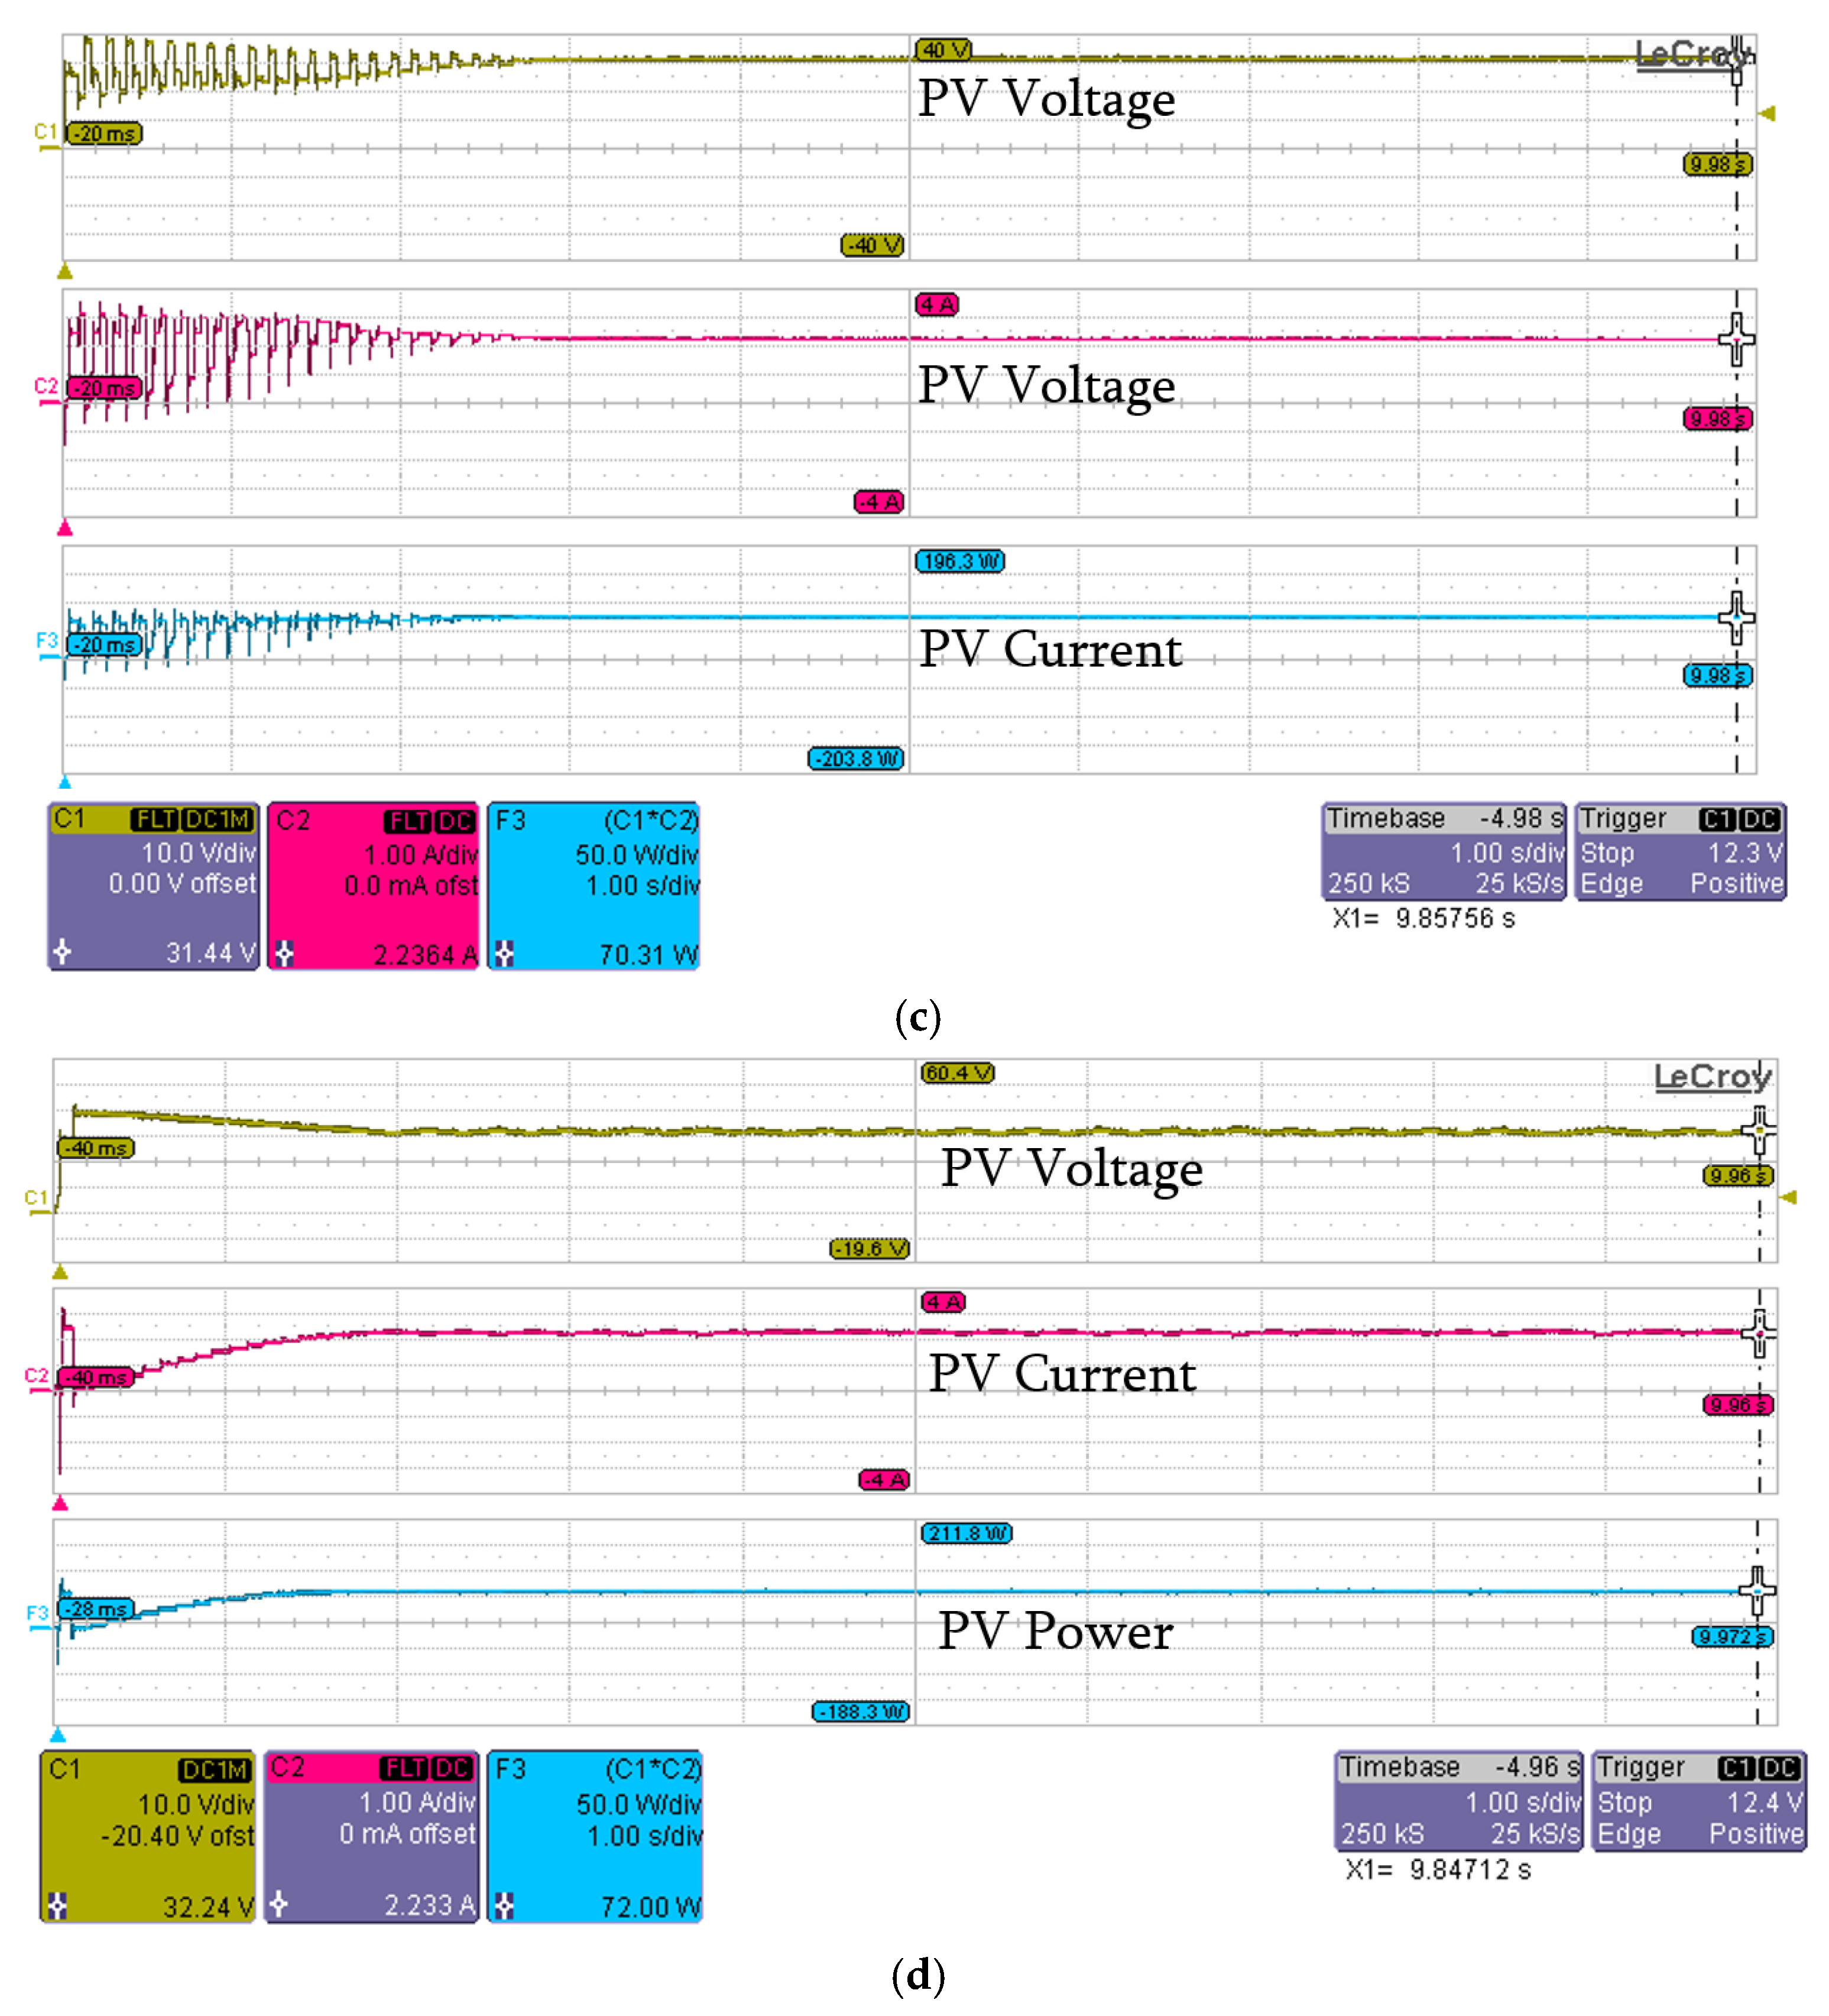
| Scenario (2) | APSO | 31.54 | 2.32 | 73.33 | 73.62 | 99 | 1.9 |
| PSO | 31.54 | 2.3 | 73.33 | 99 | 3 | ||
| PSO [36] | 31.44 | 2.23 | 70.31 | 96 | 2.8 | ||
| P&O | 32.24 | 2.233 | 72.00 | 98 | 1.9 | ||
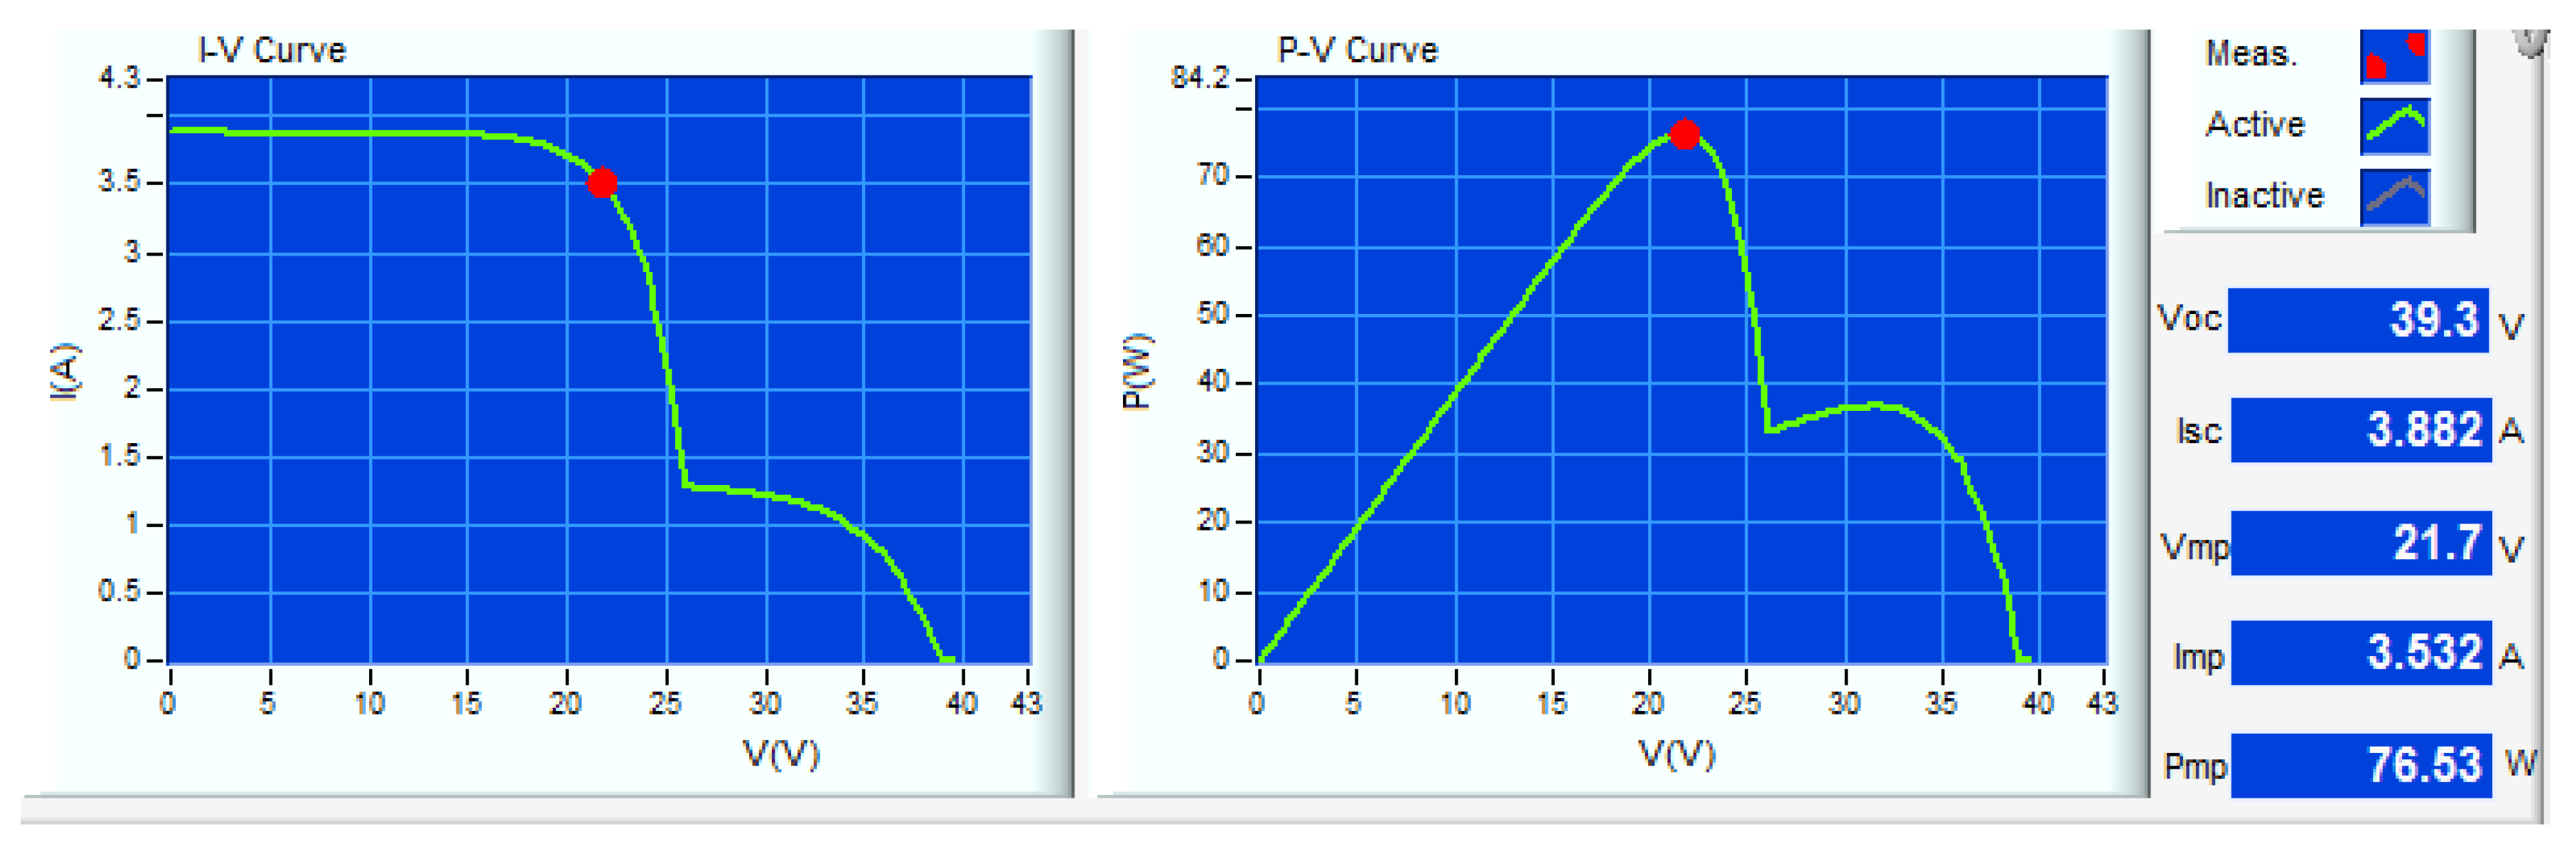
| Scenario (3) | APSO | 22.01 | 3.47 | 76.51 | 76.53 | 99 | 2.3 |
| PSO | 22.07 | 3.27 | 72.17 | 94 | 4.2 | ||
| PSO [36] | 21.95 | 3.48 | 76.39 | 99 | 3.2 | ||
| P&O | 31.31 | 1.41 | 44.1 | 58 | 1.2 |
© 2019 by the authors. Licensee MDPI, Basel, Switzerland. This article is an open access article distributed under the terms and conditions of the Creative Commons Attribution (CC BY) license (http://creativecommons.org/licenses/by/4.0/).
Share and Cite
Alshareef, M.; Lin, Z.; Ma, M.; Cao, W. Accelerated Particle Swarm Optimization for Photovoltaic Maximum Power Point Tracking under Partial Shading Conditions. Energies 2019, 12, 623. https://doi.org/10.3390/en12040623
Alshareef M, Lin Z, Ma M, Cao W. Accelerated Particle Swarm Optimization for Photovoltaic Maximum Power Point Tracking under Partial Shading Conditions. Energies. 2019; 12(4):623. https://doi.org/10.3390/en12040623
Chicago/Turabian StyleAlshareef, Muhannad, Zhengyu Lin, Mingyao Ma, and Wenping Cao. 2019. "Accelerated Particle Swarm Optimization for Photovoltaic Maximum Power Point Tracking under Partial Shading Conditions" Energies 12, no. 4: 623. https://doi.org/10.3390/en12040623
APA StyleAlshareef, M., Lin, Z., Ma, M., & Cao, W. (2019). Accelerated Particle Swarm Optimization for Photovoltaic Maximum Power Point Tracking under Partial Shading Conditions. Energies, 12(4), 623. https://doi.org/10.3390/en12040623