Abstract
This paper provides a new common rail injector drive circuitry for practical use. The new drive circuitry with variable freewheeling circuit was developed based on the requirements for the rate of current drop in the peak-and-hold solenoid model. The variable freewheeling circuit exhibited superior performance in the control accuracy compared to the conventional circuit with a resistor in series with diode (RD) freewheeling circuit. Furthermore, the current cutting process was 30 µs shorter, and the control accuracy of the cycle fuel injection mass was improved by at least 0.36% or exactly 2.86% when a small fuel injection mass was used. In addition, the variable freewheeling circuit consumed less power because the drive power charging was done through the feedback from electromagnetic energy to electrical energy. When the fuel injection mass was large, the fall range of the driving power voltage became 1 V smaller, its recovery time was 1ms shorter, and the highest temperature of the drive circuitry was only 37 °C, which was 127 °C lower than that of the RD freewheeling due to the decrease in energy consumption. Finally, experimental tests with a multi-cylinder engine showed that the variable freewheeling circuit reduced the cycle-by-cycle combustion variations by 0.5%, and lessened the NOx and soot emissions significantly by 3.5% and 4%, respectively, in comparison to the RD freewheeling circuit.
1. Introduction
Various advanced engine combustion modes have been developed in order to achieve high efficiency and low engine emissions [1,2,3,4]. The engine control unit (ECU) must provide more flexible and accurate control for the start of injection (SOI), end of injection (EOI) and various injection patterns [5,6,7]. Therefore, the common rail injector must not only have a highly responsive solenoid but also have a suitable injector drive circuitry. The circuitry performance affects the control accuracy of the injection that eventually will influence the combustion performance.
The injector solenoid is usually driven through the peak-and-hold model [8]. Figure 1 illustrates the typical current shape of the peak-and-hold injector. In order to start a fuel injection, the solenoid current accelerates rapidly from 0 A to Ipeak and the solenoid plunger is lifted quickly. Then, when the plunger is already lifted, the current drops from Ipeak to Ihold, as shown in Stage (a) in Figure 1. During the Ihold phase, the current is maintained near the Ihold, and the plunger is still lifted (Stage (b)). Next, Stage (c) is the process in which the current drops from Ihold to 0A causing the plunger to be lowered. The requirements for the rate of current drop are different in the three stages [9]. The rate in Stages (a) and (b) should be slow to ensure a smooth transition and reduce the current vibrating range and the drive power consumption, respectively. Meanwhile, the rate in Stage (c) should be fast to cut off the current quickly; the quicker the cutting process, the higher the accuracy of EOI and fuel injection mass would be obtained [10,11].
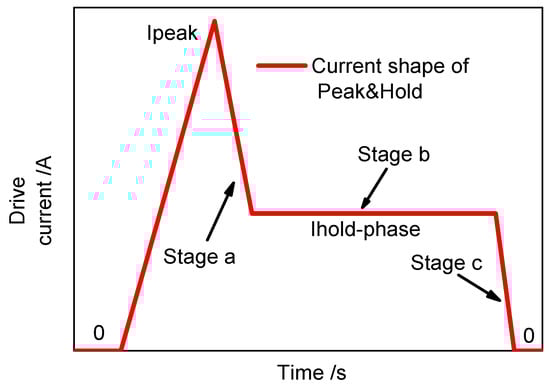
Figure 1.
Typical current shape of the peak-and-hold injector.
The conventional RD freewheeling circuit often employed in the solenoid drive circuitry design [12], as shown in Figure 2, where the circle line outlines the current freewheeling path, and the arrow represents the current direction. The rule of current drop in the RD freewheeling circuit is expressed by Equation (1), which applies to all three stages mentioned above. However, a single freewheeling path cannot simultaneously satisfy the different demands of the three stages [13].
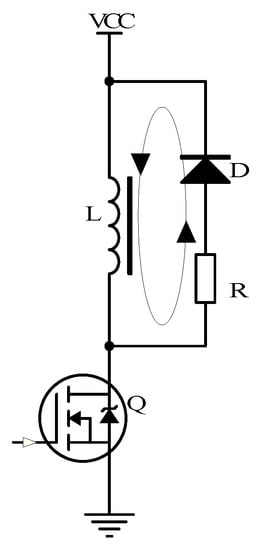
Figure 2.
Drive circuitry with resistor in series with diode (RD) freewheeling.
Several methods were proposed for designing an injector drive circuitry for the peak-and-hold model. John D. Mooney [14] suggested a simulation code for evaluating circuitry designs, introduced the design method for a single or dual power supply, and analyzed the influence of different battery voltage on the drive current and DC/DC circuitry. The variable freewheeling circuit was employed in his circuitry design, but without considering the feedback from the solenoid to the power for energy recovery and electric energy saving. Jin Li [15] analyzed the drive voltage on the solenoid responses based on a finite element model of solenoid valves, showing that the voltage was one of the key factors for controlling the injector. Cai [16] studied the soft-switching circuit parameters and their characteristics via simulation, and the results showed that using soft-switching technology in a high-speed solenoid drive circuitry could reduce the switching devices loss, noise, and energy consumption. In addition, there exist some patents [17,18,19] about drive circuitries, but they failed to provide the structure design principle and performance report. Also, some designs were only explained through simulation, and these designs might be impractical for use. Therefore, in this study, a new drive circuitry with a single power supply combined with a variable freewheeling circuit was proposed and its structure design principle and performance were discussed.
2. Variable Freewheeling Drive Circuitry
The variable freewheeling drive circuitry employs different freewheeling paths in different stages. By changing the switches’ working conditions, a single appropriate freewheeling path will be effective enough to control the current drop process according to the different requirements in the three stages.
A predesign and example, which completely satisfied the drop rate requirements, is illustrated in Figure 3a. The control time sequence of QH (the high-side MOSFET) and QL (the low-side MOSFET) are shown in Figure 3b. The effective freewheeling path for Stages (a) and (b) is illustrated in Figure 4a, in which QH was on and QL was off. Its rule of the current drop is expressed by Equation (2), where the resistance of QH was neglected under the on state, resulting in the lowest rate. In Stage (c), QH and QL were both off, which means that the current immediately became 0A through a so-called avalanche current drop. Meanwhile, the effective freewheeling path for Stage (c) is illustrated in Figure 4b and expressed by Equation (3). However, since the solenoid generated a large self-induced electromotive force, the QH source would generate a high negative transient voltage, which would then damage the circuitry [20,21].
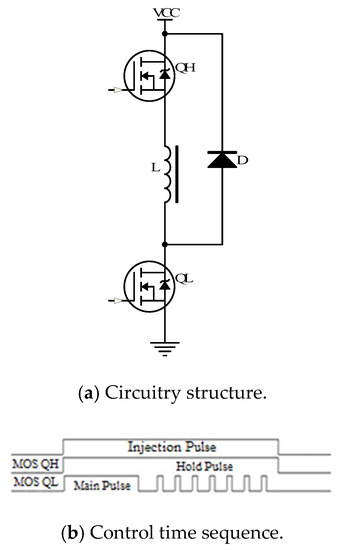
Figure 3.
Predesign of the variable freewheeling drive circuit.
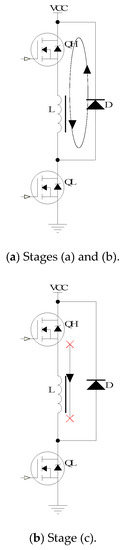
Figure 4.
Effective freewheeling path in the three different stages.
3. Improved Design
Considering the practical application, the improved design derived from Figure 3a is shown in Figure 5, where L is the injector, QH and QL are the high-side MOSFET and low-side MOSFET, QH-logic and QL-logic are the corresponding control time sequence inputs of QH and QL, IR2101S is the high-side and low-side driver chips, Ho and Lo are the amplified signal outputs, R2 and R3 are the respective gate resistors of QH and QL, C3 and D3 are the corresponding bootstrap capacitor and diode, C1 is the absorption capacitor, D1 and D2 are the freewheeling diodes, R1 is the pull-down resistor, and all D1, C1, and R1 connect the QH source to the ground,. The control time sequence was the same as the one in Figure 3b. The descriptions of symbols used in Figure 5 are detailed in Table 1.
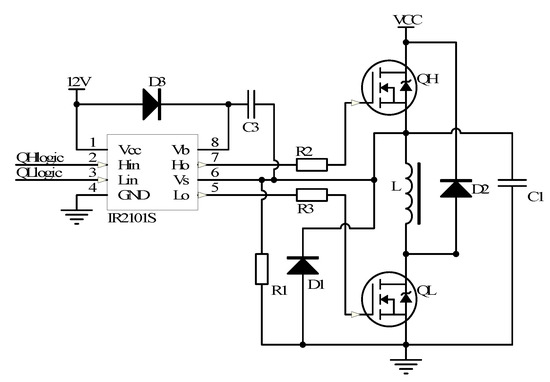
Figure 5.
Improved design of the variable freewheeling drive circuit.

Table 1.
The descriptions of symbols used in Figure 5.
3.1. Safety and Reliability
D1, C1, and R1 were set to ensure the safety and reliability of the drive circuitry. Their functions are described as follows:
3.1.1. Function of Freewheeling Diode D1 Set
The QH sources and Vs pin of IR2101S in Figure 5. were connected, which is the technical requirement of bootstrap [22]. As shown in Figure 6a, a large negative transient voltage was generated at the QH source without D1. The voltage reached −20 V and would damage the IR2101S after several working cycles. The D1 setting voltage was limited to −1 V (i.e., the forward voltage of D1), as shown in Figure 6b. Setting D1 ensured that the negative transient voltage would not corrupt the IR2101S. Therefore, the feasibility of circuitry was realized.
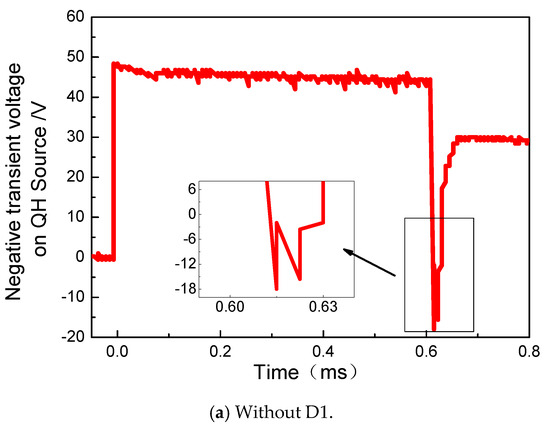
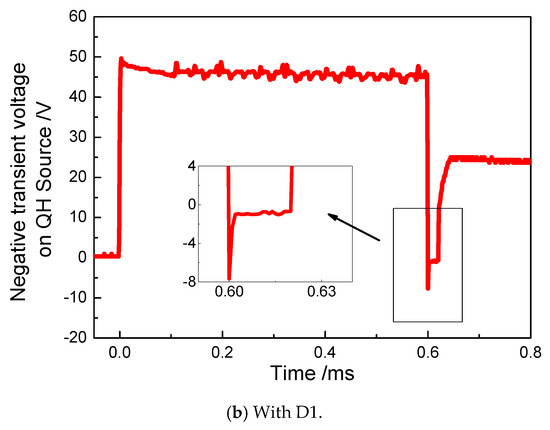
Figure 6.
Effects of D1 on controlling the negative transient voltage in the variable freewheeling drive circuit.
3.1.2. Function of Absorption Capacitor C1 Set
At the beginning of Stage (c), a voltage spike of −10 V was generated because D1 was not fully switched on, as shown in Figure 7a. The IR2101S (or other high-side driver chips) only had a negative transient voltage tolerance of−5 V. The spike would not damage the circuitry but could unexpectedly cause the IR2101S to be latched [23,24]. If latched, the circuitry would go out of control, and QH would turn on again. The effective freewheeling path then turned into the one in Figure 4a, and the rate of current drop became slower (Figure 7c). The slower drop rate delayed the lowering process of the plunger, which would subsequently prolong the injection process and significantly increase the fuel injection mass.
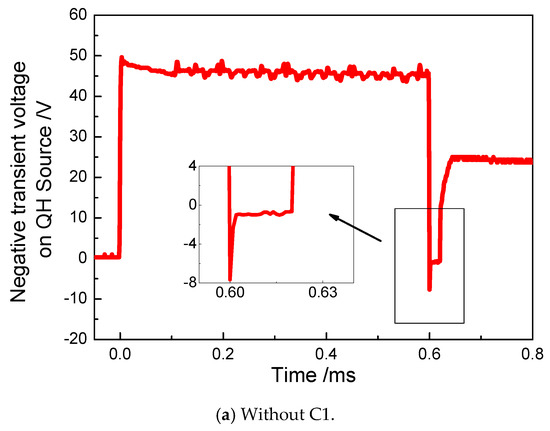
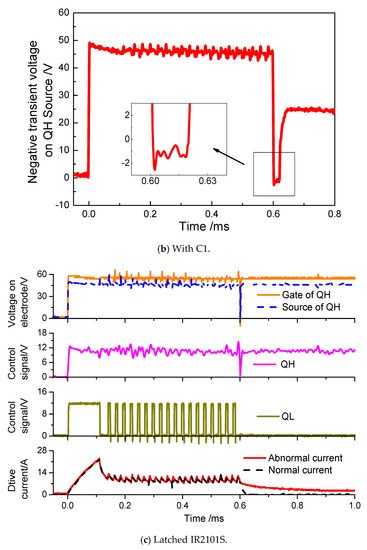
Figure 7.
Voltage spike in the variable freewheeling drive circuit.
Therefore, to eliminate the voltage spike, C1 was set to connect the Vs to the ground. Accordingly, the spike was eliminated by capacitor absorption, as illustrated in Figure 7b.
3.1.3. Function of Pull-Down Resistor R1 Set
If R1 was not set, the Vs was suspended. As shownin Figure 8, when the circuit was ready for operation, but the Vs voltage reached 6 V and the voltage difference of C3 was not big enough, then QH could not be fully executed when turned on. As a result, the current became atypical.
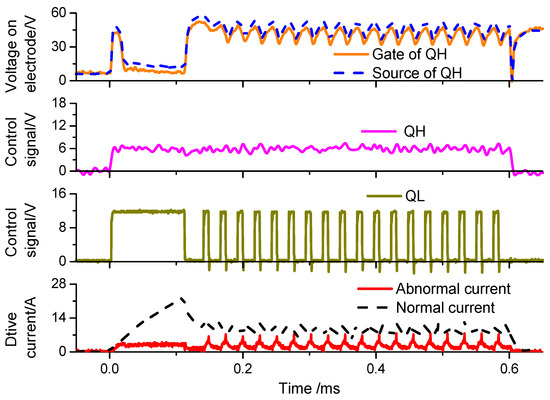
Figure 8.
Suspension of Vs in the variable freewheeling drive circuit.
To eliminate the suspended state, R1 was set to connect the Vs to the ground. After injection, the Vs returned to 0 V due to the pull-down effect of the resistor. Consequently, the aberration was eliminated.
3.2. Current Drop Rate
In Stages (a) and (b), QH was turned on when QL was off. The effective freewheeling path is illustrated in Figure 9a, and the rule of current drop rate is expressed by Equation (2). Therefore, with this design, the current drop rate would be the slowest and would fully satisfy the requirements of Stages (a) and (b).
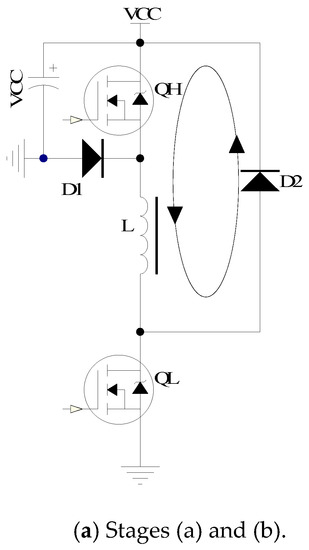
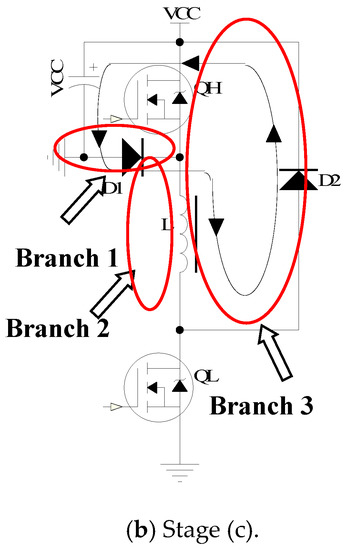
Figure 9.
Freewheeling paths in the three different stages.
In Stage (c), both QH and QL were off. The effective freewheeling path of Stage (c) is illustrated in Figure 9b, and it followed Equation (4). When compared to Figure 4b, VCC, D1, D2, and L form a new freewheeling path. The current did not drop to 0 A immediately; instead, the rate of current drop became slower. However, the feasibility of the circuitry was implemented by setting D1 and charging the drive power from the solenoid because of the conversion from electromagnetic energy to electrical energy. The charging capacity is consequently expressed by Equation (5).
Based on the design in Figure 5, the following two methods were commonly employed to improve the rate of current drop in Stage (c).
3.2.1. Adding Impedance Elements
Adding impedance elements into the effective freewheeling path in Figure 9b could increase the rate of current drop in Stage (c). The effective freewheeling path of Figure 9b could be broken down into three branches. Branch 2 and Branch 3 were the common parts of Stages (a) and (b). The impedance added into these branches could increase the rate of current drop not only in Stage (c) but also in Stages (a) and (b). Meanwhile, the impedance added intoBranch1 could only increase the rate of current drop in Stage (c), but the negative transient voltage generated by Vs in Stage (c) would be increased from –UD1 to –(UD1+Uimpedance). By doing so, the safety of the circuitry safety would be threatened as described above. Therefore, it is not recommended to add any impedance elements to improve the rate of the current drop in Stage (c).
3.2.2. Increasing the VCC Voltage
While considering the injector voltage and current limits, the effects of different VCCs on the drive current were simulated using the PSPICE software as shown in Figure 10a, where QH-logic and QL-logic are the same as Figure 3b, r = 0.23 Ω and L = 150 uH are as a circuit model for the injector, Main Pulse = 100 μs, Injection Pulse = 400 μs, VCCs = 24V, 36V, 48V, 60V, 70V, and Hold Pulses are adjusted to guarantee Ihold = 12 A. As can be seen in Figure 10b, increasing the VCC not only could increase the current growth rate from 0 A to Ipeak but also could increase the current drop rate in Stage (c), as also shown by Equation (4). The drive power voltage is a standardized parameter of injectors, and its value must be within an acceptable range. A higher drive power voltage would reduce the conversion efficiency of the boost circuitry. However, an appropriate increase should be acceptable.
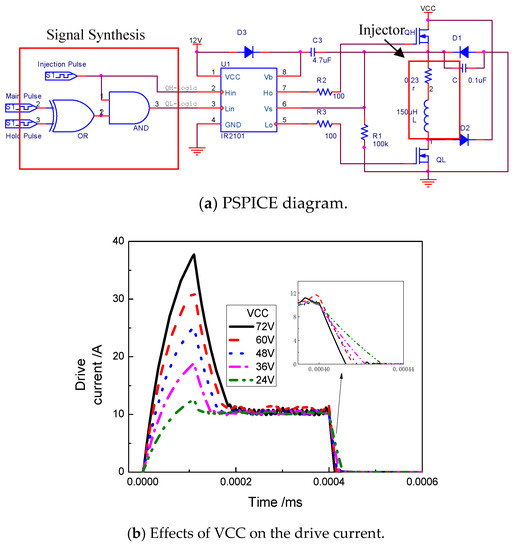
Figure 10.
Effects of VCC on the drive current in the variable freewheeling circuit through PSPICE.
4. Experiments
The boost circuitry was used as the power source in the drive circuit to evaluate the electric energy consumption; its schematic diagram is illustrated in Figure 11. If the VCC was lower than the target value, the boost circuitry would start to work, and vice versa; if higher, the circuitry would stop.
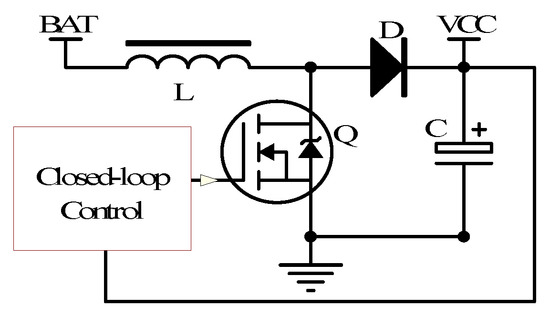
Figure 11.
Boost circuitry.
The effect of different R on the drive current with the RD freewheeling circuit is shown in Figure 12. As the R increased, the rate of current drop in Stage (c) would be faster, as shown in Equation 1. However, the rate of current drop was basically the same when R = 10 Ω and R = 15 Ω. In Stage (c), the positive transient voltage of the drain electrode Q (V) in Figure 2 is expressed by Equation (6); consequently, as the R increased, the V would grow significantly larger and damage the MOSFET. Therefore, a value of 10 Ω was selected as the optimal value of R.
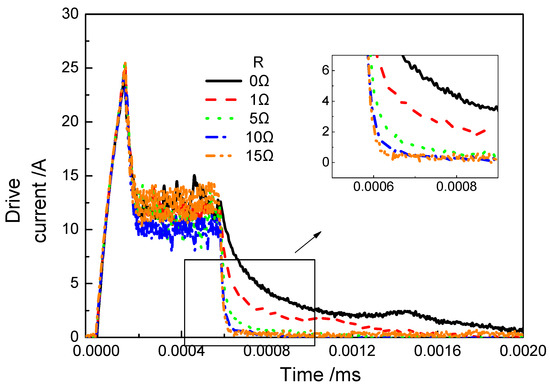
Figure 12.
Effects of R on the drive current with RD freewheeling circuit.
In order to study the effect of the two types of the freewheeling circuit on the combustion performance, an engine test was carried out using a self-developed ECU under the condition that only the injector drive circuit was changed. The test engine, as shown in Figure 13, was based on a heavy-duty six-cylinder diesel engine. The detailed specifications of the test engine are shown in Table 2.
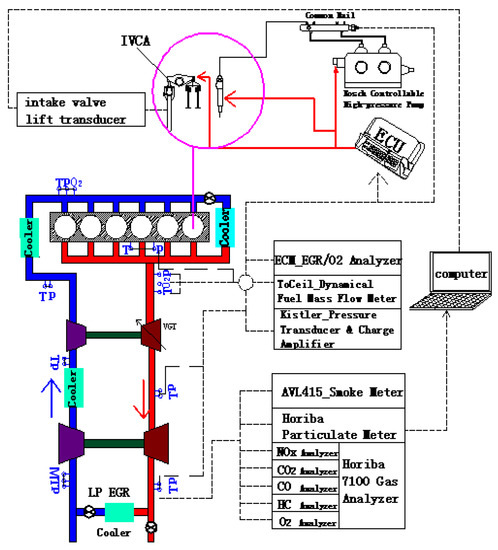
Figure 13.
Schematic of experiment setup in the engine test.
Table 2.
Engine characteristics.
As described above, the RD and variable freewheeling injector drive circuits were established, as shown in Figure 2 and Figure 5, respectively, with R = 10 Ω. The BOSCH-CRIN2 (the second generation of Bosch common rail injector for truck and heavy duty vehicles) injector was chosen in the test, with standardized VCC of 48 V, Ipeak of 25 A, and recommended Ihold of 12 A. The modulation frequencies of both circuitries in the Ihold phase were the same. The experimental results are discussed as follows.
4.1. Drive Current
A comparison of the drive current with an injection pulse of 600 µs is illustrated in Figure 14 below.
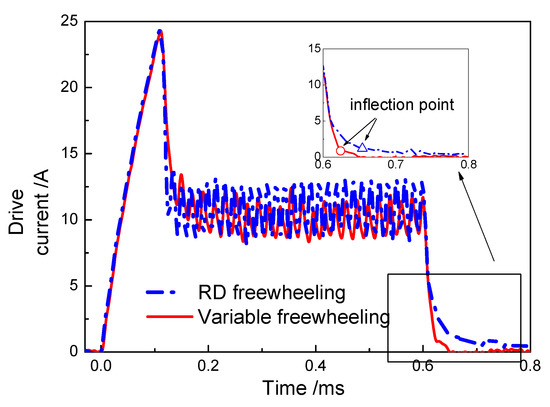
Figure 14.
Comparative effects of freewheeling injection circuits on the drive current.
Using the variable freewheeling circuit, the rates of current drop in Stages (a) and (b) were slower than those of the RD freewheeling circuit, as described in Equation (1) and Equation (2), respectively. Therefore, the process duration using the variable freewheeling circuit in Stage (a) was longer. In the Ihold phase, the duty cycle to maintain the current value near the Ihold of the RD freewheeling circuit was bigger, and its current fluctuation range was also larger.
In Stage (c), R was 10 Ω, while UD1 was 1 V from Equation (1). As the current became smaller, the rate of current drop in the RD freewheeling circuit would become lower. Using Equation (4), when r was nearly 0 Ω, the VCC was 48 V; hence, when I was small, the current drop rate hardly changed. As is illustratedin Figure 14, the current drop rate in the variable freewheeling circuit was faster than that of the RD freewheeling circuit. The former’s solenoid valve seating duration was 30 µs shorter than the inflection point of the drive current, which was nearly equivalent to the landing time of the solenoid valve.
4.2. Control Accuracy
The cycle variations corresponding to different injection fuel masses at a fuel pressure of 160 MPa are shown in Table 3. When the injection fuel mass was the same, the pulse width of the variable freewheeling circuit was slightly longer, but the cycle variation was smaller, indicating better control accuracy in the injection of fuel mass. The control accuracy increased by at least 0.36% or exactly 2.86% at 5-mg fuel mass injection as shown in Figure 15. This was a result of a faster current drop rate and a faster end of injection in Stage (c).
Table 3.
Comparative effects of freewheeling injection circuits on the control accuracy of fuel mass injection.
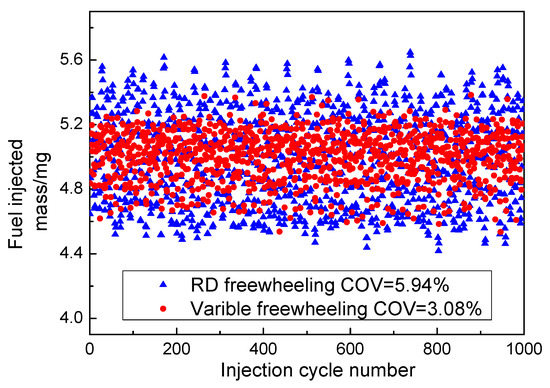
Figure 15.
Comparative effects of freewheeling injection circuits on the cycle-by-cycle variations of fuel injected mass at 5 mg.
4.3. Electric Energy Consumption
The change in VCC voltage is illustrated in Figure 16. When the injection fuel mass was 200 mg and done at 160 MPa, the fall range of the drive power voltage became 1 V smaller, and its recovery time was 1 ms shorter than those of the RD freewheeling circuit.
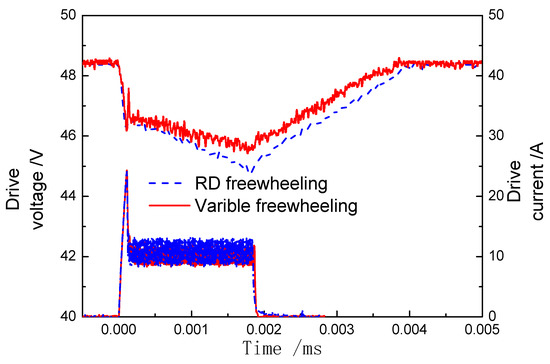
Figure 16.
Comparative effects of freewheeling injection circuits on the electric energy consumption.
In Figure 16, the levels of electricity consumption were the same when the current increased from 0 A to Ipeak. However, there was no energy consumption when the current decreased from Ipeak to Ihold. In the Ihold phase, the electric energy consumption of the variable freewheeling circuit was smaller than that of the RD due to a smaller duty for maintaining the current value near the Ihold. The drive power was charged in Stage (c) when using the variable freewheeling circuit, but not when using the RD freewheeling circuit. Therefore, the electric energy consumption of the variable freewheeling circuit was smaller.
4.4. Highest Attainable Temperature
The highest temperature captured by a thermal infrared imager (FLIR) at 1900 rpm was below the environment temperature of 20 °C during a single injection and at a fuel mass of 200 mg, as shown in Figure 17. The highest temperature of the variable freewheeling circuit was only 37 °C, which was 127 °C lower than that of the RD freewheeling circuit. This was due to the smaller electricity consumption in the former drive circuit. The element that had the highest temperature in the RD freewheeling circuit was R, where as it was D2 in the variable freewheeling circuit.
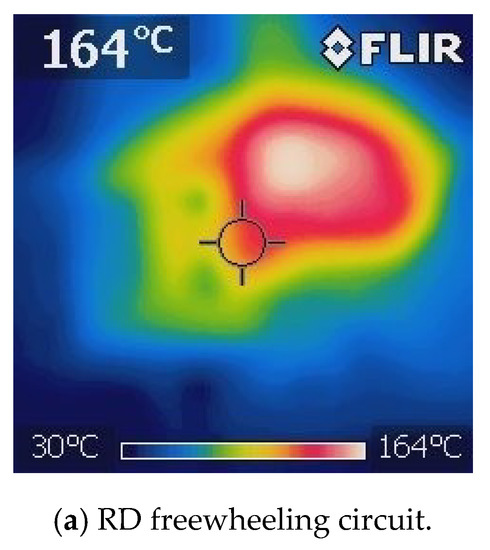
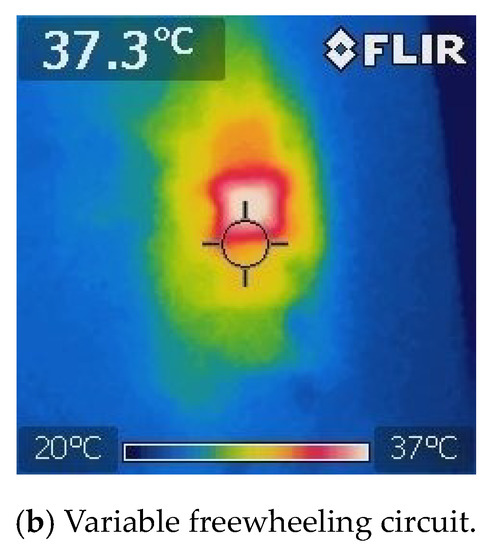
Figure 17.
Comparative effects of freewheeling injection circuits on the highest attainable temperature.
4.5. Cycle-by-Cycle Variations
At a load of 1600 rpm, IMEP = 1 MPa, and a circulating fuel injection mass of 100 mg, the cycle-by-cycle variations of the peak cylinder pressure for the two types of the freewheeling circuit are shown in Figure 18. It can be seen that due to the improvement on the control accuracy of the fuel injection mass, the cycle variations (COV) of the peak cylinder pressure using the variable freewheeling circuit were reduced from 1.5% to 1%, indicating a significant performance improvement.
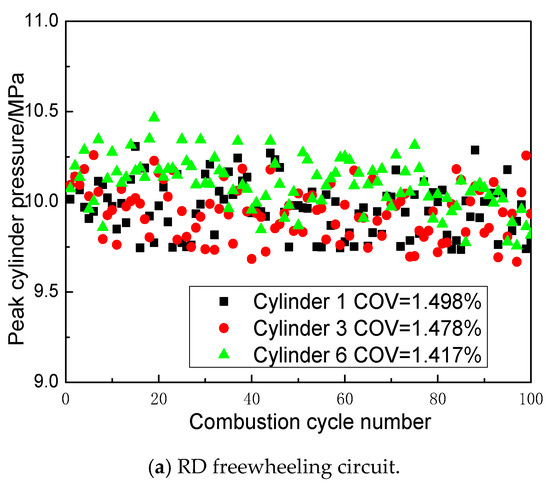
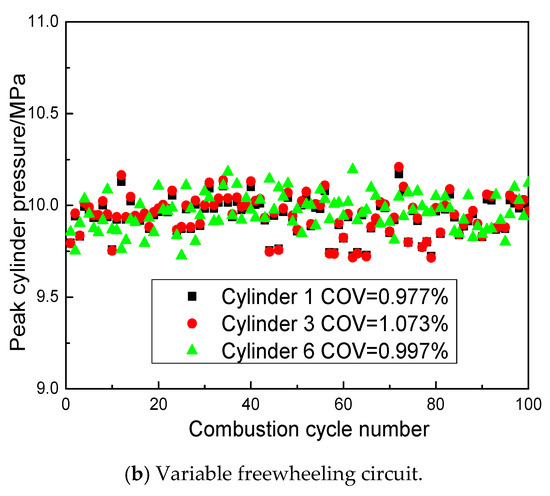
Figure 18.
Comparative effects of freewheeling injection circuits on the cycle-by-cycle variations of peak cylinder pressure.
4.6. Combustion Performance
At three load levels (1300 rpm, 1600 rpm, and 1900 rpm) and IMEP = 1 MPa with the same optimal control strategy, the NOx and soot emissions and the thermal efficiency for the two types of the freewheeling circuit are compared in Figure 19. The engine emissions and combustion efficiency were improved due to the decrease in the combustion cycle variations, which could effectively reduce the influence of deviation of combustion process from the optimal control target. Especially at 1900 rpm, where the NOx and soot emissions were reduced by 3.5% and 4%, respectively, and the thermal efficiency was slightly increased by 0.3%, while the HC and CO emissions were little improved.
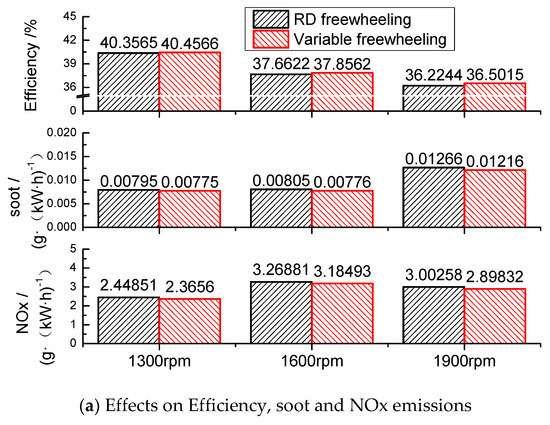
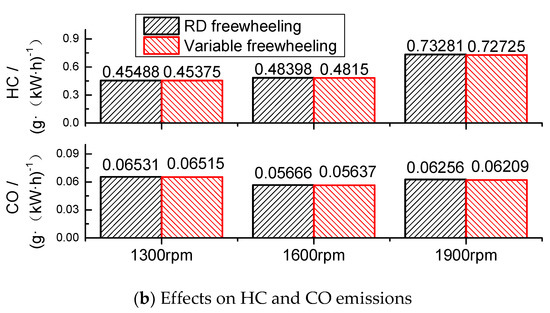
Figure 19.
Comparative effects of freewheeling injection circuits on the engine emissions and combustion efficiency.
5. Conclusions
(1) Compared to the RD freewheeling circuit, the variable freewheeling injector drive circuit met the requirements better for the rate of current drop in the three different stages of the peak-and-hold model.
(2) Through analysis and structural improvements to improve the safety and reliability of the circuitry, any anomalies interfering with the practical use of the variable freewheeling circuit were eliminated simultaneously.
(3) Reducing the current drop rate in the Ihold phase could effectively reduce the energy consumption.
(4) By charging the drive power supply using the electromagnetic energy released by the injector during the current closing stage, the electric energy consumption could be reduced and the power recovery time could be accelerated.
(5) Compared to the RD freewheeling circuit, the variable freewheeling circuit exhibited higher accuracy in controlling the injection mass, consumed lower electric energy and lowered the circuit’s highest attainable temperature.
(6) Compared to the RD freewheeling circuit, the variable freewheeling circuit could effectively improve the cycle-by-cycle variations, lower the engine emissions and increase the combustion efficiency.
The highlights of this article are as follows:
1. The injector drive circuitry with variable freewheeling circuit had better control accuracy of fuel injection mass and lower electrical consumption than with a RD freewheeling circuit.
2. The improved design of the variable freewheeling circuit was studied to eliminate anomalies interfering.
3. The variable freewheeling circuit could effectively improve the cycle-by-cycle variations, lower the engine emissions and increase the combustion efficiency of diesel engine than RD freewheeling circuit.
Author Contributions
Conceptualization, E.L. and S.W.; Methodology, E.L.; Software, E.L.; Validation, E.L.; Formal Analysis, E.L.; Investigation, E.L.; Resources, E.L.; Data Curation, E.L.; Writing-Original Draft Preparation, E.L.; Writing-Review & Editing, E.L.; Visualization, E.L.; Supervision, S.W.; Project Administration, S.W.; Funding Acquisition, S.W.
Funding
This research was funded by [the National Natural Science Foundation of China] grant number [CNFS NO.51236005] and by [the Ministry of Science and Technology] grant number [973 National Key Project 2013CB228401].
Conflicts of Interest
The authors declare no conflict of interest.
Nomenclature
| Definitions in Circuitry Schematics | |
| VCC | Driving Power |
| L | Injector Solenoid |
| D | Diode |
| R | Resistor |
| Q | MOSFET |
| C | Capacitor |
| QH | High-side MOSFET |
| QL | Low-side MOSFET |
| Definitions in Formulas | |
| VCC | Voltage of Driving Power |
| i | Solenoid Current |
| r | Resistance of Solenoid |
| L | Inductance of Solenoid |
| UD | Forward Voltage of D |
| R | Resistance of R |
References
- Kitamura, T.; Ito, T.; Senda, J.; Fujimoto, H. Mechanism of smokeless diesel combustion with oxygenated fuels based on the dependence of the equivalence ration and temperature on soot particle formation. Int. J. Engine Res. 2002, 3, 233–248. [Google Scholar] [CrossRef]
- Tow, T.C.; Pierpont, A.; Reitz, R.D. Reducing Particulates and NOx Emissions by Using Multiple Injections in a Heavy Duty DI Diesel Engine; SAE: Warrendale, PA, USA, 1994; p. 940897. [Google Scholar]
- Su, W.; Lin, T.; Pei, Y. A Compound Technology for HCCI Combustion in a DI Diesel Engine Based on the Multi-Pulse Injection and the Bump Combustion Chamber; SAE: Warrendale, PA, USA, 2003. [Google Scholar]
- Su, W. Advanced high density-low temperature combustion theory and technology. Trans. CSICE 2008, 26, 093. [Google Scholar]
- Su, W.; Liu, B.; Wang, H.; Huang, H. Effects of multi-injection mode on HCCI diesel combustion. J. Eng. Gas Turbines Power 2007, 129, 230–238. [Google Scholar] [CrossRef]
- Su, W.; Wang, H.; Liu, B. Injection Mode Modulation for HCCI Diesel Combustion; SAE: Warrendale, PA, USA, 2005. [Google Scholar]
- Yu, Y.; Su, W. Study of Fuel Distribution on Diesel PCCI Combustion by Development of a New Characteristic-Time Combustion Model; SAE: Warrendale, PA, USA, 2008. [Google Scholar]
- Infineon-Technology-AG. Peak and Hold Current Shape Generated by TriCore Derivative TC1775; Application Notes V2.1; Infineon-Technology-AG: Neubiberg, Germany, September 2002. [Google Scholar]
- Kohketsu, S.; Tanabe, K.; Mori, K. Flexibly Controlled Injection Rate Shape with Next Generation Common Rail System for Heavy Duty DI Diesel Engines; SAE: Warrendale, PA, USA, 2000. [Google Scholar]
- Kajima, T.; Kawamura, Y. Development of a high speed solenoid valve investigation of solenoids. IEEE Trans. Ind. Electron. 1995, 42, 1–8. [Google Scholar] [CrossRef]
- Kajima, T. Development of a high speed solenoid valve investigation of the energizing circuits. IEEE Trans. Ind. Electron. 1993, 40, 428–435. [Google Scholar] [CrossRef]
- Liu, Z.; I, H.L.; Ouyang, G. Improved design and experimental study on solenoid valve drive circuit for electronically controlled injector. Veh. Engine 2009, 1, 1–3. [Google Scholar]
- Yang, M.; Sorenson, S.C. Direct Digital Control of Diesel Fuel Injection Process; SAE: Warrendale, PA, USA, 1992; Volume 101, pp. 1205–1219. [Google Scholar]
- Mooney, J.D. Drive Circuit Modeling and Analysis of Electronically Controlled Fuel Injectors for Diesel Engines; SAE: Warrendale, PA, USA, 2003. [Google Scholar]
- Li, J.; Zhang, K. Solenoid Valve Driving Module Design for Electronic Diesel Injection System; SAE: Warrendale, PA, USA, 2005. [Google Scholar]
- Cai, S.; Jiao, Y.; Xu, C.; Liang, Y. Energy saving driver circuit of high-speed solenoid valve based on soft-switch technology. In Proceedings of the Second International Conference on Instrumentation & Measurement, Computer, Communication and Control, Harbin, China, 8–10 December 2012; pp. 598–601. [Google Scholar]
- Michael, J. Low Power Solenoid Driver Circuit. U.S. Patent 7499254B2, 3 March 2009. [Google Scholar]
- Kanomata, K.; Sawada, T.; Nakamura, T. Circuit for Driving a Solenoid. U.S. Patent 6657845B2, 2 December 2003. [Google Scholar]
- Antone, J.A.; Gihring, K.D.; Davis, E.W. Solenoid Injector Driver Circuit. U.S. Patent 5717562, 10 February 1998. [Google Scholar]
- Zhu, J.; Sun, G.; Sun, W.; Zhang, Y. Negative voltage surge resistant circuit design in HVIC. Electron. Lett. 2013, 49, 1476–1477. [Google Scholar] [CrossRef]
- Mukhopadhyay, S.; Rao, R.; Kim, J.J.; Chuang, C.T. Capacitive coupling based transient negative bit-line voltage (Tran-NBL) scheme for improving write-ability of SRAM design in nanometer technologies. In Proceedings of the 2008 IEEE International Symposium on Circuits and Systems, Seattle, WA, USA, 18–21 May 2008; pp. 384–387. [Google Scholar]
- Adams, J. Bootstrap Component Selection for Control IC’s; International Rectifier: Los Angeles, CA, USA, 2001. [Google Scholar]
- Purwadi Bai, S.; Prabowo, B.A.; Sheu, G. Shifting time waveform induced CMOS latch up in bootstrapping technique applications. In Proceedings of the Physical and Failure Analysis of Integrated Circuits, Singapore, 2–6 July 2012; pp. 1–4. [Google Scholar]
- Brown, D.W.; Ginart, A.; Ali, I.N.; Abbas, M. Turn-off time as an early indicator of insulated gate bipolar transistor latch-up. Power Electron. 2012, 27, 479–489. [Google Scholar] [CrossRef]
© 2019 by the authors. Licensee MDPI, Basel, Switzerland. This article is an open access article distributed under the terms and conditions of the Creative Commons Attribution (CC BY) license (http://creativecommons.org/licenses/by/4.0/).