1. Introduction
The temporal variability of wave energy has effects on the electricity supply to the grid. The comparison of the hourly variability of the resource, together with the hourly distributions of demands and production, provides the first indications of the dimensioning and design of an effective system. Seasonal and annual variability is increasing, even more so under the effects of climate change [
1], and should also be taken into consideration in accordance with the expected lifetime of the power plant; doing so allows for the prediction of underproduction, downtime and possibly strategic storage systems. Transmission and distribution networks can also be affected by irregular power production, and relative fluctuations must be considered further.
The design of an effective system requires three main reliable sets of data: hourly distribution of electricity consumption, a long record of validated metocean data and analytics for the specific location and validated power production of the adopted wave energy technology. These last two are not easy to obtain; the wave energy resource is unevenly mapped around the globe, and very few wave energy technologies have reached the pre-commercial stage [
2], so limited validated data exist relative to power production in real sea. Indeed, while the variability of the resource has been under discussion for some years [
3], there are only few studies analyzing the performance of wave energy systems on an hourly basis and, at the same time, considering annual variability [
4].
The application of wave energy in small islands could be ideal; the location is surrounded by the resource, and consumption is often off the grid. There may however be occasional need to rely on diesel generators with consequent high costs (that include transportation of the fuel) [
5].
The study presented in this paper is part of a broader investigation by the Danish Ministry of Defense, the Advisory Department/Building and Energy Division, aimed at evaluating new energy supply plans for a Danish small island in the Baltic Sea. Aalborg University (AAU) has been asked to contribute to it with wave energy expertise. We report here there results of this analysis. The aim of this paper is to describe the design of a wave energy system for a small island of circa 80 inhabitants and significant touristic activity, creating a very uneven and unfavorable demand on the grid. The island and its commitments to sustainability make it an interesting case for the application of wave energy. The island is Natura 2000 Under the EU Birds and Habitats Directive, while its wetlands, coastline and marine environment are protected under the HELCOM and Rasmar convention. All energy and heat supply on the islands is today via 3 oil tanks shipped to location. Electricity is produced by 3 generators powered by diesel fuel. Heating is done via 2 oil boilers and heat recovery on flue gas from generators and 1 oil fired boiler. Additionally, seasonal tourism (June–September) brings circa 80,000 tourist per year. Despite the tourists being mostly daily visitors, some do spend more time on the island, and tourism has a significant impact on the energy consumption and variability of demand. The island is sheltered on the east side by a bigger island, so that a suitable location for the wave energy installation is on the NNE-facing side, with a bathymetry that exceeds 80 m water depth.
2. Weptos Wave Energy Technology
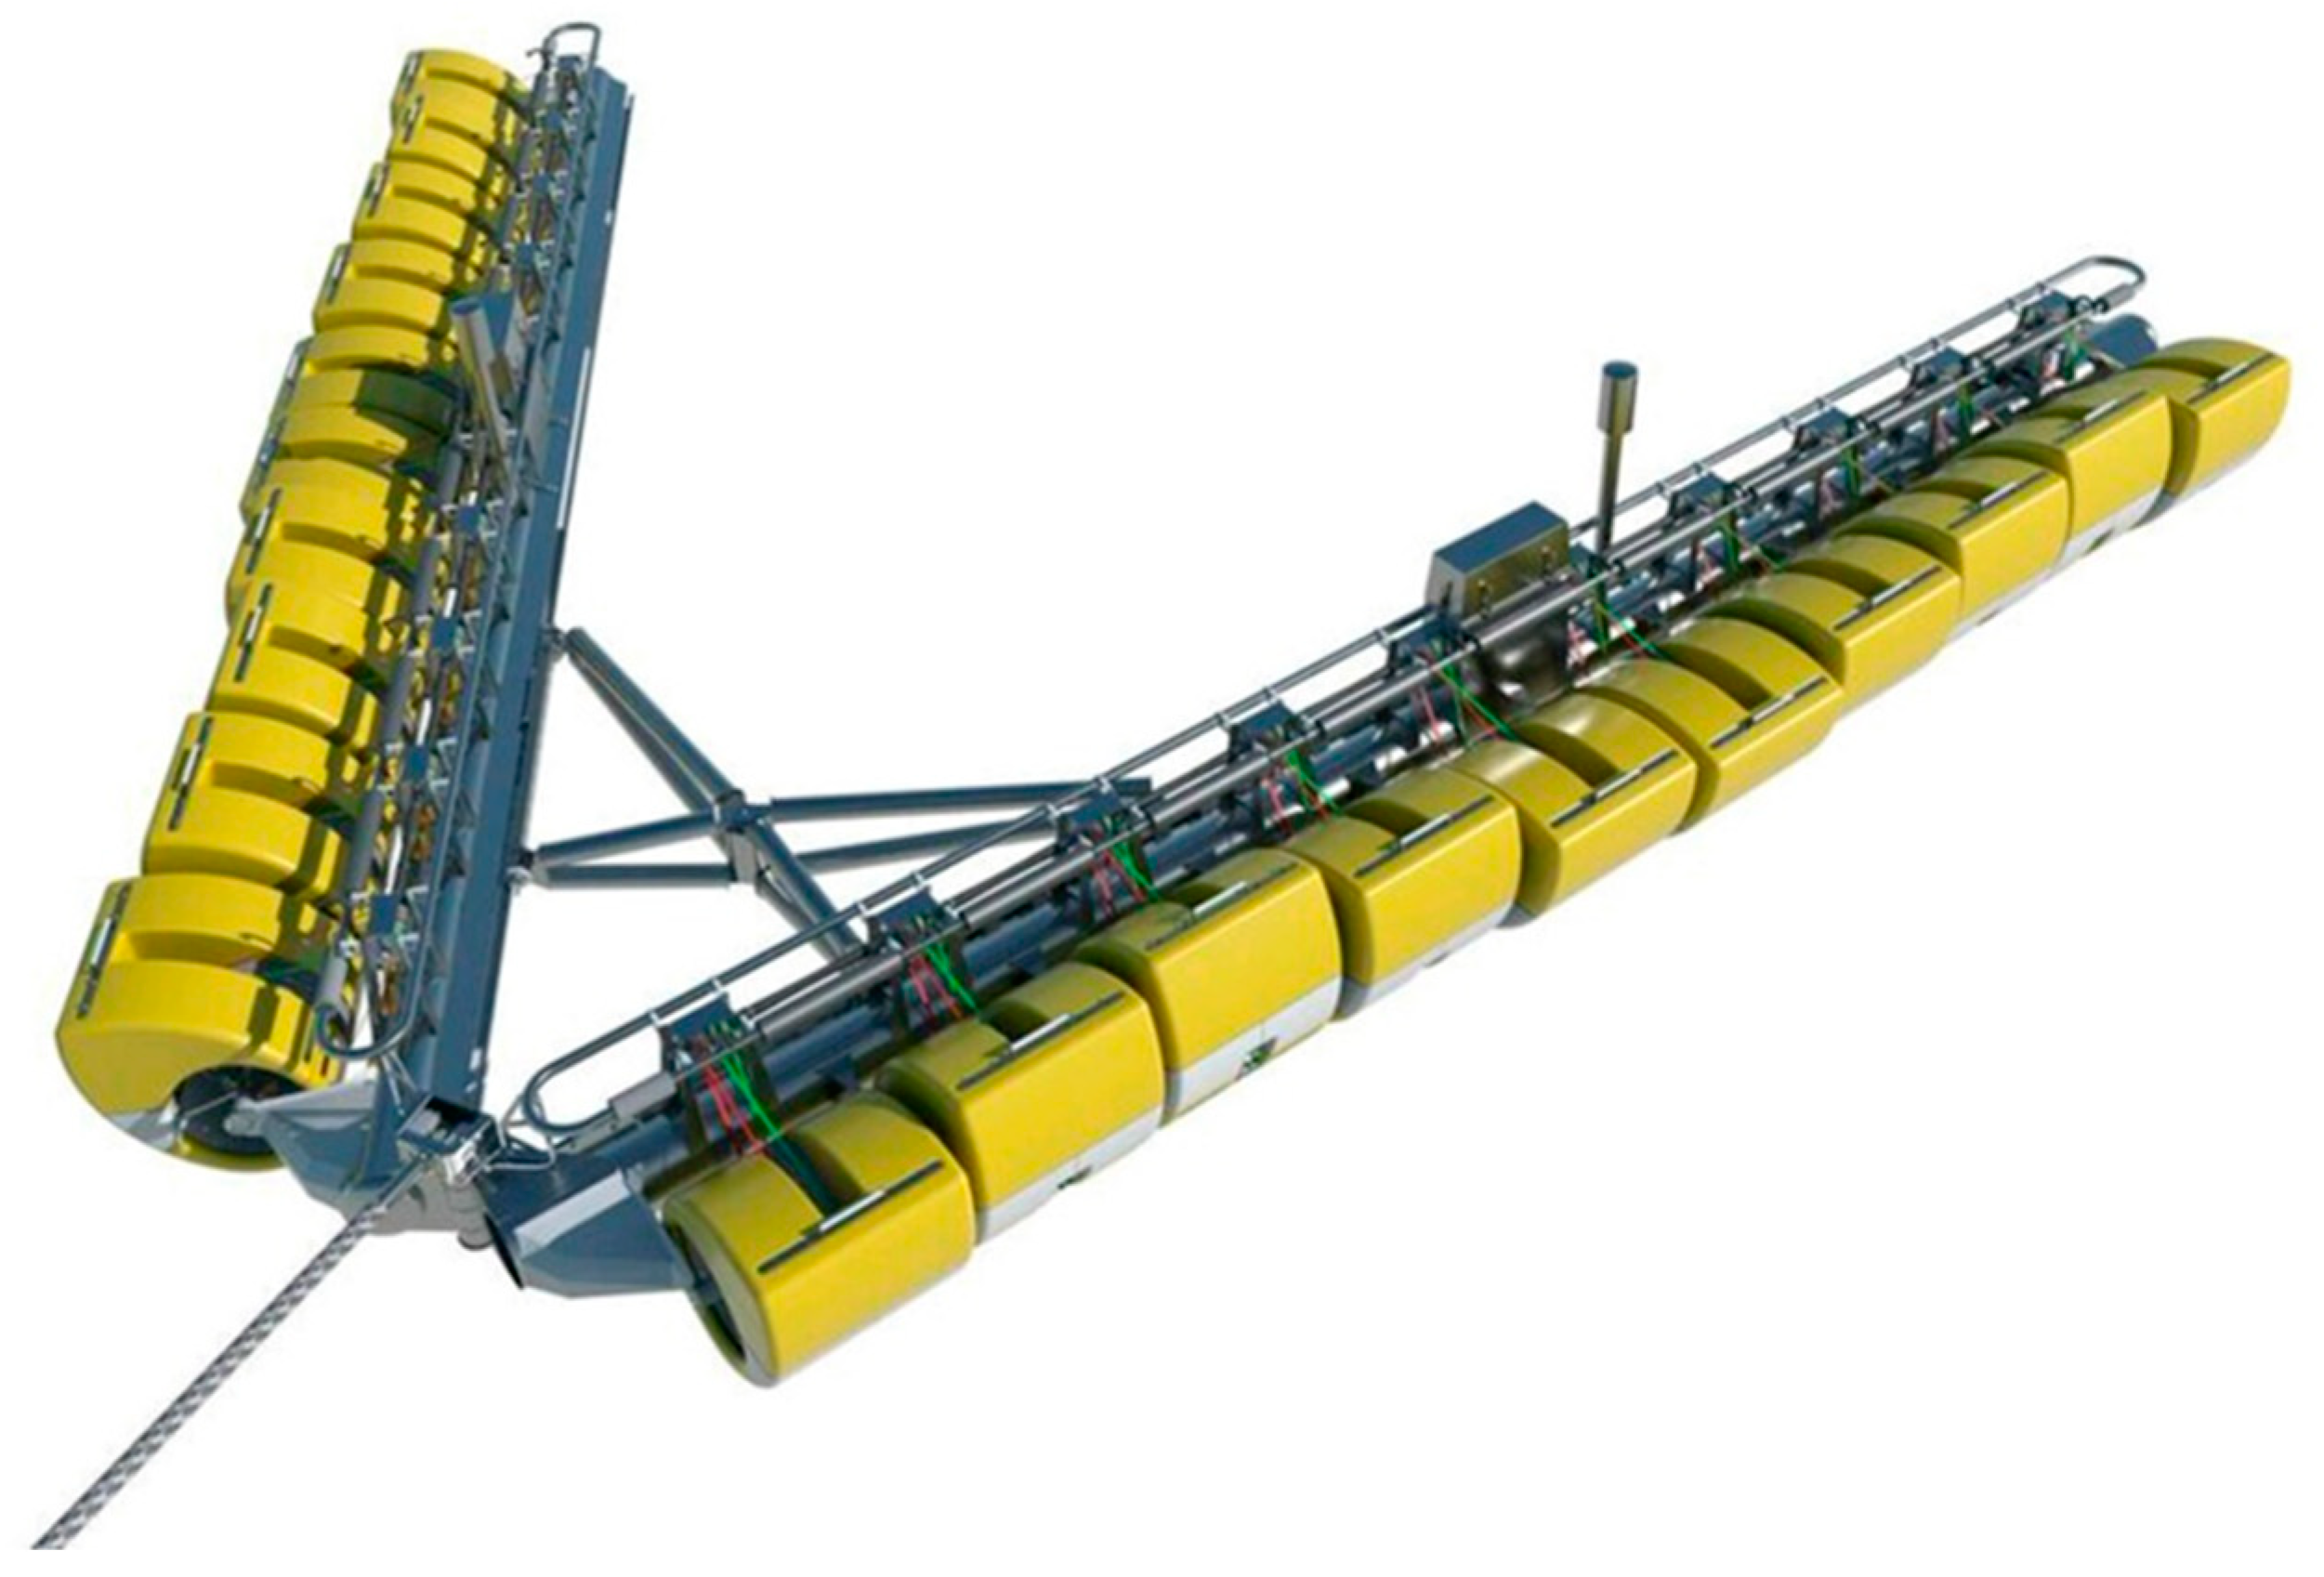
Weptos is an A-shaped floating structure that absorbs wave energy through multiple wave absorbing bodies, i.e., the rotors (
Figure 1). It has been through rigorous research and development, which has brought it to the forefront of the wave energy sector [
6]. Throughout the development of the Weptos, the design of the full-scale device has been optimized, which has significantly increased its power production, while reducing its weight and cost. This resulted in favorable forecasts of its cost-of-energy. The A-shaped structure has the particularity that it can adjust the angle between the two legs, from 13° up to 120° for the optimization of power absorption as well as the reduction of structural loads in extreme conditions. Furthermore, it provides a natural power smoothening effect, as the rotors on a leg interfere with a wave successively, limiting peak loads on the power take off (PTO), thereby resulting in unusually high load factors on its generators. Depending on the location of installation and the wave climate, the rotors (as well as the whole structure) and power take off are scaled for the specific site conditions. Two sets of 10 rotors are part of the Weptos device.
The shape of these rotors was inspired by the Salter duck; their high efficiency was proven already in the 70’s [
7]. The PTO consists of a fully mechanical transmission, resulting in very high efficiency. The power transmission from the rotors to the axle flows at both upwards or downwards strokes of the rotors. Their weight is optimized, and they feed power to a common uni-directional rotating axle on each leg. The transmission between the rotor and power transmission axle gears the rotational speed up and the torque down. Generator houses are built into the structure and located in the middle of each leg. The mechanical power is then transformed into electrical power by the generator. Depending on the wave conditions during operation, the generator loading is regulated by inverter control settings. The machine is moored to the seabed through a single anchor leg mooring system with rigid members and a buoy which also holds a mechanism allowing Weptos to serve as a weather vane. The machine and its development is described in further detail in [
8,
9]. The device has been through preliminary real sea testing on a moderate scale during the summer/autumn of 2017, where a 6 kW Weptos prototype called OFFSHORE #1 was tested in Lillebælt (Denmark), near the island Brandsø. These preliminary tests indicated that the performance observed in laboratory testing could be achieved [
10]. The Technology Readiness Level for the device is currently considered to be at level 6 [
11].
3. Method
In order to design the Weptos WECs for a specific location, the wave climate must be described. The wave climate is defined as the distribution of wave characteristics over a long period of time (several years). The main wave parameters are the significant wave height, Hs, and energy period, Te. A long record of these two statistical parameters is collected in scatter diagrams; each cell of the scatter diagram is identified by a range of Hs and Te, the sea states, and the relative probability of occurrence. For each cell, it is then possible calculate the corresponding wave power and the probability of occurrence of the specific sea state [
12]. The scatter diagram is therefore site specific, and describes the wave climate at a specific location. The power matrix or the efficiency curve are the characteristics of the WEC. They can be used to present the performance of a specific device in terms of efficiency, i.e., how much energy is produced for a given sea state. Depending on the stage of development, these are obtained from laboratory tests, numerical simulations or real sea trials; the more advanced the stage of development, the more reliable the power matrix or efficiency curve. In this study, we utilize the efficiency curve of the Weptos. This was defined through laboratory tests and validated during sea trials [
8,
9], and describes the efficiency of the WEC (in terms of converting the power in the waves into mechanical energy at the unidirectionally rotating axle of the power take-off) as a function of the wave period, based on the active width of the rotors. When applying the efficiency curve to the real sea scale of the WEC, the wave period must be scaled according to Froude scaling, using the assumed scale of the rotor diameter.
For the specific application dealt with in this paper—power supply for a small island grid—the balance of production and consumption is of paramount importance. Hence, it is not sufficient to look at power production based on scatter diagram combined with power matrix/efficiency curve. It is necessary to look at the short-term power balance. At this preliminary stage, it was decided to use one-hour averages as the basis for analysis. Thus, time series of the wave parameters, as well as power consumption on the grid with a one-hour resolution are needed. Using the wave parameters (and, therefore, the wave power flux), combined with the efficiency curve (for an assumed scaling ratio, and with a specific installed generator capacity), the time series of the power production from the WEC at one-hour intervals can be calculated. By matching the power production time series with the power consumption time series, the balance can be made and the difference is fed into or extracted from the battery; as such, the overflow or undersupply can be calculated accordingly.
For this study, one year (1 September 2016 to 31 August 2017) of hourly data for both waves and electricity consumption is available. The designs take into account only hourly and seasonal variability. For this preliminary study, the magnitude of the annual variability of the resource is calculated on a longer record of wave data obtained from hourly wind data (period 1 January 1979–31 December 2016) by calculating the standard deviation of the average available wave power.
In the following sections, the analytics of the wave energy resource is described. It must be noted that while we provide the scatter diagram at location for characterization purposes, the power production is calculated on an hourly basis (and, therefore, with a higher degree of resolution than the scatter diagram) for the period 1 September 2016 to 31 August 2017, compared to the power consumption provided directly by the Utilities, taking into account the storage capacity of the batteries, as well as backup power, when needed.
3.1. One Year Wave Data
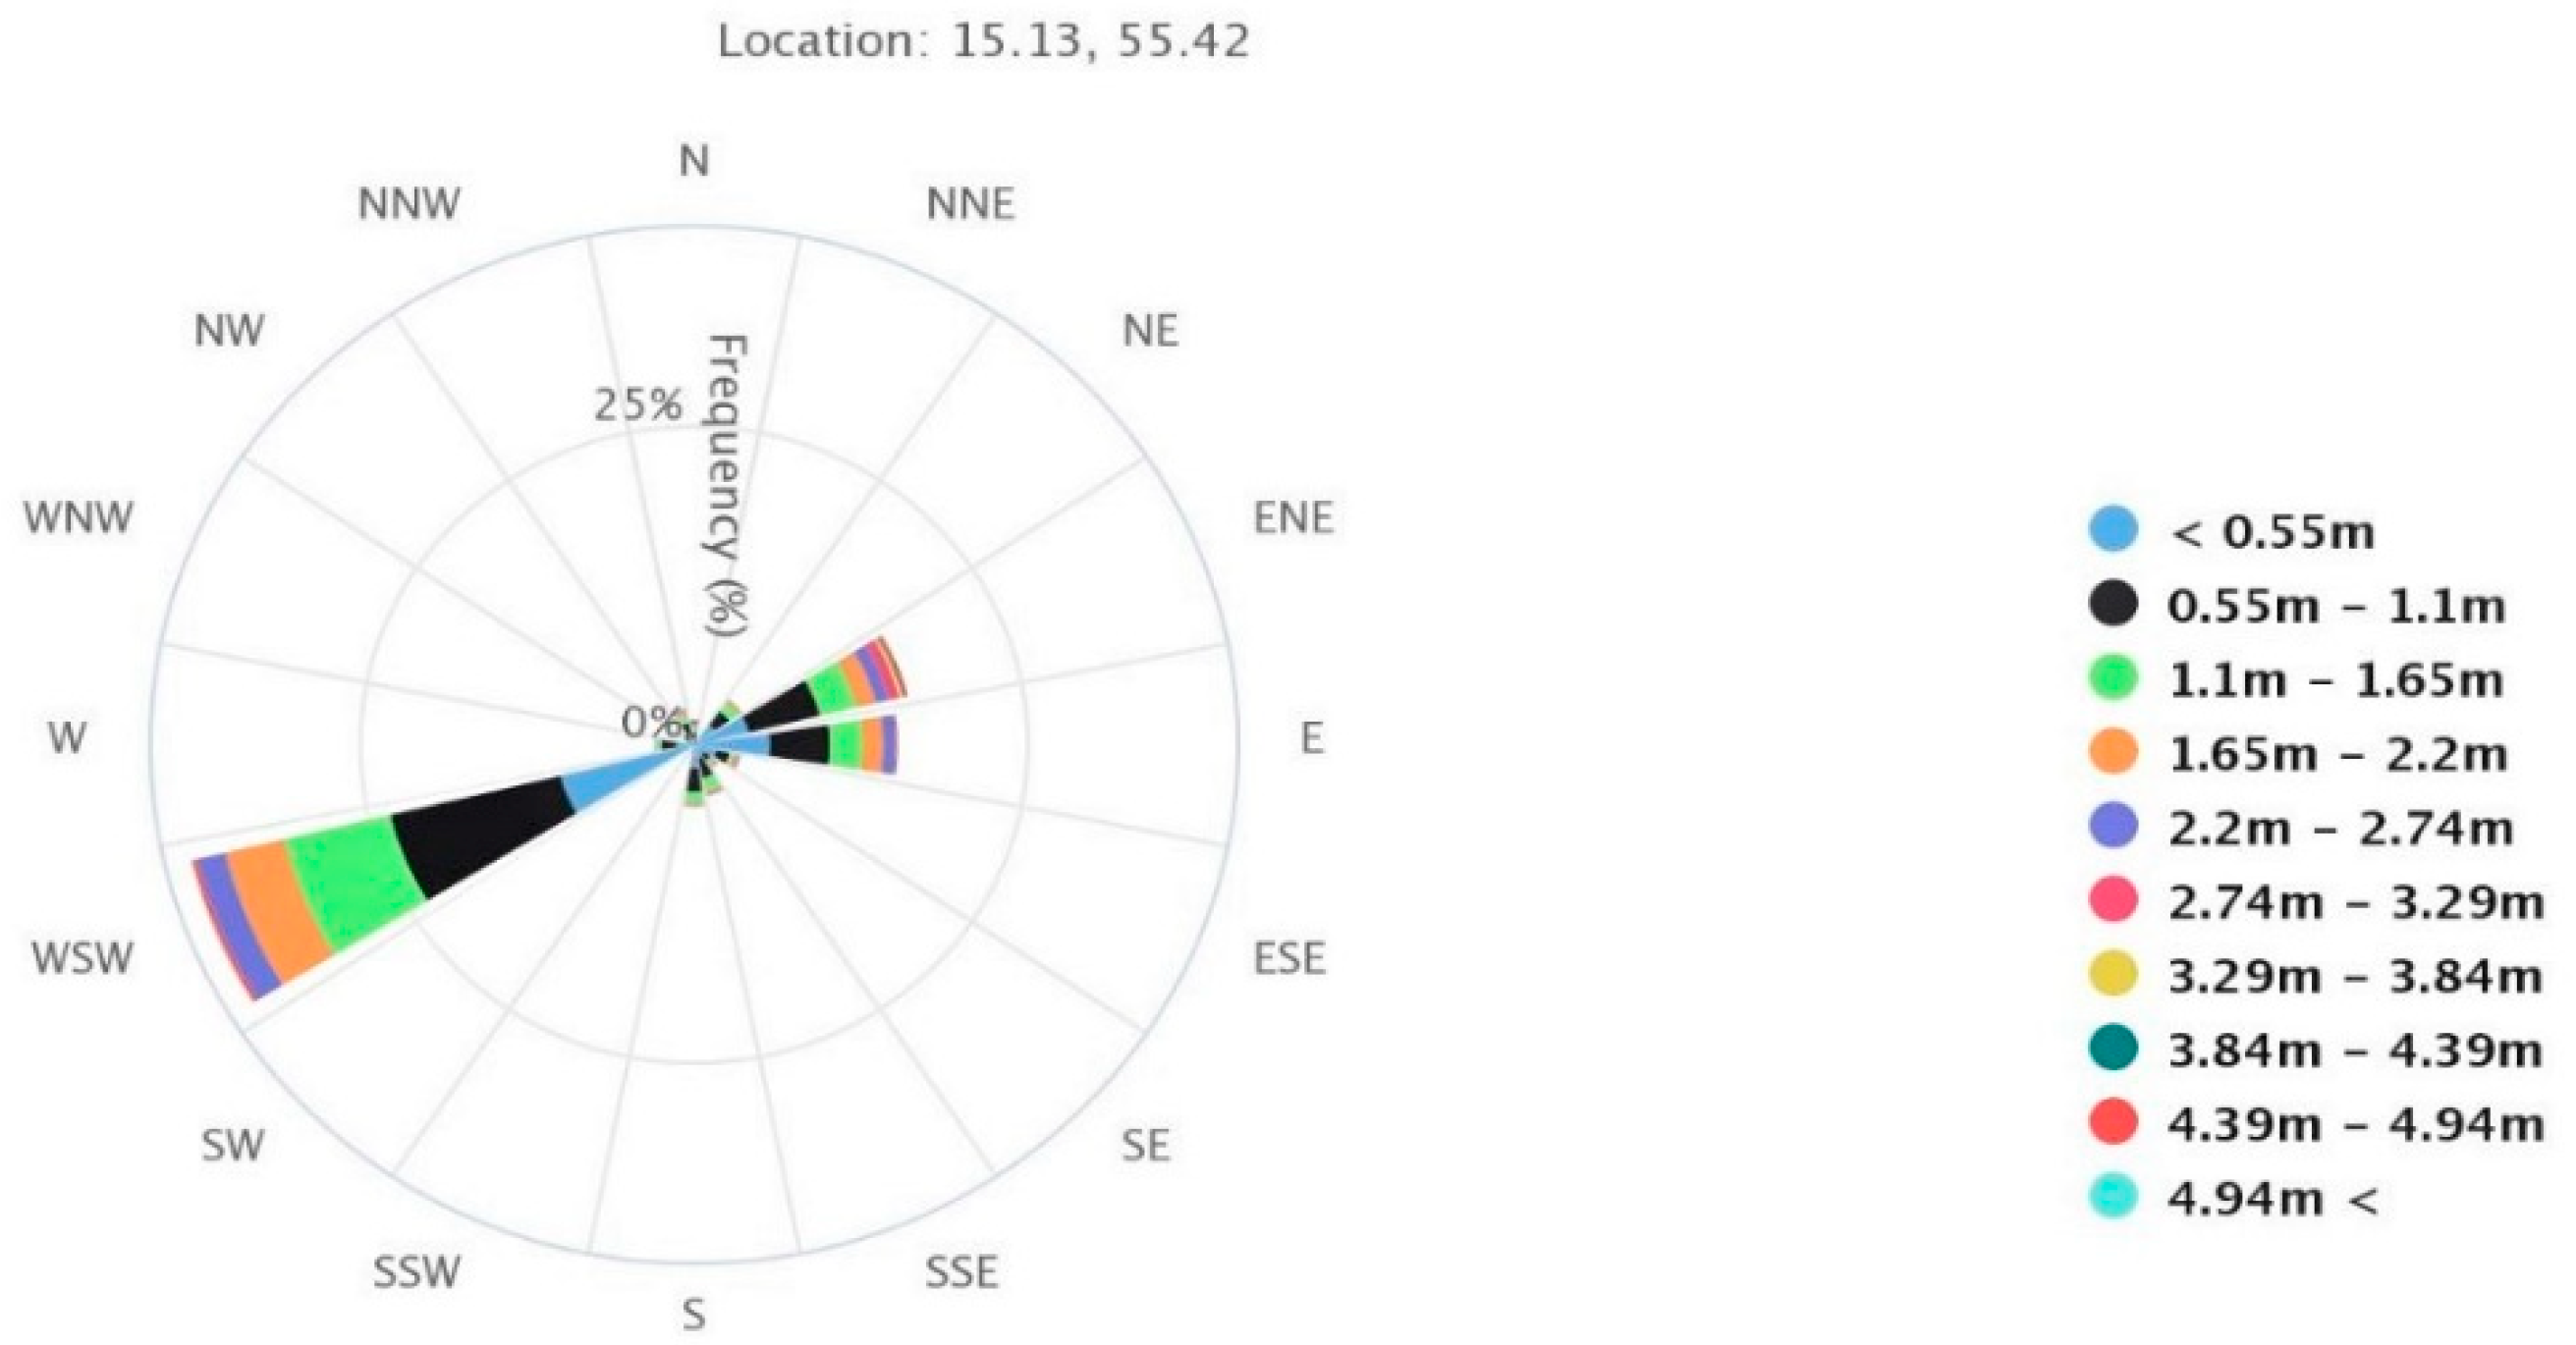
One year of wave data was obtained from the Danish Hydraulic Institute (DHI) MetOcean data portal (2016) in order to make a detailed hourly analysis of energy generation and consumption. The wave data set covers the period 1 January 2016–31 December 2016 at the location. The data is provided as time series of the significant wave heights [Hm
0], peak periods [T
p] and related wave direction, one each hour for the year 2016. The wave rose in
Figure 2 shows that most of the waves come from WSW direction (circa 45% of the wave events) while the rest mainly come from ENE and E directions.
By grouping the results based on significant wave heights [Hm
0] and peak periods [T
p] into bins using the median value for the indicated value, we can then identify the most common wave conditions (
Table 1), i.e., Hm
0 = 0.75 m and T
p = 4.5 s. 15.3% of all calculated wave conditions that fall into this category. Other very common conditions are Hm
0 = 0.25 m and T
p = 3.5 s (12.3% of the time) and Hm
0 = 1.25 m and T
p = 5.5 s (12.2%). Therefore, for the wave conditions in the scatter diagram, the theoretical wave power, calculated with Equation (1), is reported in
Table 2. Preliminarily, the most suitable location for the installation of a Weptos WEC to supply power to the island is considered to be circa 2.5 km NNE of the Island in a relatively shallow water location (small plateau of 40 m water depth, surrounded by deeper water > 80 m). A coarse estimation of the deep water limit h/L < 1/2, where h is the water depth and L is the wave length, results in circa 80/170 for H = 4.25 m and T = 9.5 s. It should be noted that for T
p less than 6 s, there is a less than 2% effect of the water depth limit, but as T
p increases, the effect also increases, so at T
p of 11 s, the deep water formulation underestimates the P
wave by up to 15%. However, the bulk of the energy contents is found for T
p below 7 s, where the underestimation is at around 5%. This is the difference between using the general expression for wave power density vs. deep water approach [
13]. It is also worth considering that sea state data is not derived from a model where this locally reduced water depth is present, and thus, using the model sea states and applying it to the lower water depth will not be correct either, as wave transformation will probably also take place, which is not correctly modelled. Ultimately, since the wave model is not including the finer seabed features, such as the local plateau, it is most accurate to use the general water depth in the area (>80 m), which means that the deep water assumption is fair, and the bulk energy error is below 2%. In any case, since the deep water formulation underestimates the resource slightly, the approach is considered conservative from a production standpoint.
with a relation of T
p/T
e = 1.15, assuming a JONSWAP spectrum with a gamma of 3.3, as in [
12] and with
of 1023 kg/m
3.
To understand where most of the power to be exploited is located among the different wave conditions, it is important to multiply the probability of occurrence to the wave power for the specific location (
Table 3). The location under study has a wave climate of 4.38 kW/m (based on wave data from 2016).
3.2. Annual Variability
The year-by-year variability on the wave energy resource should be taken into consideration as the energy content in waves can vary considerably from one year to the next, while the detailed power production and consumption balance is analyzed for one specific year. For this study, considered to be a preliminary assessment, we use the long-term set of data to make a preliminary assessment (from hindcast period 1 January 1979–31 December 2016) [
14].
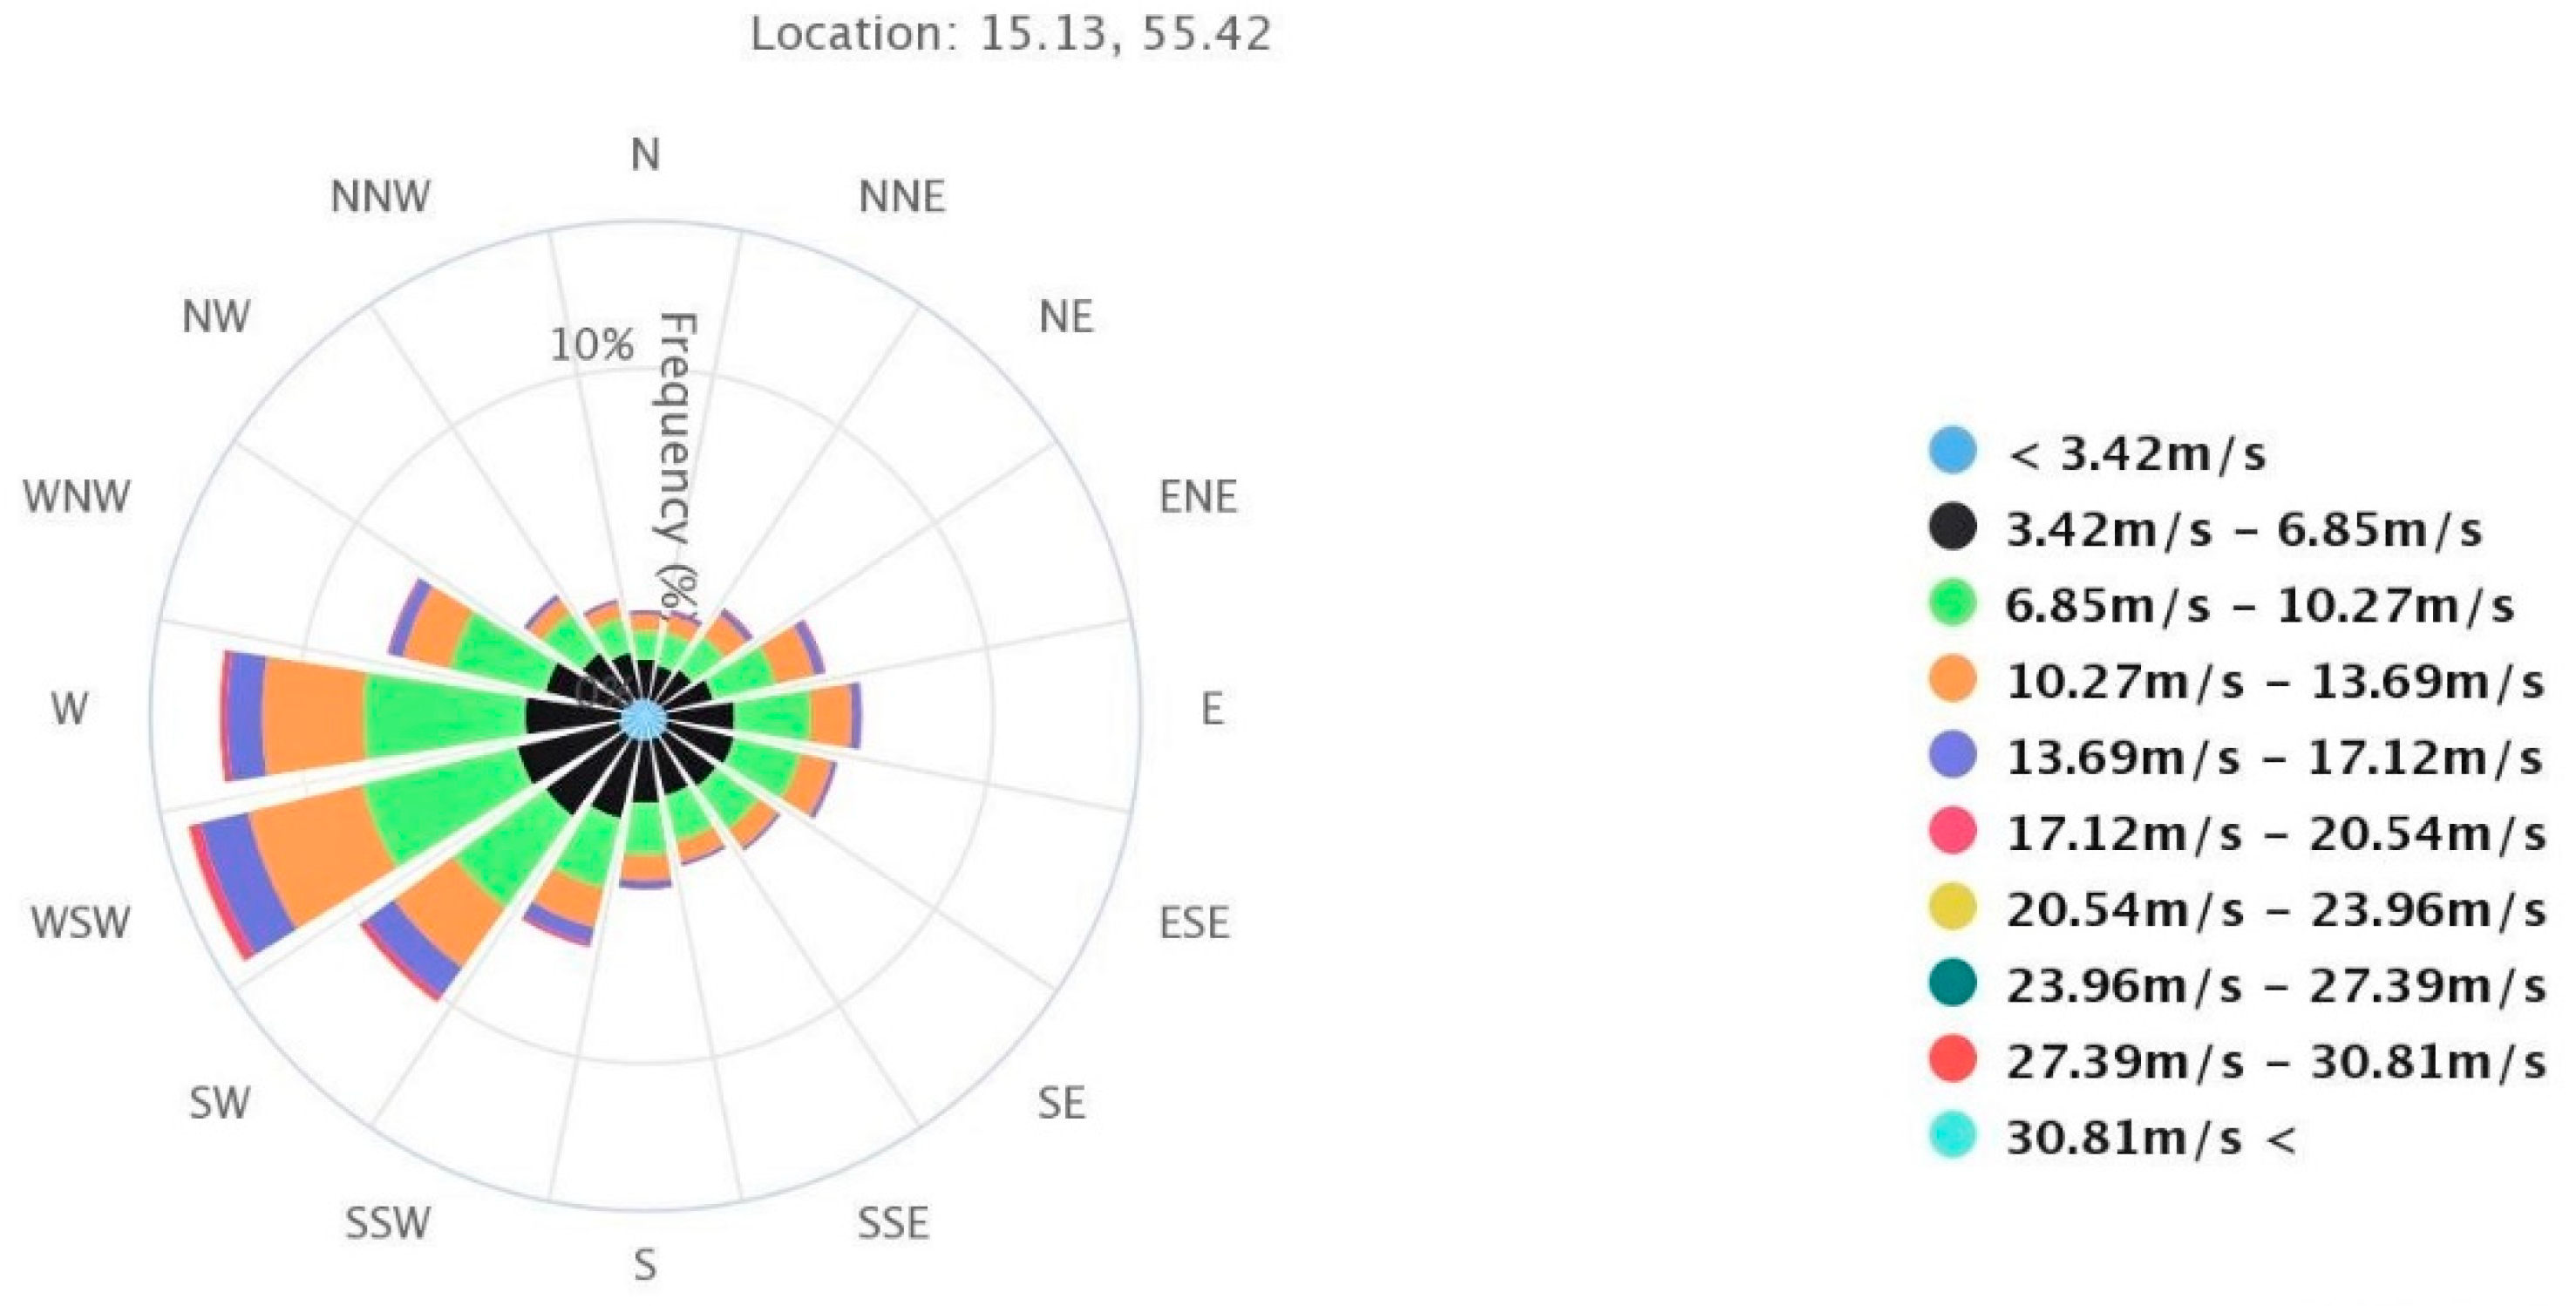
The set of historical wind data covers the period 1 January 1979–31 December 2016 (one wind speed [m/s] measurement each hour, for a total of 333.122 data points). The data has been retrieved as open access from DHI MetOcean data portal (Global, Wind Parameters at 10 m, Climate Forecast System Reanalysis (CFSR), National Centers for Environmental Prediction (NCEP) National Oceanic and Atmospheric Administration (NOAA), 2017). The representative location is 55.42N, 15.13E, circa 10 Km NNW from the island. The wind rose at location for the selected years is presented in
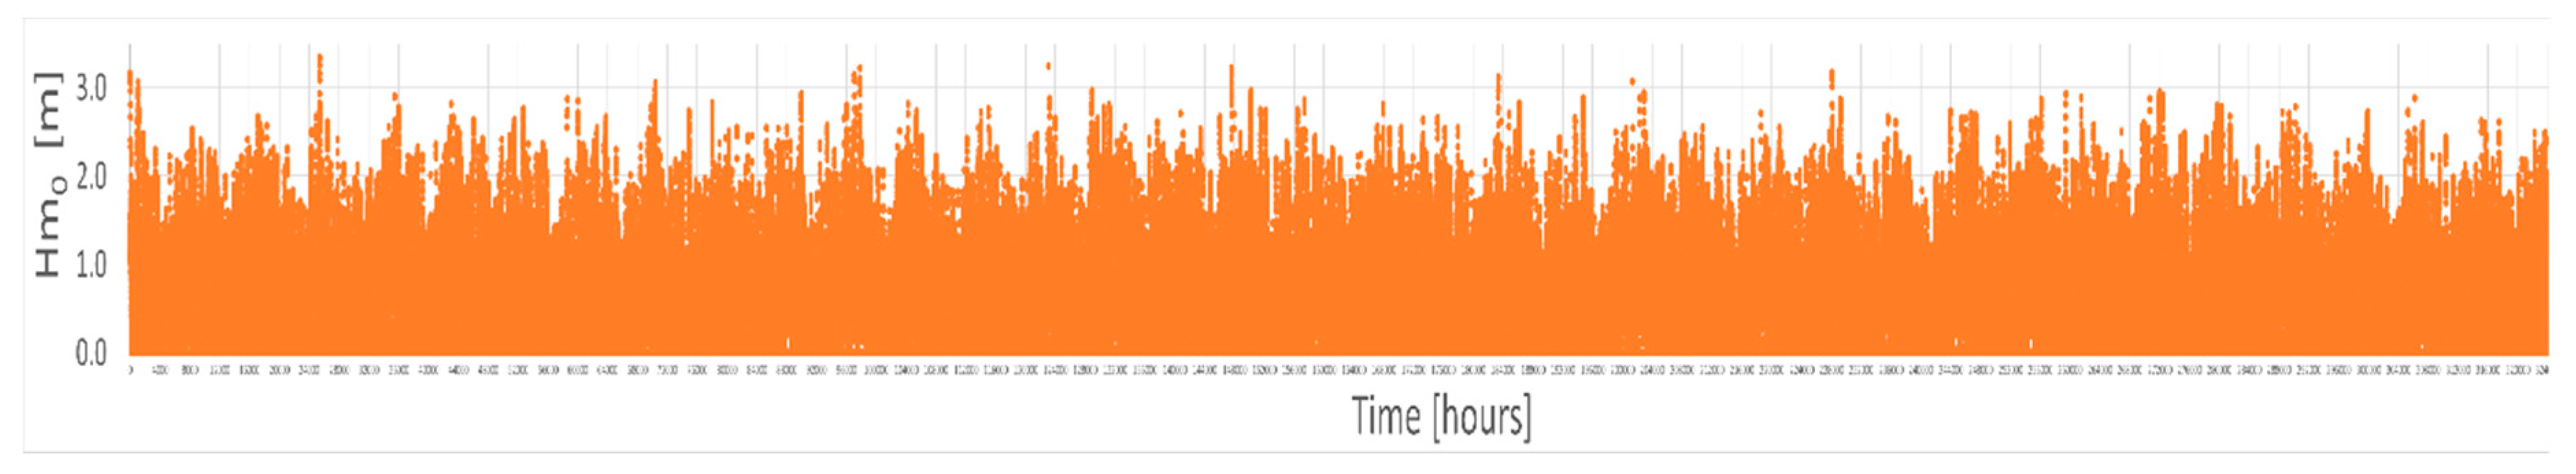
Figure 3. We can see that the dominant winds come from WSW, covering circa 12% of all wind data. W, WSW, SW directions together cover 33.7% of all wind while 46.4% is covered by WNW, W, WSW, SW, SSW directions only. The fetch and wind speed are directly related to the wave condition, and therefore, from each wind speed it is possible to calculate a corresponding significant wave height and peak wave period (Hm0 and Tp) using the SPM 1984 Wave Hindcast Model [
15] if wind duration, direction, fetch and water depth along the wind directions are known (
Figure 4).
After the calculation of the wave power for each wave condition from 1979 to 2016 with Equation (1), the average wave power for each year was calculated. The mean and standard deviation of P
wave year-by-year is given in the
Table 4. The mean P
wave is here calculated as arithmetic mean of all P
wave hourly values. The standard deviation over the whole population of data, from 1979 to 2016 is 4.89. The standard deviation of the annual mean values over all 38 years is 0.41. It can be expected that the variation in the power produced by a wave energy device will roughly follow the variation in the available P
wave.
4. Results
The most suitable location for the installation of a Weptos WEC to supply power to the island is considered to be circa 2.5 km NNE of the Island in a relative shallow water location (small plateau of 40 m water depth, surrounded by deeper water > 80 m). The location is outside the protected areas around the island, the water depth is less than the surroundings (therefore reducing the cost of moorings), and it is still exposed to the Western wave and wind conditions responsible for most of the favorable wave climate. The wave resource is 4.38 kW/m (in 2016). As a basis for discussion, two different cases will be presented: Four Weptos WECs and Two Weptos WECs, respectively. A coarse cost-of-energy optimization, together with fixed target load factor of 0.20 have been used as the basis in order to find a good balance between installed capacity, scale of the machine, battery capacity etc. At the end, the battery pack size was kept equal to 3000 kWh in both cases and the total installed generator capacity was set to 750 kW (sum across all machines). The load factor has been chosen so to keep results on the conservative side [
16].
It is assumed that the potential cost increase due to more and smaller generators, in the case of a park with 4 Weptos compared with the one with 2, is balanced by the reduced cost of the structure, due to higher serial production gains, and therefore, the CAPEX (excluding installation) is assumed to be the same for both cases (same cost per installed capacity, overall). It is expected that properly placing more devices [
17,
18] can have a smoothing effect in the power output, but only in the short term.
It is therefore necessary to quantify the variability, estimate the underproduction and overproduction times and, consequently, design a system that integrates storage in an optimal way.
The basis for the coarse cost-of-energy optimization resulting in the suggested configuration is given below:
Cost of WEPTOS: 37,500 DKK/kW generator capacity.
Cost of battery packs: 3000 DKK/kWh storage capacity.
Cost of backup generation: 4 DKK/kWh production.
It must be noted that these numbers can only be considered ball park estimates, and are only applicable to this coarse optimization exercise.
4.1. System with 4 Weptos WECs
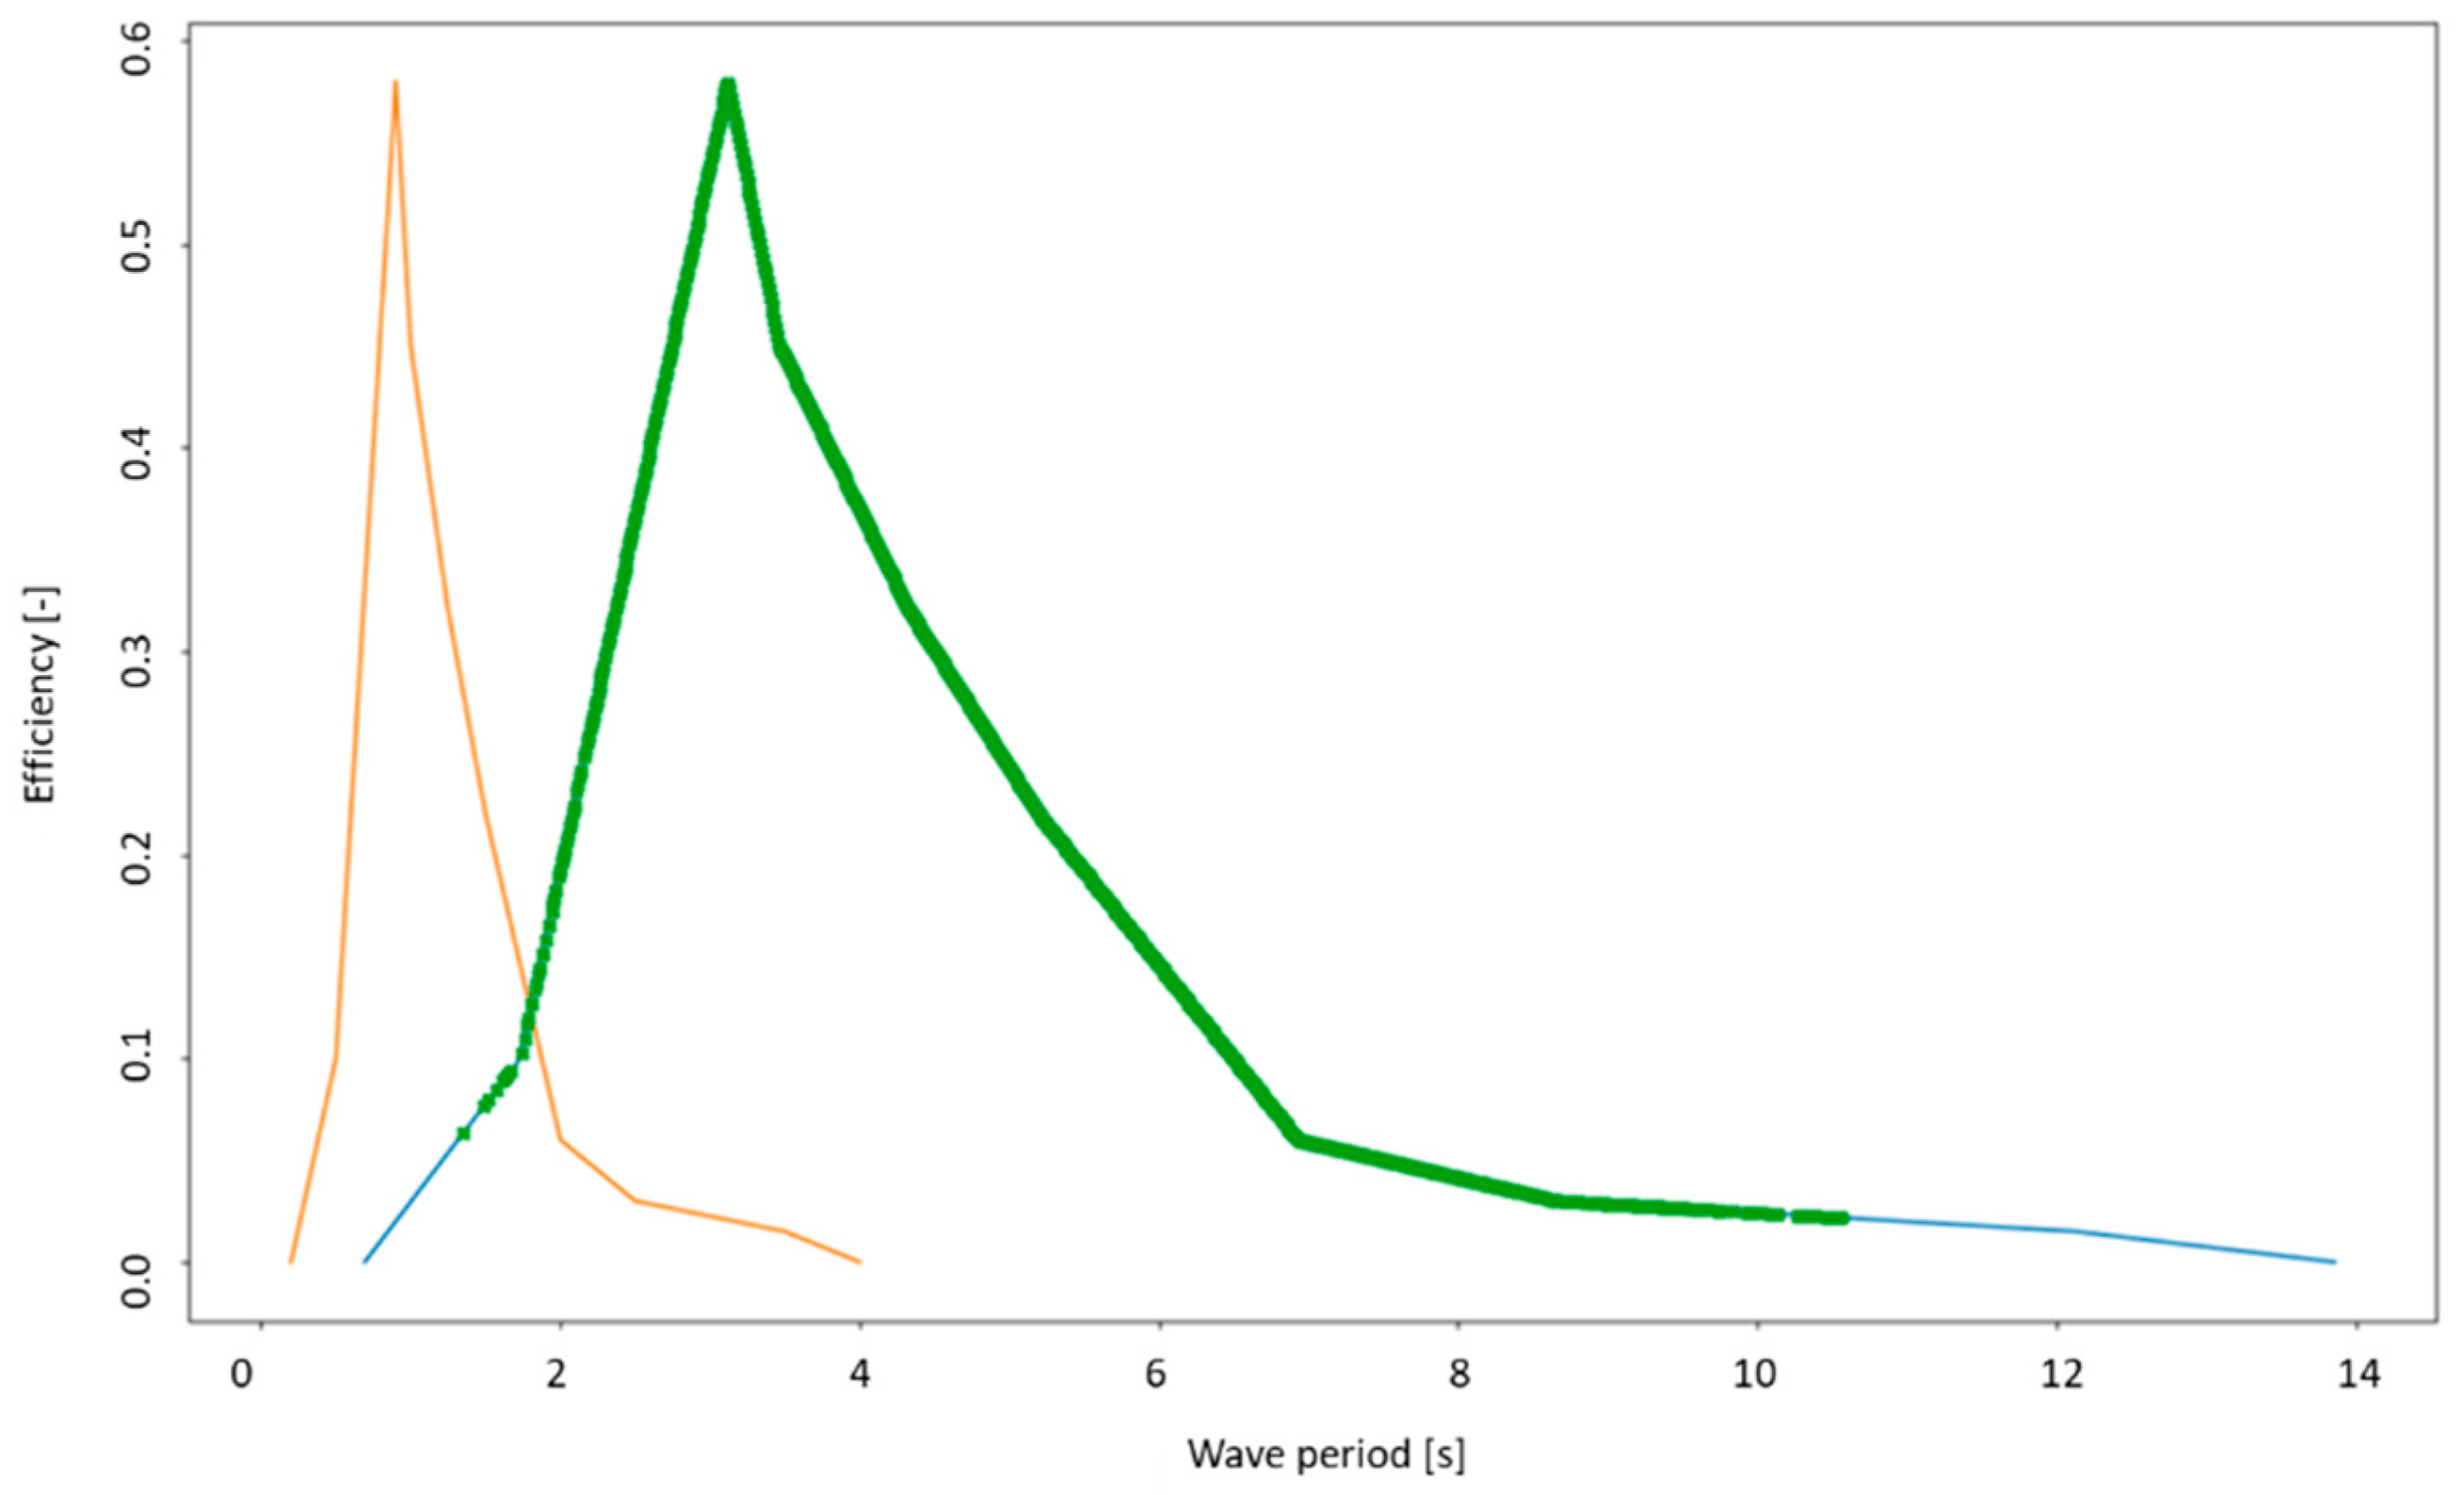
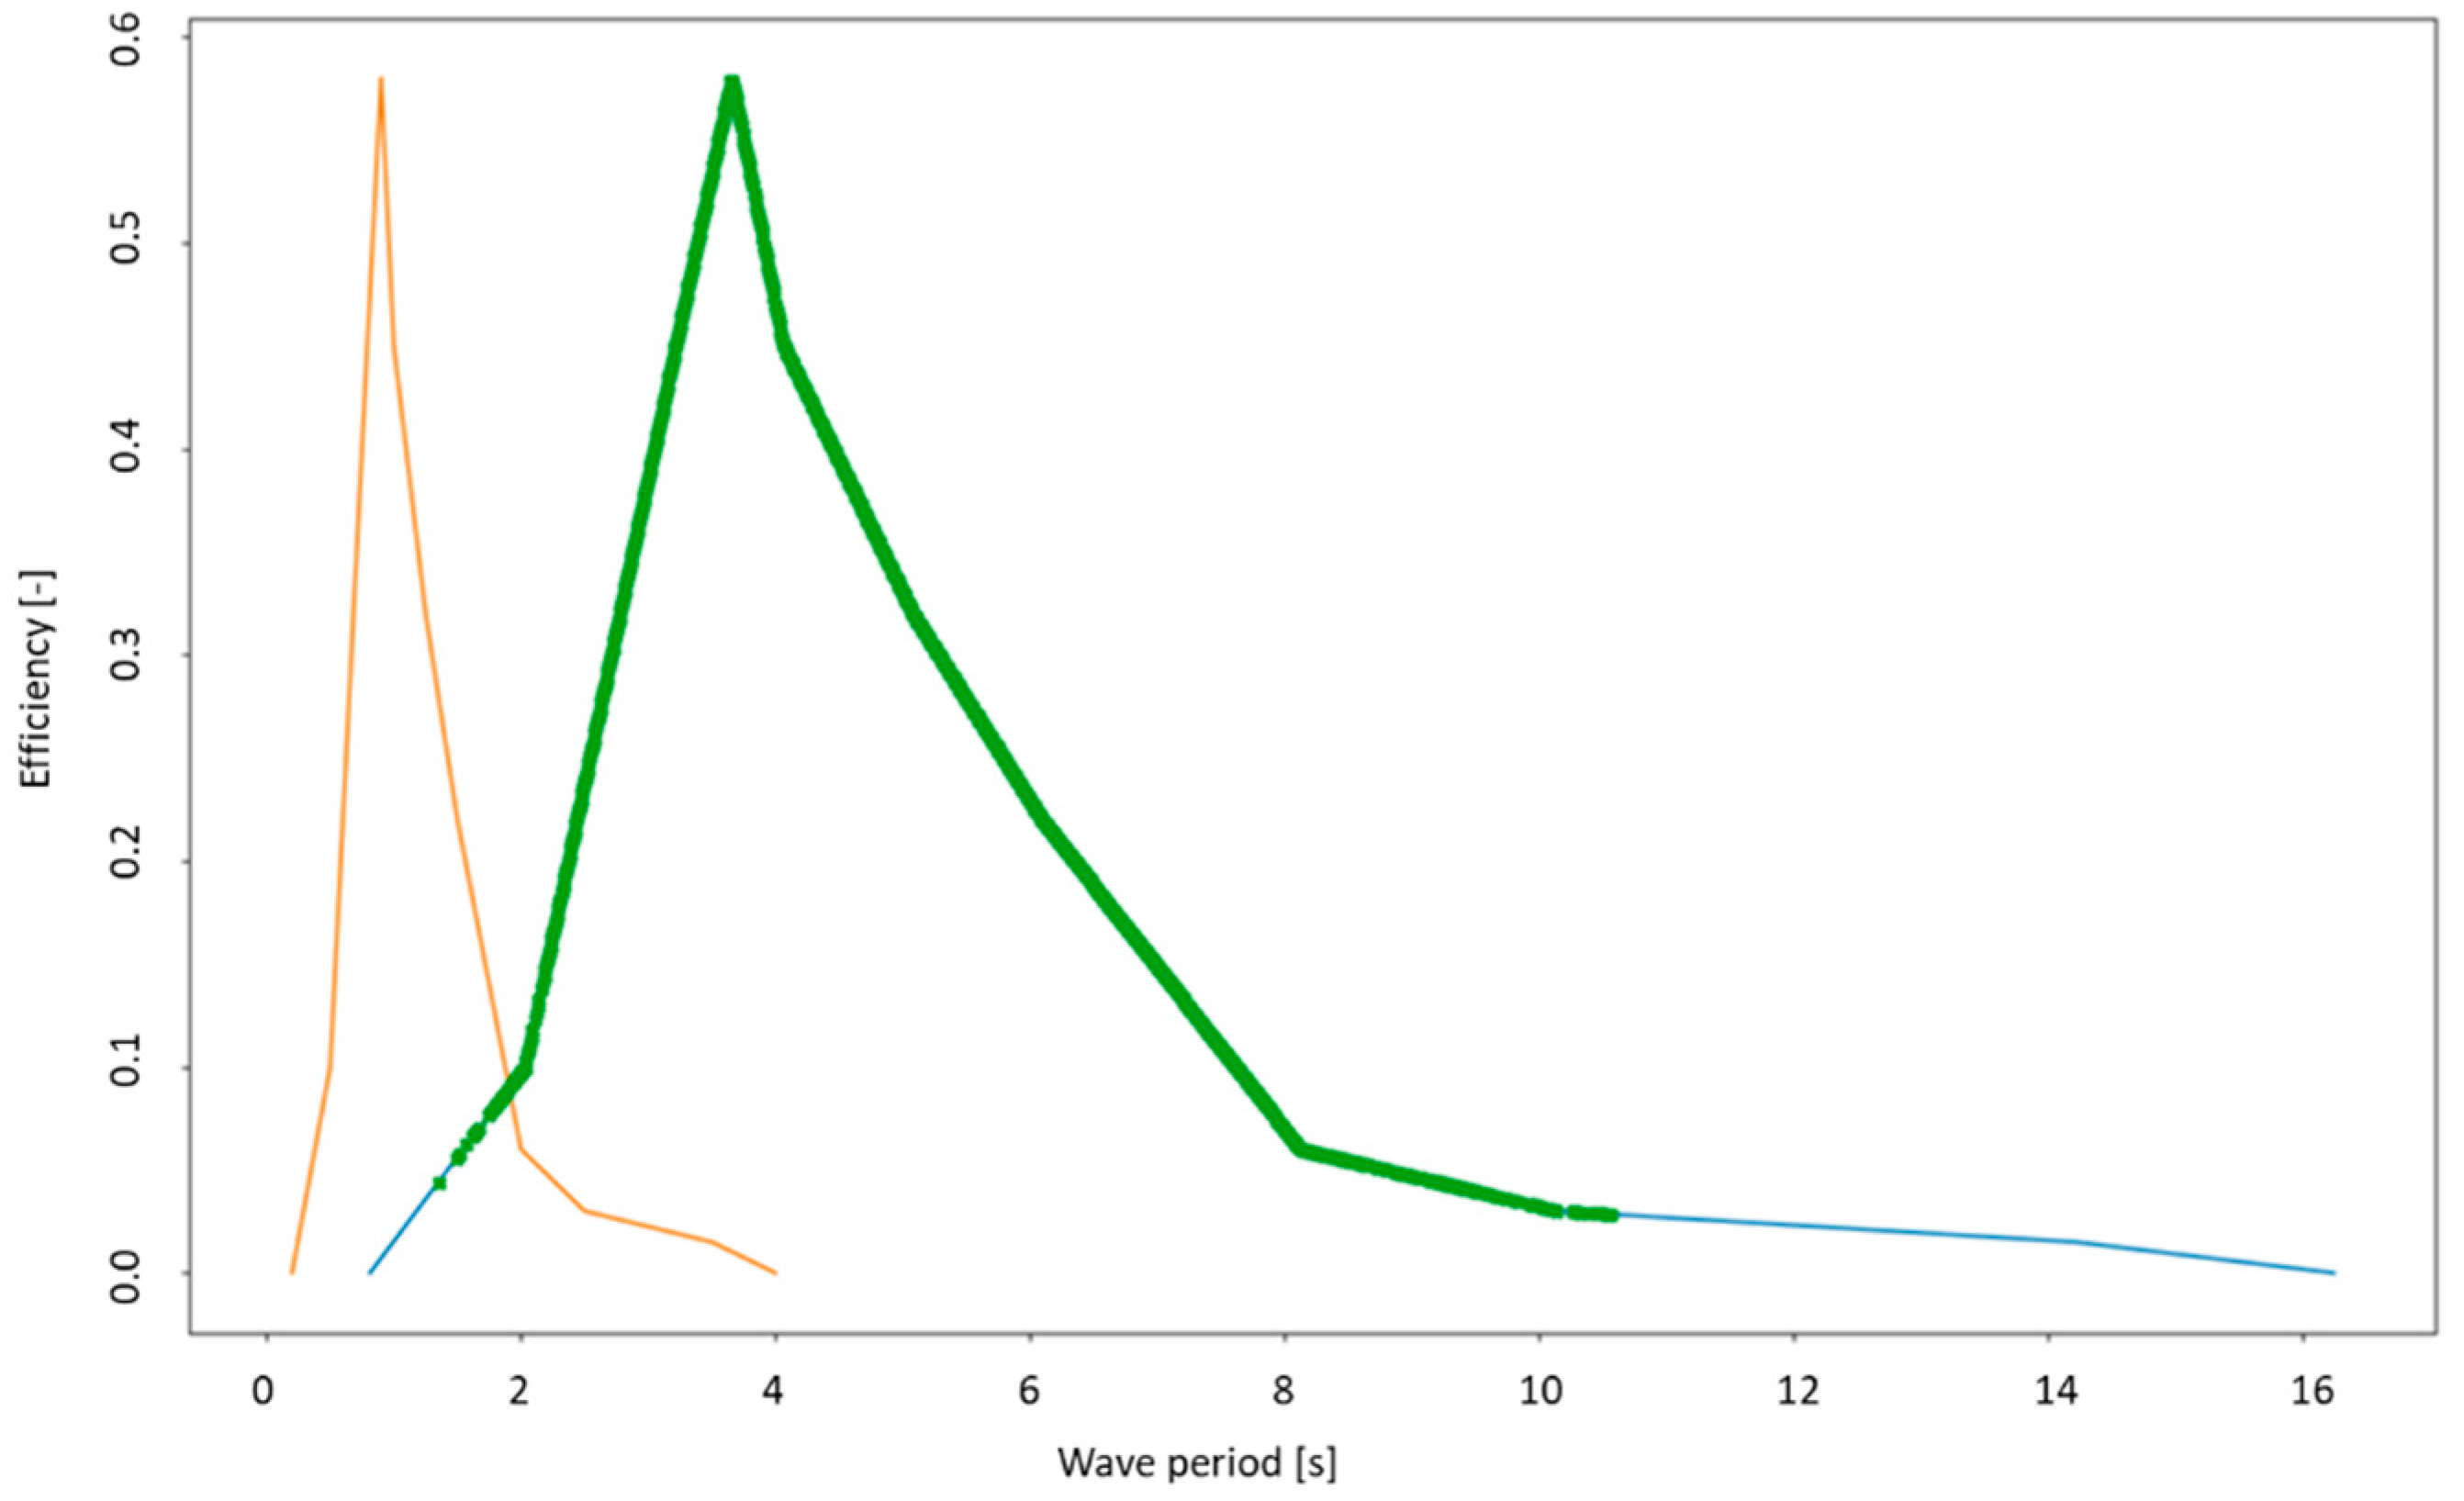
For the wave conditions at the location, a rotor width of 3 m is found to be suitable for the 4 machines’ configuration. With 10 rotors per side, the total active width of each side is 30 m (60 m per WEC). Given the power consumption of the island, it was estimated that 4 Weptos WECs with the above given characteristics will be necessary. Each machine is equipped with a 187.5 kW generator capacity. The peak efficiency of the device is then expected for wave periods around 2.9–3.4 s (
Figure 5). In this case, the efficiency (ratio between mechanical power available to the generators P
mech and P
wave times the active width of the absorbers) is above 50%.
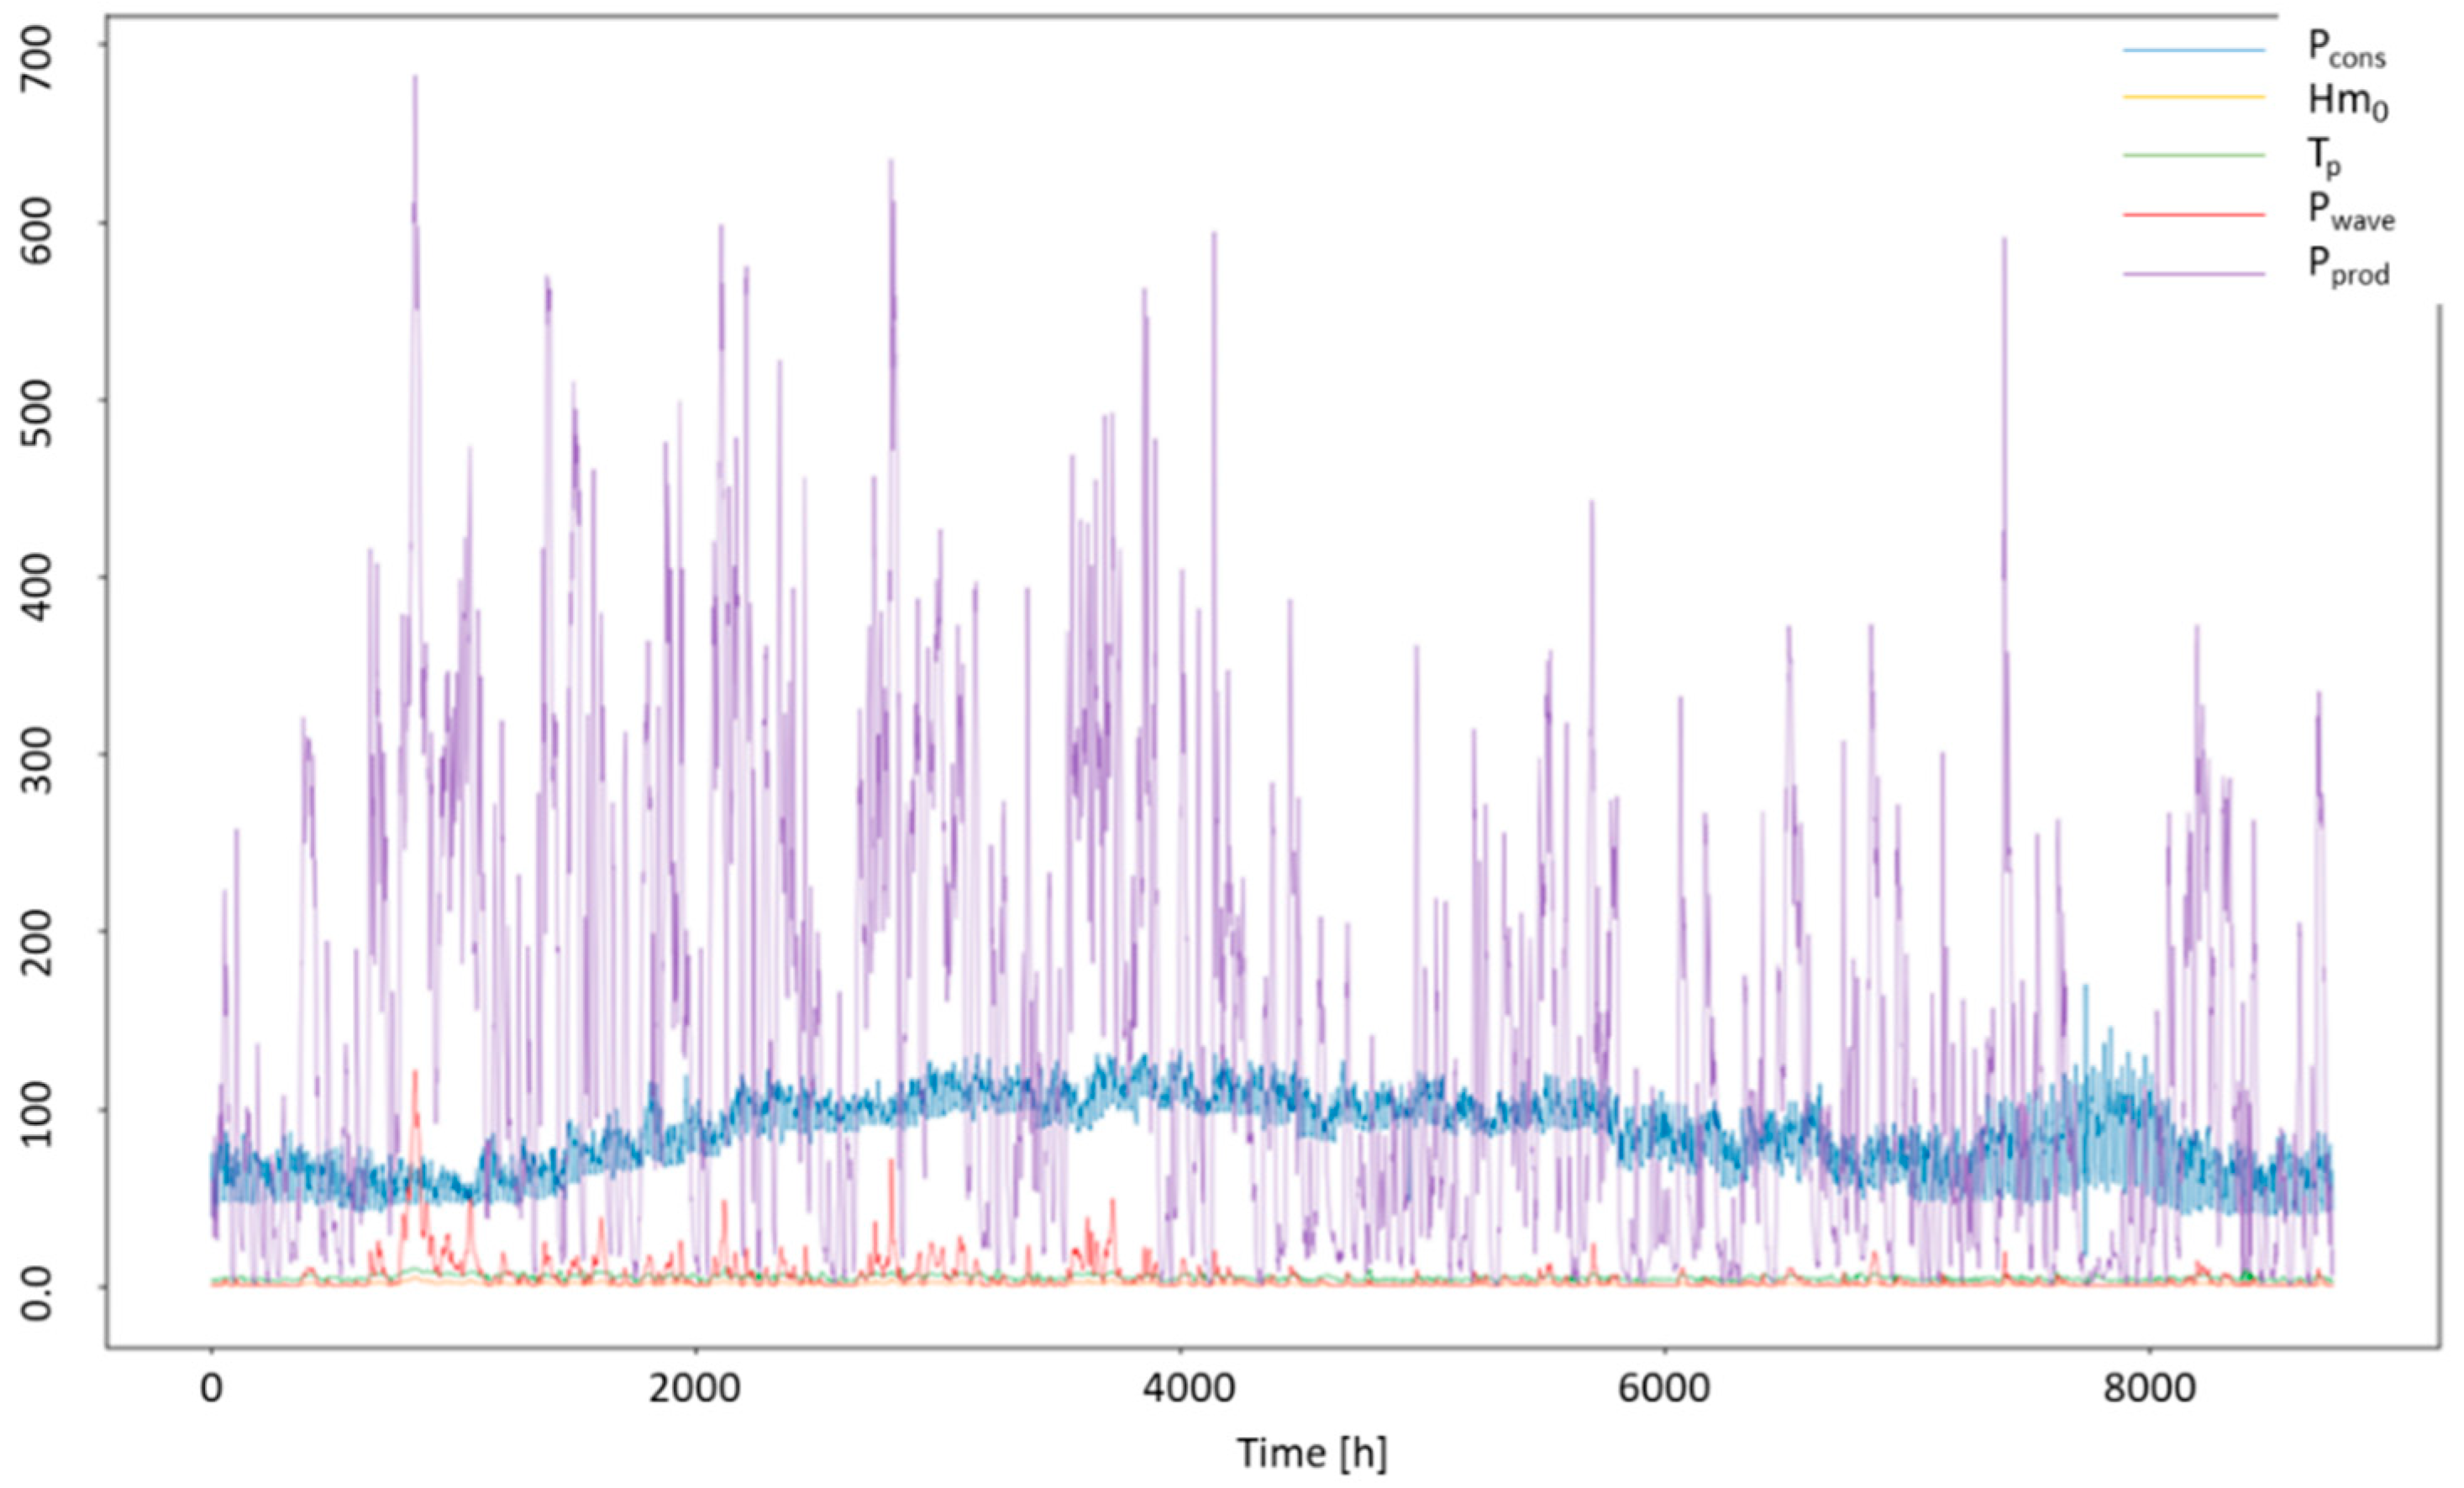
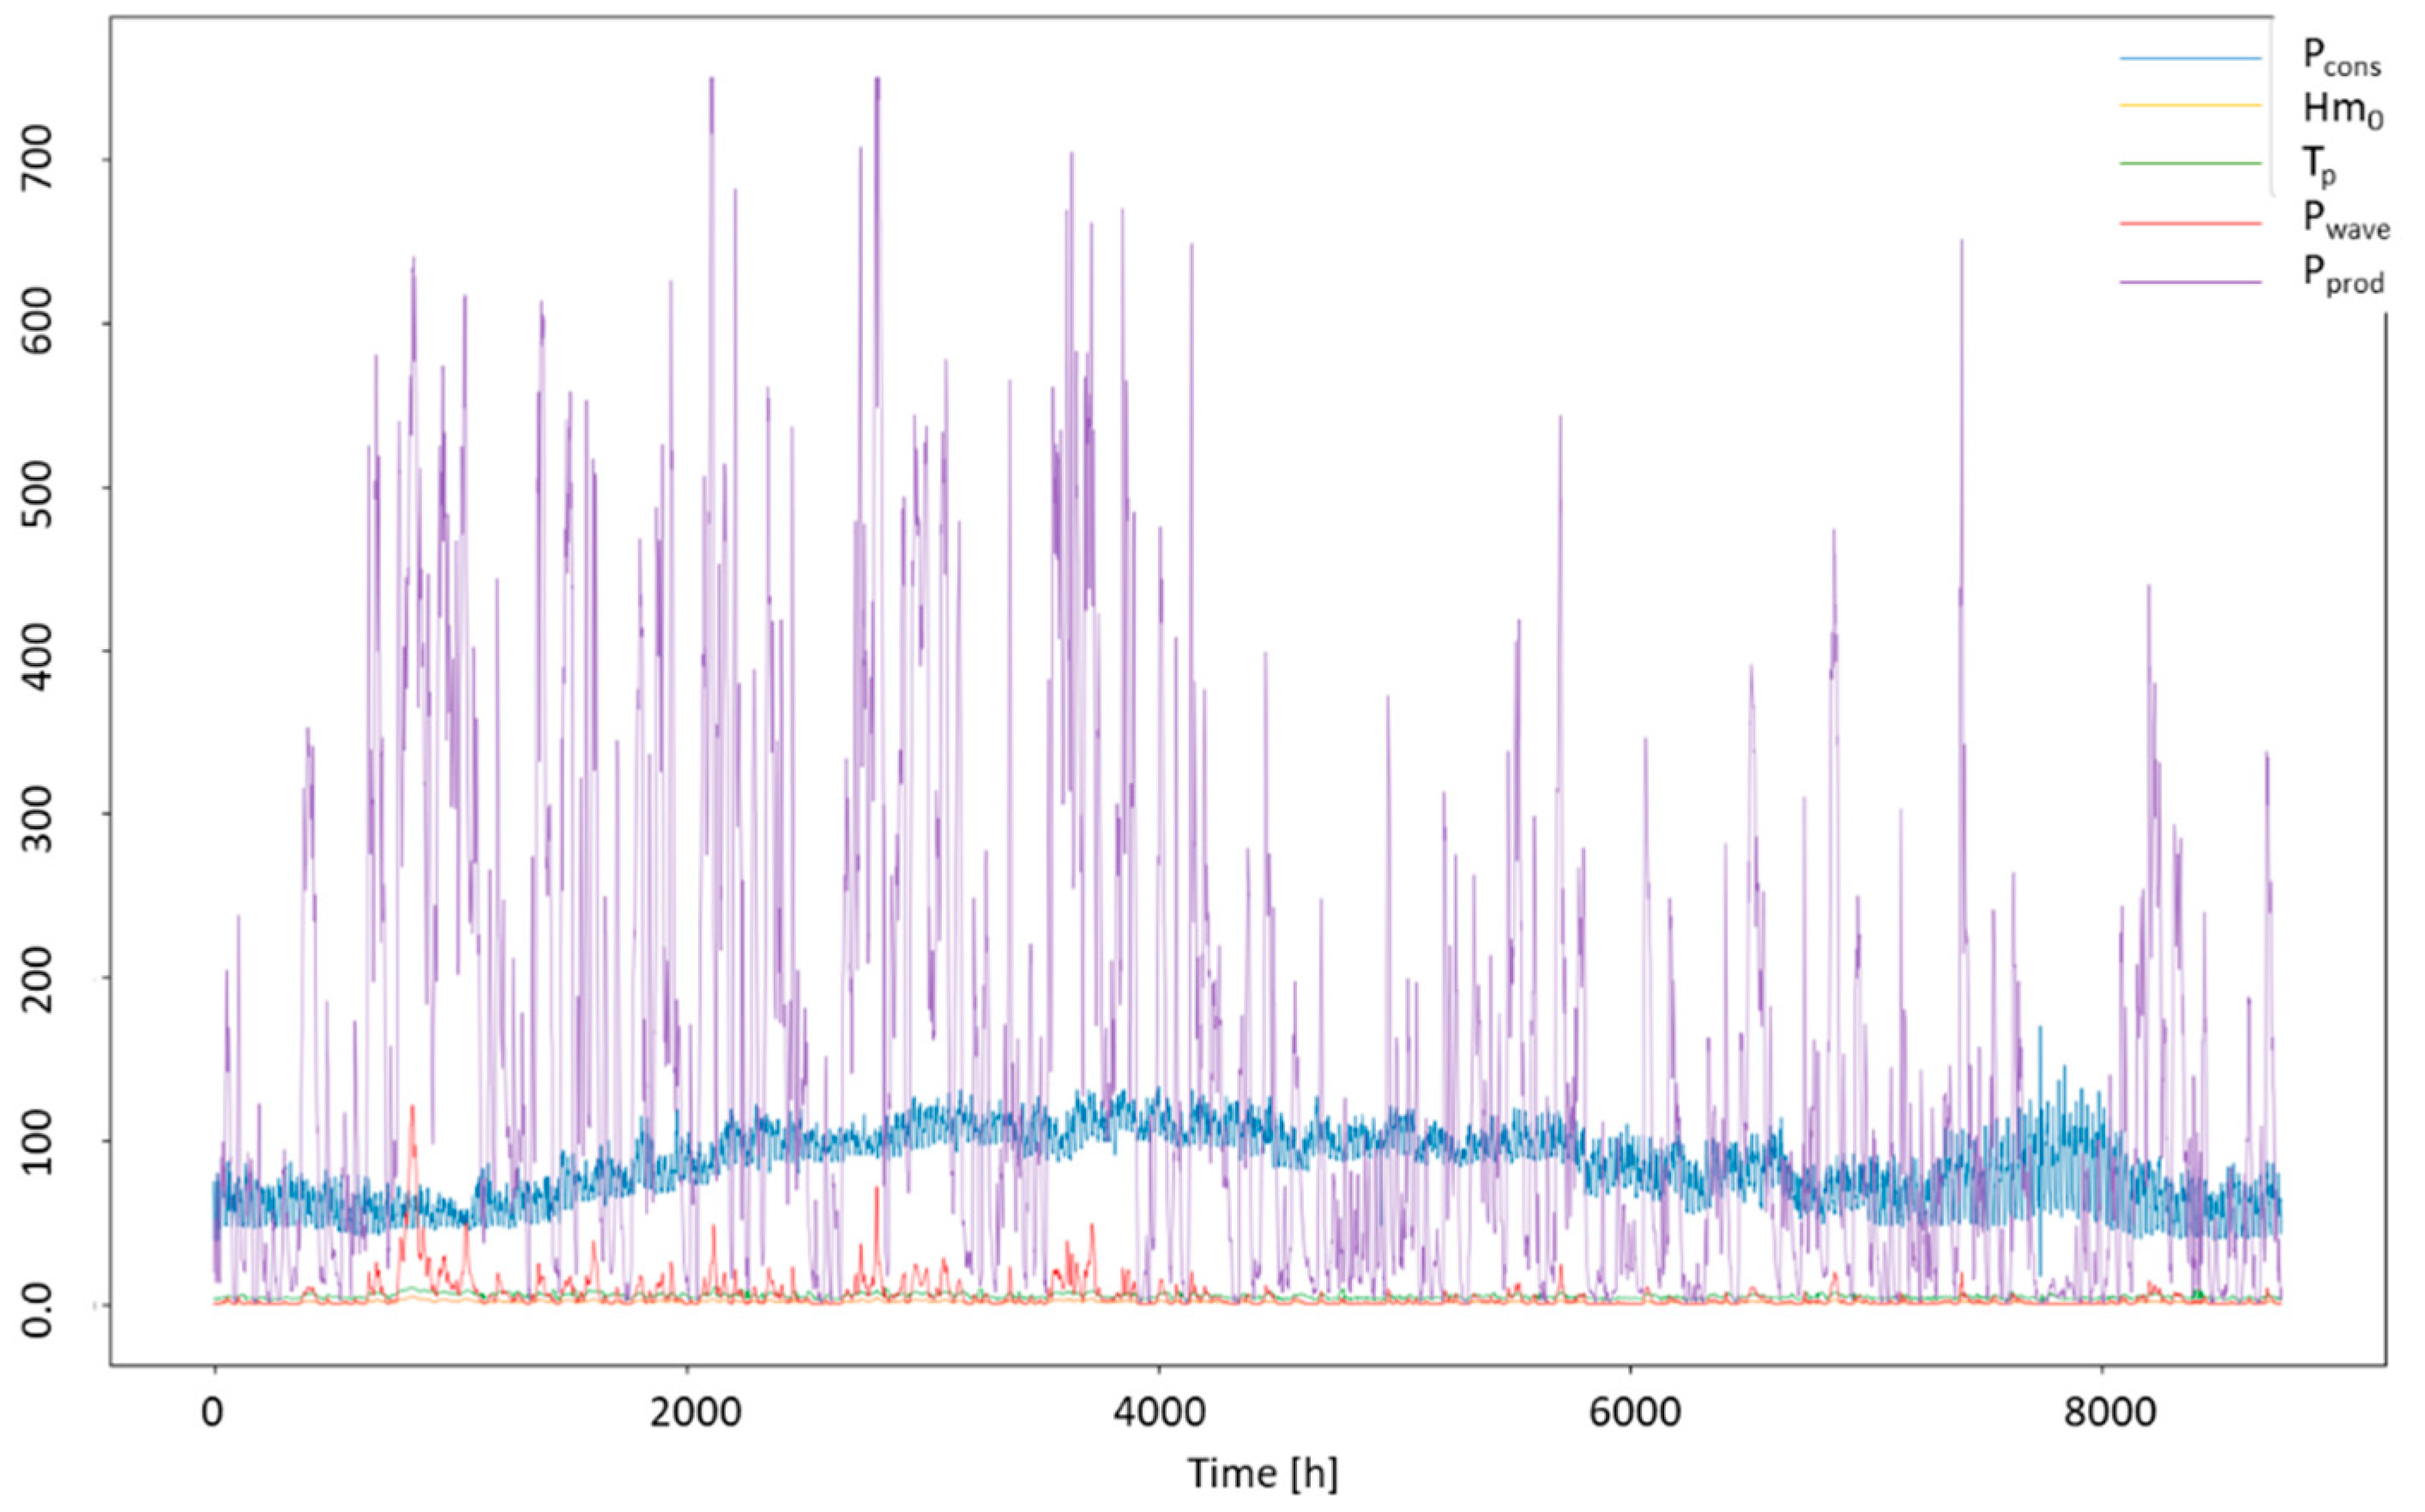
Figure 6 presents time series of the Power consumption, Power production and Power per meter of wave crest (P
cons, P
prod and P
wave) for the year 2016 (based on hourly data). On the
x-axis, the hours range from 1 September 2016 to 31 August 2017, where hour 1 is the 1st hour of the 1 September 2016. It can be seen that the highest P
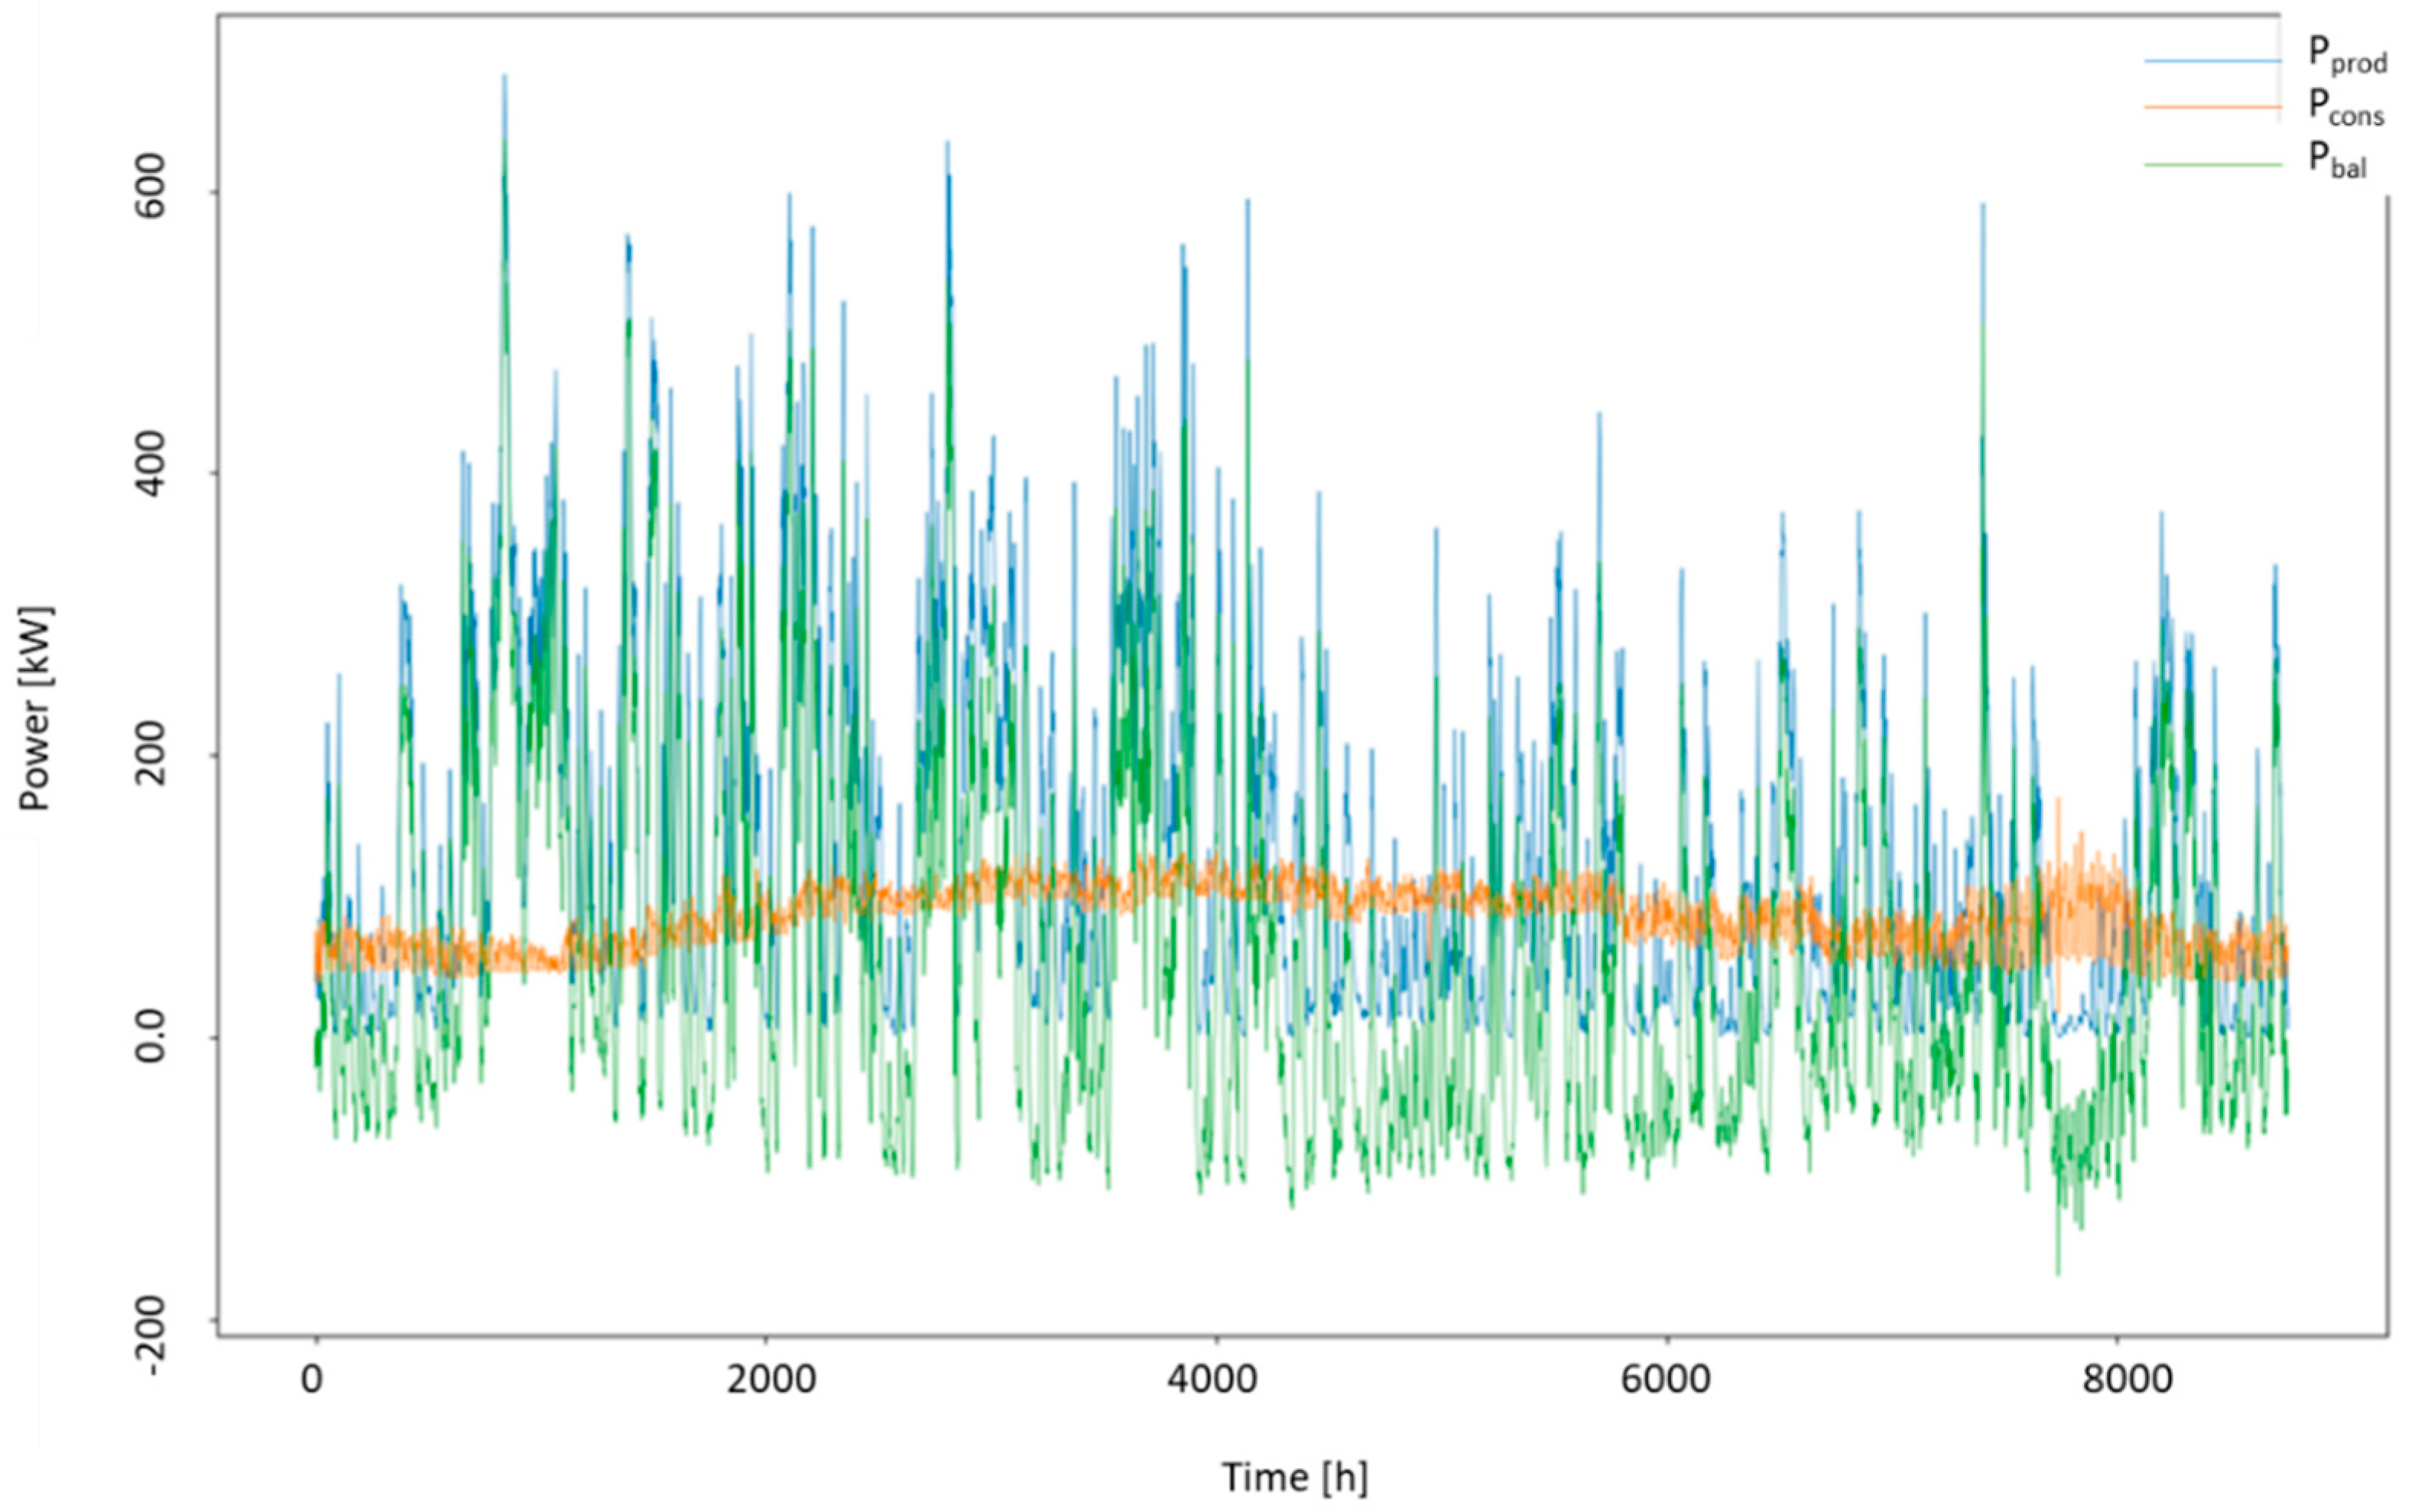
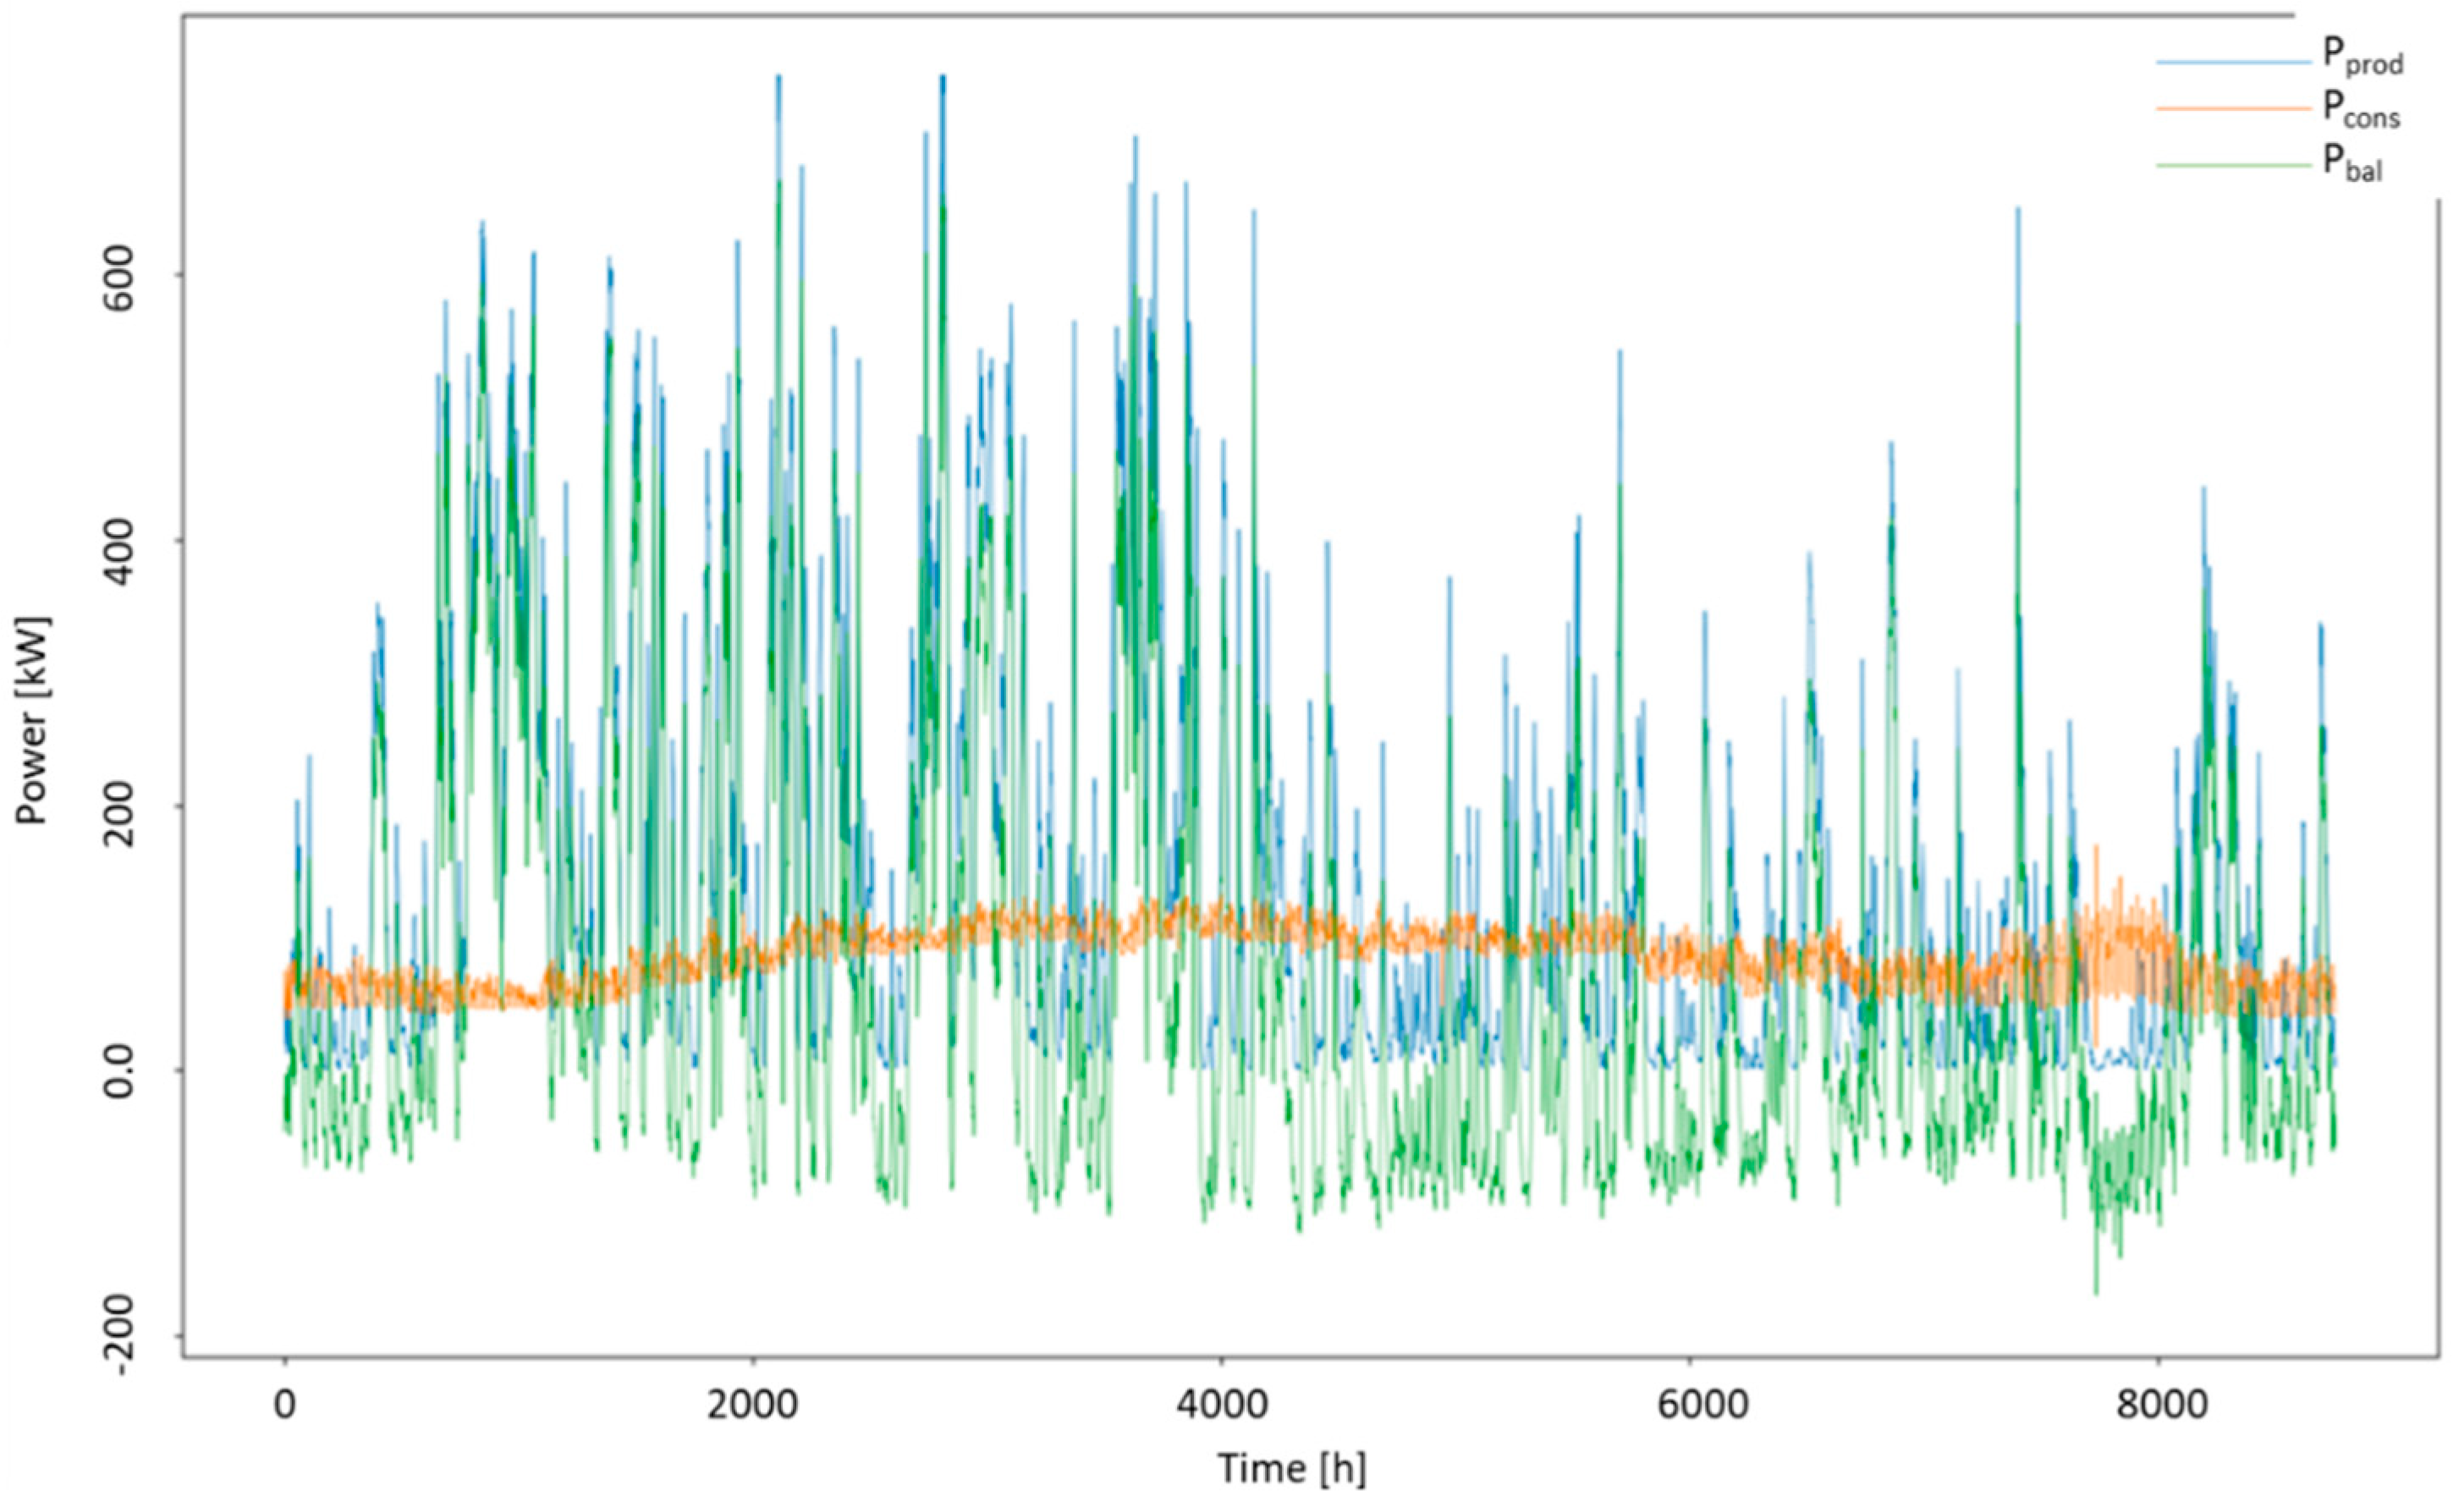
wave occurs during the first 6 months, which are the winter months from September to February. On the other hand, the power consumption on the island does not follow the same seasonal trend, as it has its highest peak in the summer months, particularly July, probably due to tourists visiting in this period. When analyzing the power balance, defined here as the power production–power consumption (
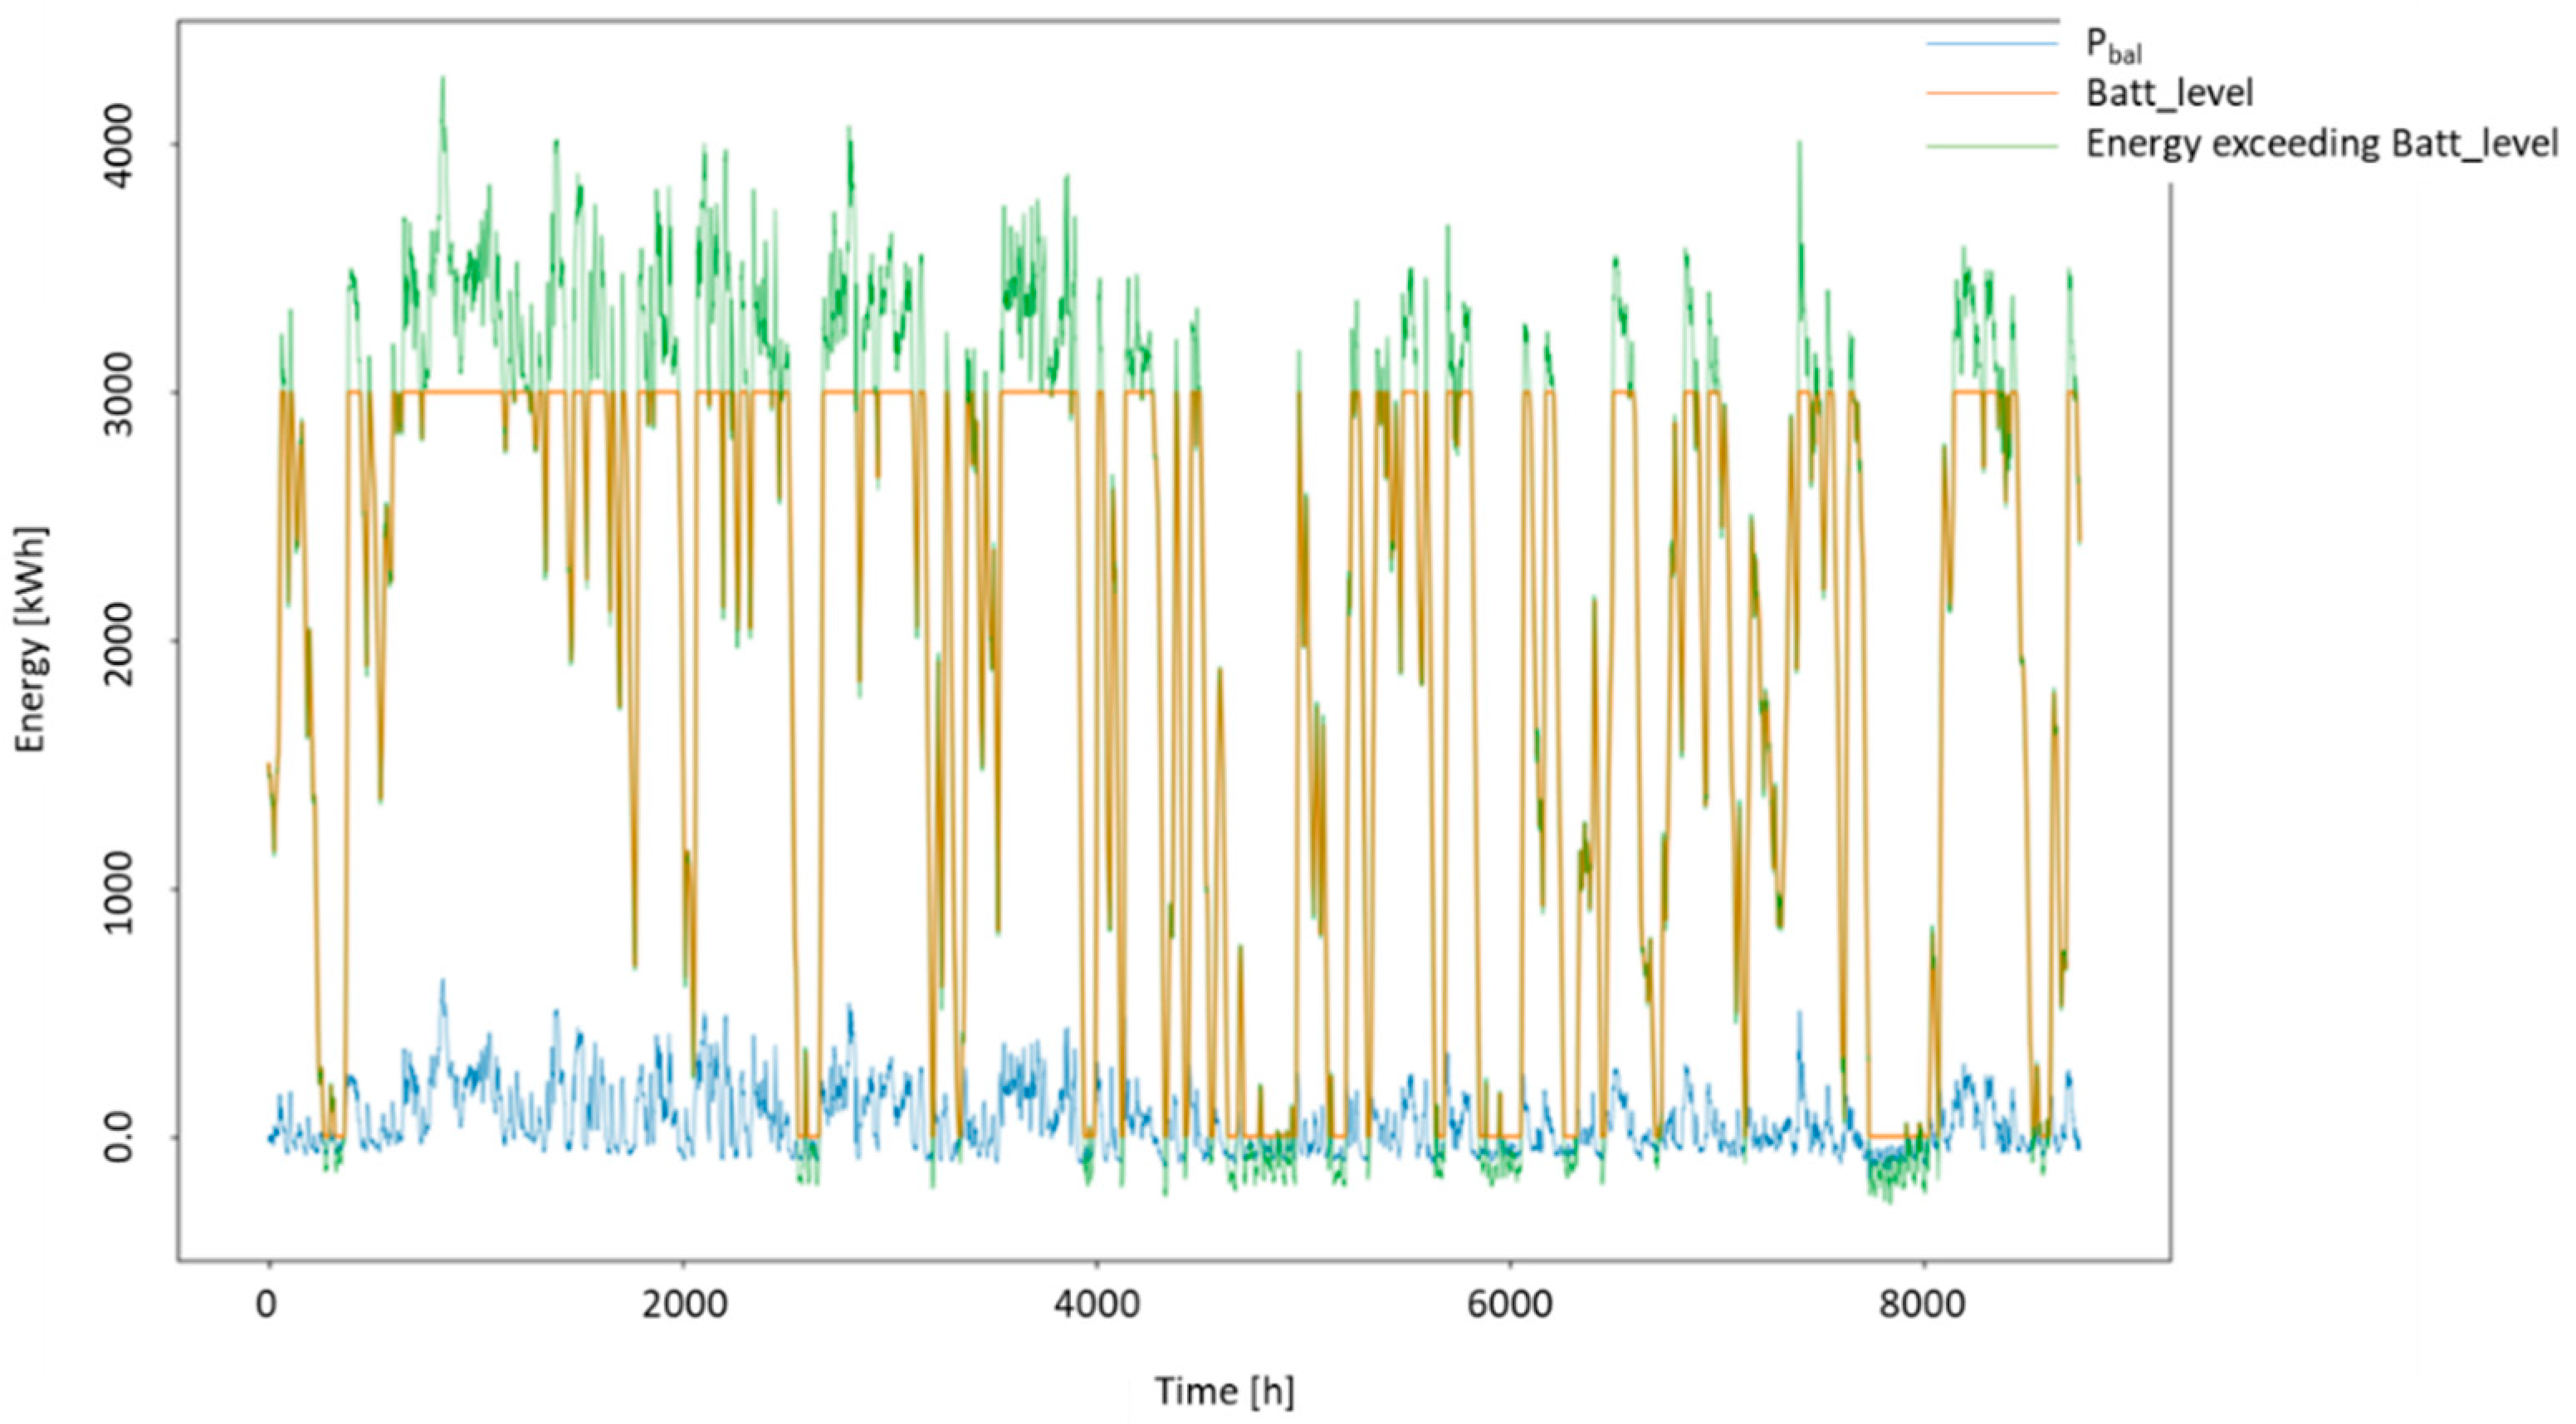
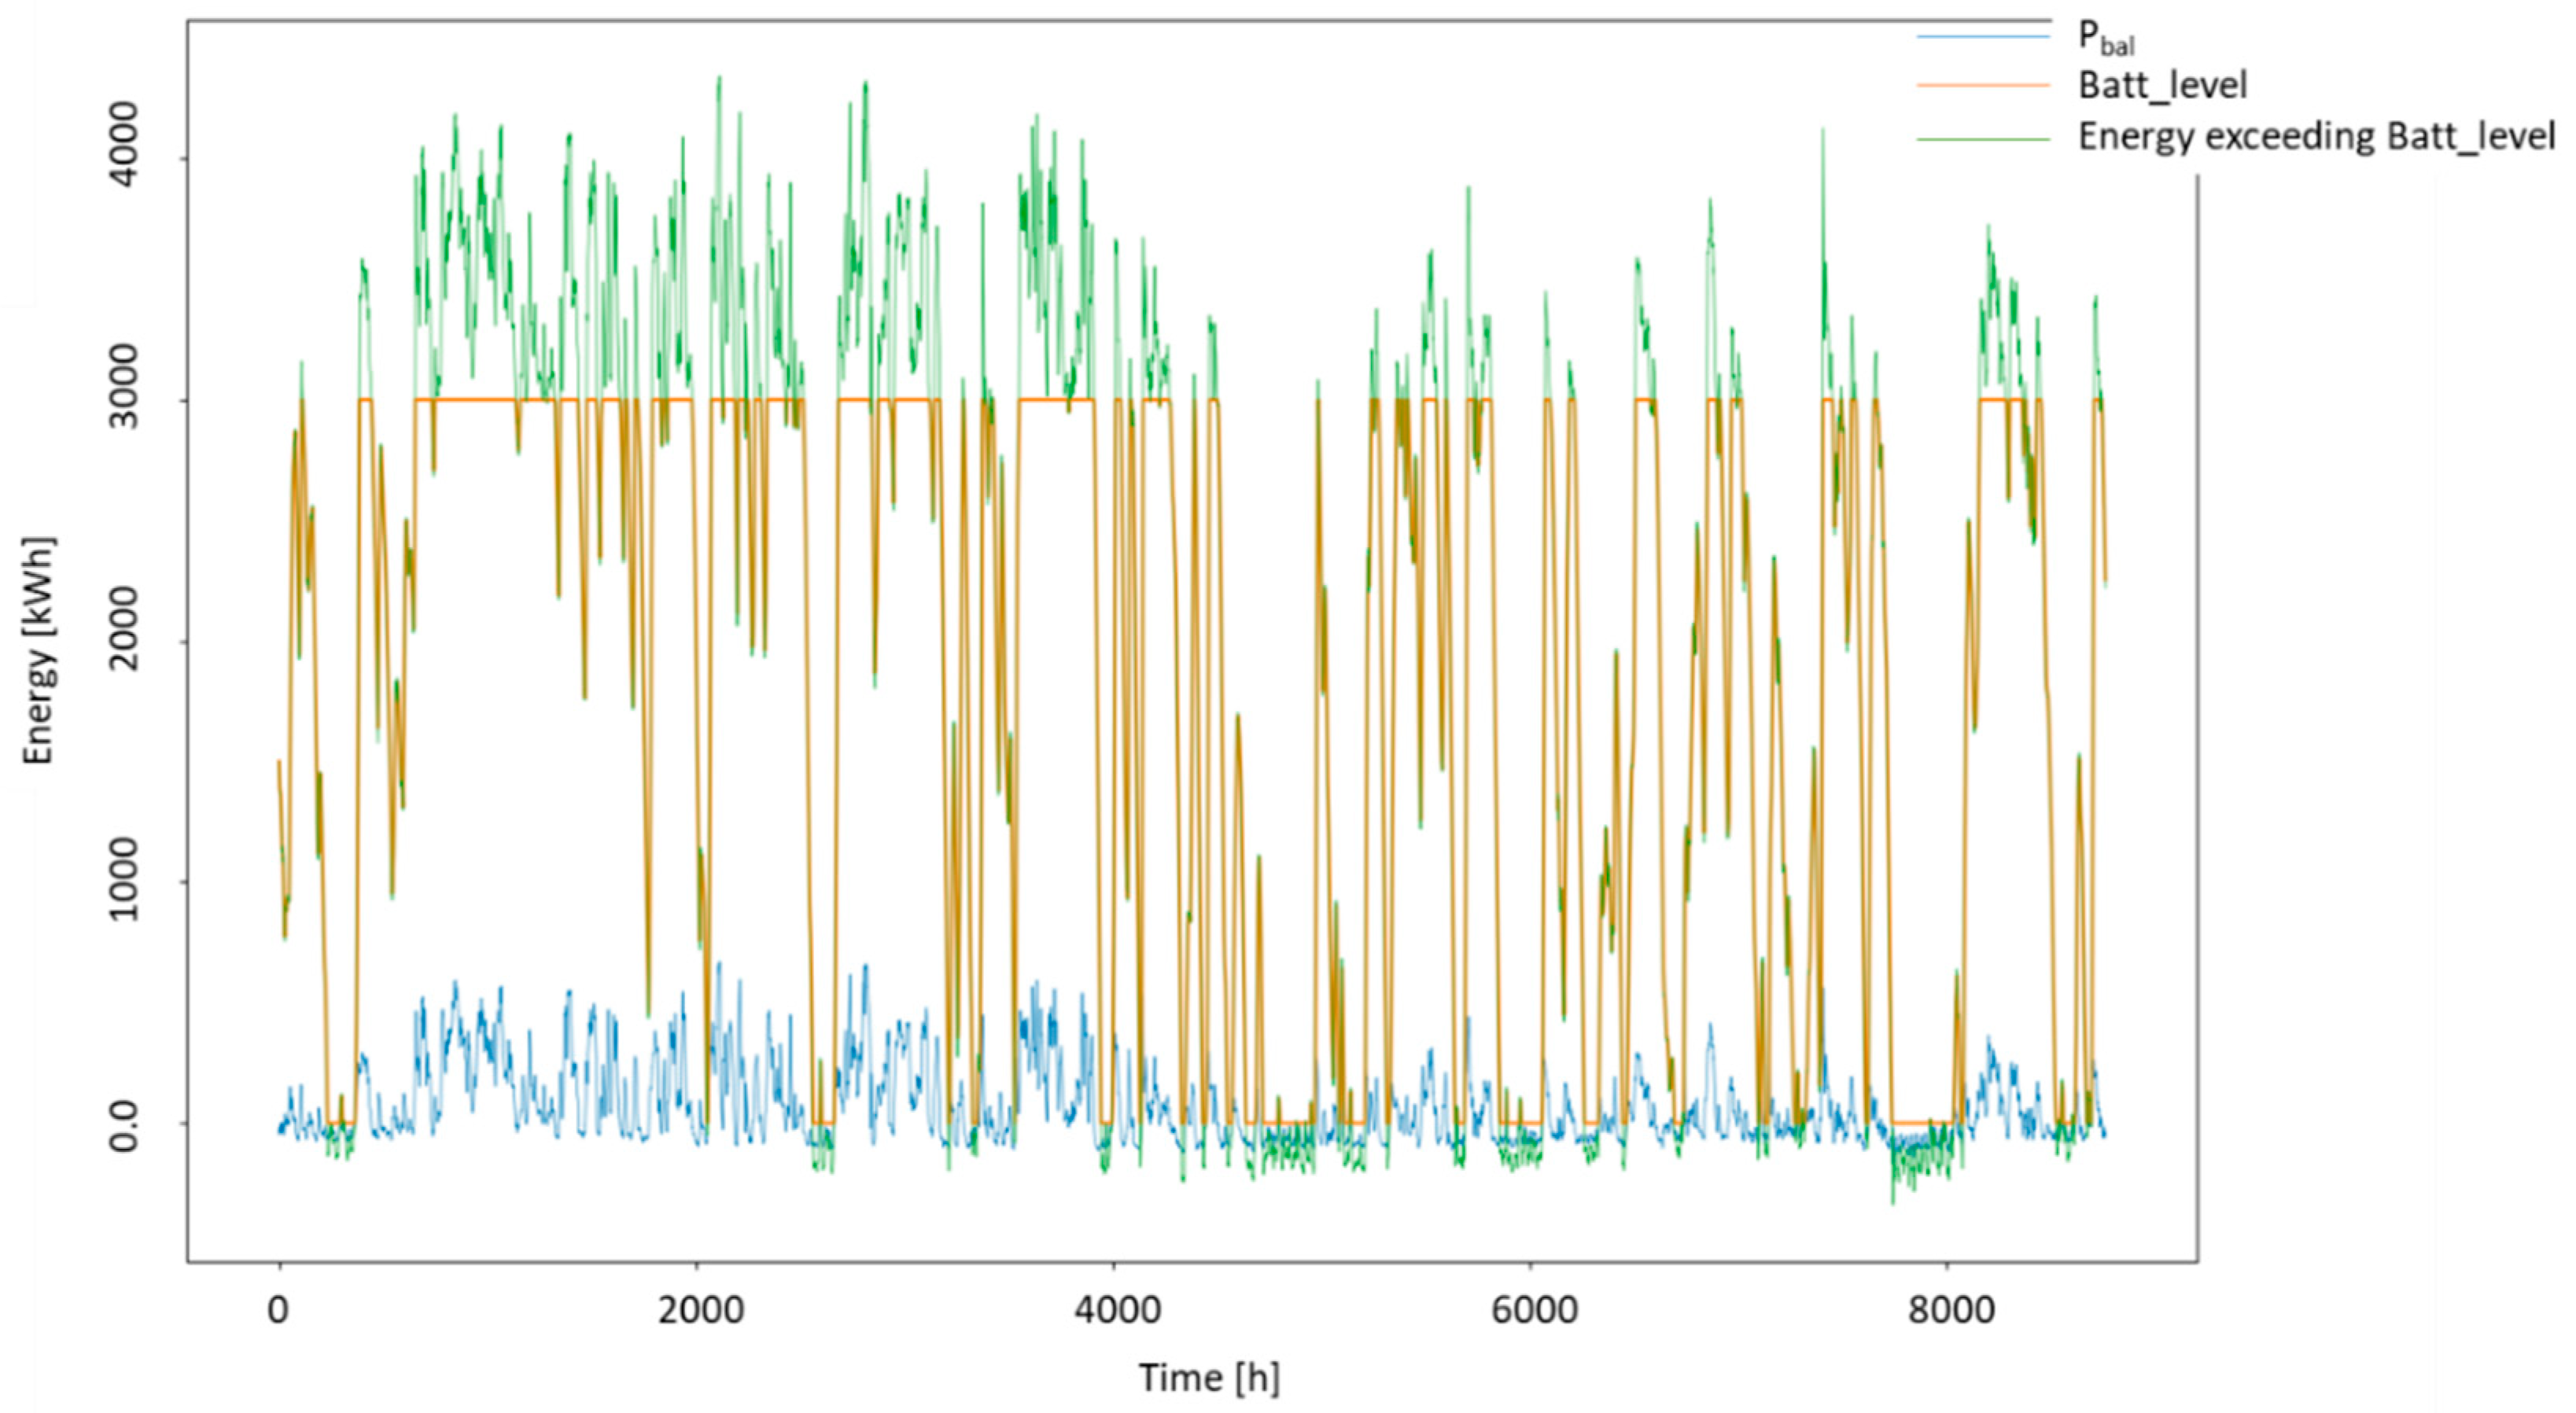
Figure 7), it can be seen that it is negative for long periods in the months of July (low wave energy resource and high power consumption), as well as in March. To handle this, batteries of 3 MWh and a backup generator system have been considered (
Figure 8). When the battery level goes above 3 MWh, the remaining power must be dissipated or not harvested (through PTO detuning), while for the energy below 0 kWh, the backup generator must be used.
The main results for the proposed system are presented in
Table 5. The average power production in the considered year is 157 kW, while the average consumption is 83.5 kW. The overall efficiency (wave to wire) of the Weptos is 13%. To these figures corresponds an electricity consumption of 731 MWh with a production of 1339 MWh; therefore, the electricity balance = electricity produced − electricity consumed, i.e., 608 MWh/y. With 3 MWh batteries, it is possible to store the electricity surplus for times when the resource is scarce. Nevertheless, the battery capacity is exceeded by 671 MWh, which is also the amount of energy not harvested (50.1%). The deficit in supply of 64 MWh/y needs to be provided by backup generators.
4.2. System with 2 Weptos Devices
While the most common wave periods at the location are around 4.5 s, most of the energy is around periods of 6.5 s. The efficiency of the machine can therefore be improved by having larger rotors that will perform better for longer periods. We consider that a rotor width of 3.96 m is suitable. With 10 rotors per side, the total active width of each side of the machine would result in roughly 39.6 m (79.2 m per WEC). Given the power consumption of the island, it was estimated that 2 Weptos WEC of the above characteristics would be necessary; each machine is equipped with 375 kW generator capacity. The efficiency of the machine is then expected to be maximal for wave periods equal to 3.5–4.0 s (
Figure 9). Comparing with
Figure 5, a shift to longer periods is seen, to better match the energy distribution of the site. The figures related to power consumption and production are here reported in
Figure 10,
Figure 11 and
Figure 12 and
Table 6. In terms of energy production, the 2 Weptos produce, on average, 148 kW, compared to 153 kW of the 4 WECs configuration in the previous section. Generally, only small variations are found; the most notable is probably that there is a larger need for supplementary energy production in the case with 2 WECs compared with the case with 4 WECs, namely 4.8% vs. 7.2%. These results are not completely unexpected, as we do have the same total installed capacity and load factors in the two cases.
5. Application
In the above, two different cases for deployment of Weptos WECs to cover the energy needs of the island have been presented: Case #1 utilizes 4 smaller Weptos WECs (individual rotor widths of 3.0 m), while Case #2 utilize 2 larger ones (individual rotor widths of 3.96 m).
At this preliminary stage, it is expected that the cost of the machines will be similar between the two cases. In terms of energy production, it was also shown that only small variations are found; the most notable is probably that there is a larger need for supplementary energy production in Case #2 compared to Case #1, namely 4.8% vs. 7.2%. However, on the other hand, only installing and operating 2 instead of 4 machines is expected to be simpler and cheaper, although having 4 machines provides more redundancy, and thereby, robustness, in case of failures and corresponding downtime of individual machines.
The Weptos mooring system is of the slack type and designed to allow >360° rotations. For Case #1 placed at a water depth of 30–40 m, it is expected that each machine will have a watch circle with a radius of roughly 200 m around the mooring point. For placing 4 machines, two different options are considered:
Placing the 4 machines on a straight line (placed in N–S). In this case, the machines will occupy a rectangle of roughly 400 × 1600 m (area 0.64 km2).
Placing the 4 machines in a staggered grid formation, i.e., in a diamond with a small angle of 60° (baseline placed in N–S). In this case, the machines will occupy a diamond shaped area with side lengths of rough 800 m (0.55 km2).
Comparing these two options, the first will give the least array/shadowing effects, while the second will result in lower cabling costs.
For Case #2, the watch circle will have a radius of roughly 250 m, and the obvious layout will simply be putting the two machines in a straight line (placed N–S). In this case the machines will occupy a rectangle of roughly 500 × 1000 m (0.5 m2).
Comparing case #1 and #2, it can be seen that #2 is favorable in terms of area usage and cabling lengths.
In this study, losses in the generators, inverters and transmission have been neglected. However, overall losses in generators and inverters are expected to be less than 10%. Also, no array effects have been considered, as these are expected to be minimal for reasonable array layouts. Regarding the installation, operation and maintenance (O&M) of the machines, the following could be considered. Installation on site would be done in two phases: first, the mooring system (anchor, tether, buoy and hawser), including grid connection, would be deployed probably using a barge and a floating crane, and second, the machine itself would be floated to the site and attached to the mooring system. The attachment to the mooring system is designed for ease of connection, meaning hook-on/hook-off operations should be feasible at sea without specialized vessels. i.e., a standard tug should be sufficient for installation and O&M operations, where it is needed to take the machines to port. However, most O&M operations are expected to be carried out on site using a smaller vessel (e.g., a pilot boat, large Rigid-hulled inflatable boat or some other work boat), and the WEC is accessible by boat, even in more severe weather conditions, as the berthing onto the machine (inside the V shape) is protected by the wave absorbing rotors. Thus, it is only expected that it will be necessary to take the machine to port in case of unforeseen needs for repairs. An estimate for needed O&M, once the machines have been properly commissioned, could comprise yearly inspections and repairs on site, and the need to tow it to port once every 10 years.
6. Discussion
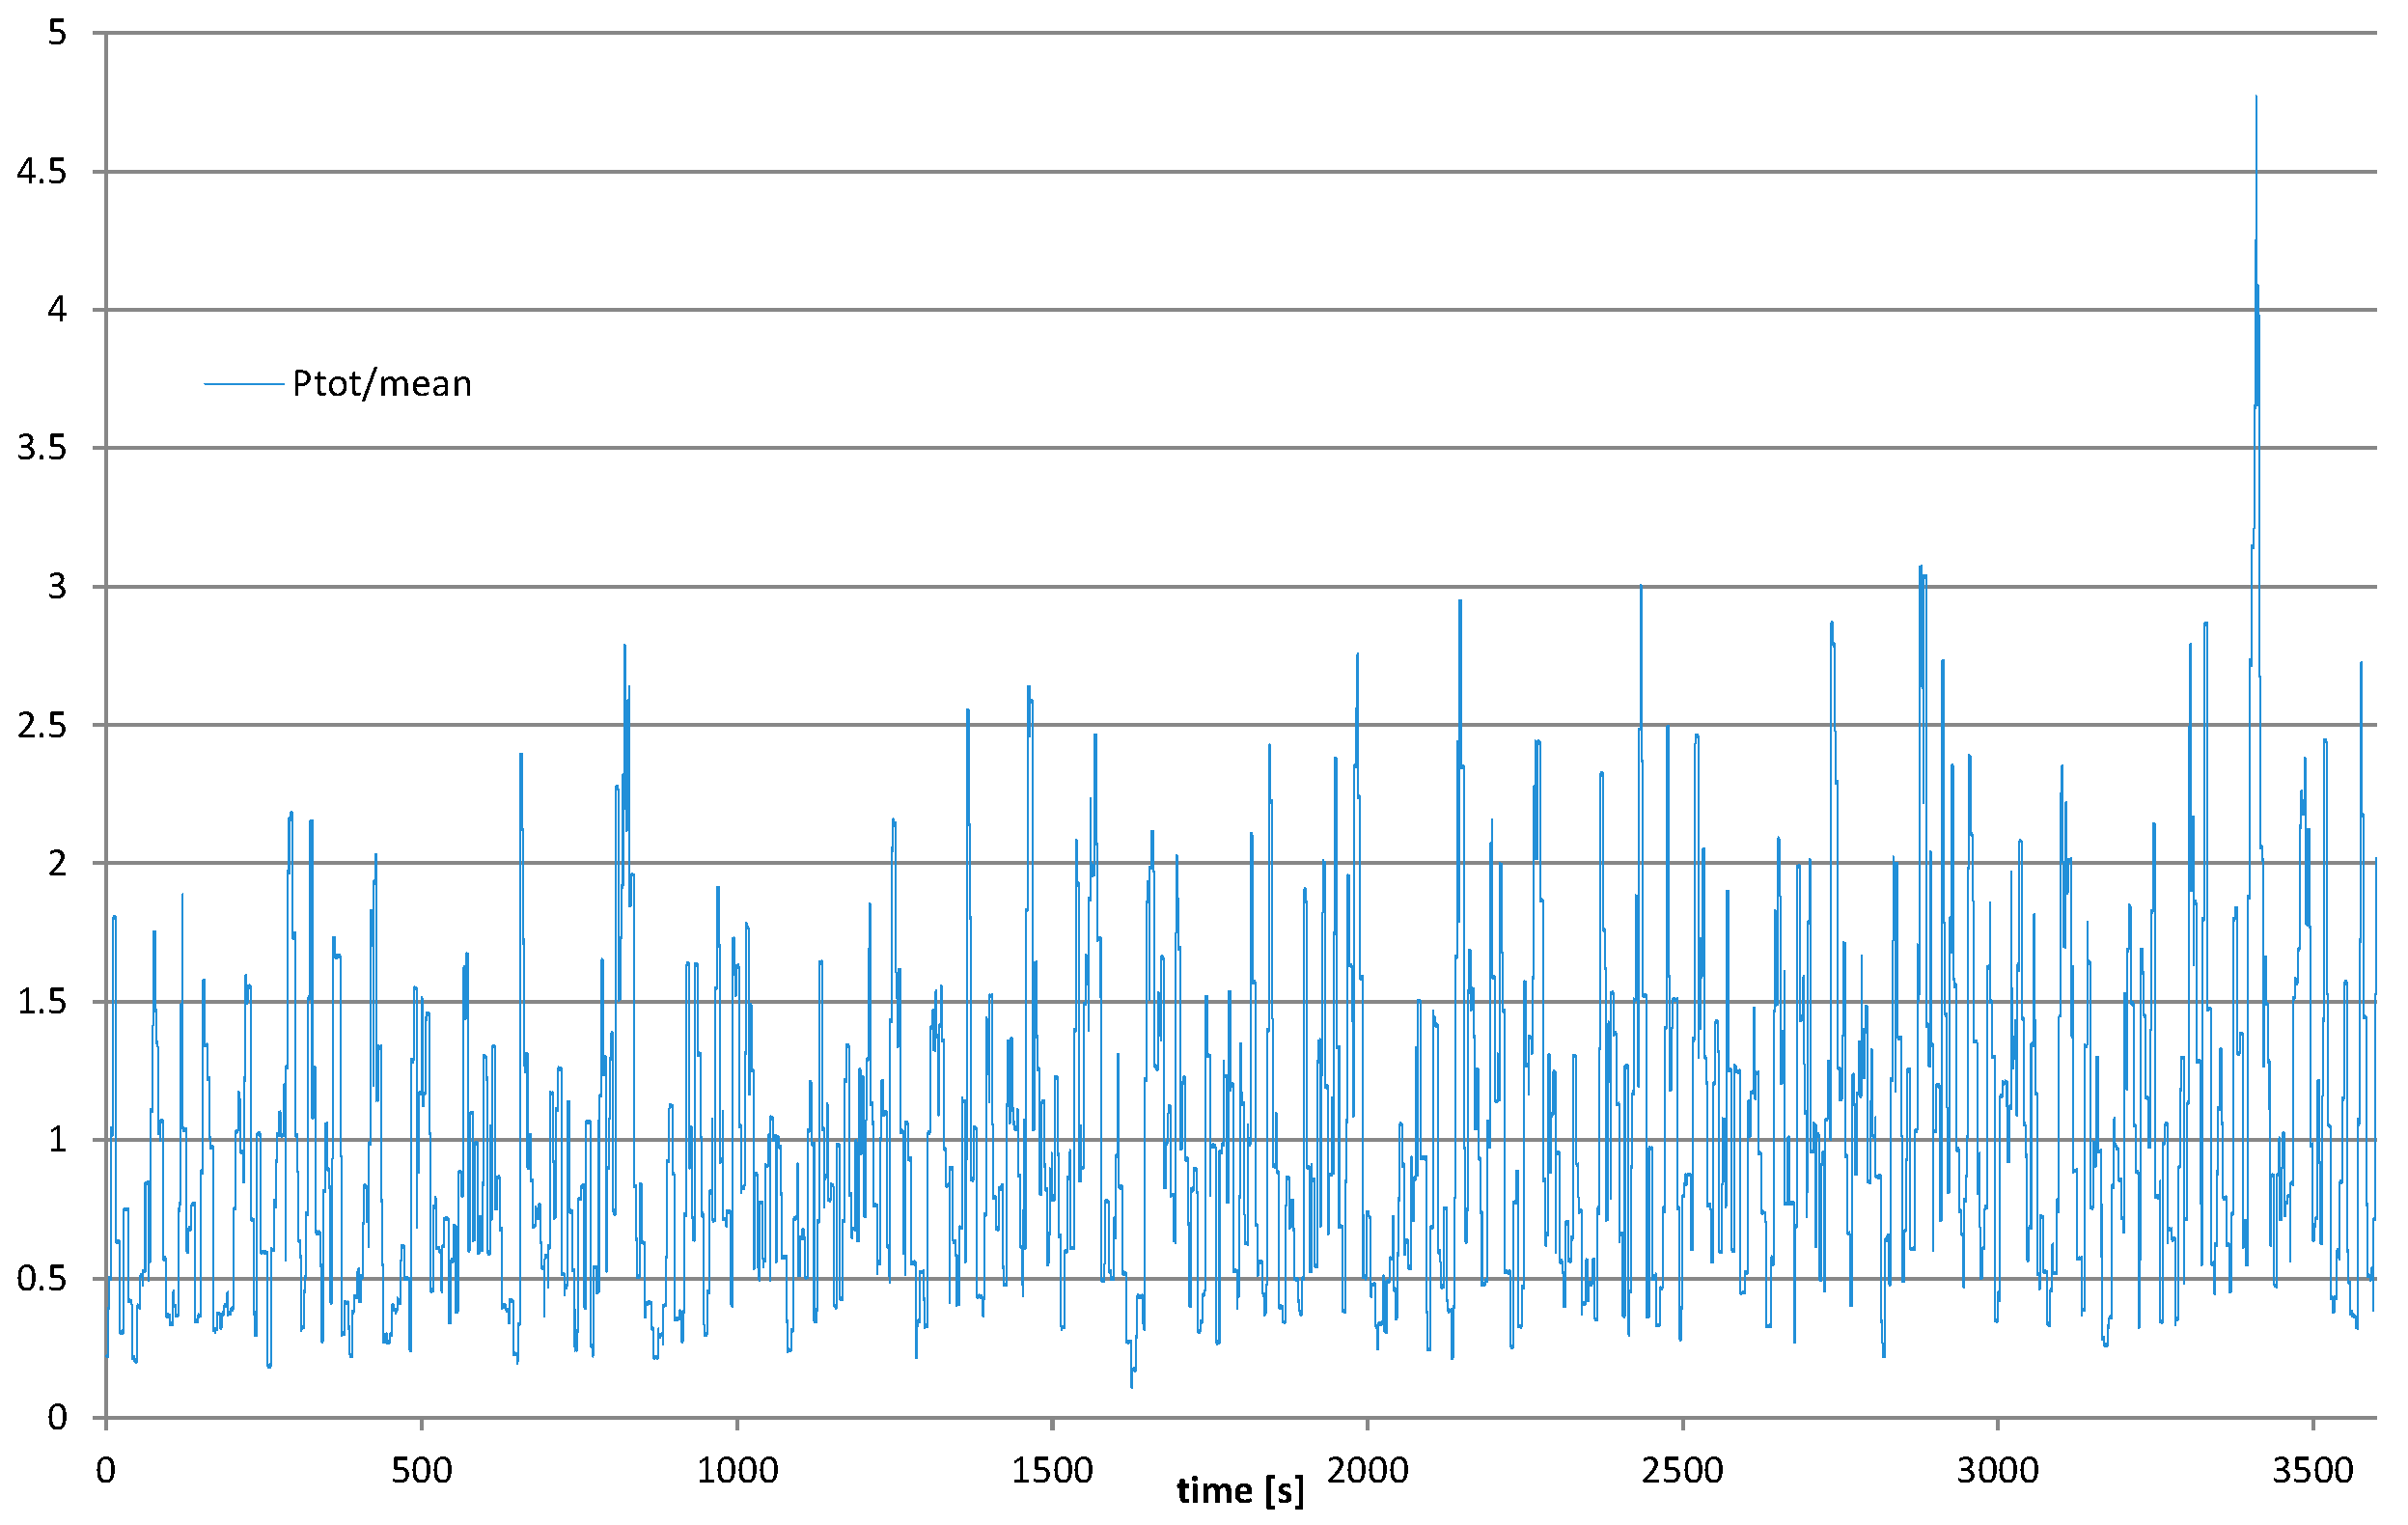
The study wants to make a contribution to the investigation of the performance of wave energy systems on an hourly basis based on the energy demands of a small island. For this reason, a detailed analysis of the resource is presented, while the consumption was provided on an hourly basis by the Utilities. The wave data includes a “short” record (1 September 2016 to 31 August 2017) of hourly wave data measurements that have been directly compared to consumption and a long, less precise wave data record, obtained by hourly wind measurements (1 January 1979–31 December 2016) that has been used for the estimations on annual variability of the resource only. Additionally, in the analysis of the previous sections, only the power variation in terms of one-hour averages has been considered. However, power fluctuations within a sea state of one-hour duration must be anticipated. Below, the expected level of fluctuations are illustrated in
Figure 13 in terms of normalized instantaneous power (average values of power from a single machine over 2–3 s) as a function of time.
The data is normalized by the mean power over the considered duration. The coefficient of variation (standard deviation divided by mean) is here 58%. The max-to-mean ratio is 4.8, but this value is heavily dominated by a single instance. Generally, the max-to-mean ratio is in the order of 3, and discarding (power shaving) peaks above this level will have hardly any influence on the mean power. In the more energetic power production conditions, i.e., where 3 times the one-hour average exceeds the installed capacity of the machine, a decrease in production compared to the power production data given in previous sections is to be expected. However, as these conditions typically occur where excess power is produced, the net result on yearly average power production is expected to be minimal. Furthermore, the fluctuations within a one-hour period are expected to be absorbed and smoothed by the battery storage system.
Ideally, the final design should take into account all the power fluctuations mentioned above, as they influence differently the system components.
7. Conclusions
All in all, a few different configurations and layouts for a wave energy-based solution to supply the Island with primarily renewable energy has been provided. It has been demonstrated that for a selected full year (1 September 2016 to 31 August 2017), Weptos machines with a total installed generator capacity of 750 kW (distributed on 2 to 4 machines) and a load factor of 0.20, supplemented by a 3 MWh battery storage and a backup generator (e.g., biodiesel or fuel cell based) can supply the demand on an hour-by-hour basis. The suggested configurations have been based on coarse optimizations based on the rough capital expenditure (CAPEX) estimates of the individual elements of the solution.
In fact, the Weptos WECs can deliver in excess of 50% more energy than what is demanded over the year. However, due to the misalignment of demand and supply, this is not sufficient to cover all instances, and a backup generator is needed to supply 5–7% of the demand, covering the cases where there are too few waves and the battery storage has already been depleted. This backup generator can use traditional combustion, but it is considered appealing to use e.g., a fuel cell solution instead, where (parts of) the excess energy production from the Weptos WECs could be used for hydrogen production. Even though the round trip efficiency (electricity–hydrogen–electricity) is rather low (probably around 50%), the excess energy production should be sufficient (by far) to cover the deficit. However, the economics of such a solution has not been considered here.
The suggested cases will occupy an area of 0.5–0.64 km2 (depending on the specific choice of layout) at circa 40 m of water depth at a location roughly 2.5 km NNE of the island.
Some considerations regarding both the year-by-year, as well as intra-hour, variations in power have been given. While the intra-hour variations are not expected to impact the feasibility of the solution in a significant way, year-by-year variation can potentially have a very significant impact. It is strongly recommended that a more detailed analysis be done, covering a longer time period than one year, should the wave energy based scenario be selected for further investigations. It is also noted that only very coarse cost estimates, neglecting cabling, installation, operation, maintenance and decommissioning, have been used in this preliminary analysis. It is recommended that a much more thorough cost analysis, and additional optimization loops, mush be carried out before final design. Nevertheless, it can be concluded that the suggested solutions using Weptos WECs in a wave energy-based solution for a renewable energy supply for this island is indeed feasible.


