1. Introduction
The level of research carried out in recent decades regarding the use of biodiesel in engines has been intense. One unique aspect of biodiesels (and their parent oils/fats) is the fact that they are produced from a variety of vegetable or animal feedstock [
1,
2,
3,
4,
5]. These possess different compositional structures in the form of fatty acids (FA), as summarized in
Table 1 for the most influential ones. Past research has shown that a relatively high degree of variability is observed regarding the structural form of common biodiesels depending on the originating oil [
6]. Since the composition of each oil/fat in the fatty acids varies, the physical and chemical properties of biodiesel differ too. Perhaps the most prominent example here is the cetane number (cold-flow properties as well) [
3,
5,
7].
The dimensionless cetane number is one of the most influential fuel properties. It is highly responsible for ignition delay; thus it determines, to a large extent, the proportion between premixed and diffusion combustion in a diesel engine [
8]. In this regard, it affects the heat release profile and is also responsible for the emission of pollutants and combustion noise [
3,
5,
9,
10,
11,
12,
13]. In light of the above, it is not surprising that the CN has been widely researched and reported in the literature, with the published values differing quite a lot.
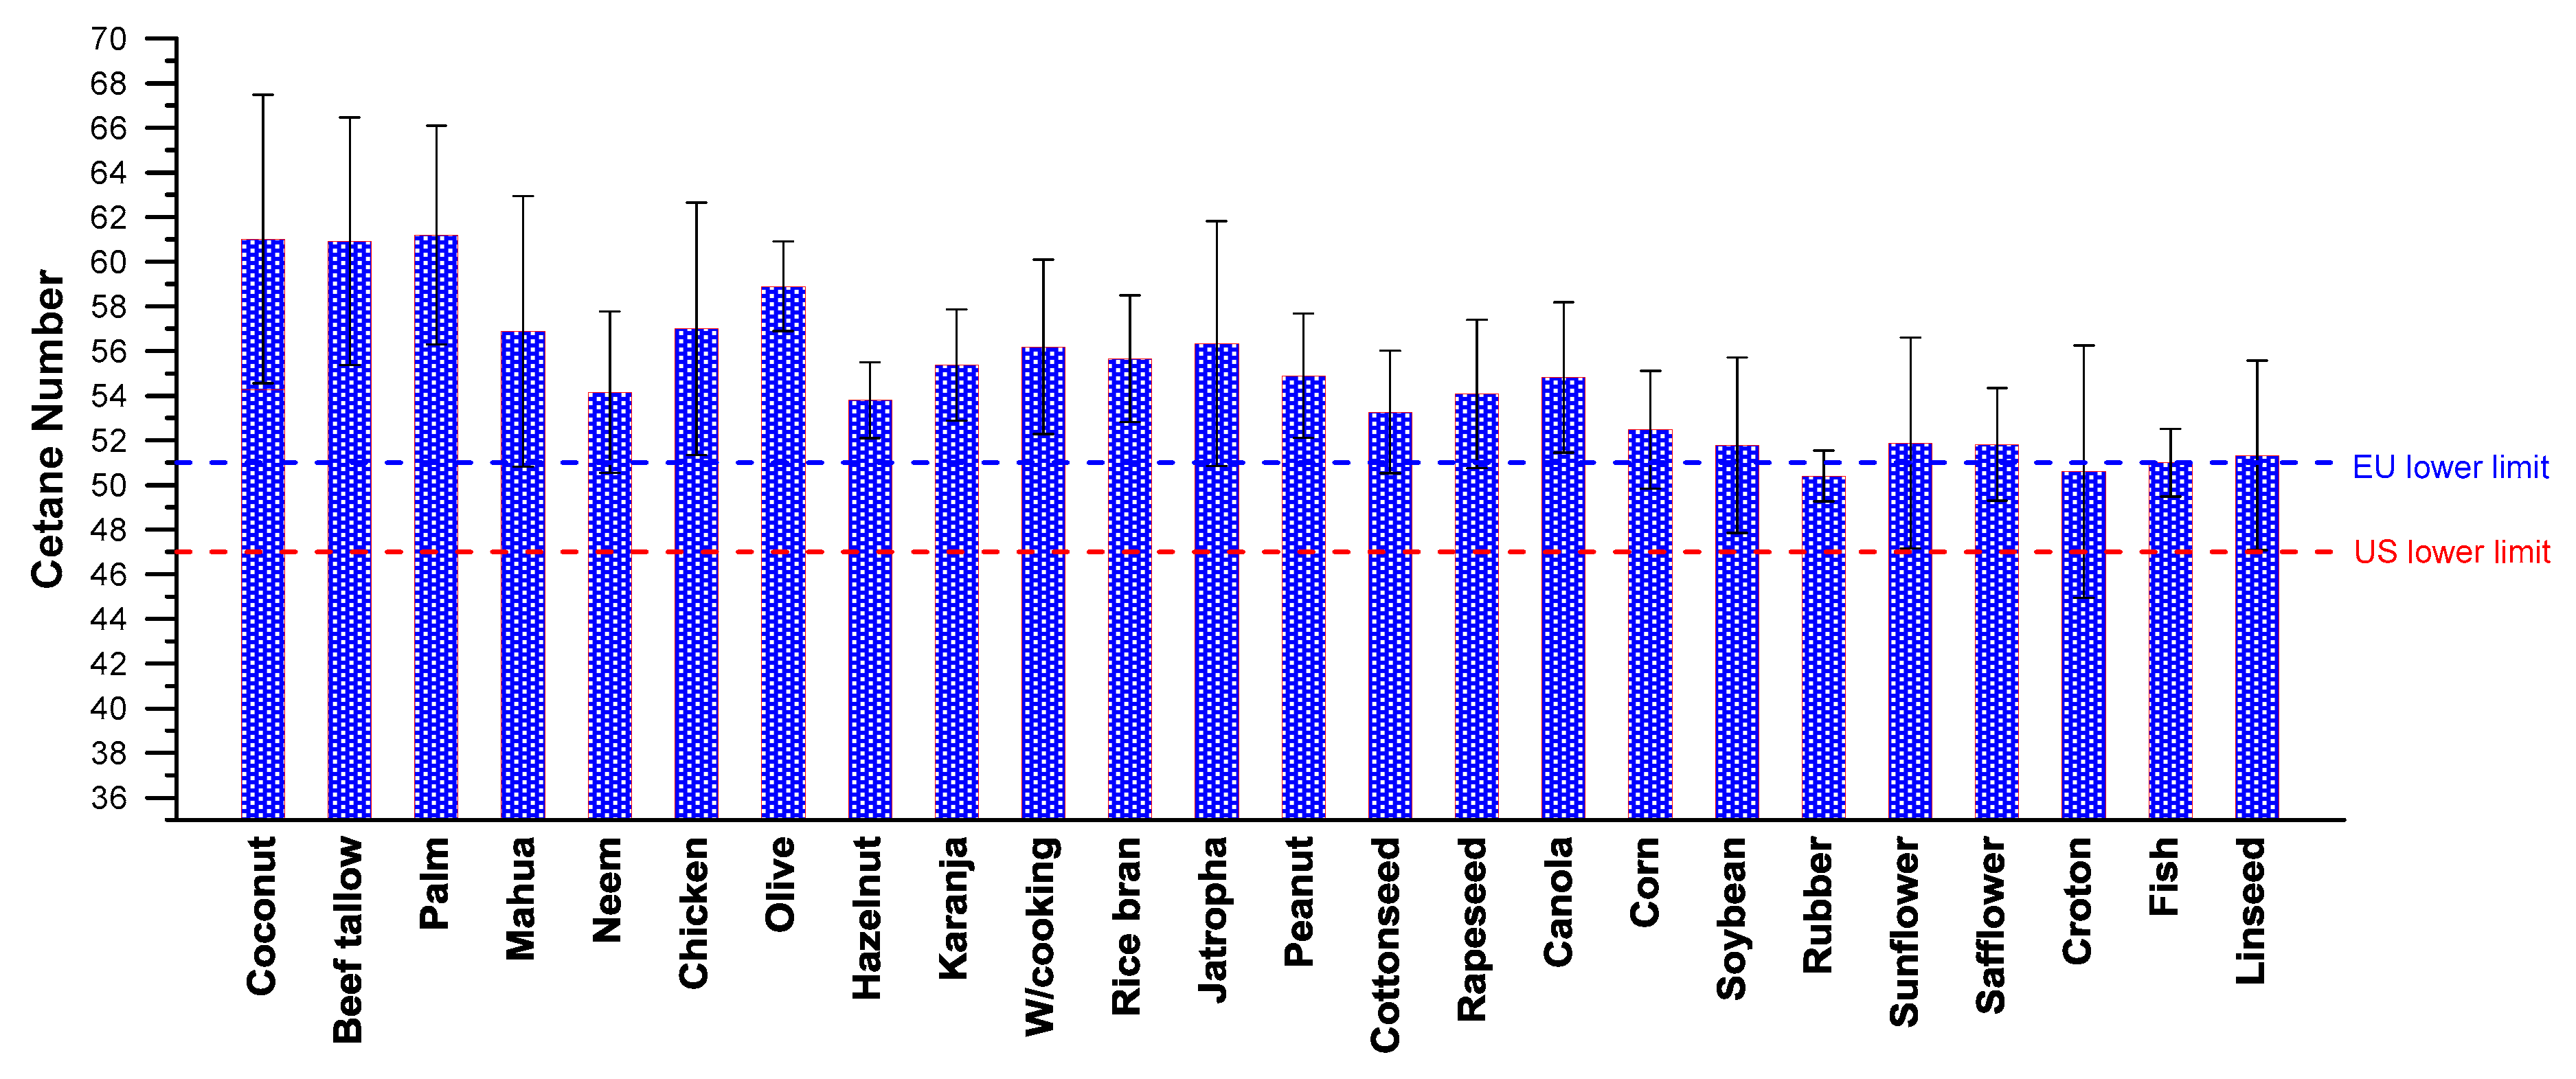
Figure 1 is helpful here, illustrating the large variability in the reported CN values [
6]. These values (average for each feedstock) range from lower than that of the respective automotive diesel fuel up to much higher. As discussed earlier, this variability in the measured CN values can be, at least in part, attributed to the different fatty acid methyl ester (FAME) composition, with computational and experimental errors and uncertainties playing a non-negligible role too. To make things even worse, sometimes large variations have been reported in the literature, even when biodiesels from the same originating feedstock have been studied. This is reflected in the sometimes large standard deviation of the collected data, as depicted in
Figure 2. Knothe [
10] argued that one major factor affecting the variability of the results is the fact that CN is actually a ‘lumped’ quantity that expresses various phenomena such as spray formation, vaporization, mixing etc.
Owing to its significance in engine performance and emissions, as well as to the fact that its experimental determination is time consuming, costly and scientifically challenging, it is not surprising that several CN predictive models have been developed in the past. Biodiesel CN has been correlated in these models with various other metrics or properties. Klopfenstein [
14] reported one of the earliest correlations with respect to the number of carbon atoms and the number of double bonds. Similarly, Ramirez-Verduzco et al. [
15] correlated CN with the molecular weight and the number of double bonds, and Pinzi et al. [
16] with the degree of unsaturation and chain length. A quadratic correlation with the number of carbon atoms in the original fatty acid and the number of double bonds was statistically selected as the most suitable by Lapuerta et al. [
17].
Other researchers preferred correlations of the CN directly with the fatty acid composition (without intermediate metrics such as the degree of unsaturation or the chain length). Bamgboye and Hansen [
18] reported the first correlation of this kind with respect to the FA composition applying multiple linear regression analysis (MLR). Piloto-Rodriguez et al. [
19] applied both MLR and artificial neural networks (ANN). The latter approach was the one followed by Ramadhas et al. [
20], while the former (MLR) was chosen by Gopinath et al. [
21] as well as by the present research group [
22].
One common feature in all these models is the fact that at the time each one was introduced, it was claimed to be superior over the previous ones with regards to its predictive capability and the associated relative errors in its predictions. It seems reasonable, and at the same time interesting for the scientific community, to try and evaluate all models on an objective basis and identify the truly exceptional ones. Please note that for the comparative evaluation, only models based solely on the FA composition (directly, or indirectly through the degree of unsaturation or the chain length) are taken into account, and only for methyl esters (ethyl/propyl/butyl esters are not included in the analysis). This means that models that correlate CN with other physical or chemical properties such as saponification value or density (e.g., [
11,
21,
23,
24]) will not be considered. For the latter category of models, which is equally wide, Refs. [
21,
23] are a good starting point for a review of the available literature and corresponding equations. In the same regard, models based on artificial neural networks are not considered either, as the respective “algorithms” are obviously not available.
The paper is organized as follows:
Section 2 will provide some fundamentals on the CN and its measuring procedure.
Section 3 will review and discuss the predictive models for biodiesel CN based on the FA composition that are used in the comparative analysis. Then, in
Section 4, which is the core of this work, a detailed comparison of all models will be performed to assess their predictive capability, identify trends and inefficiencies and reach some interesting overall conclusions.
2. Cetane Number Fundamentals
The cetane number of a fuel (typical values between 35 and 65) is an indicator of its ignition and combustion quality. Its name derives from cetane or n-hexadecane (C
16H
34), which is a straight (without branching) saturated hydrocarbon. The cetane’s ease of ignition is very high; hence, it has been assigned a CN of 100. On the other hand, α-methylnaphthalene or AMN (C
11H
10, a polycyclic aromatic hydrocarbon) was assigned a CN of 0, owing to its poor auto-ignition quality. Because of storage stability and availability issues with AMN, the reference fuel for the lower end of the cetane number scale was changed in 1962 to 2,2,4,4,6,8,8-heptamethylnonane (HMN) (also hexadecane C
16H
34, yet highly branched), which was assigned a CN of 15 [
10,
25].
The cetane number of a fuel is influenced by its physical and chemical characteristics. Physical attributes in particular, such as density, viscosity and surface tension, affect the time needed for the fuel to vaporize and mix with the surrounding air. The CN also depends on the molecular structure of its constituent hydrocarbons. In general, and as past research has established [
10,
11,
12,
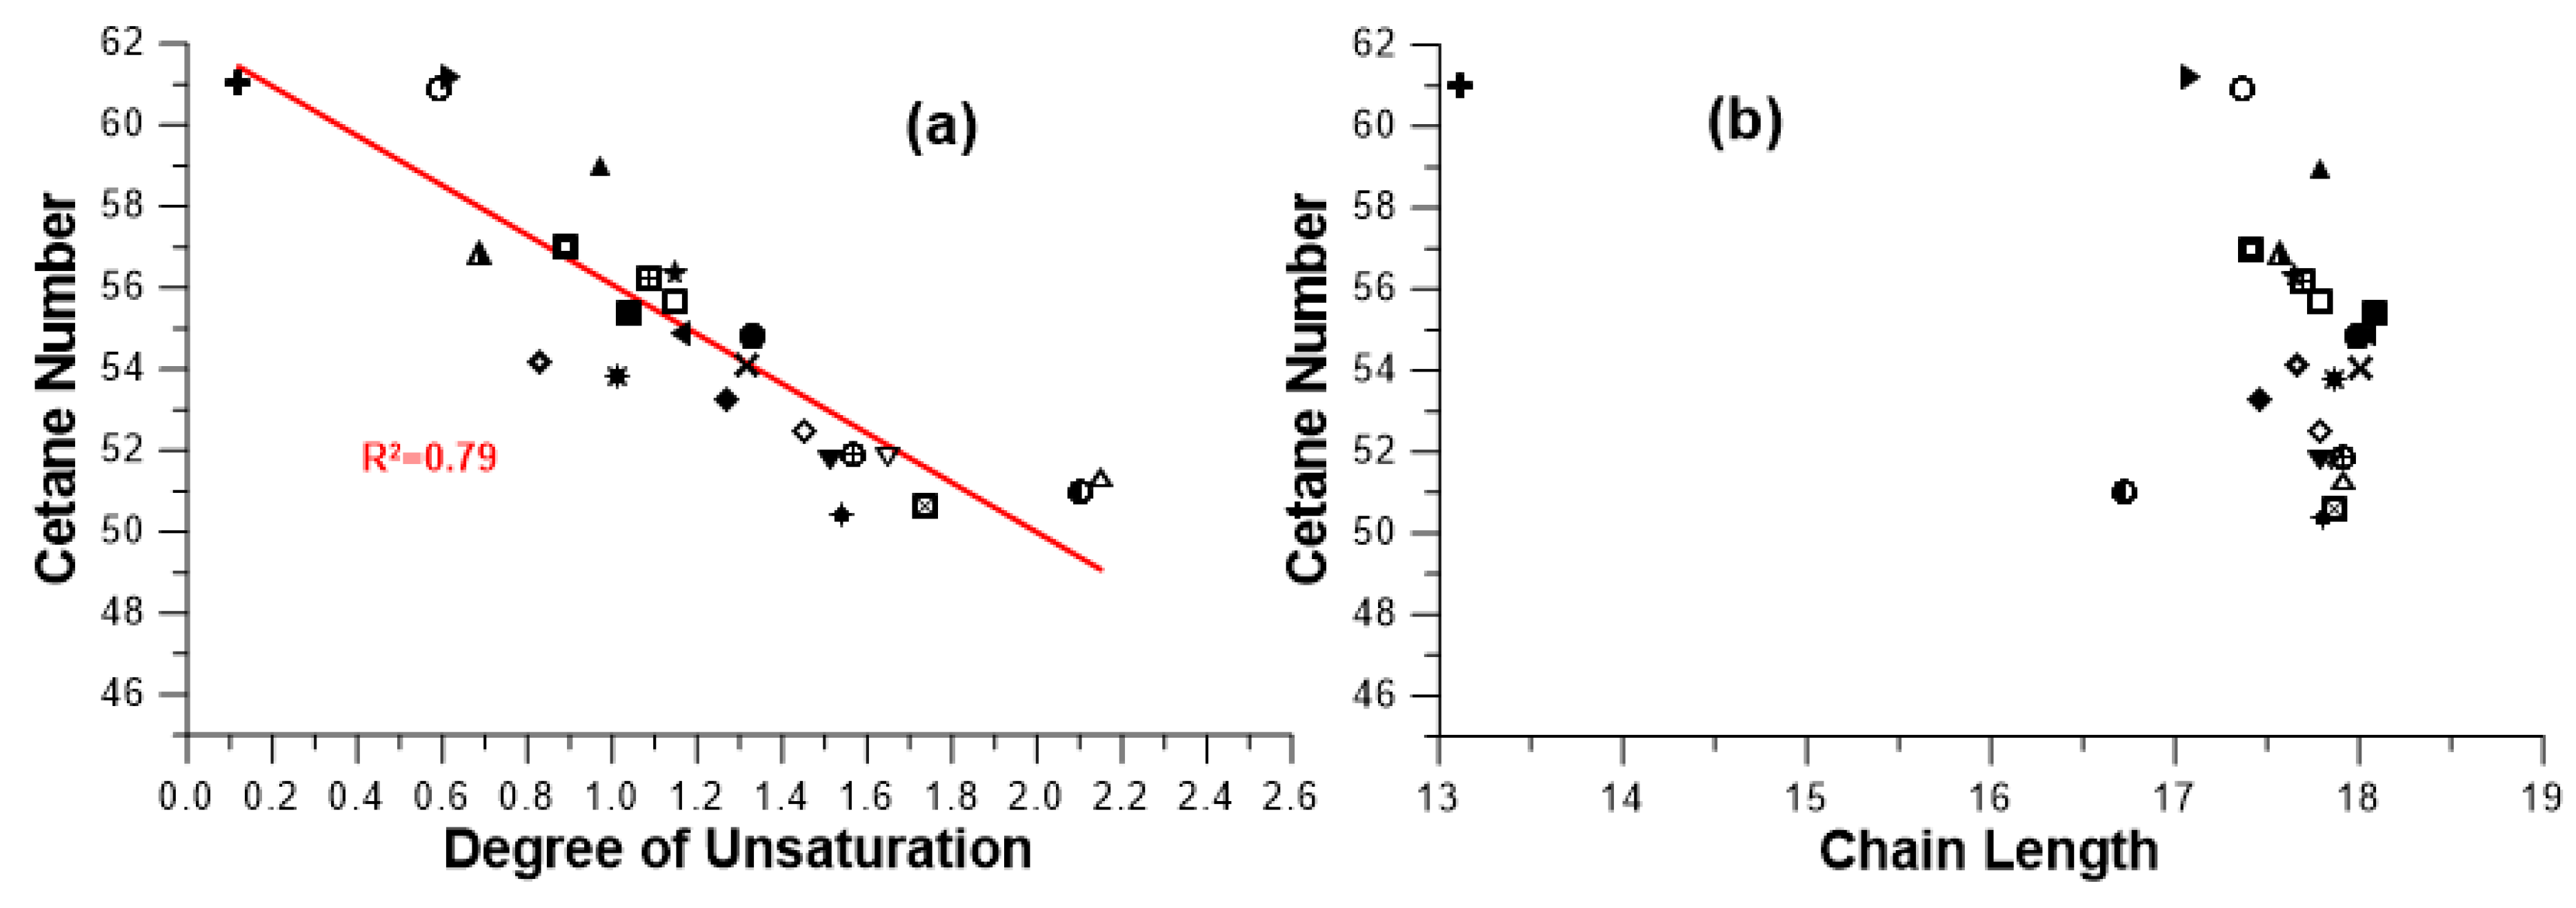
23], long straight-chain hydrocarbons (minimum branching) possess high CN values, and are therefore ideal for fuels in diesel engines. Double bonds, i.e. the unsaturation level, on the other hand, lead to lower CN values. In this regard, alkenes possess lower CNs than alkanes. With regards to biodiesel, methyl esters from highly-saturated feedstock, such as palm, coconut and tallow, exhibit the highest CN values, i.e., in the order of 60, as demonstrated in
Figure 2 (but worse cold-flow properties). A quite strong dependence between CN and molecular weight (chain length too) has been confirmed in the literature.
The universally accepted method for measuring CN is described in ISO 5165:2017 (“Petroleum products—Determination of the ignition quality of diesel fuels—Cetane engine method”) and ASTM D 613 (“Standard Test Method for Cetane Number of Diesel Fuel Oil”). Both employ a standard CFR single-cylinder, four-stroke, indirect injection diesel engine of variable compression ratio. The procedure uses fuels of known cetane number as references. Using the fuel under test, the engine compression ratio is varied so as to achieve the same ignition delay as those with two ‘bracketing’ reference fuels, thereby permitting the interpolation of the CN [
25]. European standard DIN 16906:2017 (formerly 51773:2010) “Liquid petroleum products—Determination of the ignition quality of diesel fuels - BASF engine method” employs a different engine of fixed compression ratio, where during the test, the amount of induced air is altered.
The shortcomings of these methods are: the high fuel cost for pure compounds that are very expensive, time, sophisticated laboratory facilities, and expertise for accurate measurements. In light of the above, an alternative CN test method has been developed in recent years employing a constant volume combustion chamber (CVCC), named ‘ignition quality tester’ (IQT). In this method, a sample of fuel is injected into a heated CVCC at approximately 575 °C and 21.37 bar (310 psi). Initially, the pressure decreases due to cooling from fuel evaporation, but then increases as combustion commences, ultimately achieving the initial pressure at the pressure recovery point. The ignition delay is then determined as the time between the beginning of the injector needle lift and the chamber pressure recovery point. A correlation has also been developed between the measured ignition delay and the cetane number. This method has been approved by ASTM as Standard D 6890 (“Standard test method for determination of ignition delay and derived cetane number (DCN) of diesel fuel oils by combustion in a constant volume chamber”). The main advantages of the IQT Care the shorter test time (approx. 20 min compared to few hours for the CFR procedure), smaller volume samples of the test fuel (approx. one tenth of the CFR), and lower reproducibility errors [
25]. The CN values determined using the IQT are known as DCNs, i.e., derived CNs.
An alternative to the cetane number is the cetane index (CI). CI is calculated from the fuel’s density and (10, 50 and 90%) distillation temperatures, known as the four-variable equation. ISO 4264:2018 (“Petroleum products - Calculation of cetane index of middle-distillate fuels by the four-variable equation”) and ASTM D4737 (“Standard test method for calculated cetane index by four variable equation”) describe the relevant computational procedure. For hydrocarbon fuels, CI is an easily obtainable substitute for CN, saving refineries a lot of work and rendering CN-testing engines unnecessary; the same can be applied to biodiesel when a test engine is not available to determine CN directly, or when an insufficient amount of a sample is available for an engine rating.
The current work only deals with CN and not CI values.
3. Review of Biodiesel CN Predictions Based on the FA Composition
The available literature on predictive correlations for biodiesel properties based on their fatty acid composition is quite broad.
Table 1 provides information on the most important fatty acids found in the FAME mixture that will be discussed in the text. In this work, we have gathered all available methyl ester CN models published in the last 30 years based on the following criteria:
- (a)
The models are based on the fatty acid composition (directly, or indirectly through the chain length or the molecular weight),
- (b)
The model equations are explicitly provided by the authors (hence, no artificial neural network algorithms have been considered).
The models that were found can be classified into three categories:
Models that are based directly on the biodiesel fatty acid composition (termed in this review ‘compositional’ models), i.e., without employing ‘intermediate’ metrics in the calculations such as the degree of unsaturation or the chain length. For this kind of modeling, an equation of the following type is formulated
with A and a
i being independent variables to be derived from a multiple linear regression analysis by the least squares method. Index i denotes the individual fatty acid in the biodiesel mixture, and w
i is the weight percentage of each FA. The commonly employed acids, as shown in the last column of
Table 1, are lauric (index 1), myristic (2), palmitic (3), stearic (4), palmitoleic (5), oleic (6), linoleic (7) and linolenic (8); this means that not all FAs in the biodiesel mixture are taken into consideration but (usually) only the above-mentioned ones (or even fewer), which also happen to be the most common. Obviously, when a ME consists primarily of FAs not represented in Equation (1), the prediction may be seriously affected.
Models that are based on one or two (as in most cases) metrics of the FAME to predict its CN. As discussed in the previous section, the first is always the degree of unsaturation (DU), and the second the chain length (CL) or the molecular weight (MW). Such models are usually linear or quadratic. The average biodiesel CL and MW needed in these models are calculated as the weighted average based on each fatty acid’s percentage in the biodiesel mixture. For the biodiesel average degree of unsaturation, the calculation is further based on the commonly-employed approach of accounting unsaturated FAs of the form Cxx:y with a weight percentage of y (e.g., palmitoleic C16:1 or oleic C18:1 with a weight percentage of 1, linoleic C18:2 with a percentage of 2, and linolenic C18:3 with 3—see column ‘Number of double bonds’ in
Table 1). In contrast to the previous category, here by default, all FAs present in the biodiesel mixture are considered for the calculation of DU and CL/MW.
Models that use each neat FAME’s CN as the basis, applying then a mixing rule for the biodiesel ‘mixture’.
where CN
i is the predicted (or measured) cetane number of each neat FAME (methyl oleate, methyl palmitate etc), and w
i its weight percentage in the biodiesel blend. In this category too, all FAs present in the biodiesel mixture are taken into account. In Equation (2), the universally accepted assumption is applied that the CN of a blend is a linear combination of the CNs of its components.
In the next subsections, the gathered models will be discussed in more detail for each one of the categories mentioned above, before their comprehensive evaluation in
Section 4.
3.1. Compositional Models
In 2008, Bamgboye and Hansen [
18] published the first compositional-type CN model based on a large sample of experimental data from various sources; the relation reached was
Notice that the effect of lauric acid (index 1 in
Table 1) is not taken into account. A closer look at the above relationship reveals the positive effect of saturated acids (x
2÷4) on the CN, as well as the negative effect of the unsaturated ones (x
5÷8). A coefficient of determination in the order of 88.3% was reported regarding the model’s predictive capability against a set of nine experimental data series from the literature (different from the ones used to build Equation (3)).
Following a similar approach, Gopinath et al. [
21] developed in 2009 a relation based on 68 experimental values of CN and fatty acid composition, and the MLR analysis provided the following equation:
The effect of lauric acid (index 1) is now included in the relation. In contrast, the effect of (the usually low-percentage) C16:1 palmitoleic acid (index 5) is not taken into account. Notice in Equation (4) that the weight of the saturated acids’ (x1÷4) regression coefficients increases with increasing molecular weight (i.e., with increasing index i). Similarly, the weight of the unsaturated acids’ coefficients (x6÷8) decreases with increasing degree of unsaturation. Thus, the theoretical basis of Equation (4) is unequivocally sound. A maximum error of 8% was reported when comparing the model’s predictions with a data set of eleven experimental values.
In 2013, Piloto-Rodriguez et al. [
19] expanded on previous analyses by also including the effect of gondoic and erucic mono-unsaturated fatty acids in the derived correlation (both are usually of low percentage weight, with the exception of certain ‘extreme’ or exotic feedstocks such as jojoba). The sum of other FAs found in the biodiesel mixture (‘res’) was also taken into account. The derived equation, which is much more complex than the previous two, was based on a set of 50 experimental values of measured FA compositions and CNs, and reads as:
In this case too, the always positive magnitude of the saturated acids’ coefficients (x1÷4) increases with increasing molecular weight. The ‘res’ contribution, which is expected to consist mostly of saturated short-chain (C8:0 and C10:0) and long-chain (C20:0 and C22:0) FAs, is, however, negative. The contribution of the unsaturated acids (x5÷10) is mixed, with the major unsaturated acids contributing negatively and the two minor ones (C20:1 and C22:1) positively. A rather high degree of accuracy of the model’s predictive capability was reported (R2 in the order of 91.46%), and was claimed to be approximately five to six percentage points higher than the previous two models.
The fourth model following the ‘compositional’ philosophy and applying MLR analysis was developed by Giakoumis and Sarakatsanis in 2018 [
22], and uses the following equation:
The data set used for Equation (6) contained 45 different sets of CN and FA composition values from various feedstocks (incl. also neat FAMEs); the degree of correlation R2 was approx. 90%, i.e., a quite a high value, despite the wide variability of the selected data set. The following comments can be made with respect to Equation (6):
The first (constant) term is of the same order of magnitude as past similar research—see Equations (3)–(5);
saturated acids contribute to an increase in the CN number;
the magnitude of the saturated acids’ coefficients increases with increasing carbon number 0.0747 (C12:0) to 0.098 (C14:0) to 0.164 (C16:0) to 0.176 (C18:0); and
unsaturated acids contribute to a decrease in the predicted CN.
Thus, it is believed that the derived equation has a sound theoretical basis.
3.2. Models Based on the Average Degree of Unsaturation and Chain Length
In 2012, Hoekman et al. [
12] performed a large-scale statistical analysis of the fatty acid composition and physical/chemical properties for biodiesels derived from twelve sources (camelina, canola, coconut, corn, jatropha, palm, rapeseed, safflower, soybean, sunflower, tallow and yellow grease). Among other things, correlations for CN were derived based on the degree of unsaturation or the chain length (but not both). For the former, the developed relation was
As expected, an increasing unsaturation contributes to a decrease in the predicted CN; the coefficient of determination from Equation (7) was reported as 80.49% against the experimental data its derivation was based on. No statistical correlation could be established between CN and chain length.
Around the same time, Giakoumis [
6] performed an even broader survey, covering now 26 different feedstocks, with data from hundreds of literature sources. The feedstocks in alphabetical order were: beef tallow, canola, castor, chicken, coconut, corn, cottonseed, croton, fish, hazelnut, jatropha, karanja, lard, linseed, mahua, neem, olive, palm, peanut, rapeseed, rice bran, rubber seed, safflower, soybean, sunflower and waste cooking oil. Α similar to Equation (7) relation was reached (castor excluded) with an R
2 value of 79%, illustrated in the lower sub-diagram of
Figure 2.
Since the CN depends not only on the degree of unsaturation, but also on the molecular weight (or the chain length; see upper sub-diagram of
Figure 2), it is not surprising that both Equations (7) and (8) did not present a very high degree of correlation with the experimental data they were based on.
Apart from the above two research groups, many more have investigated the effects of unsaturation on CN (as well as on other FAME properties), e.g., Ramos et al. [
26]. Nonetheless, the latter investigations concerned a much smaller scale of examined feedstocks; hence, these correlations will not be included in the current comparative evaluation, as, in essence, they are ‘covered’ by Equations (7) and (8).
The rest of the models of this category attempted a more comprehensive approach, incorporating both DU and CL/MW effects. The obvious challenge here is to capture the effect of chain length (or molecular weight), as, following Figure 4, the effect of CL on CN, although increasing, does not exhibit a clear trend.
The simplest relation taking into account the degree of unsaturation (negative effect) and the average biodiesel carbon number (positive effect) was developed by Chang and Liu [
27]
Very little information is provided as to how this equation was developed. The authors mention that Equation (9) was validated with 31 experimental data points, manifesting an average relative deviation of 7.43%.
The next two models of this category were even more complex. In 2011, Pinzi et al. [
16] published a second-order equation model based on both the degree of unsaturation (found to have the biggest contribution) and the chain length:
Equation (10) seems purely ‘mathematical’, without possessing a clear theoretical basis (notice the negative sign of the first-order CL coefficient and the positive sign of the first and second-order DU ones). Moreover, based on the rather obvious linear relation between CN and DU from
Figure 2, one might reach the conclusion that a second-order DU term is redundant. The degree of unsaturation and the chain length of the biodiesel are computed based on its FA composition (weighted averages), and then the CN is derived from Equation (10); a very high R
2 value of 95.15% was reported.
Another similar approach was followed by Mishra et al. [
28] in 2016, who developed the following relation based on 42 measured data sets of CN and FA composition:
In this equation, apart from the degree of unsaturation, the straight-chain saturation factor (SCSF) is taken into account as well. The latter metric is calculated as
with MW
i as the molecular weight of the individual saturated methyl ester. Essentially, parameter DU is employed to take into account the effect of unsaturated fatty acids (hence the negative sign in Equation (11)), and SCSF the saturated ones (hence the positive sign in Equation (11)). Contrary to Equation (10), Equation (11) possesses a sounder theoretical basis. As is the usual case, it was claimed that the model was superior to others developed earlier, based on a relatively small sample of experimental data.
3.3. Models Based on the Individual Neat FAME’s CN
In 1982, Klopfenstein [
14] developed a model based on a series of experimental data to predict the cetane number for neat FAMEs (saturated esters with 8‒24 carbon atoms plus esters of palmitoleic, oleic, linoleic and linolenic acids). The equation derived was:
where n
i is the number of carbon atoms of the corresponding FA. Using Equation (13), the cetane number for each pure FAME can be assessed; then, applying Equation (2) the CN of the biodiesel is evaluated.
The same researcher studied saturated neat methyl/ethyl/propyl/butyl esters and reached the following equation for methyl ester ones [
29] based on measurements according to ASTM D 613 conducted on a Waukesha variable compression ratio engine:
Equation (14) was developed based on measurements for esters of the saturated fatty acids from C8 to C18. In the original citation [
29], Equation (14) had a positive constant term sign, which, however, produces unreasonably high CNs. Reproducing the original procedure used by Klopfenstein to develop his equation from a figure he provided with experimental data, a negative constant term was derived, as is also confirmed in [
11].
Freedman and Bagby [
11] studied saturated neat FAMEs too and developed a similar to Equation (14) relation for esters of the saturated fatty acids C6, C10, C12:0, C14, C16 and C18. Again, measurements according to ASTM D 613 were used (notice the negative sign of the constant term)
Lapuerta et al. [
17] studied the CN of various neat FAMEs too; they gathered 52 values from the literature for esters of the FAs C6:0, C6:2, C7:0, C8:0, C10:0, C12:0, C14:0, C16:0, C16:1, 18:0, C18:1, C18:2, C18:3, C20:0 and C22:1 acids, and developed correlations to predict them and inter-relate them with the iodine number. Initially, two equations were derived: one based on the CFR and another on the IQT data:
Their predictions were found to be quite close when saturated esters were being tested, but differences were noticed for unsaturated FAMEs. Furthermore, a new correlation was formed based on all available data (most of which were of the IQT type)
The value of R2 was reported at 91.8% and again the constant term is negative. As is the case with all models of this category, Equation (2) is used to calculate the FAME’s cetane number from the individual pure FAMEs weight percentage and CN. An interesting aspect of the particular analysis was that it was also extended to neat ethyl, propyl and butyl esters. In general, small differences were observed between the FA methyl ester, FA ethyl ester, FA propyl ester and FA butyl ester cetane numbers, when the number of carbon atoms was higher than 14.
In 2012, Ramirez-Verduzco et al. [
15] developed another relation for each neat FAME’s CN (density, higher heating value and kinematic viscosity as well) based on the FAME’s molecular weight and the number of double bonds (again with a negative constant term; note that Equation (17) has a similar structure with Equation (9)):
Another research group that based their analysis on pure FAMEs’ CN was Tong et al. [
30]; in this case, however, only one property was employed, namely, the number of carbon atoms. The sample used was not detailed enough (it seems that for most of the CNs, only one experimental value was used from the literature). Unlike the previous correlations of this category, Tong et al. [
30] derived two polynomial equations from the collected data regarding the CN of pure FAMEs: one for saturated and one for unsaturated FAMEs (incorporating in this way DU effects).
It should be pointed out that for the unsaturated FAMEs relation, only neat FAMEs containing one double bond were used for Equation (18) (i.e., C16:1, C18:1 and C20:1). Having CN values in hand for each pure FAME, one would expect the application of Equation (2) for the calculation of the biodiesel CN. Instead, the differently-structured Equation (19) was proposed by the authors; it was developed from a multiple linear regression analysis based on 40 data series of fatty acid composition and CN.
It was claimed that this equation manifests a coefficient of determination R2 = 90.58% against the data it was based on, as well as a very small relative error in the order of 3% (at the maximum). Obviously, for neat FAMEs, Equation (19) produces different results from Equation (18).
Since all the models mentioned in this subsection are based on experimental neat FAMEs’ CN values, another ‘model’ was formulated for the purposes of this study, following the logic suggested by Clements [
31] and Knothe [
10]. Instead of using equations to predict each pure FAME’s CN, the actual experimental (average) values are used, applying then the mixing rule Equation (2) for the whole biodiesel mixture. CN values for pure FAMEs, following either the CFR or the IQT procedure, were gathered from Refs [
7,
10,
11,
13,
25,
29,
32,
33,
34,
35,
36,
37,
38,
39,
40,
41,
42], and are reproduced in
Table 2; Reference [
25], in particular, is an invaluable citation for many kinds of pure compounds’ cetane numbers including (methyl) esters.
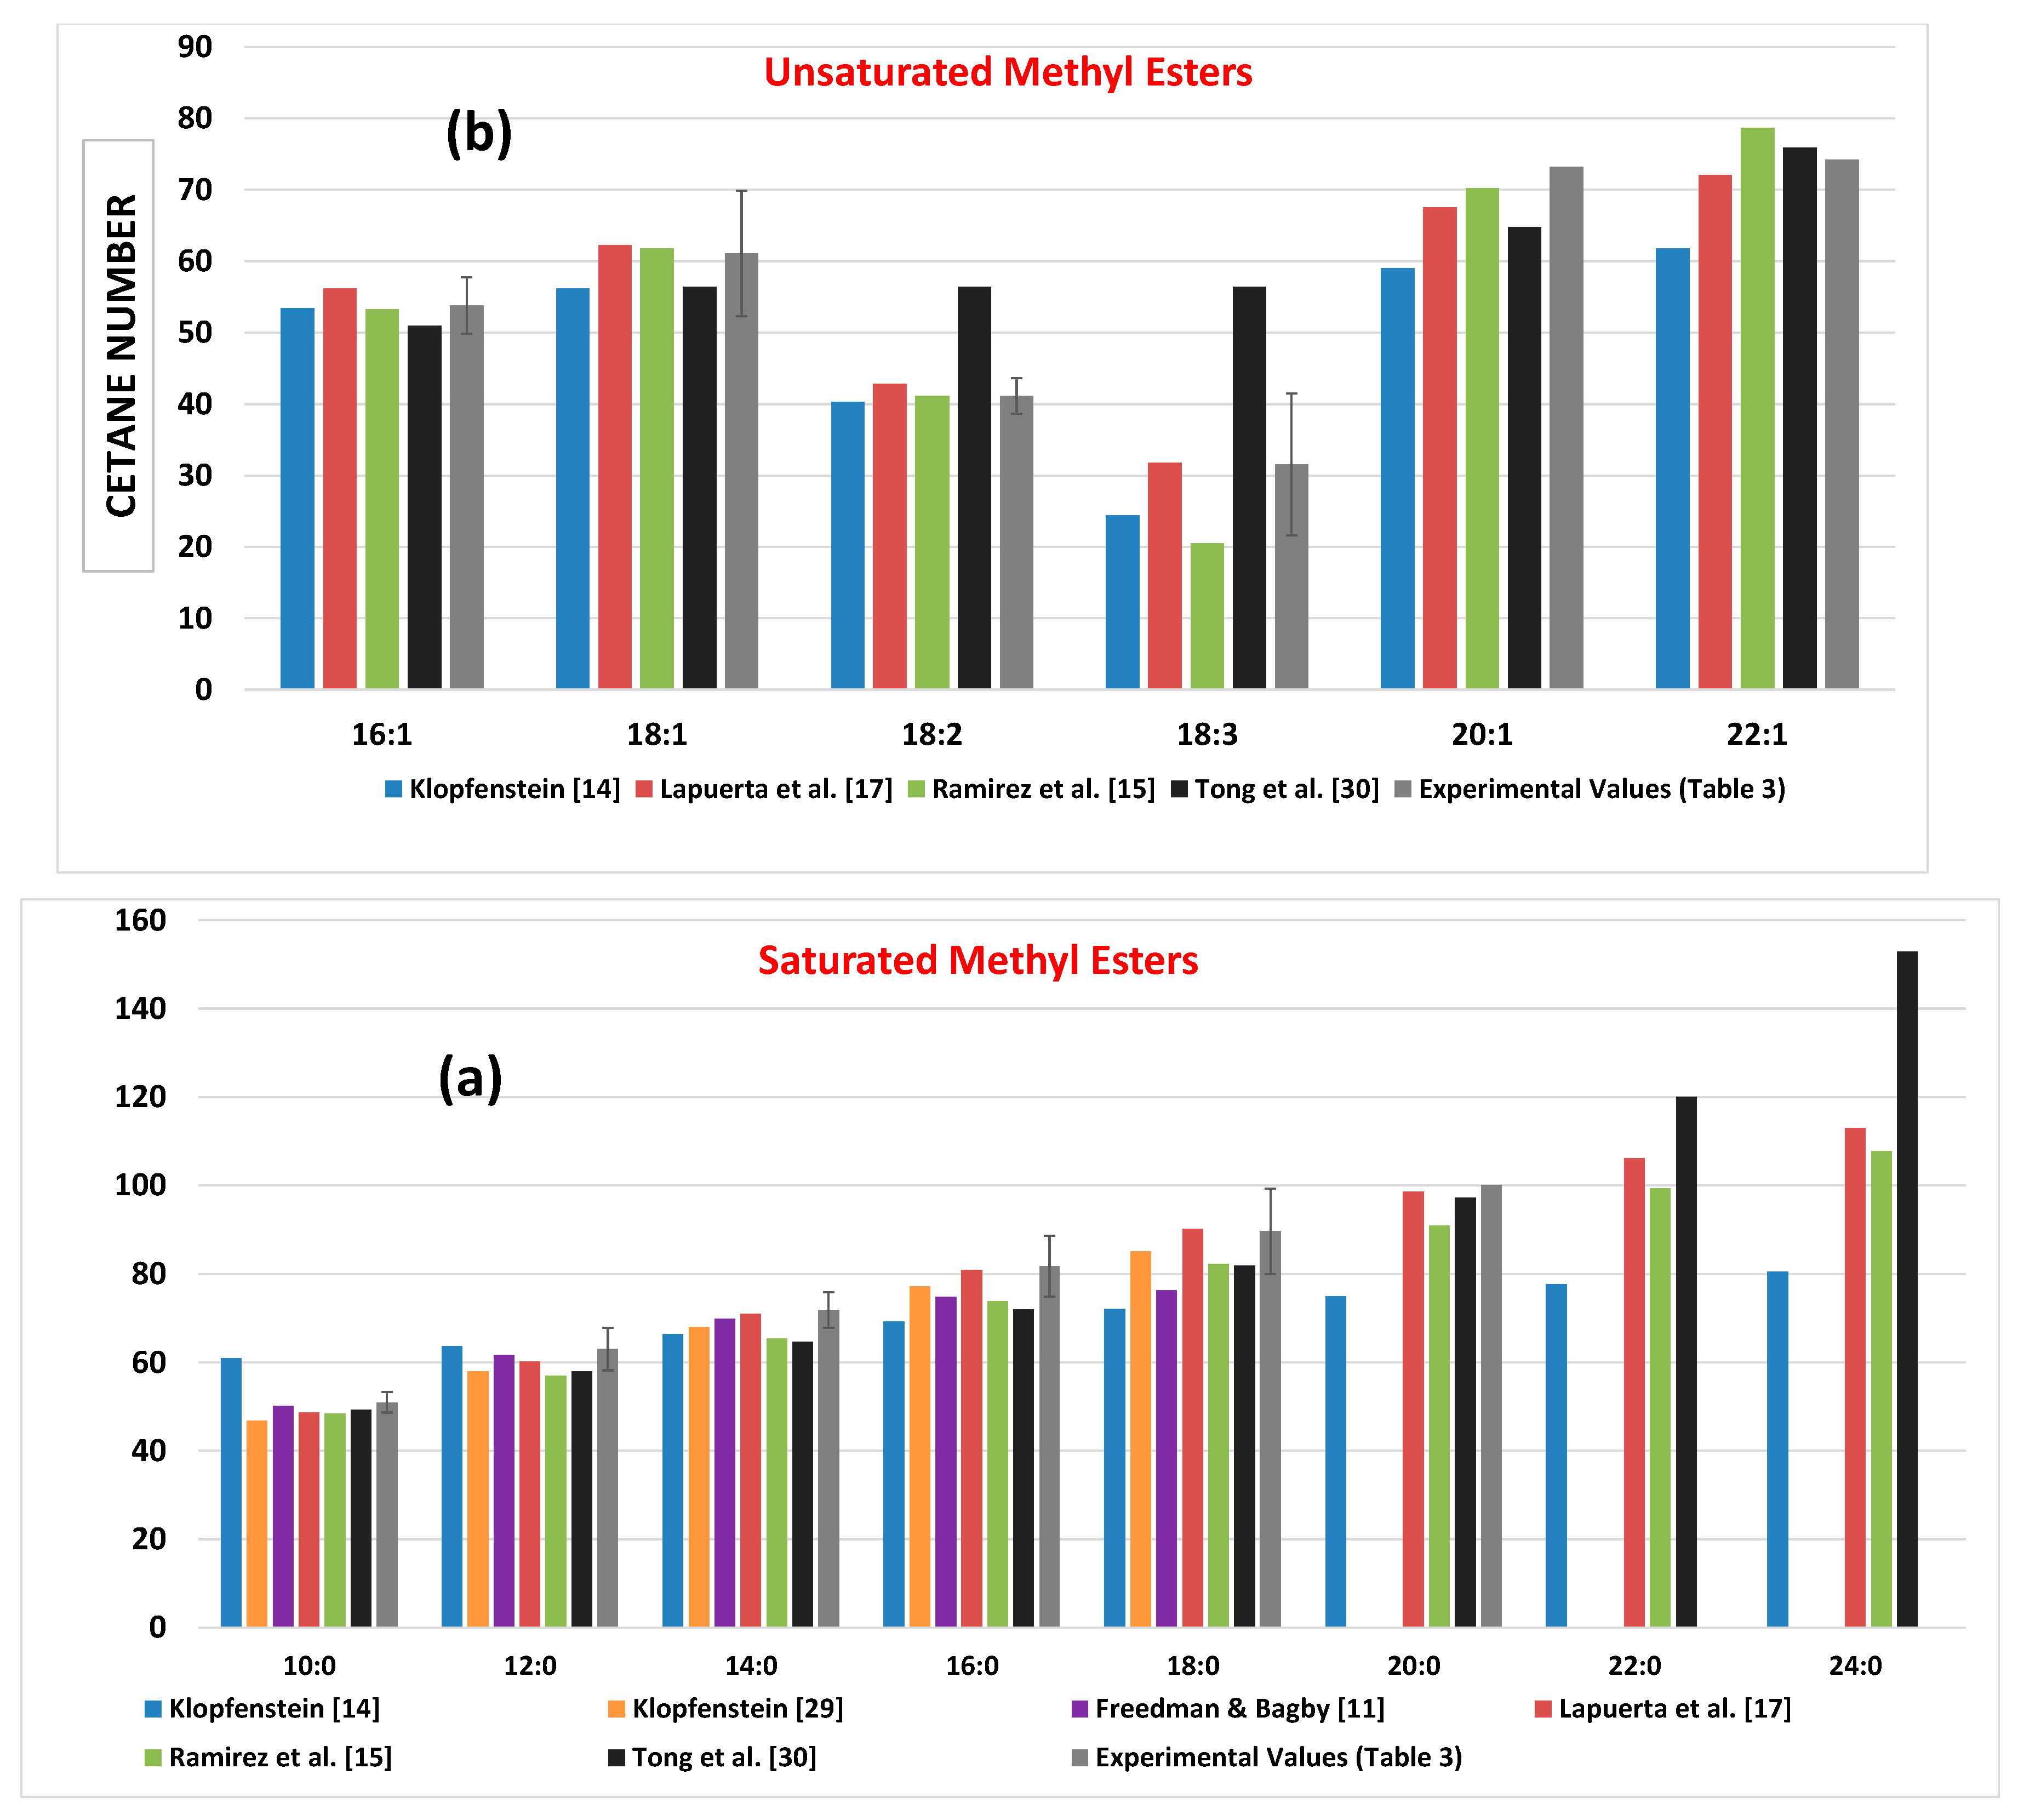
Experimental CN values are provided in
Figure 3 (together with the respective standard deviation) in comparison to the predicted ones from all models of this subsection. The well-established trends of increasing CN with increasing chain length (in a non-linear manner however [
29,
43]), and decreasing the number of double bonds, is again made evident. As noticed, a fairly high variability in the predicted neat FAMEs’ CN values is observed (in the experimental too), which will later be reflected into different predictions from the models (
Section 4). The model of Klopfenstein [
14] seems to overestimate the CN of methyl decanoate and underestimate CN values for long-chain FAMEs (C18 and above); that of Tong et al. [
30] assigns the same values to methyl esters of C18:1, C18:2 and C18:3, and, most probably, overestimates the CN for methyl lignocerate. On the other hand, the model whose predictions lie most closely to the experimental average values is undoubtedly that of Lapuerta et al. [
17]; this holds true for both the saturated and unsaturated FAMEs. Thus, it can be rather safely said that Equation (16) is the one that provides the best possible prediction of pure FAME CNs.
In essence, the models of this section suffer from the (sometimes) significant variability in the experimental neat methyl esters CN values they rely upon. Yet, they are perhaps the only ones that have been calibrated based on ‘true’ experimental measurements.
Concluding this section,
Table 3 summarizes basic information together with the developed equations for each biodiesel CN model found in the literature. Note in
Table 2 that for the models of the current subsection, all researchers use the FA carbon number ni in their equations, even when referring to the corresponding FAME.
Unlike all the other relations mentioned in
Section 3, Equation (19) from the model of Tong et al. [
30] could not be confirmed by the current research group using the data provided in the original paper. Therefore, this model will be excluded from the comparative analysis of
Section 4. Obviously, Equations (14) and (15) that deal with saturated FAMEs only will not be included in the comparative analysis as well.
4. Comparative Evaluation of All Models’ Predictive Capability
A general comment should be made first regarding the procedure followed for the comparative evaluation of all models. Picking and choosing experimental data can easily manipulate the results and lead to whatever findings one wants to reach. In order to avoid such phenomena and provide a reliable and objective comparison:
- (a)
An extensive, and at the same time, quite broad in terms of DU, CL and CN values, set of experimental data was selected for the comparison of 50 series of FA-CN values in total. It is believed that the amount of experimental data, as well as its variability, is adequate to establish trends and reach some reliable conclusions. All values of CN refer to the cetane number, and not the cetane index.
- (b)
Data was chosen only from those sources where values for both CN and fatty acid composition were provided, having been measured using the universally-accepted methods (e.g., ASTM D7806 for fatty acid composition and D613 for CN) [
18,
19,
26,
44,
45,
46,
47,
48,
49,
50,
51,
52,
53,
54,
55,
56,
57,
58]. Of course, this does not guarantee that all reported values are undeniably correct, but it indicates an acceptable level of confidence.
- (c)
All selected data from the literature values was compared to the average values provided in [
6], and it was confirmed that it was indeed within the ‘acceptable’ limits with regards to both FA composition and CN.
- (d)
Combinations of FAs-CNs that resulted in large errors in at least half of the models (from all three categories) were not considered in the analysis, particularly if these reported FA and/or CN data were outside the standard values reported in the two earlier extensive statistical analyses [
6,
12].
- (e)
Extreme cases of methyl esters rich in rare and unusual FAs, e.g., ricinoleic acid, were not included in the comparison, as they cannot be considered representative.
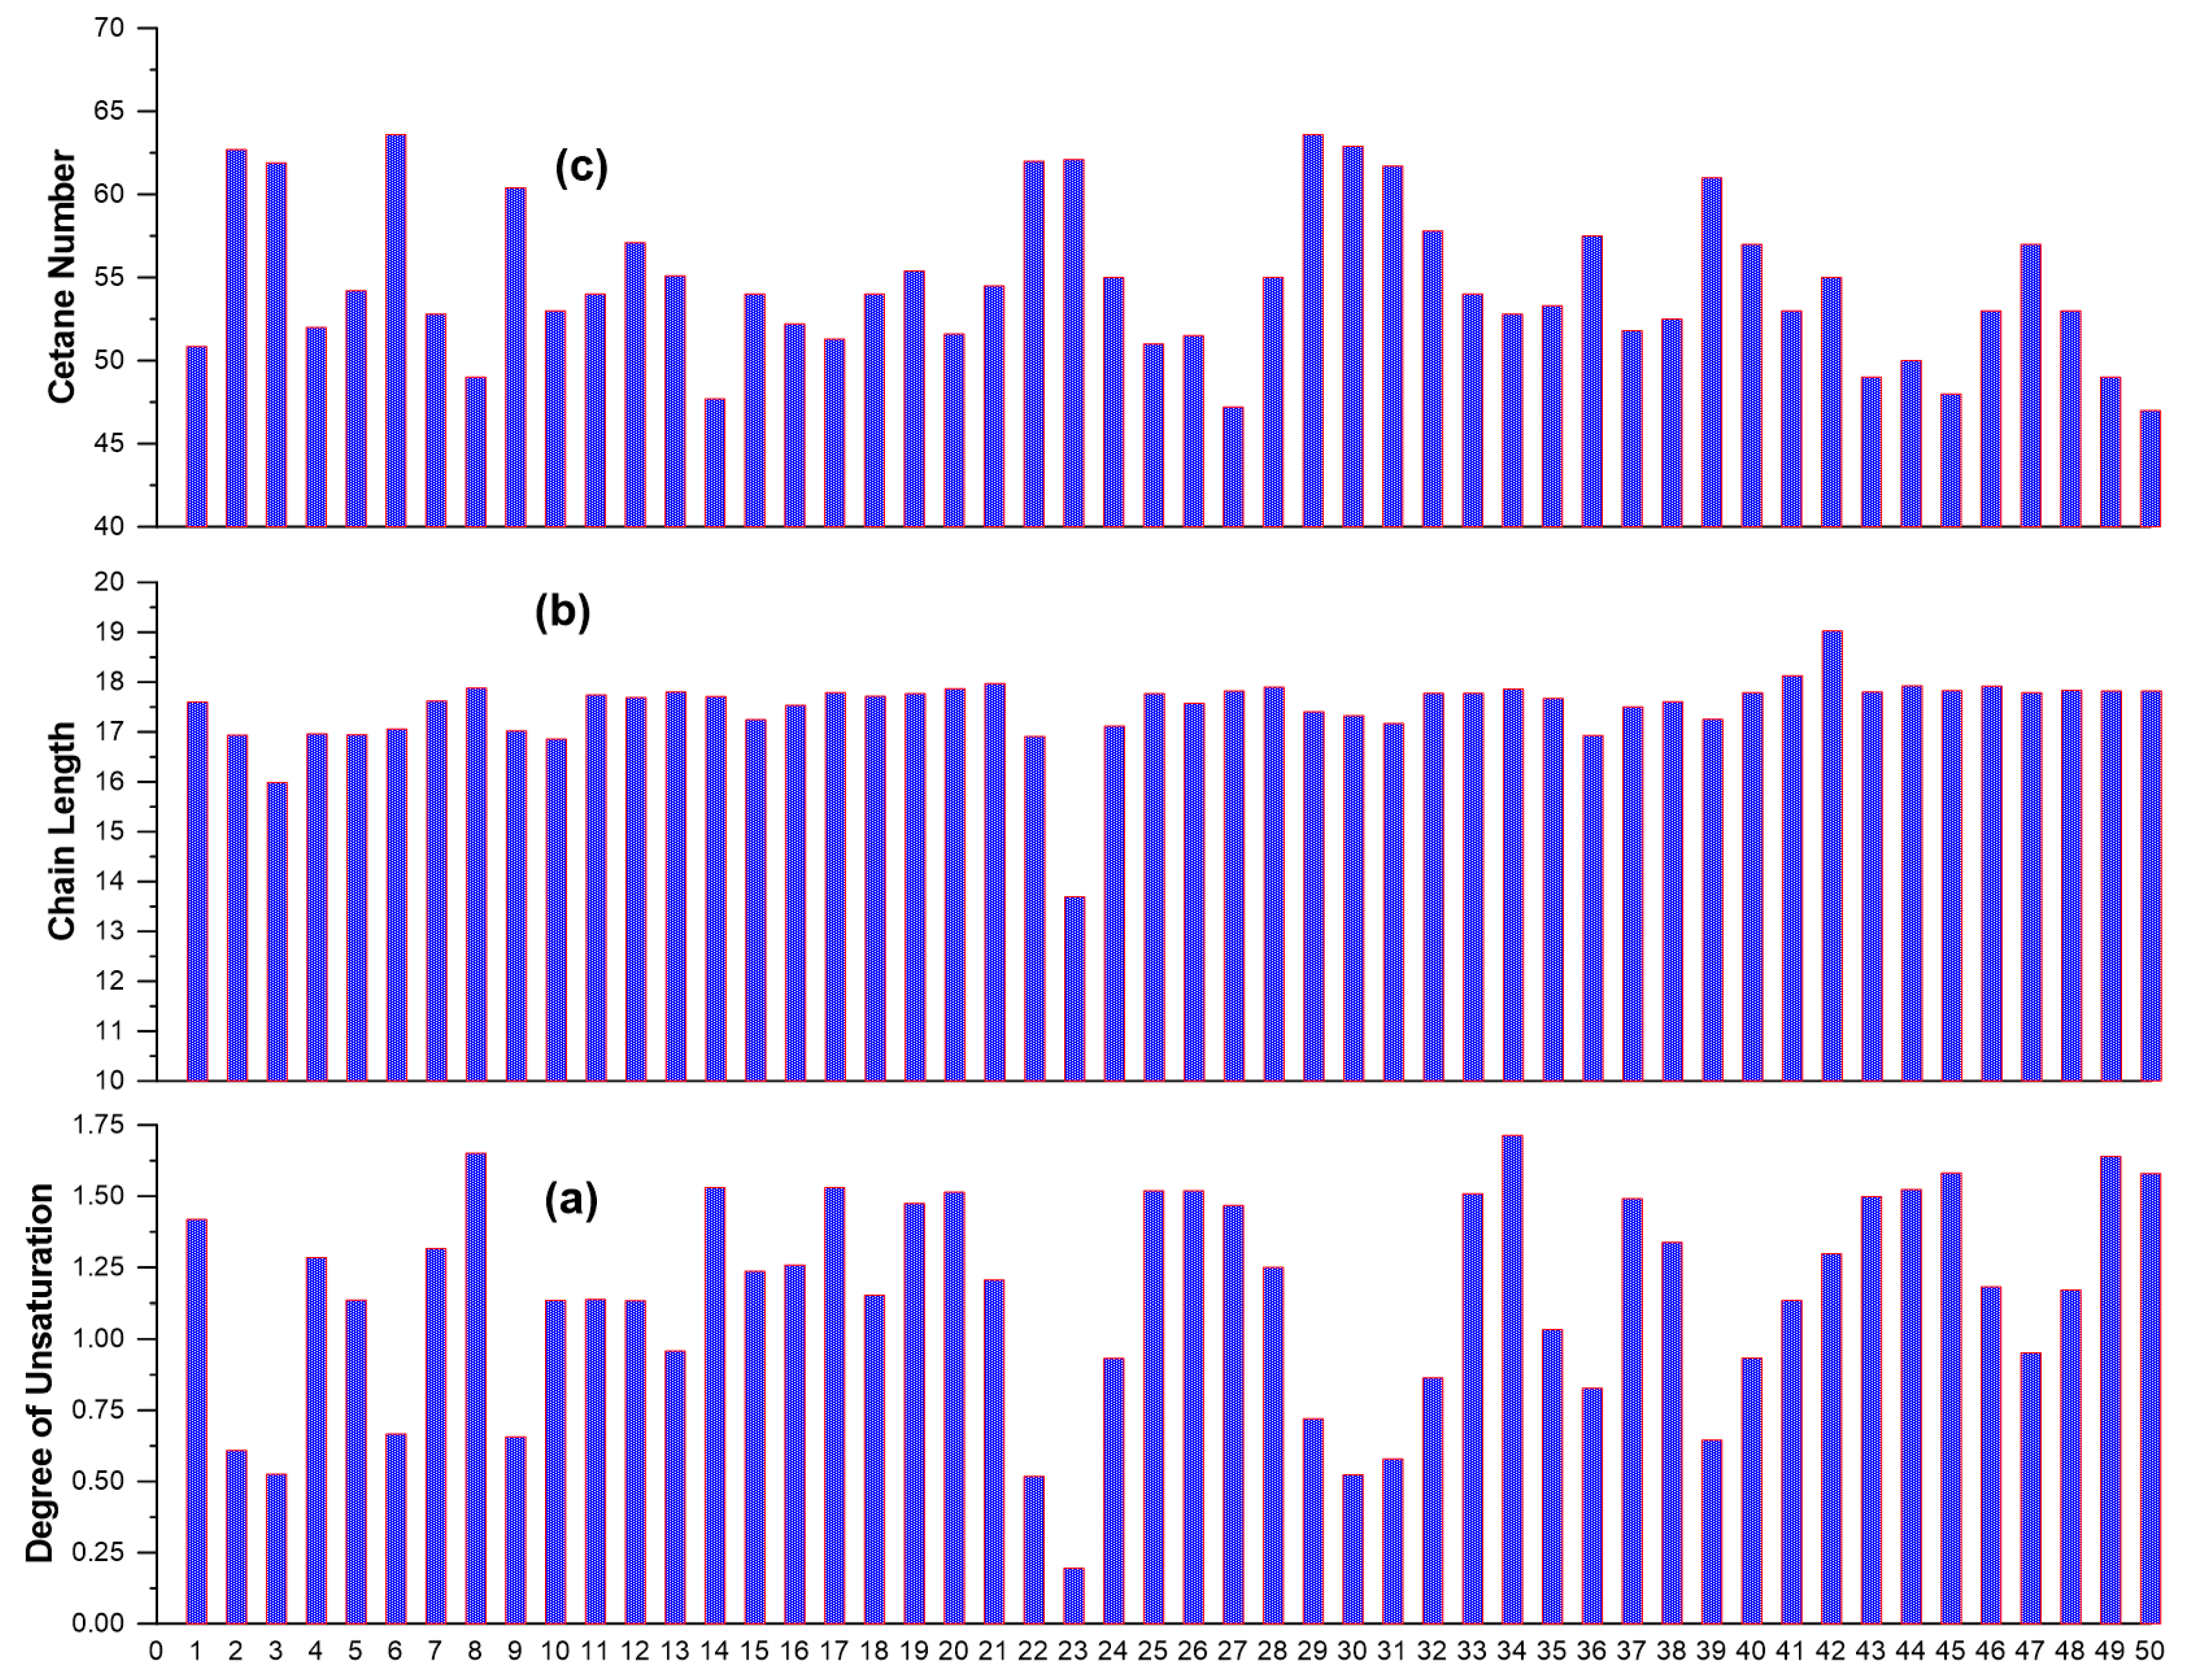
Table 4 (at the end of the text) provides the details for the 50 experimental data series, with percentage weight composition for all reported fatty acids, along with the measured CNs. Moreover, this table lists for each FAME the (calculated) degree of unsaturation and chain length needed for many of the models. The CNs in
Table 4 range from 47 to 63.6, with the variability in FAs being rather broad as evidenced from the DU, which ranges from 0.20 (palm kernel oil) to 1.71 (camelina). For the whole data set, all values for CN, DU and CL are illustrated in
Figure 4. Notice also in
Table 4 the very low percentage weight of the myristic and palmitoleic acids, as well as of all acids with more than 18 carbon atoms.
Applying the equations provided in
Section 3 for all models,
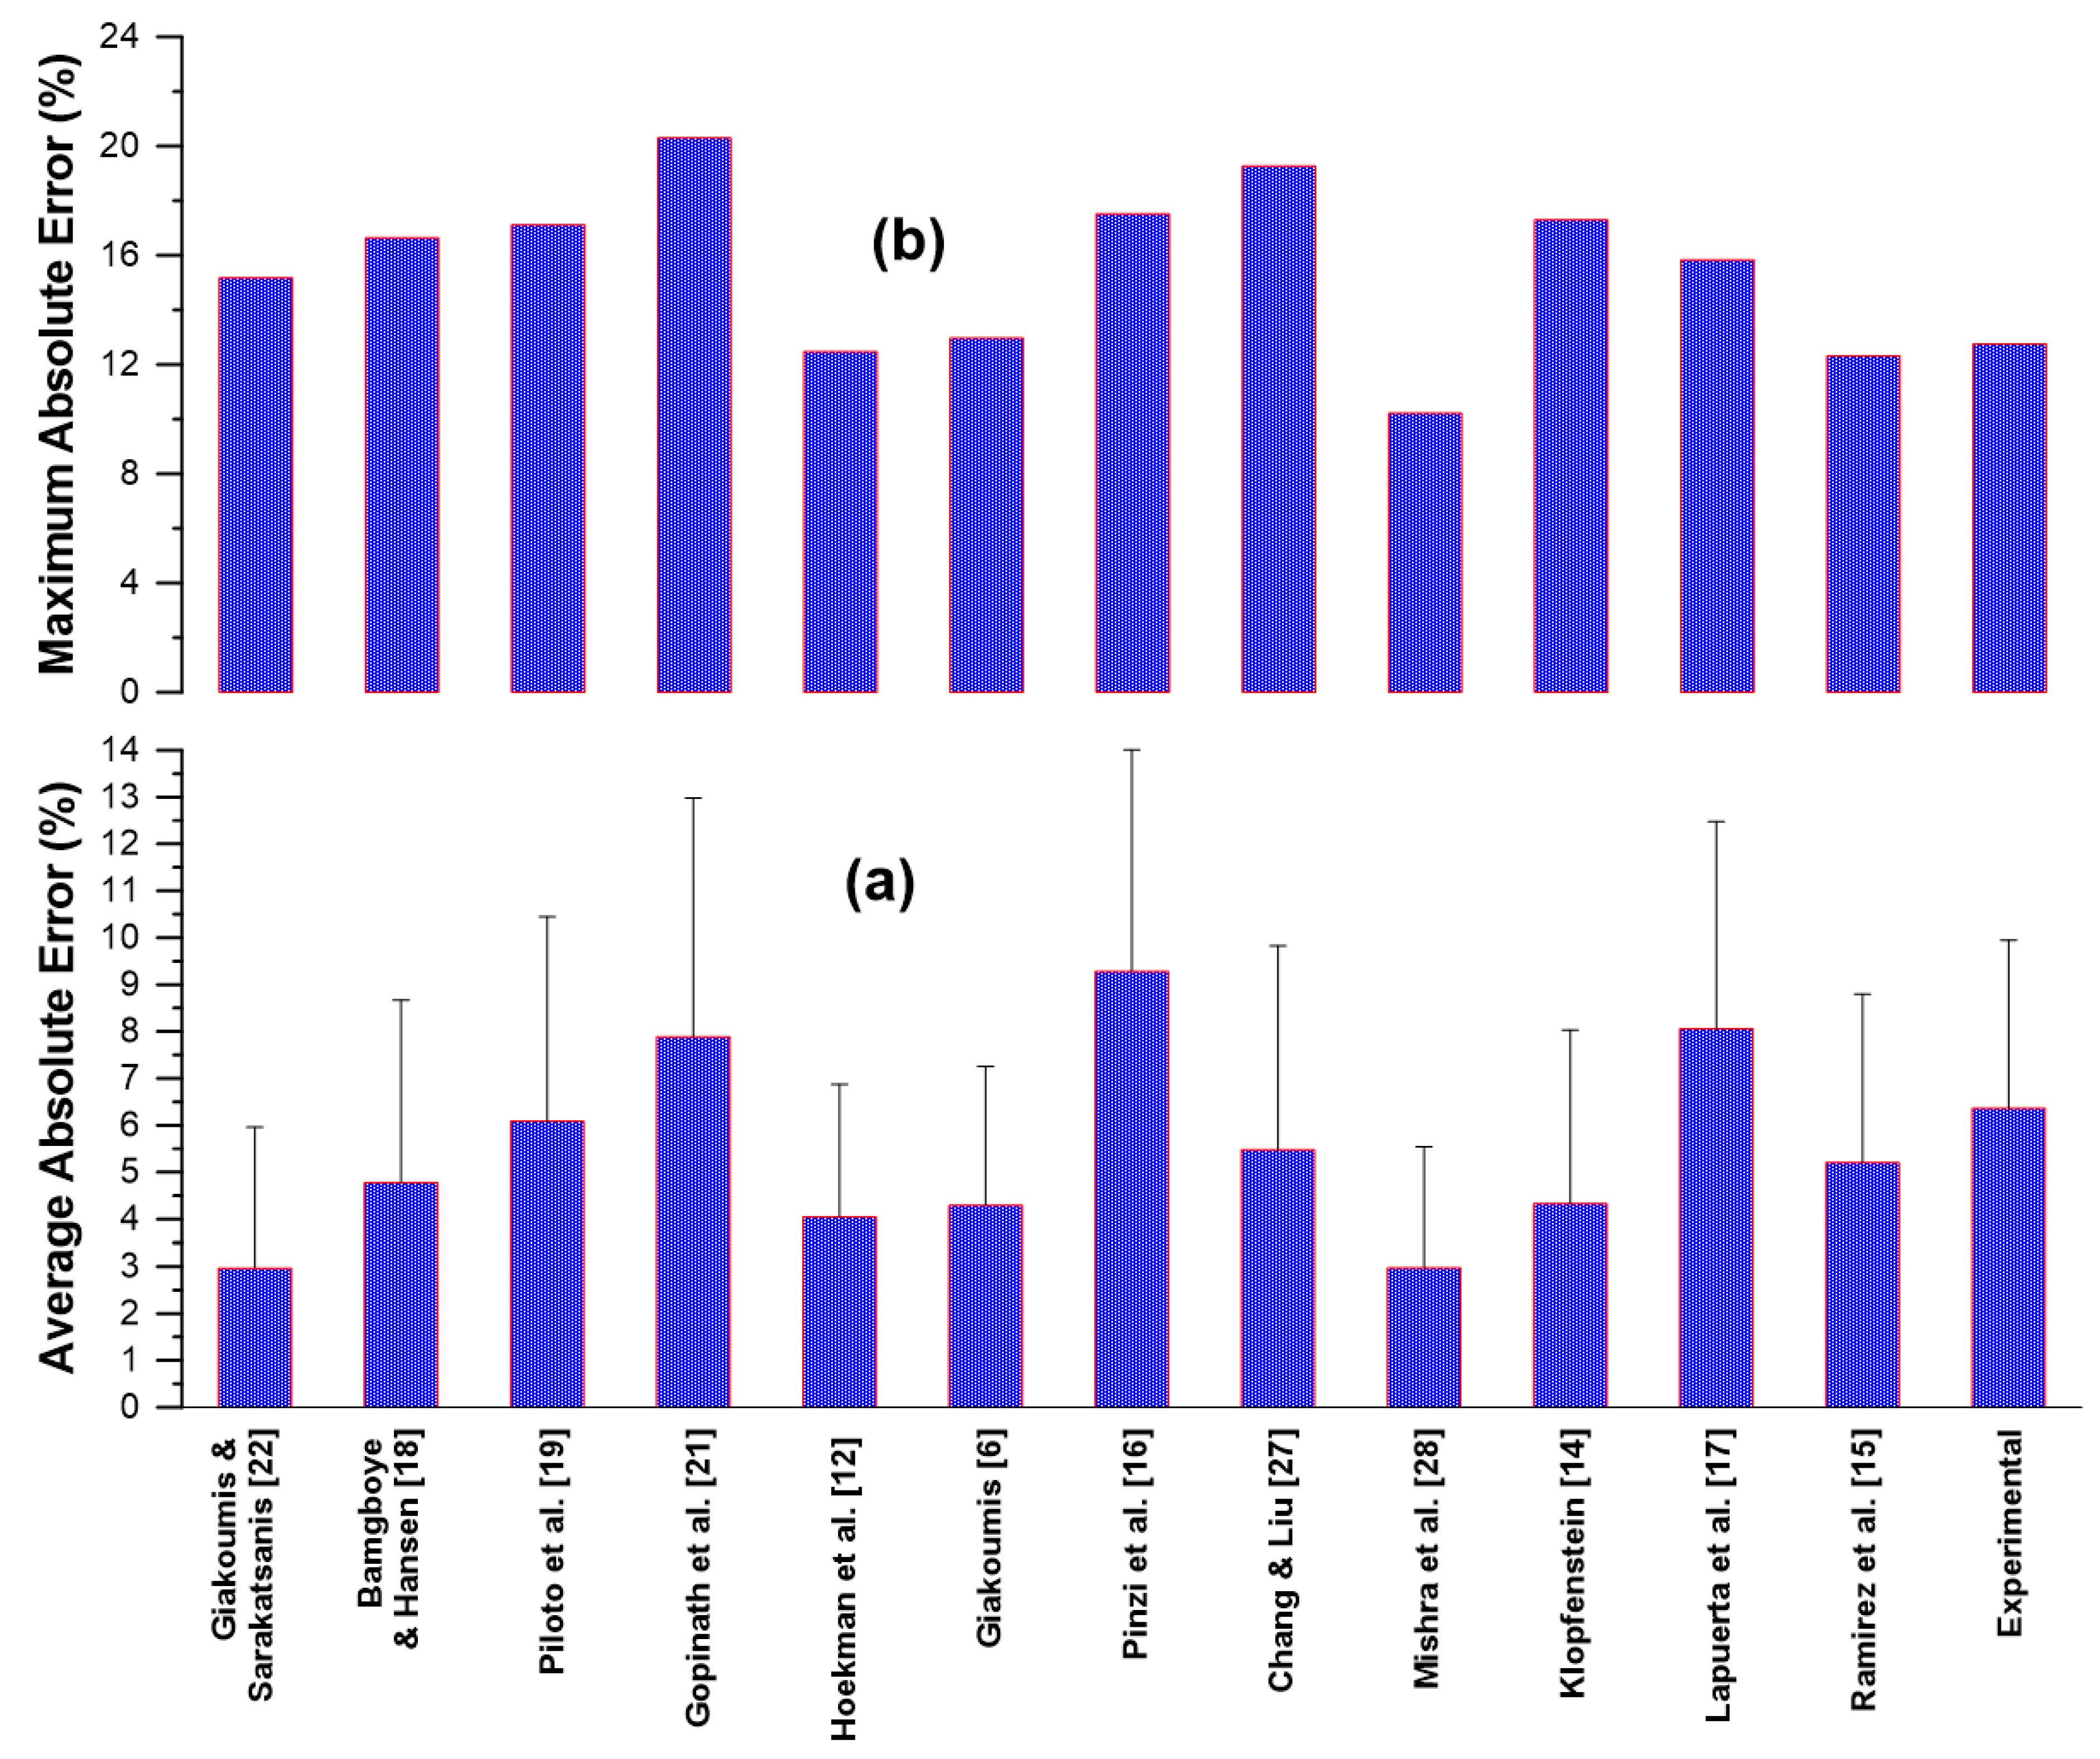
Table 5 (at the end of the text) provides the predicted CN values together with the absolute error (%) for each model and for each one of the 50 experimental data lines. The average error from each model is indicated in the last row of
Table 5, and further illustrated in
Figure 5. The lowest average errors are reported by the models by Mishra et al. [
28] and Giakoumis and Sarakatsanis [
22] at 2.97%. The two models that are based on the degree of unsaturation (Equations (7) and (8)) both manifest rather low average errors (4.05 and 4.29% respectively). The average errors were very low from the models by Klopfenstein [
14], at 4.34%, and Bamgboye and Hansen [
18], at 4.78%. On the other hand, the highest average errors were observed from the models by Pinzi et al. [
16] (9.27%) and by Lapuerta et al. [
17] (approx. 8%). Regarding the maximum error from the predictions, the model that ‘excels’ here is again the one by Mishra et al. [
28] at 10.21%, followed by the two DU-only models, at 12.48 [
12] and 12.97% [
6] respectively.
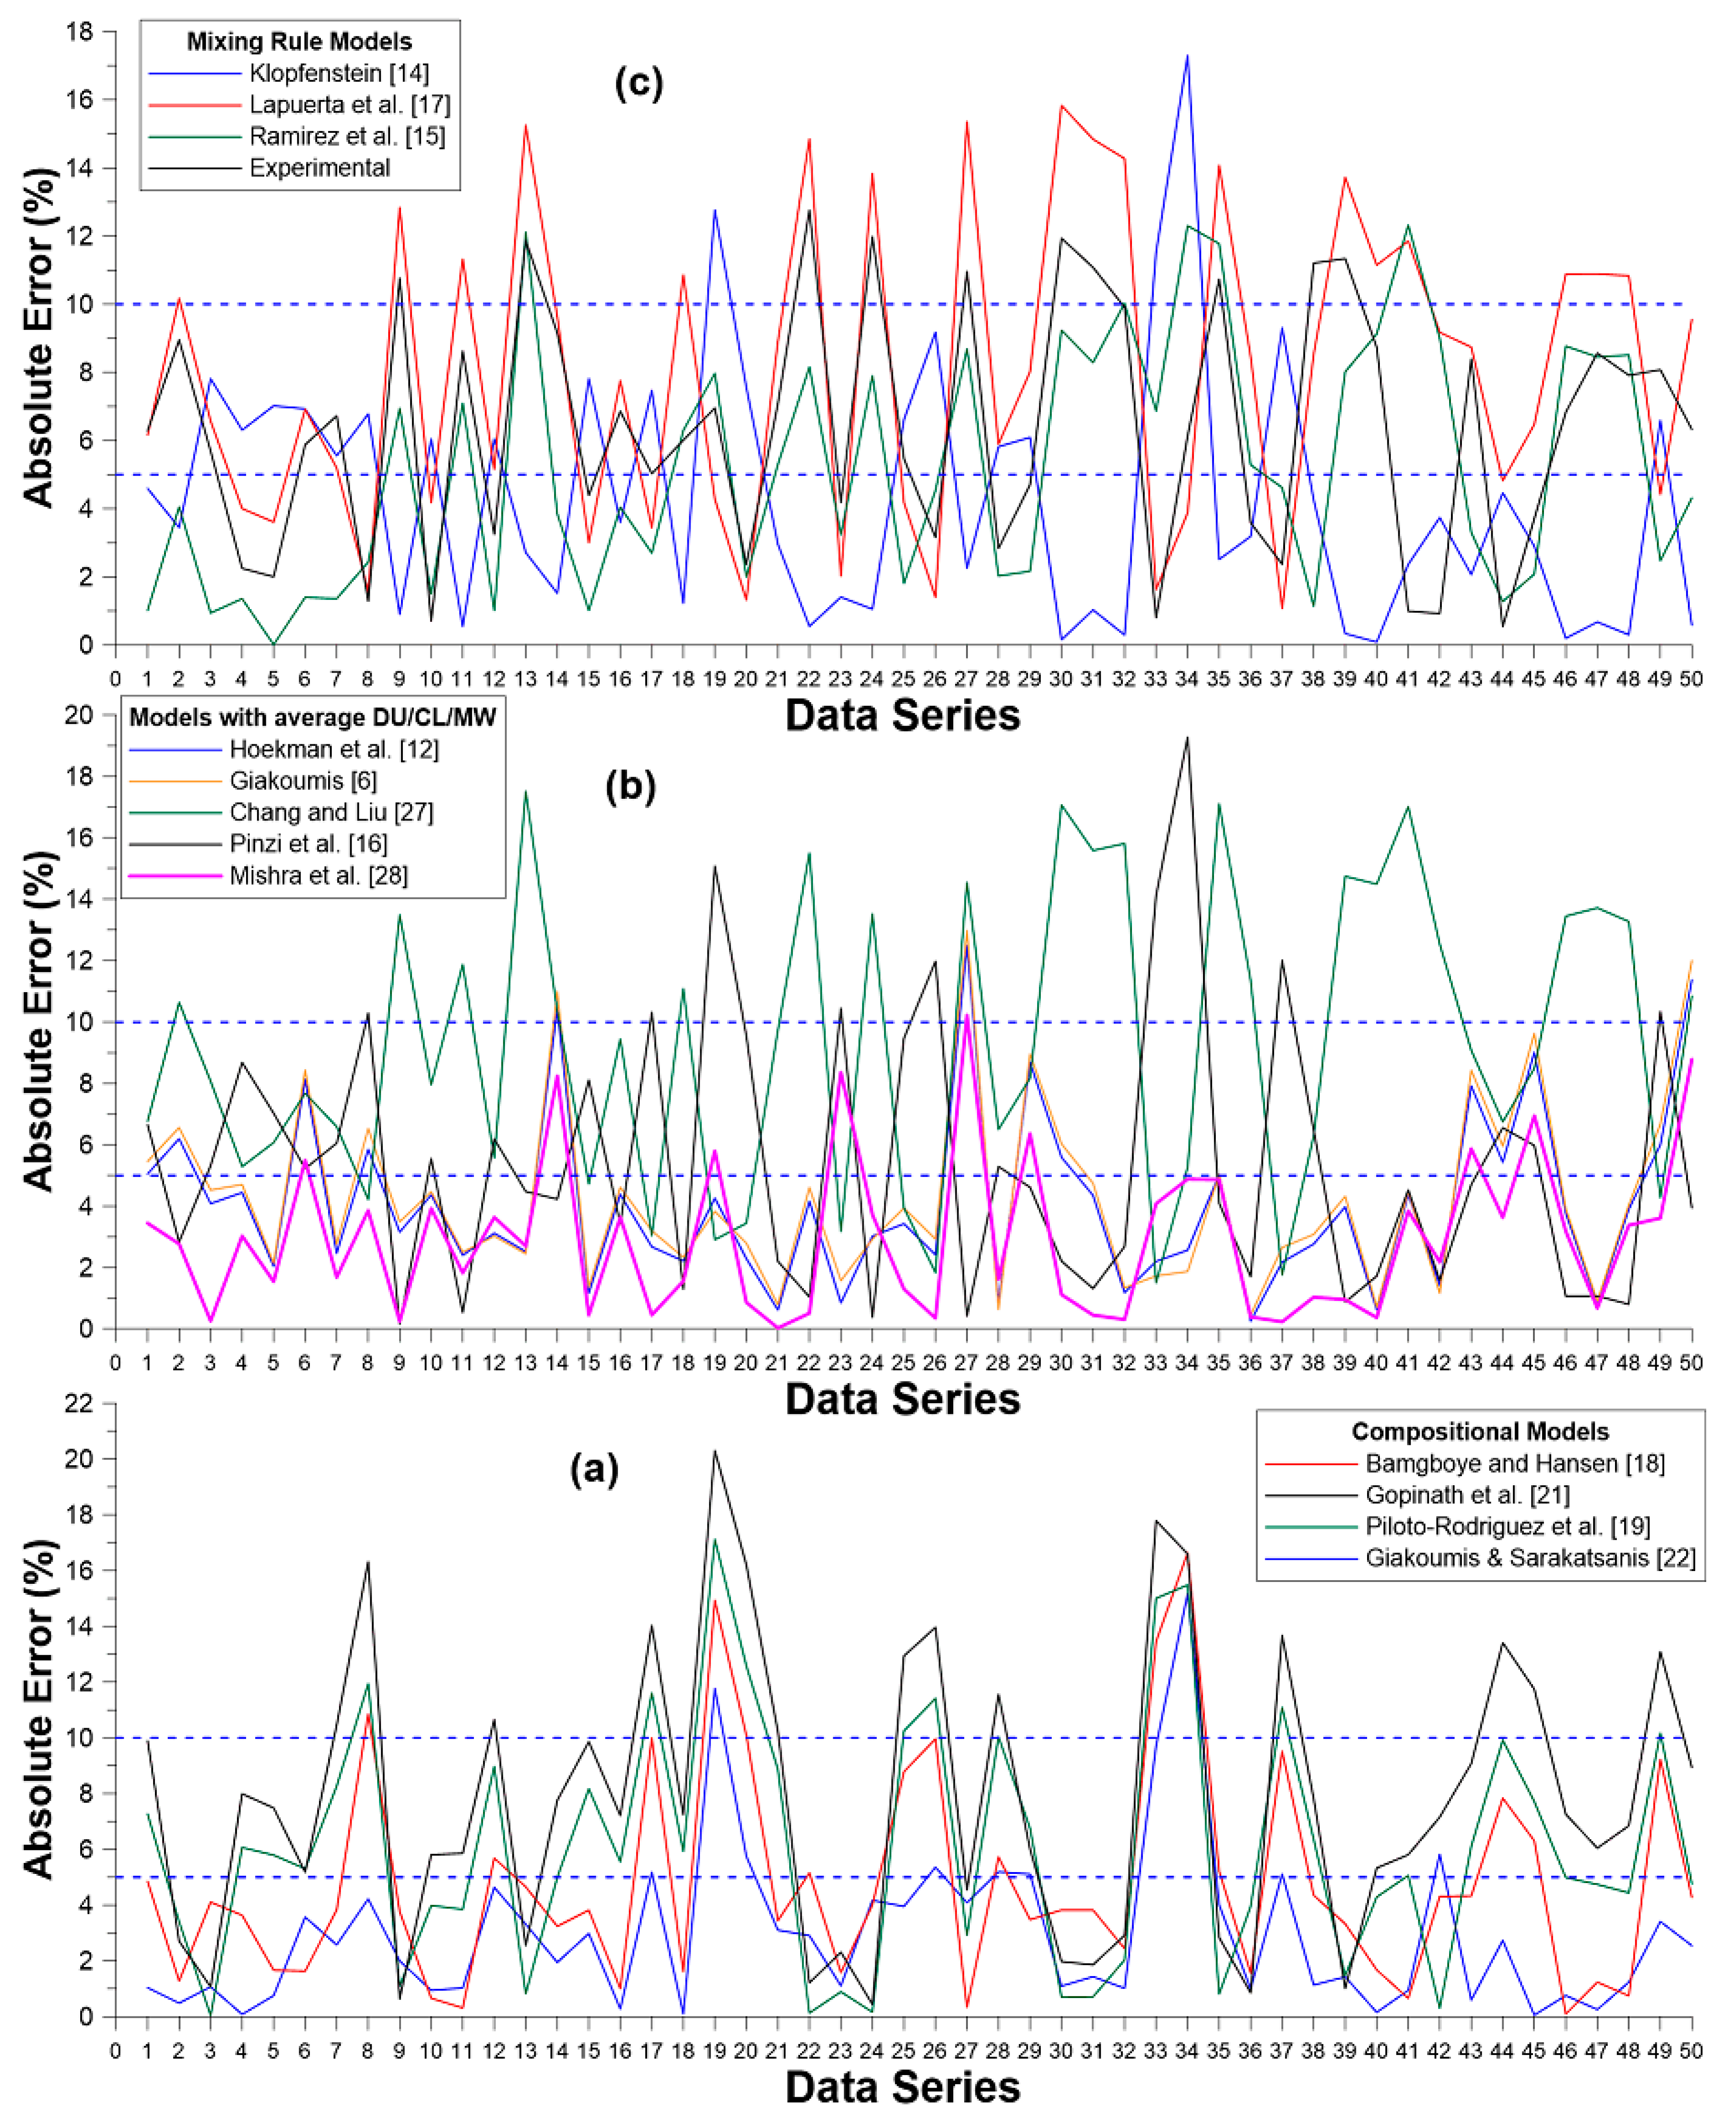
A more detailed picture of each model’s errors is provided in
Figure 6; it is further analyzed in
Table 6, which provides the instances of higher than 5% and 10% absolute errors from all models. As evidenced in
Table 6, the model by Mishra et al. [
28] is best here (only one instance with higher than 10% error and nine occurrences with higher than 5%); very close second was the model by Giakoumis and Sarakatsanis [
22] (two and 10 occurrences respectively). On the other hand, all mixing rule models manifest at least 20 out of 50 predictions with higher than 5% error. Lastly, it is important to note that there was no instance of higher than 20% error in any of the models.
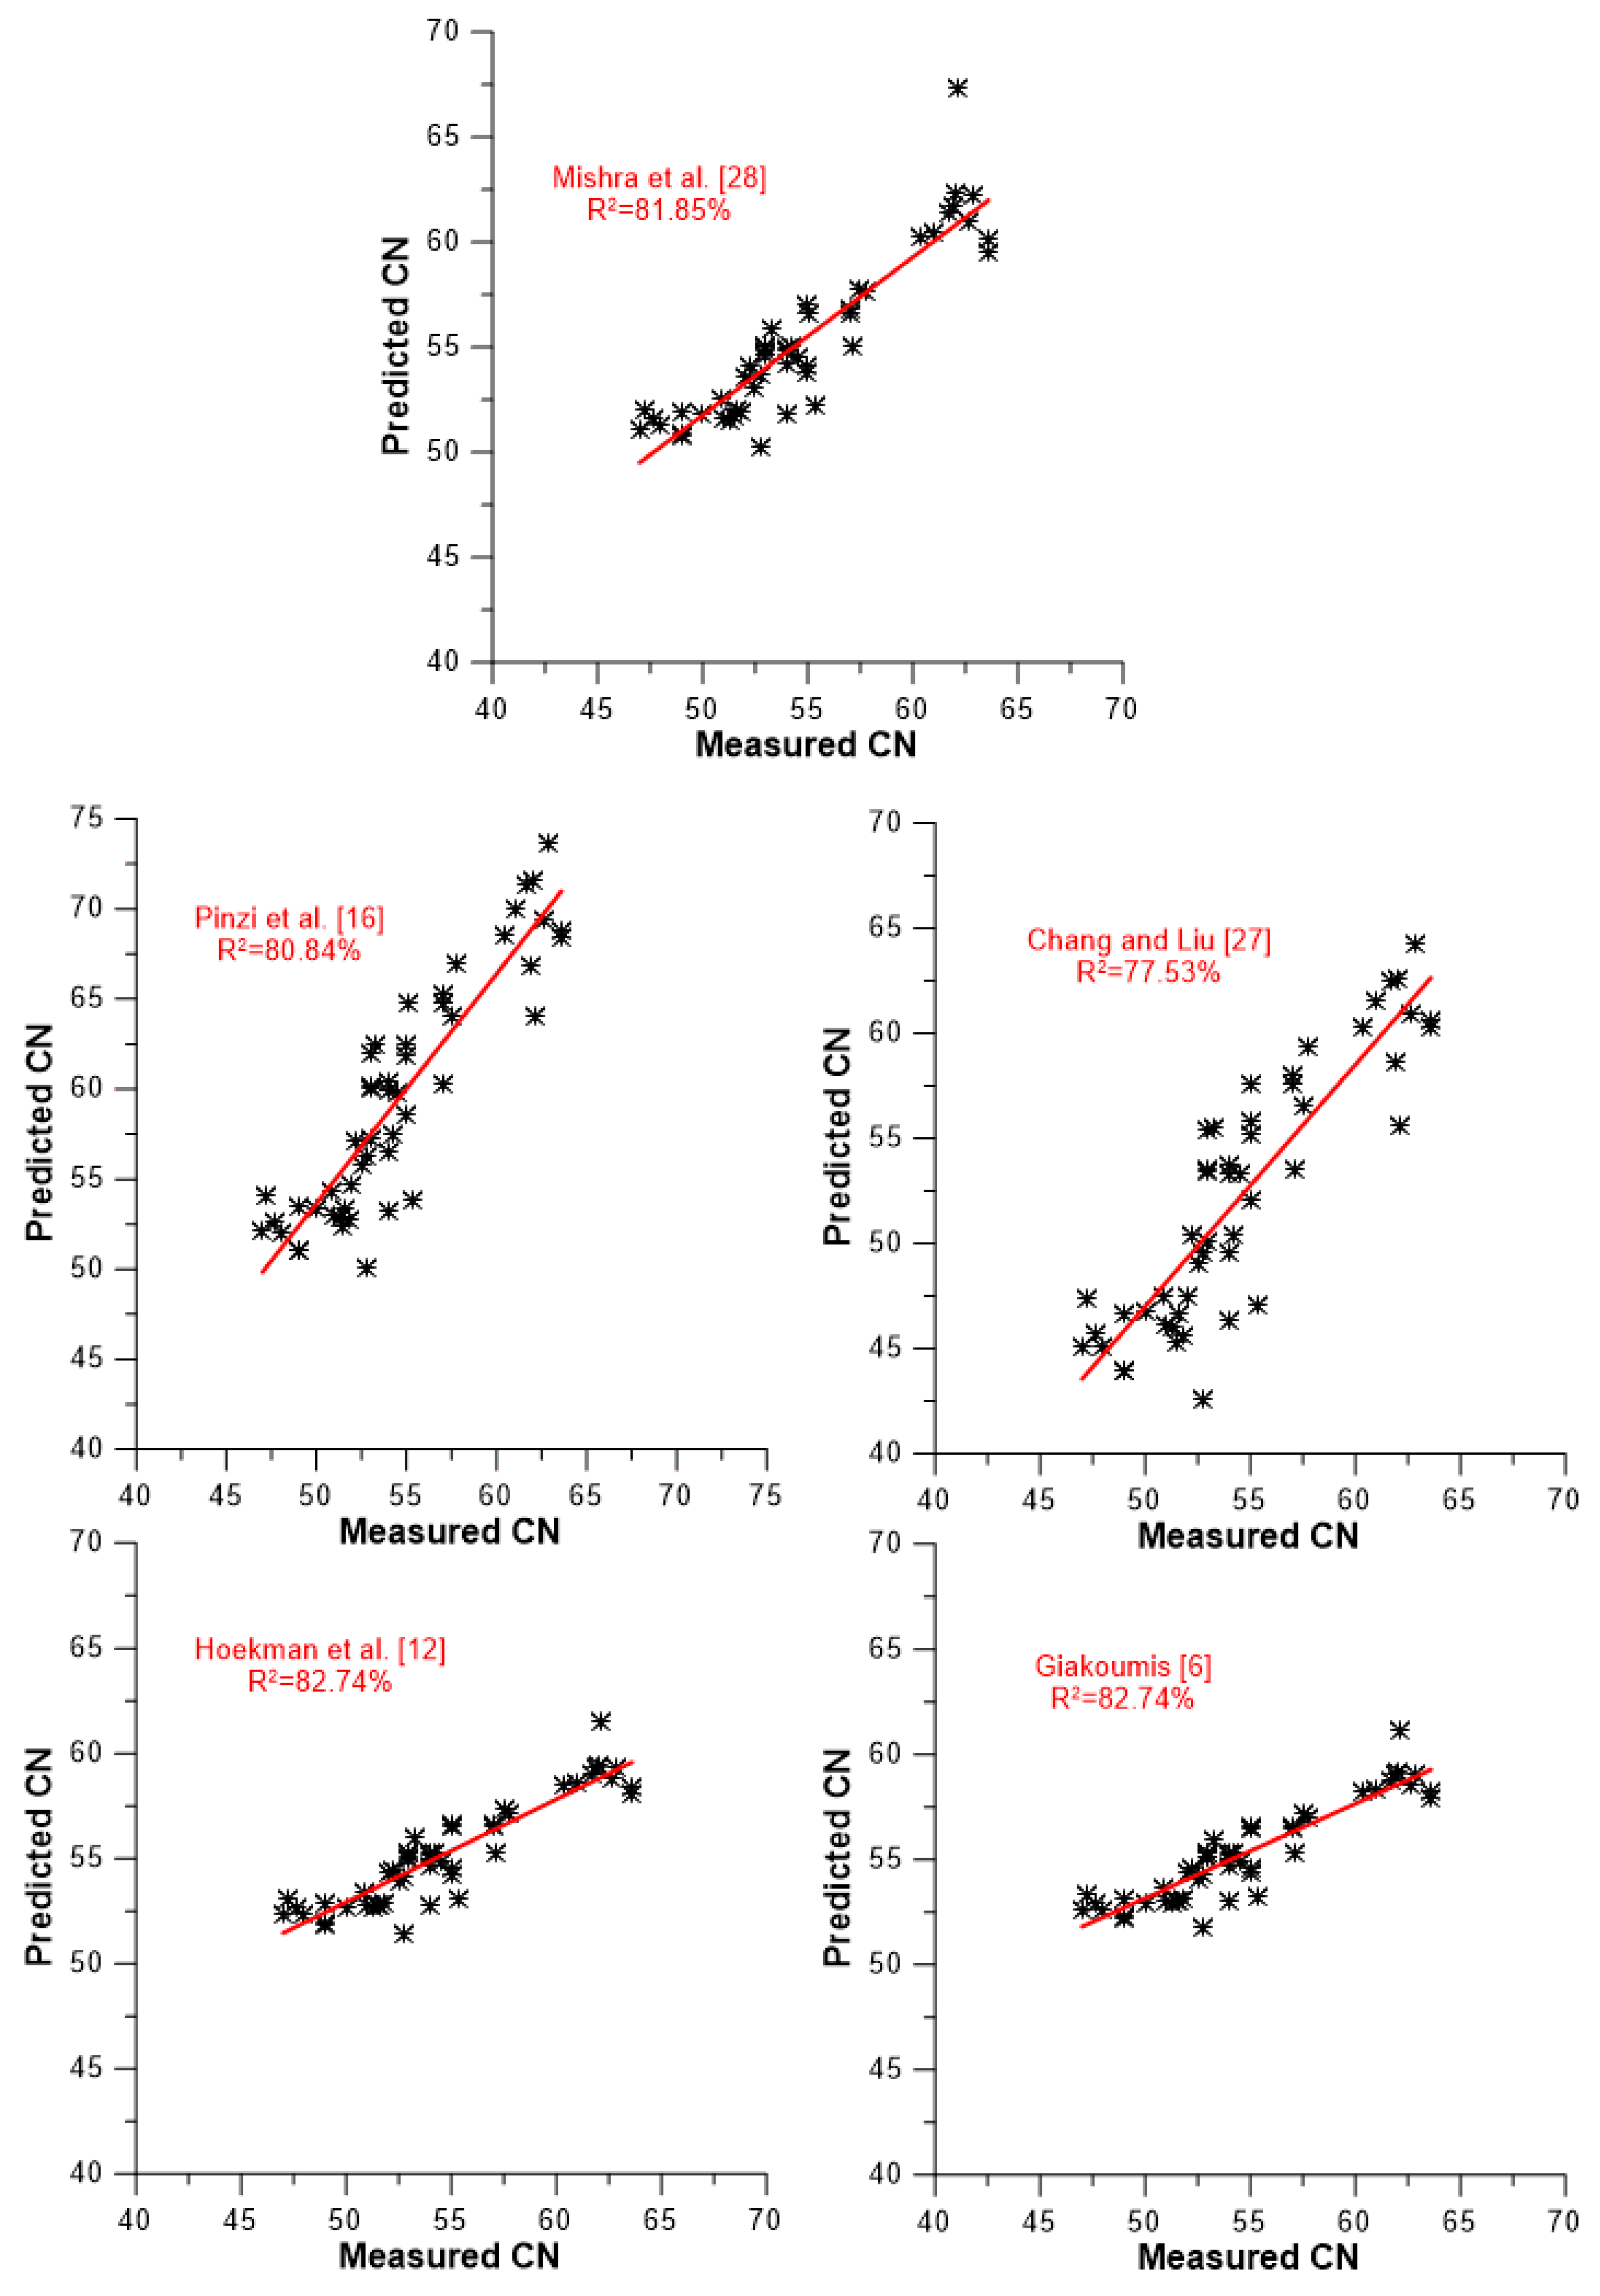
A slightly different picture of the models’ predictive capabilities against the data set of experimental values is demonstrated in
Figure 7,
Figure 8 and
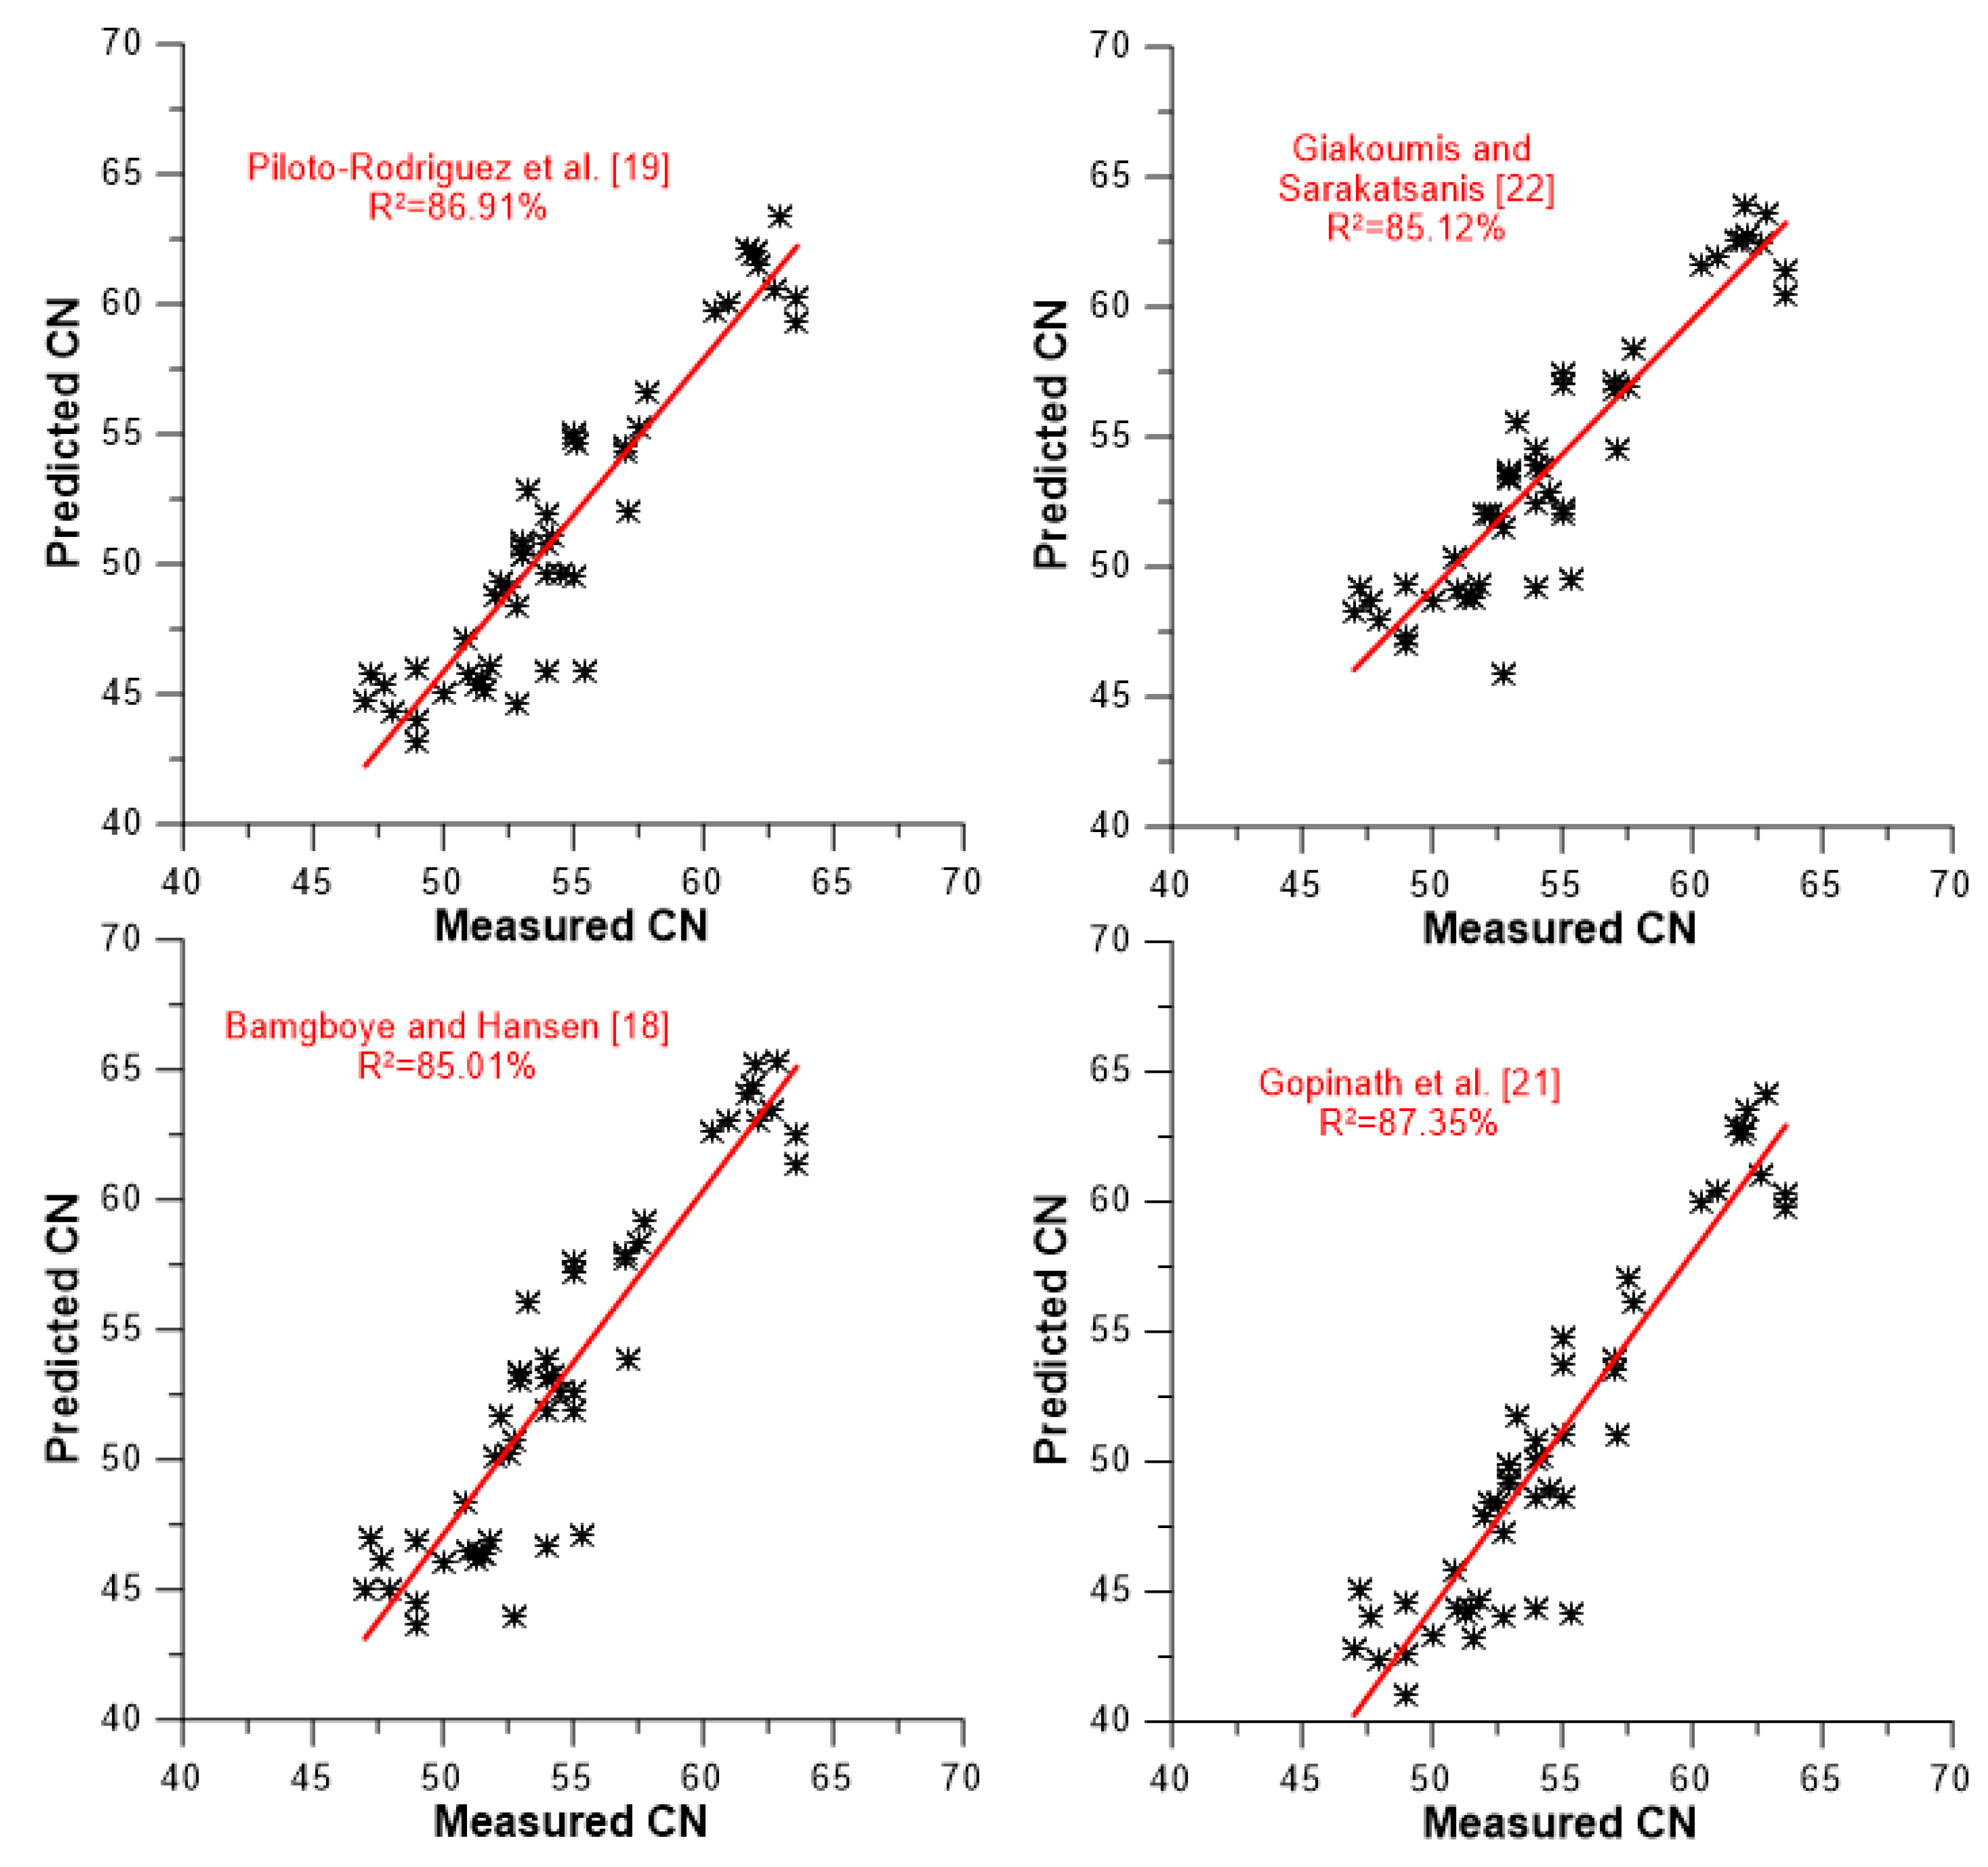
Figure 9. These figures illustrate the degree of accuracy achieved by each model against the experimental data to which it was tested. More specifically,
Figure 7 focuses on the four compositional models,
Figure 8 on the five models taking into account average values for the degree of unsaturation and chain length/molecular weight, and
Figure 9 on the four models that are based on the neat FAMEs’ CN values for their predictions (including the ‘experimental’ one). A closer look at the graphs in
Figure 7,
Figure 8 and
Figure 9 reveals that two discrete groups of CN values can be identified. One is located between CN 40 and 56, and another above CN 60. The former corresponds to vegetable oil-derived biodiesels, and the latter mostly to animal-derived ones (palm is included here too). The following findings can be reached from the results depicted in
Figure 7,
Figure 8 and
Figure 9 and
Table 7.
All models present fairly satisfactory accuracy, ranging from 77.5% (Chang and Liu [
27] and Ramirez-Verduzco et al. [
15]) up to 87.35% for the model by Gopinath et al. [
21]. No correlation seems to be markedly superior compared to the others (this was a usual claim by many research groups when introducing their own predictive model).
The four compositional models seem to possess cumulatively the best predicting qualities (
Figure 7 and
Table 7). Moreover, their R
2 values are fairly consistent, ranging from 85.01 to 87.35%, i.e., within only 2.34 percentage points. Obviously, omitting (or adding) a few experimental data lines might change the differences between them, even in terms of their order (see discussion at the end of the section). However, this would not change the fact that they seem to be more accurate in their predictions than the models of the other two categories.
Interestingly, the two models that only take the degree of unsaturation into consideration (lower two sub-graphs of
Figure 8) manifest very satisfactory predictions, with identical R
2 values of 82.74% (recall from the analysis of
Section 3.2 that the respective equations were relatively similar, and that the degree of unsaturation has a strong and clearly linear effect on CN).
Despite their sounder theoretical basis and the much more complex equations involved, the models that incorporate the effects of both DU and molecular weight or chain length were not proven to be notably superior in their predictions. Another interesting feature of the models of this category (
Section 3.2) is that they present the greatest variability in their predictions, ranging from 77.53 to 82.74%, as indicated in
Figure 8.
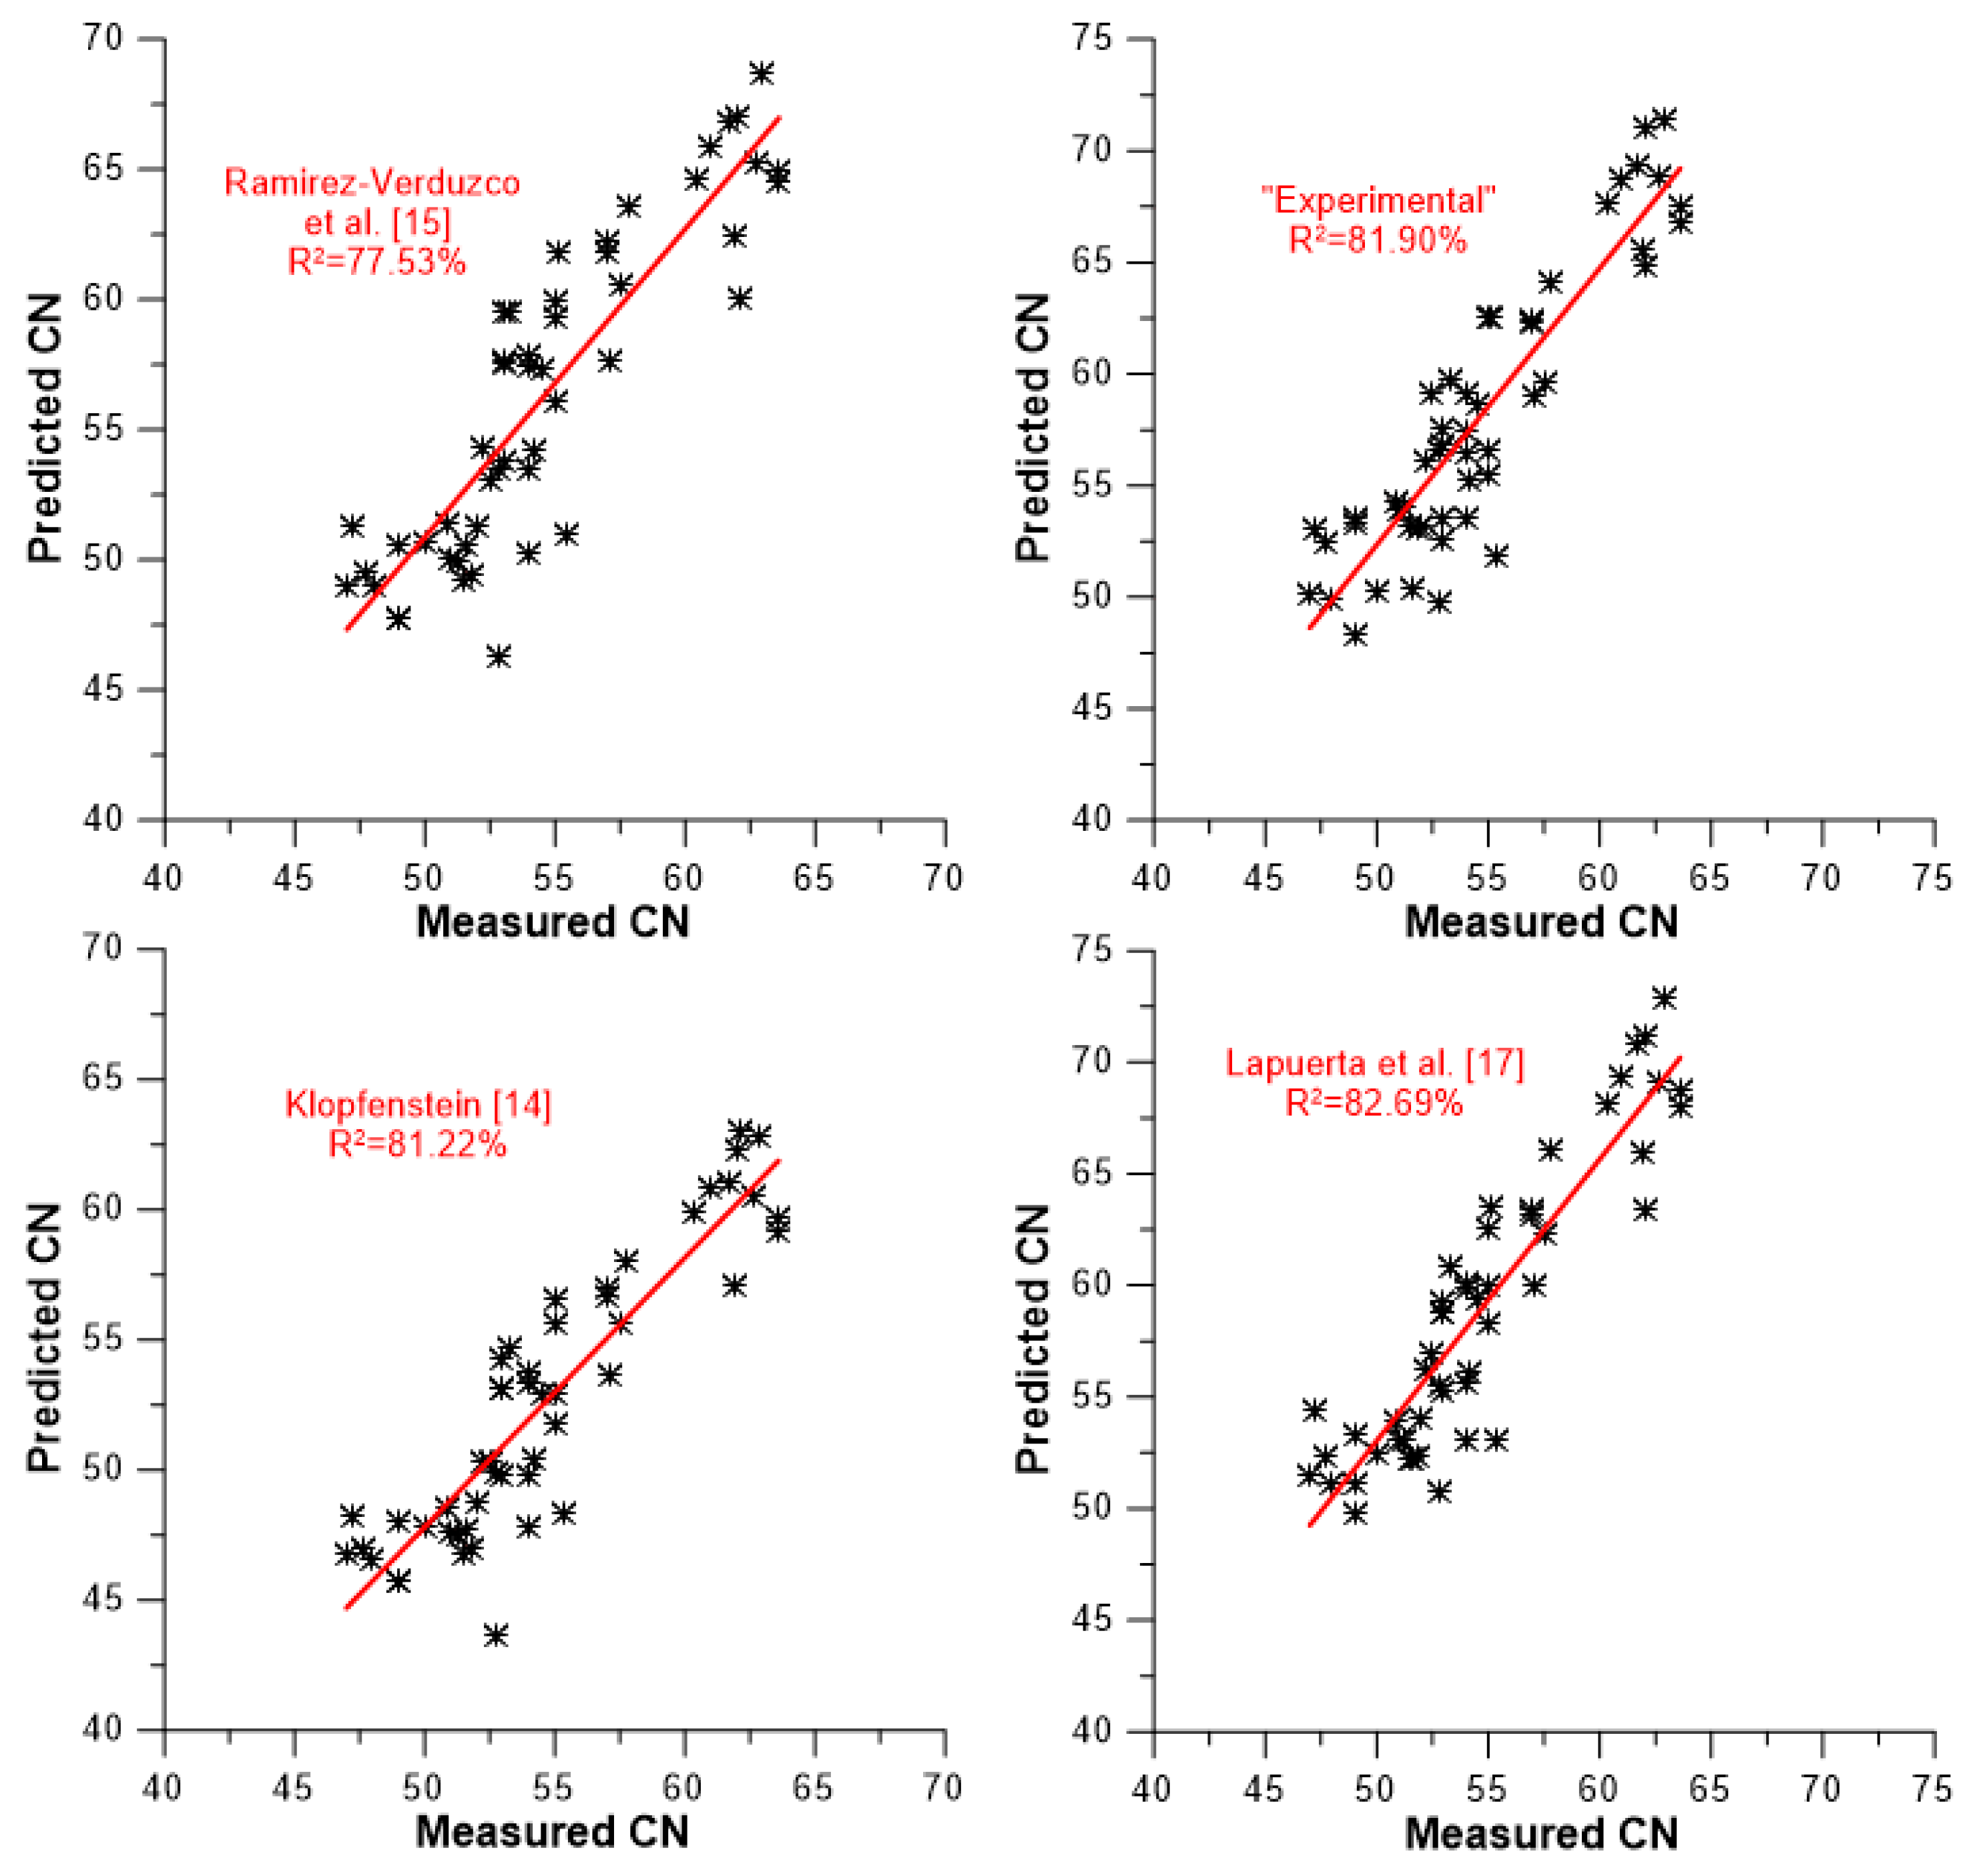
With respect to the models that predict the individual FAME’s CN and then apply a mixing rule for the biodiesel (
Section 3.3), the model by Lapuerta et al. [
17] is best (R
2 = 82.69%), followed by the ‘experimental’ one (81.90%). Recall from the discussion of
Figure 3 that the model by Lapuerta et al. [
17] was identified as the one whose predictions were closest to the experimental values, hence the fairly similar coefficients of determination. Nonetheless, as
Table 6 and
Figure 6 indicate, the model by Lapuerta et al. [
17] suffers from several high errors in its predictions (much more than the other models; the same holds true for the model by Pinzi et al. [
16] and Gopinath et al. [
21]). The Klopfenstein model [
14] (R
2 = 81.22%) is close to the best two of this category, whereas that of Ramirez-Verduzco [
15] demonstrates a lower predictive level (R
2 = 77.53%). The R
2 values of this category are within 5.16 percentage points.
The next part of the investigation in the predictive capability of the CN models was to identify possible systematic faulty behavior in the models’ predictions under specific conditions. The following were identified (although no conclusive results could be reached):
In general, compositional models are expected to be less capable in predicting the cetane number for those (rather unusual cases of) methyl esters that are rich in fatty acids not included in their MLR equations. Excluding the compositional models, the other equations incorporate, by default, all fatty acids’ effects in their equations; hence, they are better equipped in this regard.
Interestingly, all four compositional models proved inefficient in two cases, despite the fact that the only detected FAs were included in their equations. The first case concerned line 19 of
Table 4. The ME being tested here is cottonseed, and its FA composition consists only of FAs included in the four compositional models equations. Moreover, the reported CN is within the acceptable limits, as the survey in [
6] confirms. Yet, all four compositional models manifest high errors in their predictions, in the order of 11.8‒20.3%, which is not the case for most of the other examined models (that is why the specific data line was not excluded from the analysis). The exact same observation can be made with reference to line 33 in
Table 4 (soybean ME). For both incidences, no clear explanation can be provided, except if the experimental values are incorrect. All four models’ CN predictions are in both cases between 44 and 50 and the measured values between 54 and 55.4.
Three of the compositional models (that of Bamgboye and Hansen [
18], Gopinath et al. [
21], and Piloto-Rodriguez et al. [
19]) exhibit most of their largest errors for high DUs (1.50 and above). This might indicate overestimation of the unsaturation coefficients in the respective equations. Interestingly, this trend is not observed for the fourth model of this category, namely, the one by Giakoumis and Sarakatsanis [
22]. The models of the other two categories do not suffer from this problem (faulty predictions for MEs with high DUs), with the exception of the one by Chang and Liu [
27].
For low DUs, on the other hand, it is the model by Pinzi et al. [
16], and to a lesser extent, the Lapuerta et al. [
17] and the experimental ones, that produce their largest errors. This might indicate errors in the short-chain saturated FAMEs CN values.
The model by Chang and Liu [
27] seems to also suffer from wrong predictions when the chain length is very low; this might suggest underestimation of the CL constant in Equation (9).
The models by Lapuerta et al. [
17] and Pinzi et al. [
16] were found to lead to several faulty predictions (18 and 22 respectively with absolute error higher than 10%) for biodiesels possessing high CN values (above 60).
Lastly, a sensitivity analysis was conducted regarding the effect that the length of the data series has on the models’ prediction.
Table 8 provides the R
2 values for three cases: a) when only the first 25 data lines from
Table 4 are taken into consideration; b) when the data lines from 16 to 40 are considered; and c) when the data lines from 26 to 50 are accounted for. As evidenced, reducing the data sample affects the reached coefficients of determination. Nonetheless, the general trends are largely unaffected, e.g., the four compositional models are always the best, the models by Chang and Liu [
27] and Ramirez-Verduzco et al. [
15], the ones with the lowest R
2 etc. It is very interesting that, in general, all models seem to behave in a uniform way when fewer data are considered, i.e., they all improve or deteriorate in their predictions. In light of these arguments, it is believed that the complete set of 50 data lines from
Table 4 and
Table 5, as summarized in
Table 7 and
Figure 7,
Figure 8 and
Figure 9, is indeed representative of the models’ predictive capability.
5. Summary and Conclusions
A detailed review of the existing literature on biodiesel CN predictive correlations based on the fatty acid composition was performed gathering, in total, sixteen models. In the end, 13 models were compared against a broad/representative data set of 50 experimental FA composition and CN values carefully selected from a variety of literature sources. It is believed that the amount of experimental data, as well as their variability, is adequate to establish trends and reach some reliable conclusions.
All models proved their satisfactory predictive capability, with better results reached by the four compositional models (R2 ranging between 85 and 87.35%). The equations based only on the average degree of unsaturation were proven to be very effective (R2 = 82.74%). Surprisingly, more detailed models, incorporating both the effect of the (average) degree of unsaturation and that of the average chain length, with more complex, e.g., quadratic, form, did not lead to better predictions (R2 ranging from 77.53 to 81.85%). Models based on neat methyl esters CN prediction for their calculations inherently suffer from the sometimes wide variability of the respective experimental data they rely upon; the two best achieved R2 values are in the order of 81.9% and 82.7% i.e., 4–5 percentage points lower than the values reached by the compositional models. Regarding the errors from the predictions, no modeling category exceled. One compositional and one model based on the average DU/CL were identified as the best here.
Overall, the models by Gopinath et al. [
21] and Piloto-Rodriguez et al. [
19] exceled in the R
2 values but suffered from many high-error predictions. That of Mishra et al. [
28] was the one with the lowest overall errors but a rather moderate R
2 value. The model by Giakoumis and Sarakatsanis [
22] was proven to be the most cohesive of all, exhibiting the third best R
2 value combined with the second lowest errors. That of Bamgboye and Hansen [
18] was quite effective too, being fourth in terms of R
2 and fifth in terms of the lowest errors.
Based on the large set of experimental data, a few trends were also identified regarding possible inefficiencies of the various models at extreme DU, CL and CN values, although no conclusive results can be established.
It is believed that the results from this study can prove useful to researchers and institutions with respect to simulation and planning, particularly when taking into account the quite challenging experimental determination of cetane number.


