Article

Identification of Optimal Parameters for a Small-Scale Compressed-Air Energy Storage System Using Real Coded Genetic Algorithm

1
Laboratoire de Modélisation et de Simulation Multi Echelle (MSME), CNRS UMR 8208, Université Paris-Est, 5 Bd Descates, F-77454 Marne-la-Vallée CEDEX 2, France
2
Laboratoire de Thermique et Energie de Nantes (LTEN), CNRS UMR 6607, Université de Nantes, La Chantrerie, Rue Christian Pauc, B.P. 50609, F-44306 Nantes CEDEX 3, France
3
GEPEA UMR CNRS 6144, BP 406, 37 boulevard de l’Université, 44602 Saint Nazaire, France
*
Author to whom correspondence should be addressed.
Energies 2019, 12(3), 377; https://doi.org/10.3390/en12030377
Submission received: 31 October 2018 / Revised: 7 January 2019 / Accepted: 8 January 2019 / Published: 24 January 2019

Abstract

:
Compressed-Air energy storage (CAES) is a well-established technology for storing the excess of electricity produced by and available on the power grid during off-peak hours. A drawback of the existing technique relates to the need to burn some fuel in the discharge phase. Sometimes, the design parameters used for the simulation of the new technique are randomly chosen, making their actual construction difficult or impossible. That is why, in this paper, a small-scale CAES without fossil fuel is proposed, analyzed, and optimized to identify the set of its optimal design parameters maximizing its performances. The performance of the system is investigated by global exergy efficiency obtained from energy and exergy analyses methods and used as an objective function for the optimization process. A modified Real Coded Genetic Algorithm (RCGA) is used to maximize the global exergy efficiency depending on thirteen design parameters. The results of the optimization indicate that corresponding to the optimum operating point, the consumed compressor electric energy is 103.83 kWh and the electric energy output is 25.82 kWh for the system charging and discharging times of about 8.7 and 2 h, respectively. To this same optimum operating point, a global exergy efficiency of 24.87% is achieved. Moreover, if the heat removed during the compression phase is accounted for in system efficiency evaluation based on the First Law of Thermodynamics, an optimal round-trip efficiency of 79.07% can be achieved. By systematically analyzing the variation of all design parameters during evolution in the optimization process, we conclude that the pneumatic motor mass flow rate can be set as constant and equal to its smallest possible value. Finally, a sensitivity analysis performed with the remaining parameters for the change in the global exergy efficiency shows the impact of each of these parameters.

1. Introduction

The security and reliability of electricity grid need the introduction of a storage system [1]. To these two main objectives of energy storage one can add the reduction of greenhouse gas emissions. Of importance, due to the increased consumption of fossil fuels, the amount of CO 2 emitted increased up to threefold between 1960 and 2008, today reaching more than 32,000 million tons per year. The climate change observed due to these emissions has driven many countries to turn to renewable energy (RE) sources for electricity production to retain global warming within a 2% range [2,3]. However, these sources are strongly related to meteorology and are intermittent [4]. One of the solutions developed to overcome the problem of intermittency is to couple them with an electrical storage system [5,6]. The storage system will be able to play two roles, namely protection and production. By protection it is meant that the system must be able to quickly restore (the response time in the order of a few minutes [7]) the energy stored during the fluctuation of the resource. By production it is meant that the storage system must be able to produce and sustain independently during a sufficiently long period the demands in the absence of the total source.
In the worldwide industries of electricity both mature technologies are used for large scale electricity storage. They are pump hydro (PH) system and compressed-air energy storage (CAES) systems [2,8,9,10,11,12]. As opposed to the hydroelectric pumping stations, the storage systems with compressed air offer flexibility both in size (smaller volumes) and capacity (ranging from several hundred KW to MW). These advantages give CAES the opportunity to be coupled to the power generation system with renewable sources. That is why many researches propose hybrid wind/CAES systems or photovoltaic plant (PV)/CAES systems [13,14,15,16,17,18,19,20,21]. In periods of low and off-peak energy demand, the CAES system stores electricity in the form of compressed air in a natural or artificial tank. The stored compressed air is released and heated in a combustion chamber burning fossil fuel before being expanded in a turbine connected to a generator for electricity reproduction [11,22,23]. Many studies dealing with the partial or total replacement of combustion chamber exist in the literature [3,24,25,26,27,28]. The heat generated during compression is stored and used to heat air before expansion; such systems are called adiabatic or advanced adiabatic compressed-air energy storage (AA-CAES). Unfortunately, conventional and AA-CAES used natural reservoir (underground caverns, rock formations) for storing compressed air which reduces its penetration potentiality due to the geological restriction [29,30]. Therefore, the attention has been recently focused on the usage of artificial air-tanks. The resulting system is known as micro or small-scale compressed-air energy storage system (SS-CAES). Such system can be used at isolated sites with RE sources or in the residential sector to store electricity during off-peak hours. Generally, in SS-CAES system, fuel combustion is not needed because the compression heat is collected, stored, and re-used to heat the compressed air before being expanded in the turbine or the reciprocating air motor. If the cooling energy in the discharged air is collected, the SS-CAES may act as a tri-generative system, for simultaneous production of cold, heat and electricity [4,9,31,32,33,34,35,36].
To evaluate the performance of SS-CAES system by means of numerical simulations, numerous thermodynamics models have been developed during recent years. Generally, these models are based on the first law of thermodynamics with imposed design and operating parameters of the analyzed systems [9,32,34]. Unfortunately, energy analysis does not provide the information about the locations of energy degradation in a process and does not quantify the irreversibility in different components of the storage system. Therefore, based on both the first and second laws of thermodynamics, exergy analysis appears to be a powerful tool to overcome the limitations of energy analysis [37].
The purpose of this study is to develop a realistic approach to investigate the performance of SS-CAES system using pressure vessels without fossil fuel. This approach is based on the exergy analysis method. The required equations for modeling different components of the system are presented. These equations are used to build the objective function which is the global exergy efficiency of the storage system. We aim to maximize this objective function depending on thirteen design parameters and seven constraints. These design parameters are respectively: number of compression stage (n), compressor pressure ratio ( π ), volume of air storage tank ( V t ), pressure ratio of high-pressure and low-pressure expansion stages ( β H P , β L P ), inlet temperature of high-pressure and low-pressure expansion stages ( T H P i n , T L P i n ), isentropic efficiency of compressor ( η I s C ), isentropic efficiency of pneumatic motor ( η I s , m ), mechanical efficiency of compressor ( η m C ), mechanical efficiency of pneumatic motor ( η m m ), compressor and pneumatic motor mass flow rate ( m ˙ C , m ˙ m ). The ranges of each parameter have been defined in the light of available technology. The optimization is performed using a modified Real Coded Genetic Algorithm (RCGA) in which two crossover methods are randomly selected from one generation to another during evolution. To improve the search efficiency of the RCGA, the Dynamic Random Mutation (DRM) method was used. The coupled modified RCGA-DRM could effectively determine the set of optimal values of influencing parameters that maximizes the global exergy efficiency of the SS-CAES system without fossil fuel used. MATLAB ® software is used for all computations (Version 9.1 developed by MathWorks, Inc. whose the headquarters is located in the city of Natick, in the state of Massachusetts in the USA).

2. System Description

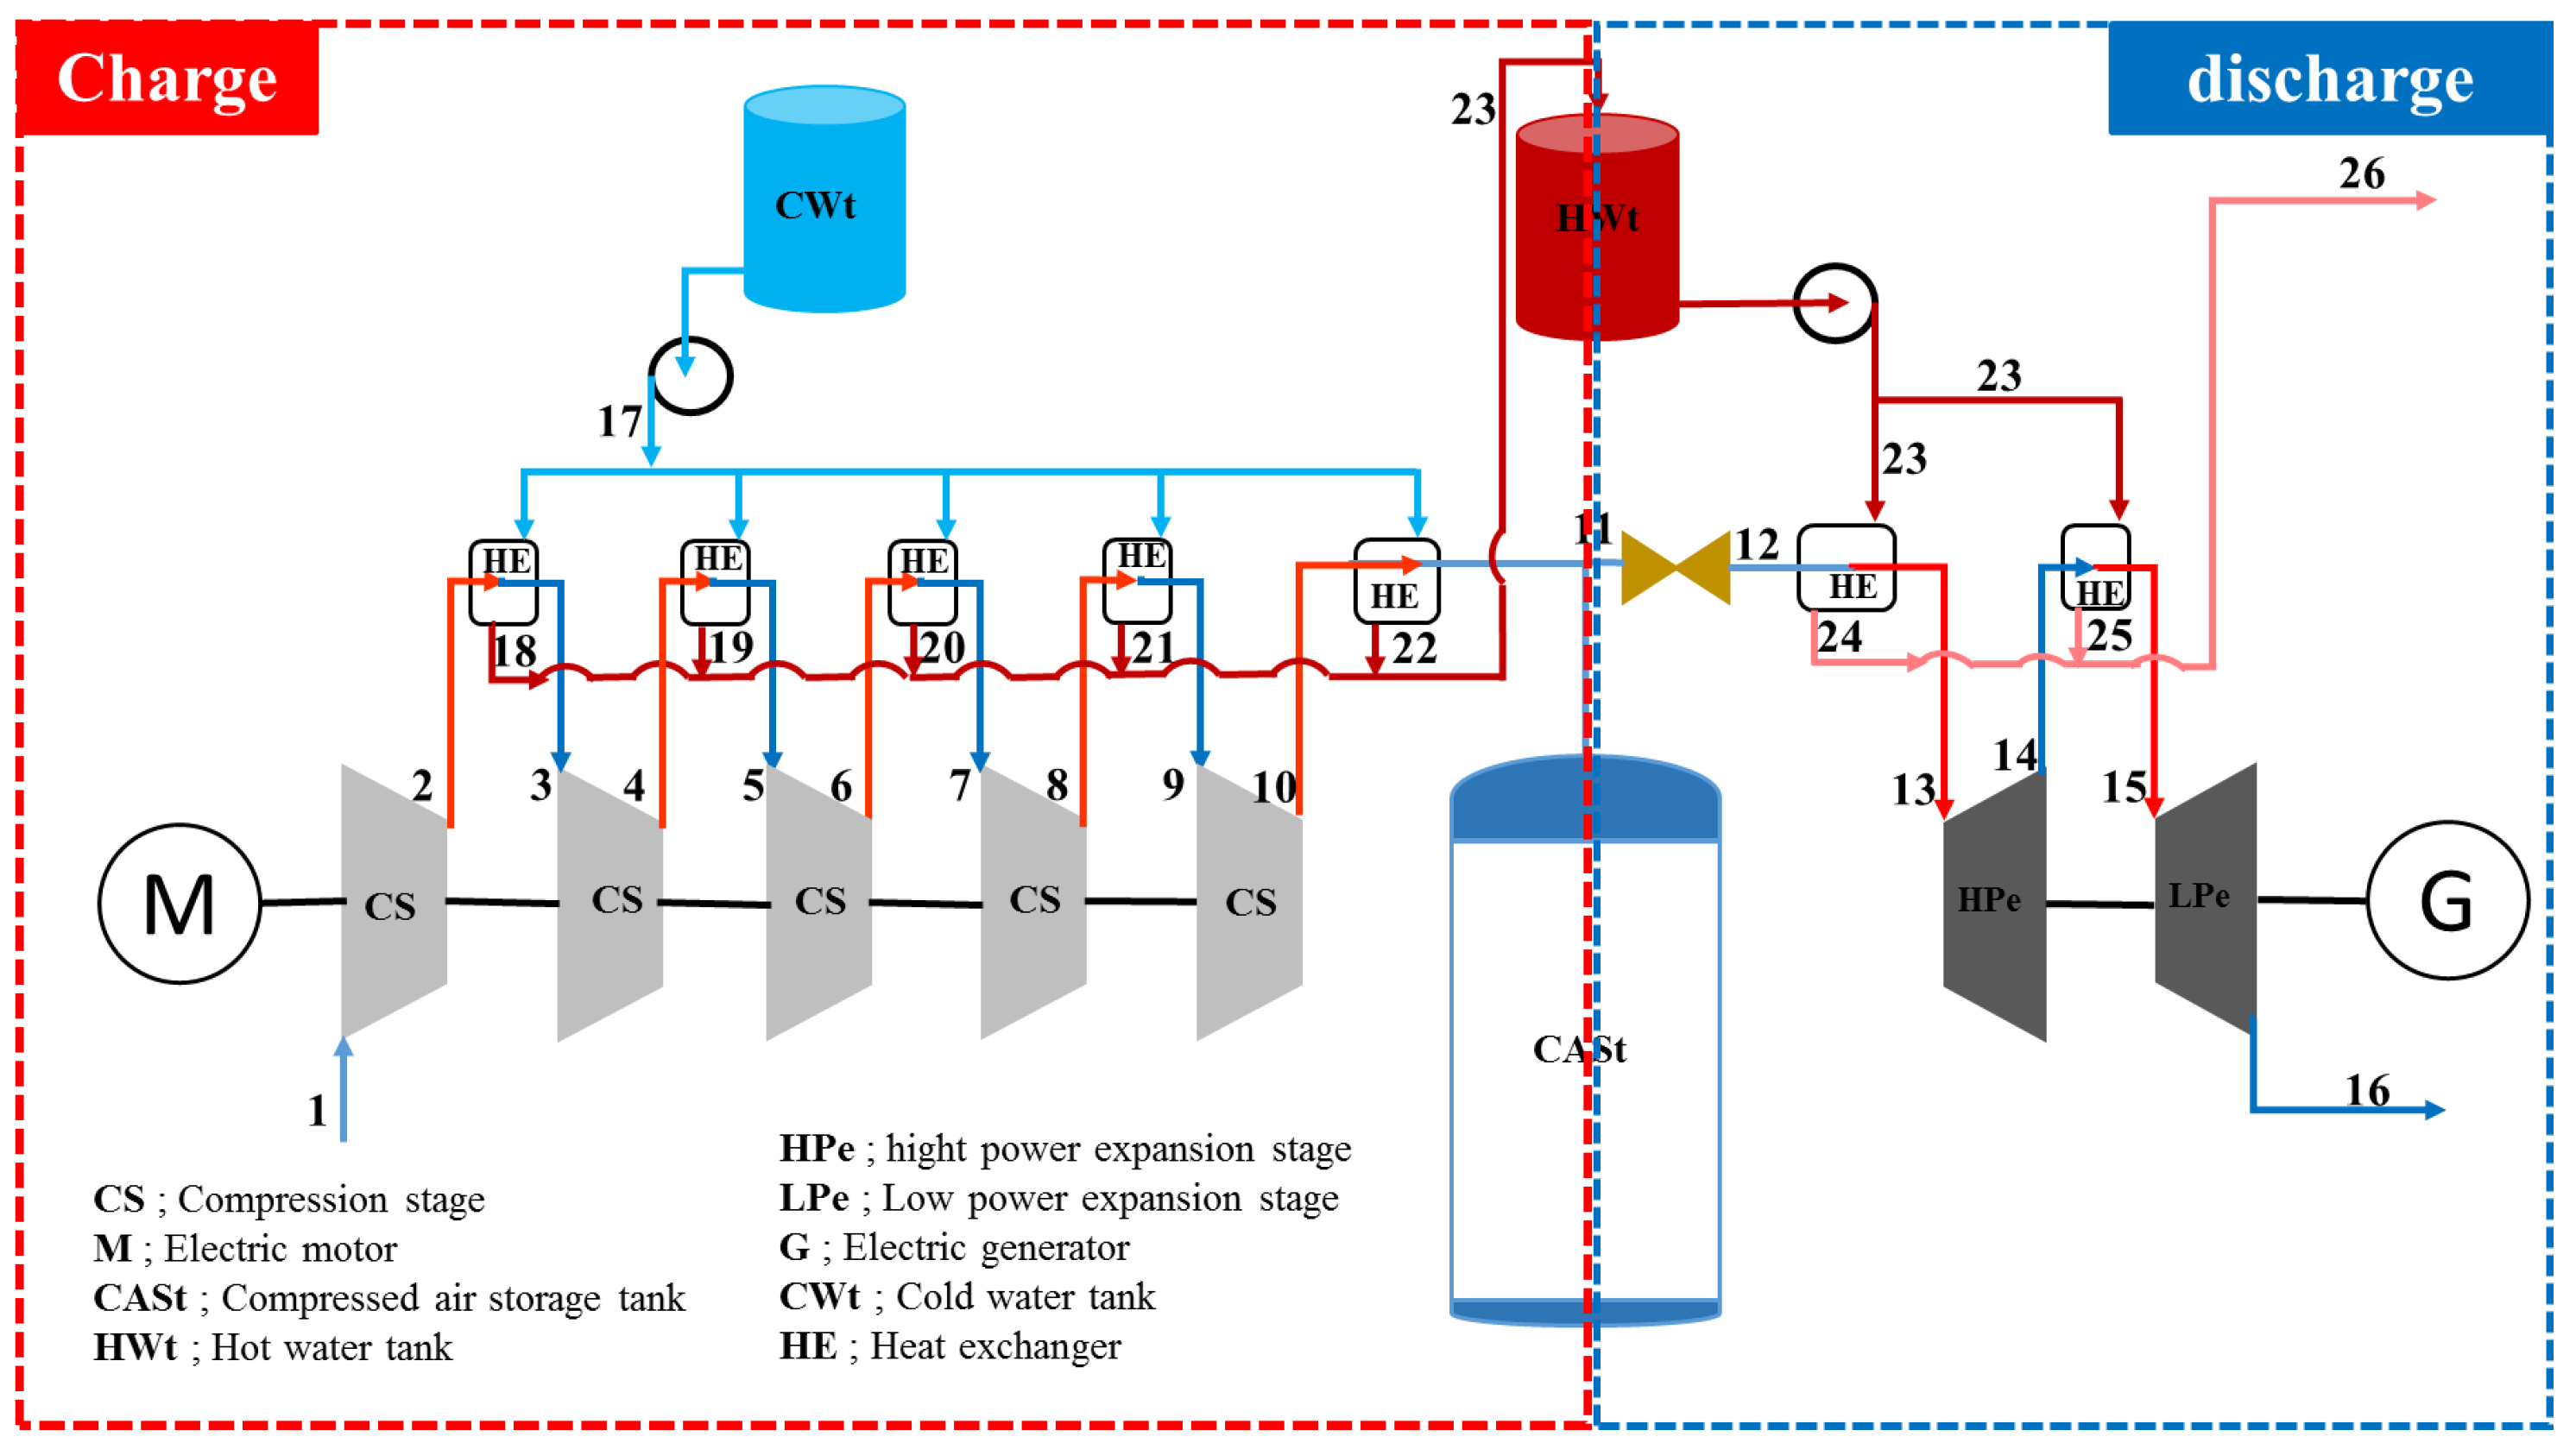
The system to optimize is shown in Figure 1. The system operates in two phases: charge and discharge. The first phase is also known as compression phase, which is composed of multistage (CS) reciprocating compressor and intercoolers (HE). In this phase, the compressor is powered by the electrical energy available on grid during off-peak load hours or by the electricity generated by a RE source. Intercoolers are used to recover the compression heat with water as the heat transfer fluid. Hot water is stored in an isolated thermal storage tank (HWt). Cooling of compressed air after each stage has the advantage of reducing the required electrical power of the compressor and increasing the compressed-air storage tank efficiency due to the high density of the cold compressed air. High-pressure cold air from compression and cooling is stored in compressed-air storage tank (CASt). In conventional or diabatic CAES systems, at peak load hours, the stored air is released from the underground cavern, throttled through the regulating valve, and heated by fossil fuel burning in the combustion chamber (CC). However, in an AA-CAES and SS-CAES, the hot water produced during the compression phase can be used to heat air before each stage of expansion through heat exchangers, thus replacing CC. Two stages pneumatics motor (HPe and LPe) coupled to electric generator (G) are used to achieve the expansion process and generate electricity. In Figure 1, the points i for i 1 , 2 , . . . , 16 denote the states of air transformation during all storage process and i 17 , 18 , . . . , 26 denote the states of water transformation during all transformation storage process.

3. Thermodynamic Modeling

To carry on the optimization problem, it is necessary to build the objective function which in this study is the global exergy efficiency. The analytical form of the objective function results from the thermodynamic analysis of each component of the system. Due to the complexity of the system some simplifying but basic assumptions are made following previous works on thermodynamic modeling of energy systems with air as working fluid [38,39,40,41,42]:
  • All system components operate under a steady state condition except the CASt for which a dynamic modeling is performed to find the filling and discharge time together with the mean temperature in the tank during the discharge process.
  • Air is assumed dry and modeled as an ideal gas.
  • Potential and kinetic energy effects are negligible in the energy and exergy balances.
  • Pressure drop in the components of system is neglected.
  • The reference environment state conditions are T 0 = 20 C and P 0 = 1.01 bar which is also used as the system boundary for energy and exergy analyses.
  • Isentropic efficiency is assumed constant for compressor and pneumatic motor.
  • The mass flow rate of the cooling water is set as constant in every intercooler. Despite the different pressure ratio of expansions stages, we set the mass flow rate of the heating water in each heater as constant and equal to six times that of the cooling water to increase the heat transfer rate and for more simplicity in modeling.
  • All the interpolations in thermodynamics tables to find the thermodynamics properties is done using MATLAB built-in function “interp1”, with “spline” method. The thermodynamics tables are those of Moran book [43].

3.1. Energy Analysis

In this section, the First Law of Thermodynamics is used for all system components to estimate the temperature of the working fluid (air and water), enthalpy and pressure corresponding to each stage of storage system. These properties depend on the design parameters and finally allow one to evaluate the electrical power consumed by compressor, the electrical power produced by generator coupled to the pneumatic motor, the filling and discharge times, the heat produced during the compression process and the required heat to increase temperature of the compressed air during expansion process.

3.1.1. Compressor

For each stage of compression, the output enthalpy is evaluated as a function of the isentropic efficiency:
h c , i o u t = h c , i i n + h c , I s , i o u t h c , i i n η I s C
In Equation (1), h c , i i n is the inlet specific enthalpy of the i-th stage of compressor estimated at the outlet temperature of intercoolers assumed as constant and equal to 35 C except for the first stage where it is estimated at ambient temperature T 0 , h c , i o u t is the outlet specific enthalpy of the i-th stage of compressor if the compression process is isentropic, and η I s C is the isentropic efficiency of compressor.
The outlet isentropic temperature of each compressor stage can be determined from:
S 0 ( T c , I s , i o u t ) = S 0 ( T c , i i n ) + R l n ( π )
Here π is the pressure ratio which is the same for all stages of compression. Since T c , i i n is known, S 0 ( T c , i i n ) would be obtained from Table A-22 in [43], the value of S 0 ( T c , I s , i o u t ) would be calculated with Equation (2), and finally the values of T c , I s , i o u t and h c , I s , i o u t would be determined by interpolation. The outlet specific enthalpy of i-th stage will be calculated with Equation (1) by knowing h c , I s , i o u t , and outlet temperature will be determined by interpolation.
The outlet pressure P c , i o u t of the i-th compression stage can be calculated by knowing the inlet pressure P c , i i n and pressure ratio π as follows:
P c , i o u t = π × P c , i i n
The electrical power consumed by the compressor can then be calculated as
P e l c , c = m ˙ c η e l c , c η m , c i = 0 n h c , i o u t h c , i i n
where P e l c , c (often written as W ˙ e l c , c [43]) is the electrical power consumed by the compressor, η e l c , c is the electric efficiency of the compressor assumed to be constant in this study and equal to 98% (upper value of literature ranges from 90% to 98% [44]), η m , c is mechanical efficiency of compressor, m ˙ c is the air mass flow rate of compressor and n is the number of compression stages.

3.1.2. Intercoolers

To reduce the work-input required during the compression and prevent the compressor from reaching high temperatures, counter flow air-to-water heat exchangers (called intercoolers and after cooler) cool the compressed air between the stages and after the last stage of the process. By knowing the cooling water mass flow rate m ˙ c w as well as its inlet temperature, the specific enthalpy of cooling water at intercooler outlet between (i)-th and (i + 1)-th stage of compression is computed by an energy balance:
h c w , i o u t = h c w , i i n + m ˙ c m ˙ c w h c , i o u t h c , i + 1 i n
Since the inlet temperature of cooling water T c w , i i n is known, its specific enthalpy h c w , i i n is obtained from Table A-22 in [43] and then its outlet temperature T c w , i o u t can be obtained by interpolation.
The heat stored in the hot water tank (HWt) should be equal to the heat exchanged in the intercoolers (the heat losses are neglected). The total heat transfer rate between air and cooling water in intercoolers during air compression process can be calculated as:
Q ˙ h = m ˙ c i = 2 n + 1 h c , i o u t h c , i + 1 i n
The specific enthalpy of cooling water at the inlet of hot water tank is defined as
h c w , t i n = 1 n i = 1 n h c w , i o u t
Knowing h c w , t i n the final temperature of hot water at the inlet of HWt can be obtained by interpolation from Table A-22 in [43].

3.1.3. Pneumatic Motor

The expansion process can be regarded as an opposite thermodynamic process of compression. The output specific enthalpy of high- and low-power stage is respectively, defined as
h m , H P o u t = h m , H P i n η I s , m h m , H P i n h m , I s , H P o u t
h m , L P o u t = h m , L P i n η I s , m h m , L P i n h m , I s , L P o u t
In Equations (8) and (9) the outlet isentropic specific enthalpy of each expansion stage h m , I s , H P o u t and h m , I s , L P o u t are obtained by interpolation in Table A-22 in [43] knowing S 0 ( T m , I s , H P o u t ) and S 0 ( T m , I s , L P o u t ) given respectively by:
S 0 ( T m , I s , H P o u t ) = S 0 ( T m , H P i n ) + R l n 1 β H P
S 0 ( T m , I s , L P o u t ) = S 0 ( T m , L P i n ) + R l n 1 β L P
Here β H P and β L P are the pressure ratios of high-pressure and low-pressure expansion stages respectively, T m , H P i n and T m , L P i n are inlet temperature of air in these expansion stages.
The inlet pressure P H P i n of the high-pressure expansion stage can be calculated knowing the pressure ratios β H P and β L P as follows:
P H P i n = P 0 β H P β L P
The outlet pressure corresponding to each expansion stage is calculated as
P H P o u t = P H P i n β H P
P L P o u t = P H P o u t β L P
The electric power generated by the electric generator coupled to the pneumatic motor during production phase is evaluated as follows:
P e l c , G = m ˙ m η e l c , G η m m h m , H P i n h m , H P o u t + h m , L P i n h m , L P o u t
Here P e l c , G is the electric power produced by the generator, η e l c , G is the electric efficiency of generator assumed to be constant in this study and equal to 96% (value of literature range 90% to 98% [44]), η m m is the mechanical efficiency of pneumatic motor, and m ˙ m is the air mass flow rate of pneumatic motor which is one of the design parameters.

3.1.4. Heater

To eliminate the use of fossil fuels, to prevent the pneumatic motor from reaching low temperatures and to enhance the power production of pneumatic motor, the CCs usually used in conventional CAES system are replaced by counter flow air-to-water heat exchangers, called heater or air preheater. The hot water produced and stored during compression process is used to warm the air up before each expansion stages. With the assumption that HWt process is adiabatic, the inlet specific enthalpy of hot water h h w i n , is known. Then, the specific enthalpy of water at heaters outlet can be respectively expressed as follows:
h h w , H P o u t = h h w i n m ˙ m m ˙ h w h m , H P i n h C A S t o u t
h h w , L P o u t = h h w i n m ˙ m m ˙ h w h m , L P i n h m , H P o u t
Here, m ˙ h w is the heating water mass flow rate and h C A S t o u t is the specific enthalpy at the CASt outlet. The temperature of the water at the heater’s outlet can then be obtained by interpolation from Table A-2 in [43] knowing enthalpy h h w , H P o u t and h h w , L P o u t .
The specific enthalpy of cooling water at the expansion train outlet is defined as:
h h w o u t = 1 2 h h w , H P o u t + h h w , L P o u t
The thermal power required to warm the air up before it is expanded in the pneumatic motor can be computed as follows:
Q ˙ R h = m ˙ m h m , H P i n h C A S t o u t + h m , L P i n h m , H P o u t

3.1.5. Compressed-Air Storage Tank

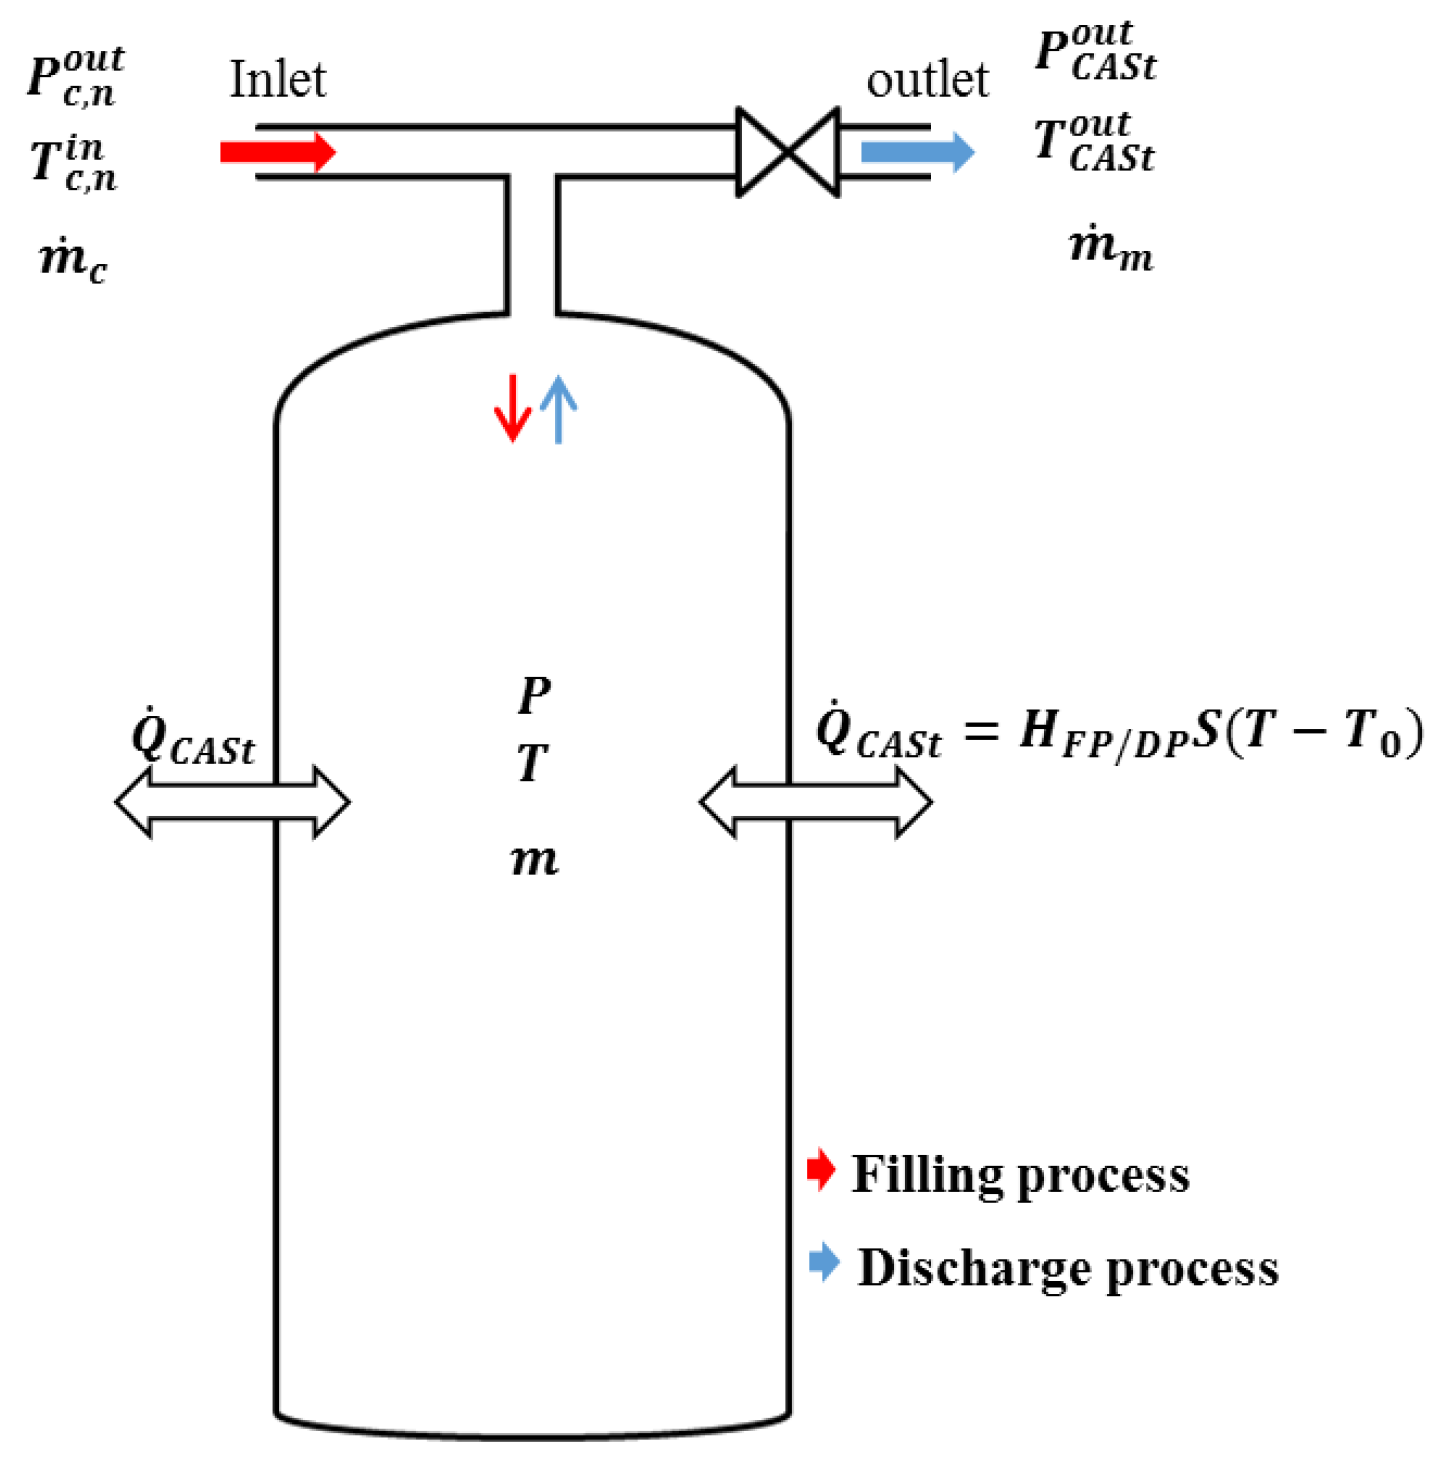
This step is crucial because it allows one to determine the charge and discharge time of the CASt as well as the mean temperature of air at the inlet of heater before the high power expansion stage. We consider CASt as one thermodynamic control volume with the total geometric volume V t . In this study, we assume that the inlet and outlet mass flow rates are constant. The inlet air temperature in the control volume T c , n i n is assumed to be equal to that of air exiting the last cooler (35 C) and the inlet pressure of compressed air P c , n o u t is assumed to be equal to that of air exiting the last compression stage. The exit air pressure P C A S t o u t is set to the inlet air pressure of the air motor P H P i n and its outlet temperature T C A S t o u t is assumed to be the minimum value of temperature inside the control volume. All these assumptions are summarized in Figure 2, where m, P and T represent respectively air mass, air pressure and air temperature inside the tank and Q ˙ C A S t is the thermal power lost through the compressed-air storage tank walls.
Thus, the variations of mass, temperature, and pressure of air in the CASt during filling and discharge process are described by the mass conservation equation, the energy conservation equation and the ideal gas equation of state [43].
d m d t = m ˙ i n m ˙ o u t d m u d t = m ˙ i n h i n + 1 2 ( V i n ) 2 + g Z i n m ˙ o u t h o u t + 1 2 ( V o u t ) 2 + g Z o u t Q ˙ C A S t V t d P d t = R T d m d t + R m d T d t
For the filling process where m ˙ o u t = 0 and m ˙ i n = m ˙ c these laws read:
d m d t = m ˙ c d T d t = 1 m c p R m ˙ c c p T c , n i n T + m ˙ c R T + m ˙ c 2 m ˙ c ρ A C A S t i n 2 + m ˙ c g H t Q ˙ C A S t R d P d t = m ˙ c R V t T + m R V t d T d t
And for the discharge process where m ˙ i n = 0 and m ˙ o u t = m ˙ m these laws read:
d m d t = m ˙ m d T d t = 1 m c p R m ˙ m c p T m ˙ c 2 m ˙ m ρ A C A S t o u t 2 m ˙ m g H t Q ˙ C A S t R d P d t = m ˙ m R V t T + m R V t d T d t
With:
c p ( T ) = A + B T + C T 2 + D T 3 + E T 4 A = 1 . 0484 × 10 3 B = 3 . 837 × 10 1 C = 9 . 4537 × 10 4 D = 5 . 4903 × 10 7 E = 7 . 9298 × 10 11
In this study, the reference state for enthalpy is 0 K and h ( T = 0 K ) = 0 k J . k g 1 . K 1 . In Equations (21) and (22), c p is the specific heat at constant pressure given by (23) [43] which is evaluated during the numerical resolution at the current time step at the temperature corresponding to the previous step time, A C A S t i n and A C A S t o u t are respectively inlet and outlet cross section of CASt, H t is the height of the CASt and g is the acceleration of the gravity. The heat exchange through the tank walls Q ˙ C A S t , is modeled through a quasi-steady process assuming a cylindrical geometry with steel shell structure of the CASt. It is calculated as follows:
Q ˙ C A S t = H F P / D P S T T 0
where H F P / D P , is the heat transfer coefficient between the CASt wall and the air during filling and discharge process (equal to 40 and 45 W · m 2 · K 1 , respectively [45]), S is the area of heat transfer between the air and the CASt wall, T is the temperature of air inside the CASt and T 0 is the environment temperature.
Equations (21) and (22) are solved using the fourth-order Runge-Kutta method presented by Press et al. [46]. As initial conditions of air inside the CASt during filling process we use the environmental temperature and the minimal pressure set to inlet pressure P H P i n = P 0 β H P β L P of the high-power expansion stage. The stopping condition relates to the maximum pressure in CASt set to the outlet pressure of last compression stage P c , n o u t = P 0 × π n . These initial and stopping conditions of air inside the CASt are reversed for the discharge process. At this level of the analysis, the temperature, pressure, and enthalpy of each line of storage system to be optimized are known and for each stage of the process. Therefore, the exergy analysis can be carried out with greater flexibility.

3.2. Exergy Analysis

Exergy is defined as the maximum theoretical work obtainable from an overall system consisting of a system and the environment as the system that comes into equilibrium with the environment [43,47,48]. It can equally be defined as the maximum work that can be obtained from a given form of energy when the reference environment state is defined by the environmental parameters [49]. This second definition is more appropriate to the approach used in this work. To carry out the exergy analysis the exergy rate balance should be applied to each component. In steady state, this exergy rate balance for given component with one inlet and one outlet can be expressed as follows:
E x ˙ Q + E x ˙ i n = E x ˙ W + E x ˙ o u t + E x ˙ D
Here E x ˙ Q is the time rate of exergy transfer associated with heat transfer, E x ˙ W is the exergy of the work, E x ˙ D is the time rate of exergy destruction, and E x ˙ i n and E x ˙ o u t are the time rate of exergy transfer at inlet and outlet of the considered component respectively. These parameters are defined as follows:
E x ˙ Q = 1 T 0 T b Q ˙
E x ˙ = m ˙ e x
e x = h h 0 T 0 s s 0
E x ˙ W = W ˙
Here e x is the specific flow exergy (also known as physical exergy), T b is the temperature of the boundary where heat transfer ( Q ˙ ) occurs. Generally, to evaluate E x ˙ Q which is associated with exergy loss for a given component it is necessary to know the heat transfer Q ˙ across each segment of the boundary and T b . Although it is sometimes possible to calculate Q ˙ , the temperature of the boundary is more difficult to obtain and requires experimental measurements. Therefore, an alternative approach that often suffices for modeling is to suppose that the boundary is the outer surface of each component where the temperature corresponds to the ambient temperature taken as the temperature of the exergy reference environment. Thus, the heat transfer occurs at T 0 ( T b = T 0 ) and therefore there exists no exergy loss [50]. In this case, the rate of exergy destruction term of Equation (25) accounts for the exergy destruction owing to friction and the irreversibility of heat transfer within the considered component [50]. Then, using Equations (26)–(29), the rate of exergy destruction of all components could be calculated as shown in Table 1.

3.3. Storage System Performance Criteria

We use the efficiency as a mean performance parameter of proposed system. We define the global energy efficiency also known as the Round-Trip Efficiency (RTE) and overall exergy efficiency ( η e x ) as follows. The first one is based on the First Law of Thermodynamics that defines the efficiency of an engineering system by the ratio of energy outputs to inputs. For our proposed system, the energy input is the electricity used by the compressor to produce compressed air. The energy output is the sum of the electrical energy produced by generator and the part of heat recovered during the compression process that has not been used to reheat the air before its expansion. The second and perhaps the most relevant performance criteria of our proposed system is the exergy efficiency. It is an efficiency based on the Second Law of Thermodynamics and it is defined as the ratio of total exergy outputs to exergy inputs [42,48]. Exergy efficiency is also known as the ratio of the product exergy to the fuel exergy. The fuel exergy is defined by the electrical energy consumed by compressor and the product exergy is the difference between the fuel exergy and the sum of exergy destruction in all components of the storage system and total exergy loss associated with the overall considered system [41,51]. To conclude this part, these efficiencies can be express as follows:
R T E = P e l c , G t D P + Q ˙ h t F P Q ˙ R h t D P P e l c , c t F P
η e x = 1 E x ˙ c D + E x ˙ I n t D + E x ˙ c , n o u t t F P + E x ˙ H e D + E x ˙ P M D E x ˙ C A S t o u t t D P + E x l o s s P e l c , c t F P
Here t F P and t D P are respectively the charge and discharge time, Q ˙ h is the total heat transfer rate between air and cooling water in intercoolers during air compression process (see Equation (6)) and Q ˙ R h the thermal power required to warm the air up before it is expanded in the pneumatic motor (see Equation (19)).

4. Formulation of Optimization Problem

4.1. Definition of Objective Function

There is a discussion about the definition of global energy efficiency (or RTE) of CAES system. While some, to conform to the First Law of Thermodynamics, define the global energy efficiency by Equation (30), others suggest taking into account the fact that the electrical energy and heat are different energy forms. For the latter, it would be necessary to convert the heat power of the hot water into its electrical equivalent. For this purpose, they assume a virtual thermal power plant that would use the thermal power of water as heat source [31]. The energy efficiency of this virtual power plant given by Equation (32) would allow the deduction of the electrical equivalent of heat from hot water ( E e l c , e q , h w ) using Equation (33).
η r e f = Electrical   equivalent   of   the   heat   power   of   the   hot   water ( E e l c , e q , h w ) Q ˙ h t F P Q ˙ R h t D P
E e l c , e q , h w = Q ˙ h t F P Q ˙ R h t D P η r e f
Here, η r e f is the thermal efficiency of the virtual power plant generally considered equal to that of a reference natural gas power plant ( 38.2 % ) [52].
The global energy efficiency of the SS-CAES system would therefore be written as follows:
R T E = P e l c , G t D P + Q ˙ h t F P Q ˙ R h t D P η r e f P e l c , c t F P
To avoid controversy on good definition of energy efficiency of SS-CAES system, we decided to use as an objective function, the overall exergy efficiency of the system (Equation (31)). This objective function is subject to thirteen design parameters and seven inequality constraints. The mathematical formulation of the optimization problem is given by:
Identify X which maximizes η e x ( X ) subject to seven inequality constraints:
G i ( X ) 0 , i = 1 , . . . , 7 x j L x j x j U , j = 1 , . . . , N p a r
Here X stands for the solution vector containing the N p a r = 13 design parameters X = x 1 , x 2 , . . . , x N p a r and each of them varies in the range of lower and upper bounds x j L , x j U .

4.2. Constraints

Seven constraints are considered in this optimization procedure:
  • The minimum power delivered by the storage system during discharge process may not be smaller than 10 4 W (10 kW) so that they can be implemented in a house of the residential sector.
    10 4 P e l c , G 10 4 P e l c , G 1 10 4 P e l c , G 1 0
  • The proposed system needs to be used to store low cost electricity available during off-peak hours and to store electricity from RE sources. Thus, the charge time must not exceed 43,200 s (12 h) and the discharge time should be greater than 7200 s (2 h).
    t F P 43 , 200 t F P 43 , 200 1 t F P 43 , 200 1 0
    and
    7200 t D P 7200 t D P 1 7200 t D P 1 0
  • The hot water used to reheat air during discharge process is produced during the compression process. Thus, to eliminate the need for infinitely long heat exchangers, the difference between the hot water temperature and the inlet temperature of air of expansion stages must be larger than 5 K.
    T m , H P i n T h w i n 5 T m , H P i n + 5 T h w i n T m , H P i n + 5 T h w i n 1 T m , H P i n + 5 T h w i n 1 0
    and
    T m , L P i n T h w i n 5 T m , L P i n + 5 T h w i n T m , L P i n + 5 T h w i n 1 T m , L P i n + 5 T h w i n 1 0
  • Due to mechanical constraints and safety problems, the maximum pressure in compressed-air storage tank (CASt) cannot exceed 300 × 10 5 Pa (300 bar).
    P c , n o u t 300 × 10 5 P c , n o u t 300 × 10 5 1 P c , n o u t 300 × 10 5 1 0
  • The mass of hot water produced during the compression process must be greater than or equal to that required to warm the air up during the discharge process.
    2 × m ˙ h w × t D P n × m ˙ c w × t F P 2 × m ˙ h w × t D P n × m ˙ c w × t F P 1 2 × m ˙ h w × t D P n × m ˙ c w × t F P 1 0

4.3. Design Parameters

As noted in the introduction section, the design parameters selected for use in this study are: number of compression stages (n), compressor pressure ratio ( π ), volume of air storage tank ( V t ), pressure ratio of high-pressure and low-pressure expansion stages of pneumatic motor ( β H P , β L P ), inlet temperature of high-pressure and low-pressure expansion stages ( T m , H P i n , T m , L P i n ), compressor and pneumatic motor isentropic efficiency ( η I s C , η I s , m ), compressor and pneumatic motor mechanical efficiency ( η m C , η m m ), compressor and pneumatic motor mass flow rate ( m ˙ c , m ˙ m ). The ranges of each parameter have been specified according to the working specifications of each hardware element and summarized in Table 2.

4.4. Modified Real Coded Genetic Algorithm

Developed by John Holland [53], the genetic algorithm (GA) is an optimization and search technique based on the principles of genetics and natural selection. To perform the optimization, GA produces some random numbers for each design variables that form a population of individuals called initial population, where an individual consists of values of the design variables is a potential solution which maximizes the overall exergy efficiency. Based on an analogy with Darwin’s laws of natural selection, GA applies to an initial population, the operators of selection, crossover, and mutation to allow it to evolve to a new population that is, the next generation. The type of encoding used to represent these design variables are defined by the type of algorithm, thus when the design variables are continuous (as is the case for this study), it is more logical to represent them by floating-point numbers rather than by binary numbers. This is referred to as RCGA also known as continuous GA [54]. The algorithm has following steps:
  • Generate the initial population.
  • Evaluate the fitness of each individual of the considered population.
  • Select individuals to form the mating pool.
  • Select individuals of the mating pool for mating.
  • Apply crossover to generate offspring who is individuals of next generation.
  • Maintain the diversity in the population by mutation of selected members of the population.
  • Terminate the run if the stopping criteria are fulfilled or go back to step 2.
To improve the search efficiency and closer simulate the natural selection which is the fundamental principle of GA, one modification is introduced in the crossover step. In this step, during the evolution process, two crossover operators are randomly selected to generate the children according to the probability of crossover ( P c ). Thus, for a given generation a random number is generated and compared to the probability of crossover ( P c ). If this random number is smaller than the probability of crossover, the Simulated Binary crossover (SBX) proposed by Deb and Agrawal [55] is used. Otherwise the Simplex crossover (SPX) developed by Da Ronco and Benini [56] is used. To ensure a good exploration of the search space and avoid convergence towards a local optimum value, a newly developed mutation operator named DRM proposed by Chuang et al. [57] was used. A recent technique of constraint-handling named Violation Constraint-Handling method (VCH) introduced by Chehouri et al. [58] was used in the selection steps during the evolution process. The algorithm configuration of the modified RCGA used in this work is shown in Figure 3.
In this algorithm, normalizing an inequality constraint consists of transforming it to ensure that it admits 1 for maximum as presented in Section 4.2. Thus, the normalized constraints used in step 2 in Figure 3, can be expressed as follows:
G 1 ( X ) = 10 4 P e l c , G 1
G 2 ( X ) = t F P 43 , 200 1
G 3 ( X ) = 7200 t D P 1
G 4 ( X ) = T m , H P i n + 5 T h w i n 1
G 5 ( X ) = T m , L P i n + 5 T h w i n 1
G 6 ( X ) = P c , n o u t 300 × 10 5 1
G 7 ( X ) = 2 × m ˙ h w × t D P n × m ˙ c w × t F P 1
Chehouri et al. [58] define Constraint violation factor ( C . V ) and number of violation ( N . V ) that are evaluated here in step 2 for each individual (chromosome) of considered population of possible solutions as follows:
C . V = l = 1 7 m a x ( 0 , G l )
N . V = number of violated constraints 7
The pair-wise feasibility rules used in step 3 of Figure 3 separate the population into two families; feasible solutions and unfeasible consisting of individuals that violate at least one of seven constraints. The family of feasible solutions is sorted with respect to their fitness value (exergy efficiency) in descending order. The second family is sorted according to these rules:
  • If two considered chromosomes are infeasible, the best is the one with the lowest Number of Violations ( N . V ).
  • If both chromosomes have the same ( N . V ), the one with the lowest Constraints Violation ( C . V ) value is the best.
These sorted unfeasible solutions are placed after the sorted feasible solutions and the resulting sorted population is then used in selection of parents to be crossed. The first NKeep individuals of this sorted population are kept to form the mating pool and the rests are discarded and replaced by offspring of parents selected randomly in this mating pool. Since the mating pool is sorted, the tournament selection approach used in this work consists of selecting randomly two chromosomes from the mating pool, the chromosome with the lowest rank becomes a parent. The tournament repeats for every parent needed (twice for SBX and once for SPX). The first individual of mating pool must not be altered by any evolutionary operator (elitism strategy).

5. Validation of the Thermodynamic Model

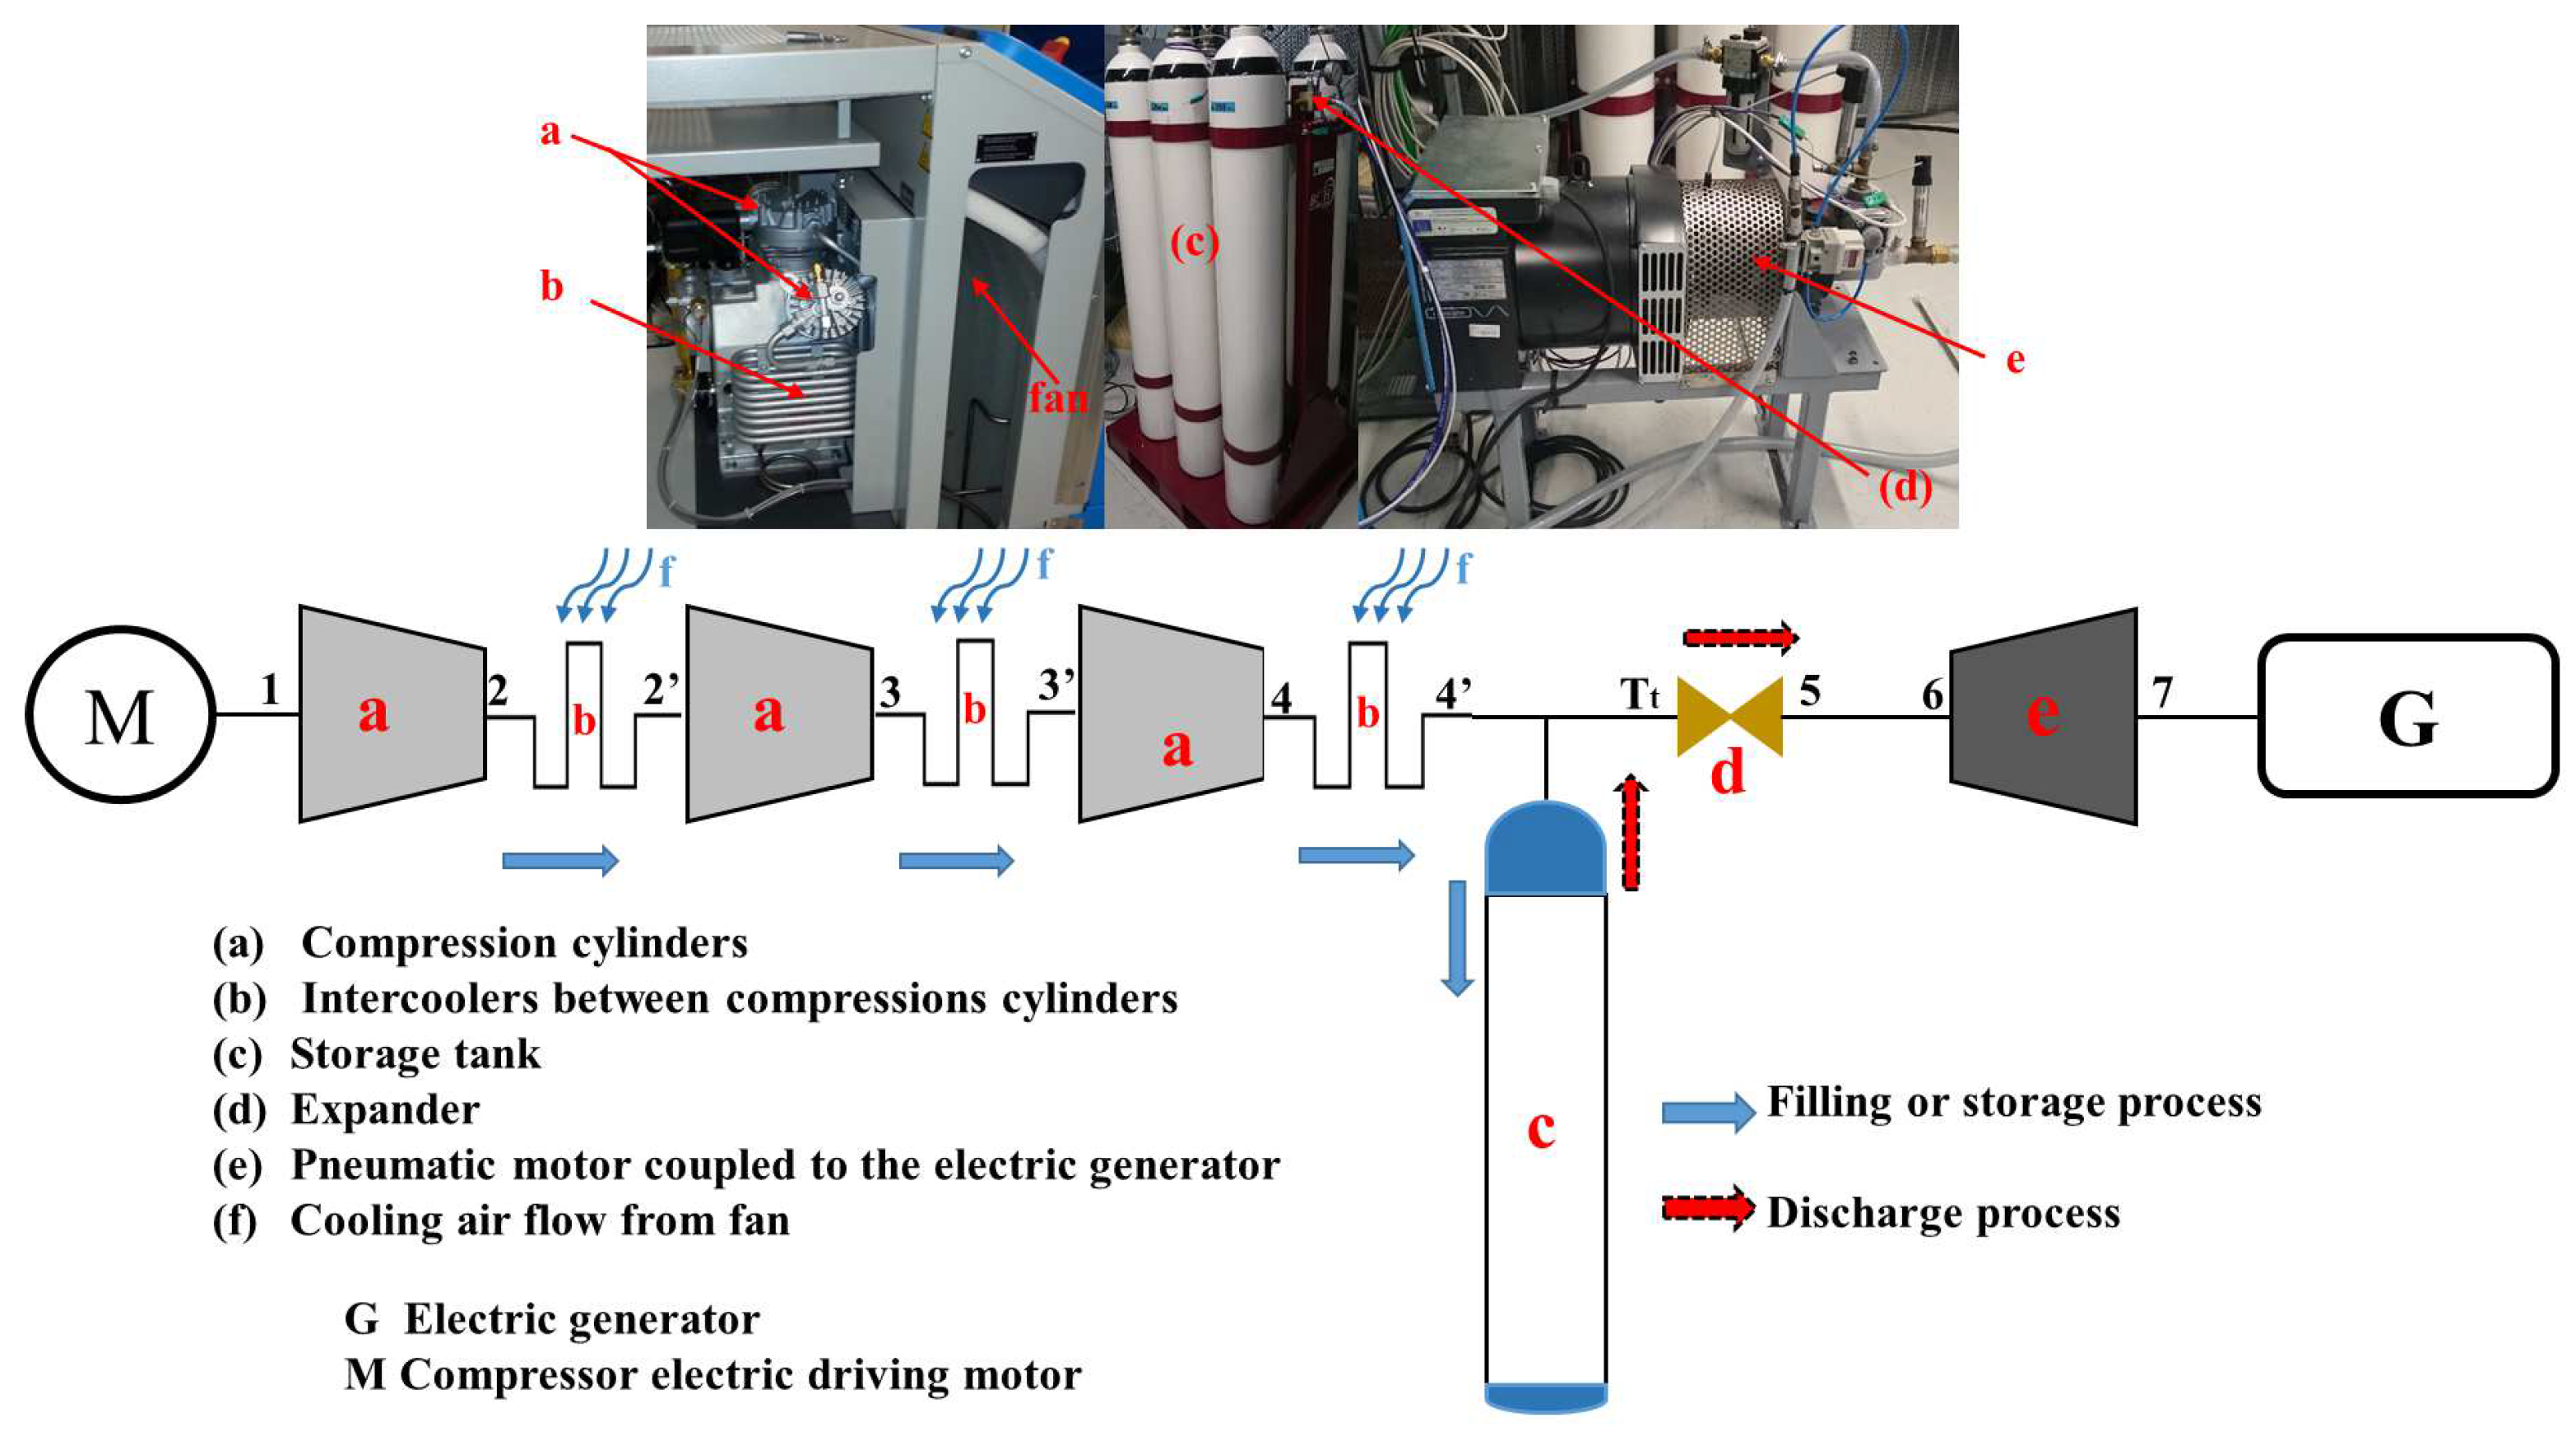
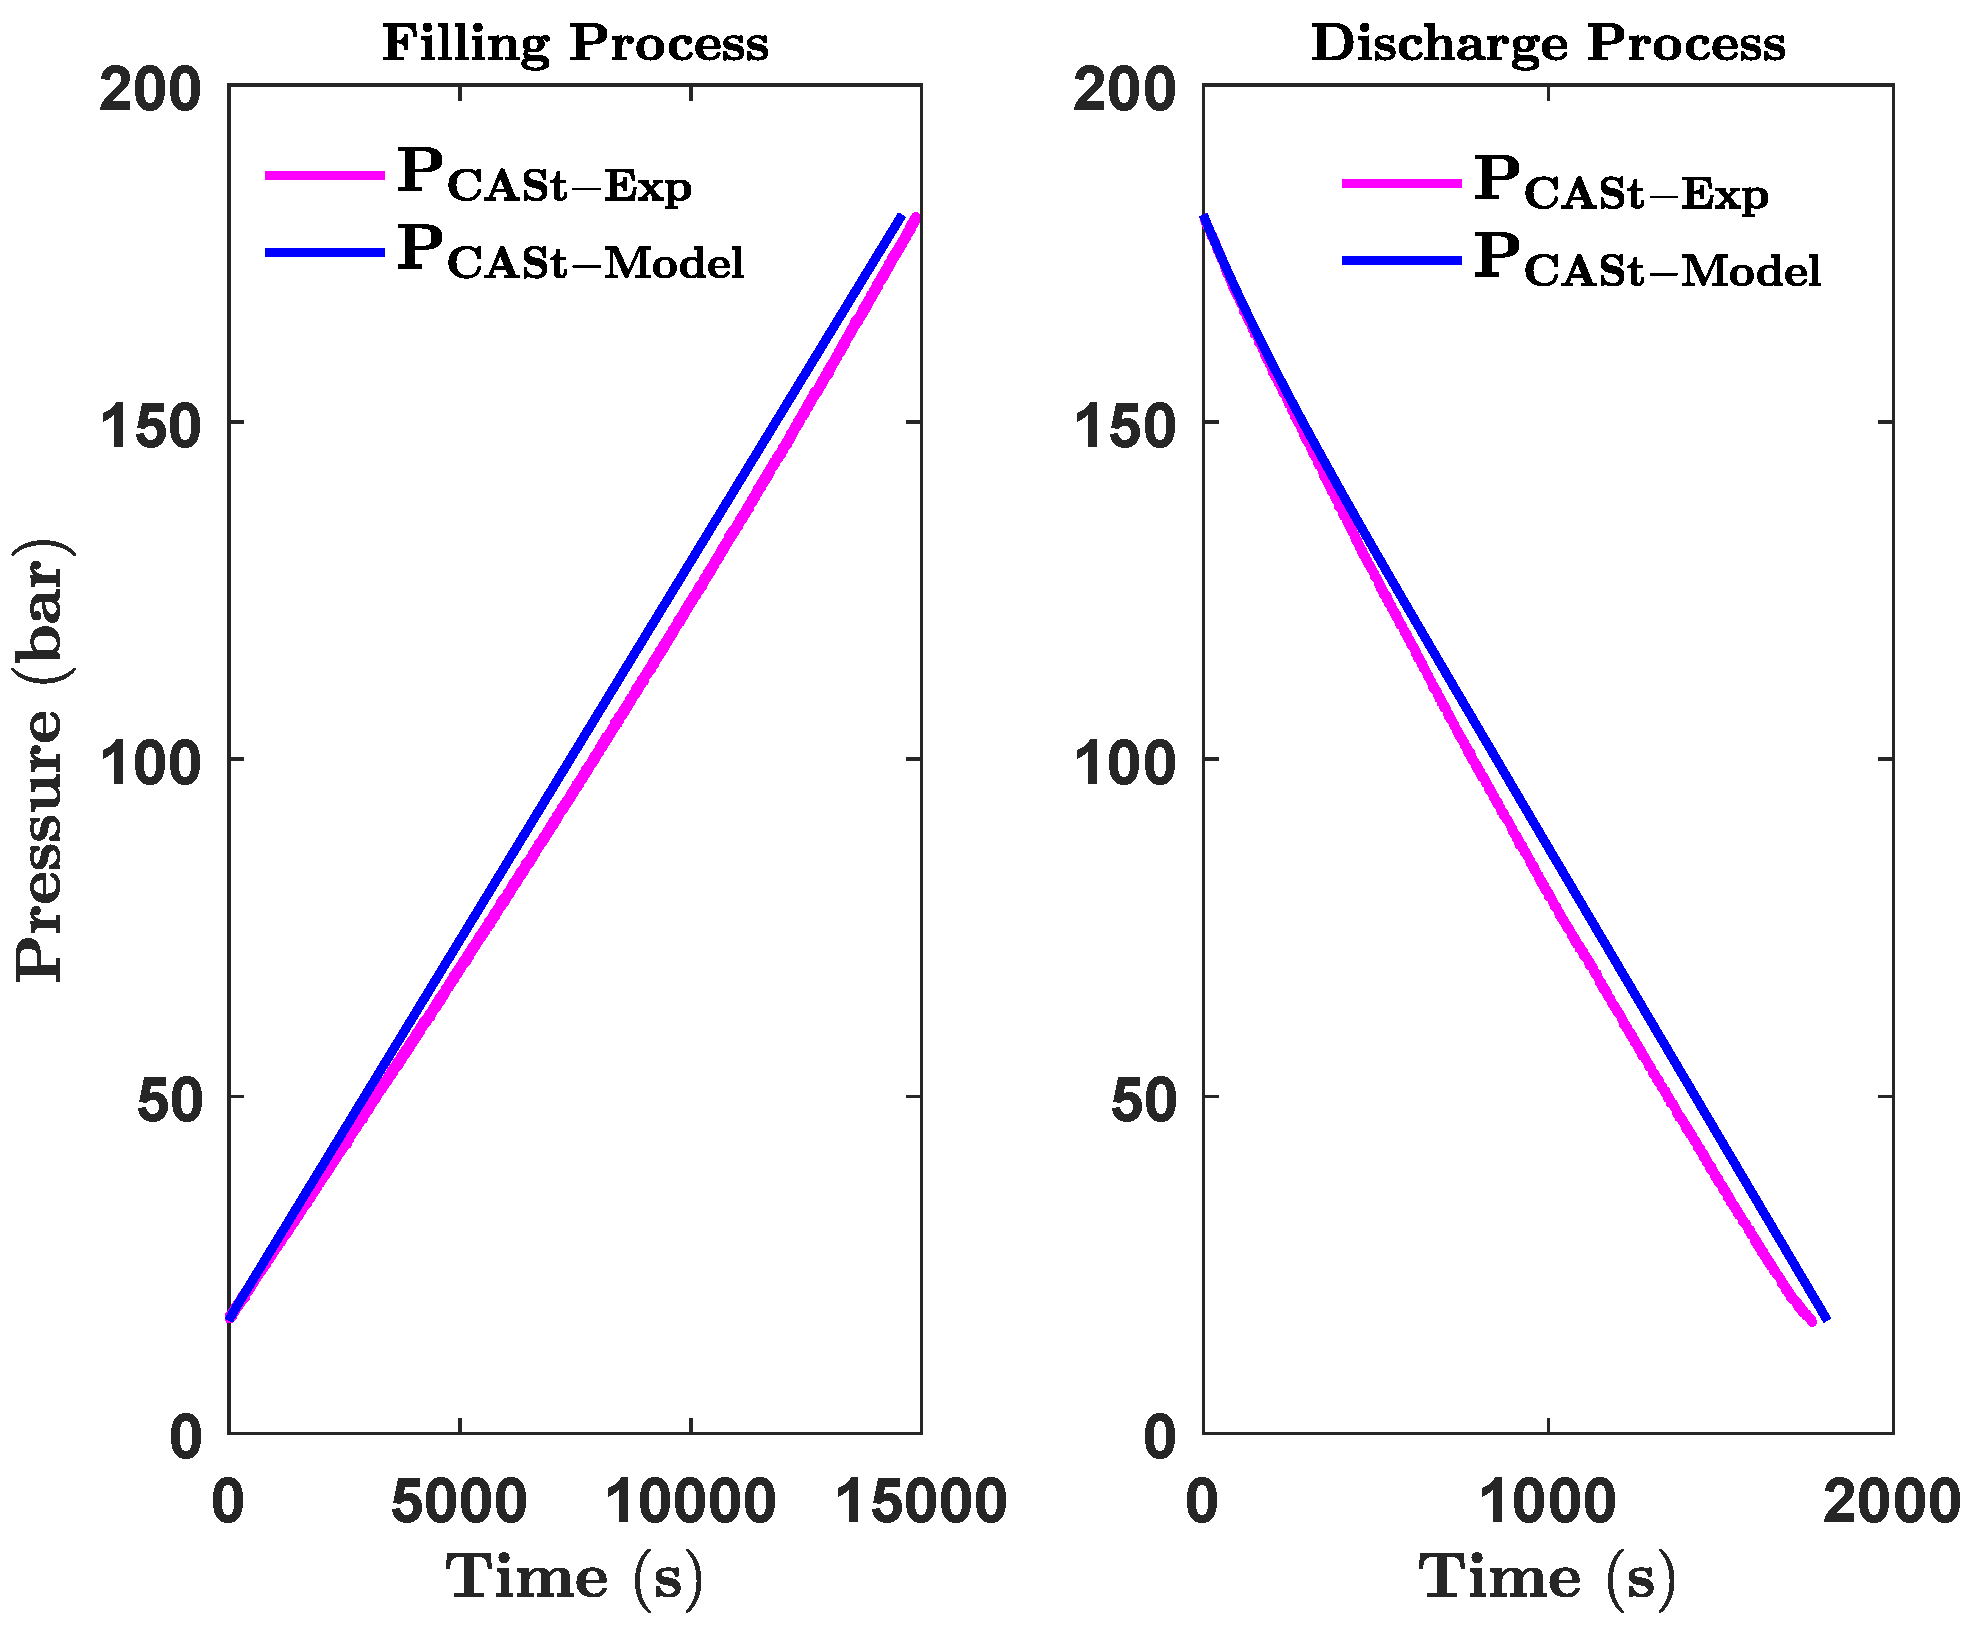
The storage system we propose in this work has not been constructed in reality. It is inspired from an experimental prototype existing in our lab and schematically illustrated in (Figure 4), due to the poor efficiency 3.4% obtained by experimentally measuring the total electrical energy produced during the discharge phase ( 0.45 kWh) and consumed by the compressor during the charge phase ( 13.12 kWh). In this experimental prototype, a three-stage compressor (cylinders) is used to produce compressed air. These compression cylinders (a) are separated by intercoolers (b) and the compressed air produced is stored in six storage tanks (c) having a total volume of 300 L . The maximum pressure in storage tanks is set at 180 to maintain the compression ratios of the three cylinders constant throughout the storage phase. The minimum pressure in storage tanks is limited at 16 to ensure good regulation of mass flow rate of expander (d). A fan (f) driven by the electric driving motor (M) of the compressor, stirs the ambient air to cool the compressed air passing through the intercoolers. The rated air mass flow rate of the compressor is 14 , 4 k g / h for the rated power of driven-motor of 4 kW. The pressure and temperature of air at the inlet and outlet of each compression cylinders are acquired. A pneumatic motor (e) coupled to electric generator (G) is used to achieve the expansion process and generate electricity. The inlet pressure and mass flow rate of pneumatic motor are adjusted by expander (d), its rated air mass flow rate is 97.2 k g / h and inlet air pressure is 8 for a rated output power of 1.2 kW. Because the fan also serves as a flywheel for the drive of the compressor, the ambient air that it stirs also cools the compression cylinders. The measured temperatures cannot fit the model results because of this compression cylinders cooling. That is why, we just use this prototype to validate the model for the filling and the discharge of the tank. The pressure sensor is used for the acquisition of pression inside the storage tanks during charge and discharge process. Figure 5 shows the comparison of the experimental results and the simulation results. The plot in the left panel shows the variation of pressure inside the storage tank with the time during the filling process; the right shows the same physical quantity during the discharge process. A good agreement between the experimental and the simulation results is observed. The rest of the model (compression, expansion) is validated using the data published by Liu et al. [41] where they thermodynamically analyzed a CAES system through an advanced exergetic analysis. We aim to compare the values of the temperature to the different states of their system with those obtained by our model and then to do the same for the specific flow exergy. As shows in Table 3, the differences are quite low (below 2.5%); one may conclude that our model accurately describes both the filling and the discharge process.
The comparison of the temperature and specific flow exergy predicted by our model with previous results presented in Ref. [41] is illustrated in Table 4. We note that the discrepancy is relatively smaller for the compression process than for the expansion process. This can be explained by the fact that we have considered the combustion gases as an ideal gas with the same properties as the air, therefore it could be concluded that the model is accurate.

6. Results and Discussion

6.1. Optimization Results

In this section, the results of optimization and thermodynamic analysis of optimized system are presented. The simulation code was implemented under MATLAB ® . To understand the impact of RCGA parameters to the optimization procedure, we have distinguished six cases with respect to the population size change and change of the number of maximum generation as shown in Table 5; Here P o p S i z e is the size of population, M a x G e n s is the maximum number of generations, P c is the probability of crossover and P m is the probability of mutation. In all these cases, the probability of crossover and that of mutation are the same and equal respectively to 60% and 0.5%. The population size in Case 1 is 50 and the maximum number of generations is 100. For more diversity in initial population, the population size is doubled in Case 2 for the same maximum number of generations. In Cases 1 through 5, the population size is held constant at 100 and the evolution time is increased gradually by raising the maximum number of generations from 200 for Case 3 to 1000 for Case 5. Finally, in Case 6, for the purpose of observing the impact of diversity in the initial population on finding an optimal solution, the population size is doubled with the same maximum number of generations as in Case 4 (500).
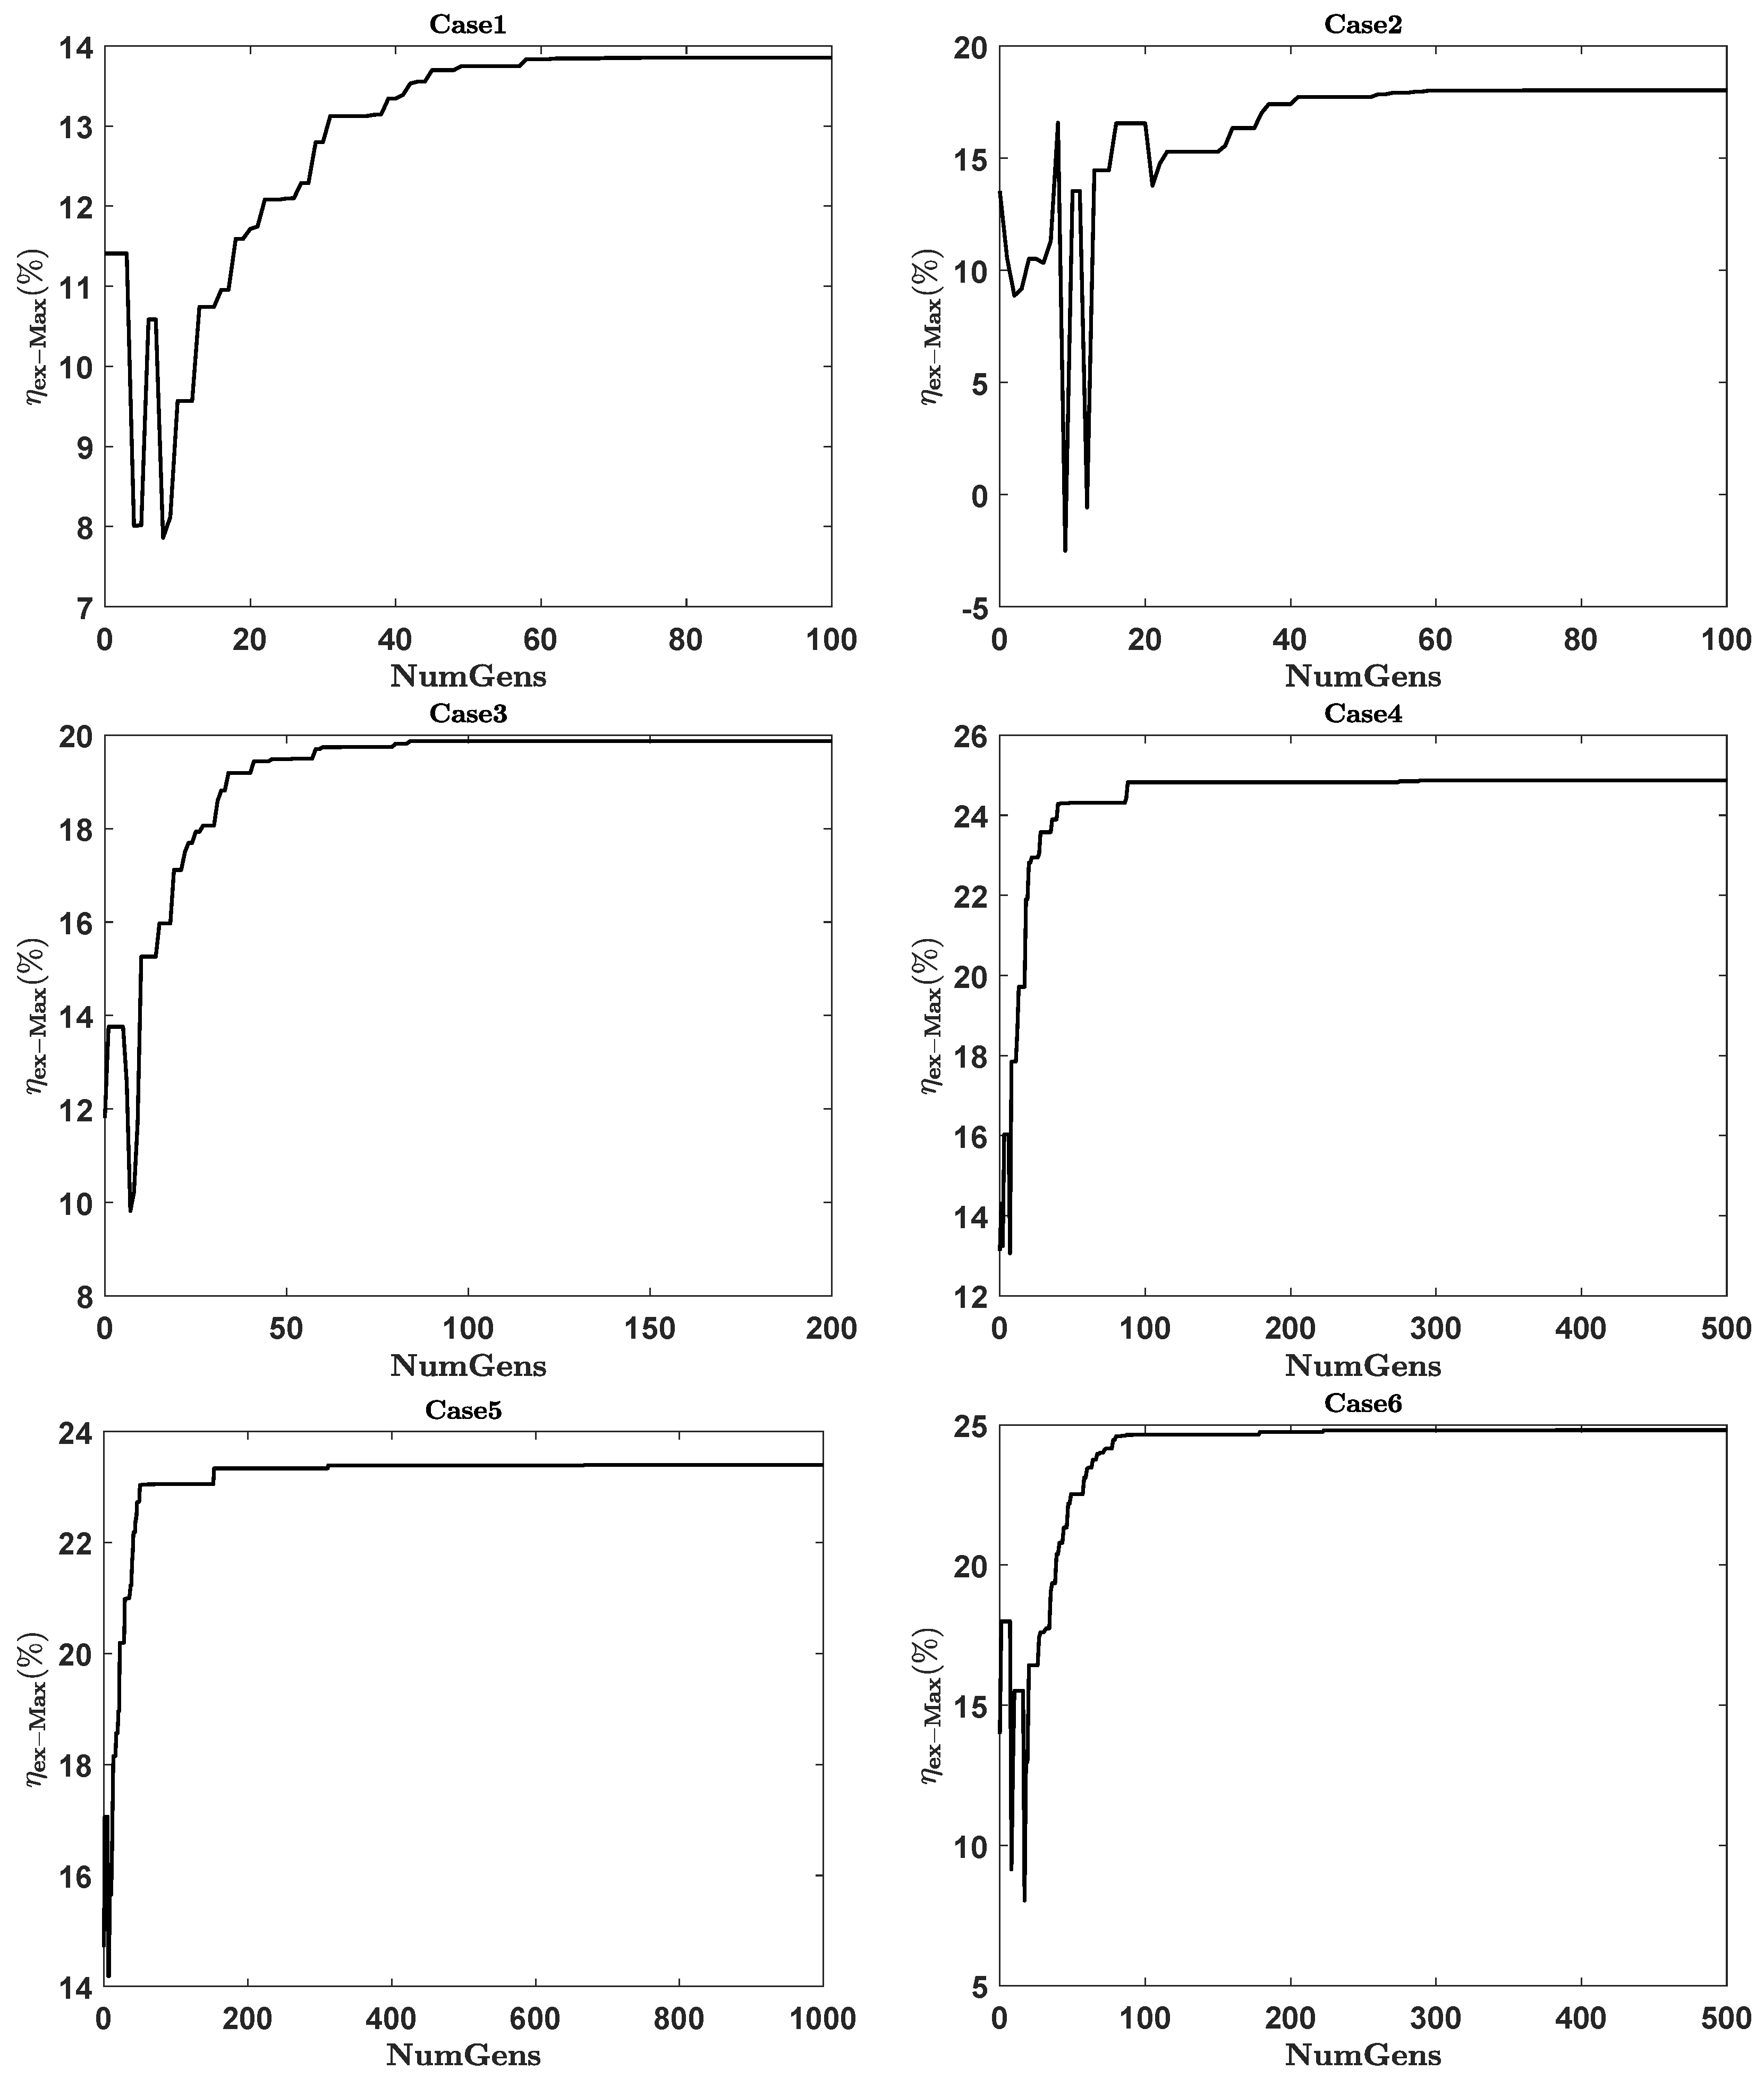
The evolutions of the maximum value of the objective function ( η e x M a x ) in each generation for these six cases have been plotted as show in Figure 6 where N u m G e n s is the number of generations.
It can be seen in Case 1 of Figure 6 that, a stable value of 13.85% is reached for minimum generation number of 70, but this value remains stable for at least 30 generations after the plateau is reached. Therefore, we are not sure whether this stable value is the global optimum of the storage system. One possible explanation of this late convergence may be the lack of diversity of the initial population. Therefore, in Case 2, the population size is doubled with the same maximum number of generations. The representative curve of this second case shows that; the population is gradually converging to the stable objective value of 18.02% which is the maximum value of the exergy efficiency reached during all the evolution process. Also, this value is reached for minimum generation number of 72 just 28 generation before the maximum number of predefined generations. Therefore, it is not certain that this maximum exergy efficiency of 18.02% is the optimum solution because the evolution process may not be completed. Therefore, in Case 3, the maximum generation number is doubled with the same population size as in Case 2 to maintain good diversity in the population and a sufficient evolution time to expect a convergence towards the overall optimum. The result of this case shows that the population is converging to a stable value of exergy efficiency. However, it is not sure whether this maximum stable value of 19.88% is the global optimum since, as can be seen, by doubling the evolution times ( N u m G e n s = 200 ), the maximum value of exergy efficiency is increased by two percentage points (from 18.02% to 19.88%). That is why, in the fourth case, the evolution time has increased fivefold ( N u m G e n s = 500 ) while keeping the same diversity in the initial population as in the third case ( P o p S i z e = 100 ).The result of this fourth case shows that the population is converging to a stable value of maximum exergy efficiency that increases by five percentage points to 24.87% in Case 4, compared with 19.88% in case 3. This maximum value of 24.87% remains constant over the last 210 generations during evolution process. It is likely that the algorithm has converged to the global optimum solution. To make sure of that, we wanted to see whether increasing the evolution time could be able to have an impact on the maximum value of the exergy efficiency. Therefore, in the fifth case, the maximum number of generations is doubled ( N u m G e n s = 1000 ) with the same population size as in the previous case. As shown in the representative curve of the evolution process of this fifth case, the population converges to a stable value but this stable value of 23.40% is unfortunately lower than that obtained in Case 4. Since an evolution time beyond 500 generations does not have a relevant impact on the maximum value of exergy efficiency, in the last case, the population size used in the fourth case is doubled (for more diversity in the initial population) with the same maximum number of generations. The stable value of maximum exergy efficiency of 24.81% obtained at the end of evolution process was indeed close to that reached in Case 4. Nevertheless, this value remains lower than 24.87% of Case 4 which is certainly the global optimum of this optimization problem.
To return to Case 4, the observation of the final population at the end of the evolution process shows that, all the chromosomes (sets of design parameters) are identical. This means that almost all the chromosomes of the population have converged to the optimum solution. We have then deduced the set of optimal values of influencing parameters that maximizes the global exergy efficiency of the SS-CAES system without fossil fuel used. These optimal parameters are given in Table 6.
Using these optimal parameters, the thermodynamic properties of each point in the optimized system (Figure 7) are shown in Table 7. The performance indicator of the optimized system is calculated and shown in Table 8.
As can be seen in Table 8, under optimal design conditions, the compressors take 8.65 h to fill the CASt while the discharge time of the CASt is equal to 2.02 h . The electric power produced by the generator is 12.77 kW which is well above the electrical energy requirements of an average household (of about 4 individuals). The optimized system also produces 4.64 t of hot water at a temperature of about 30 C during each cycle of charge/discharge which can be used for heating purposes in a house. The RTE of the optimized system is equal to 79.07% and its exergy efficiency is 24.87%. By calculating the contribution of thermal energy to RTE (CTEtoRTE, Equation (49)), we can see that it represents about 69% of RTE. Unfortunately, the low-temperature hot water containing this thermal energy does not necessarily have the same value as the electrical energy produced during the discharge process. This is one more reason to use the overall exergy efficiency as a performance evaluation criterion of SS-CAES system proposed in this work.
C T E t o R T E = Q ˙ h t F P Q ˙ R h t D P P e l c , G t D P + Q ˙ h t F P Q ˙ R h t D P
To identify the locations and magnitudes of storage process inefficiencies, the total exergy destruction of the charge/discharge cycle for each component as well as their exergy destruction ratio are listed in Table 9.
As shown in Table 9, the compression stage has the largest exergy destruction, followed by the intercoolers. This can be explained by the fact that, the temperature difference between the inlet and the outlet of each stage is large enough so that the heat transfer to the compression stages walls is no longer negligible compared to the enthalpy change. Another explanation could be given by the advanced exergetic analysis [59,60]. It would certainly indicate that the unavoidable exogenous part of the exergy destruction within these components is important. Indeed, as shown in Table 6, the design of compressor is supposed to be perfect because of the higher values of efficiency (isentropic and mechanical). Thus, the unavoidable endogenous part of the exergy destruction within the compressor is low compared with the unavoidable exogenous part.

6.2. Distribution of Design Parameters

The behavior between lower and upper bounds (dotted lines in Figure 8 and Figure 9) of each optimal design parameters during the evolution is analyzed in this section. The results of this are shown in Figure 8 and Figure 9).
According to this distribution, it can be seen in Figure 9g that the pneumatic motor mass flow rate reaches its minimum value. This means that the decreased value of this design variable could improve the global exergy efficiency of system. To reduce the number of variables and thus to speed up the optimization script, the lower born value of the pneumatic motor mass flow rate can be selected and set as a constant.
As also shown in Figure 9b–e concerning respectively the distribution in the population during the evolution process, of the values taken by the isentropic efficiency of compressor, by the isentropic efficiency of pneumatic motor, by the mechanical efficiency of compressor and by the mechanical efficiency of pneumatic motor; during the evolution process, these four design parameters only take almost exclusively their maximum value. This means that, the increased value of these designs variables could improve the global exergy efficiency of system. Similarly, the upper born value of these four designs parameters can be selected and set as a constant.
Other design variables have the scattered distribution which mean that, their variations could have some significant impact on the system performance. To have an idea of these impacts on both global exergy efficiency and number of violated constraints at the optimal point, the sensitivity analyses have been made.

6.3. Effect of Variation of the Design Variables Value on the System Efficiency (Global Exergy Efficiency) and on the Number of Violated Constraints

In this section, we study the effect of variation of the design variables value on the system efficiency and on the number of violated constraints. For this purpose, we vary the value of each design variable in its allowable range specified in Table 2.

6.3.1. Number of Compression Stages and the Compression Ratio Values

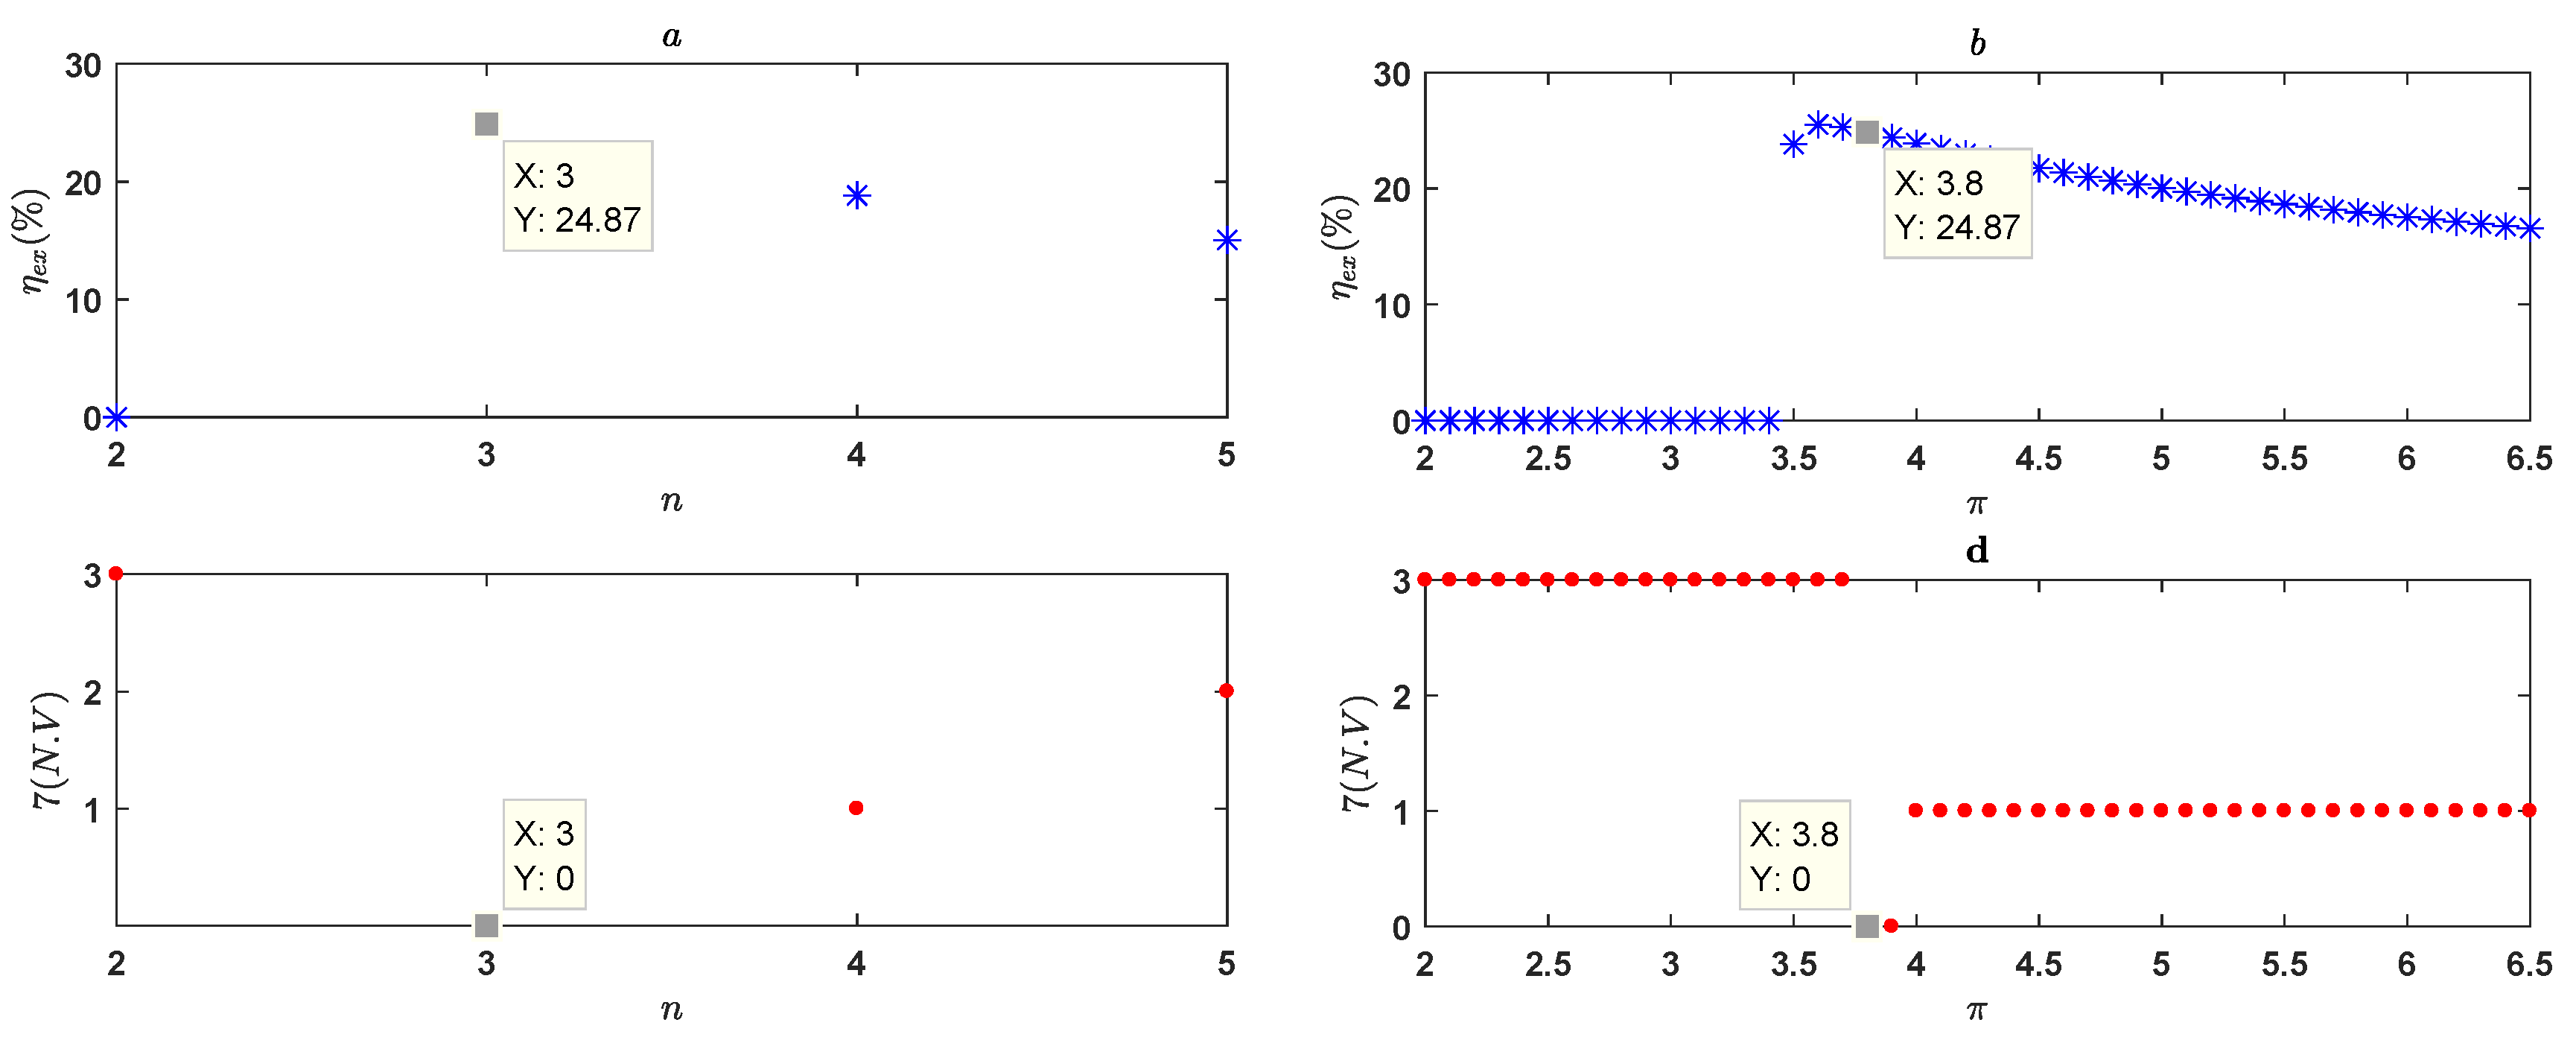
Figure 10a shows the decrease of the global exergy efficiency with the increasing number of compression stages at fixed optimal compression ratio. The same trend is observed in Figure 10b for the compression ratio at fixed optimal number of compression stages but, unfortunately, the compression ratio values which provide a maximum exergy efficiency violate some imposed constraints. That is why, as shown in Figure 10c,d, the optimum values of these two design parameters do not violate any constraint.
Thus, for a SS-CAES system, it is not necessary to use more than three compression stages. Furthermore, the compression ratio value of these compression stages should not exceed four.

6.3.2. Volume of the Air Storage Tank

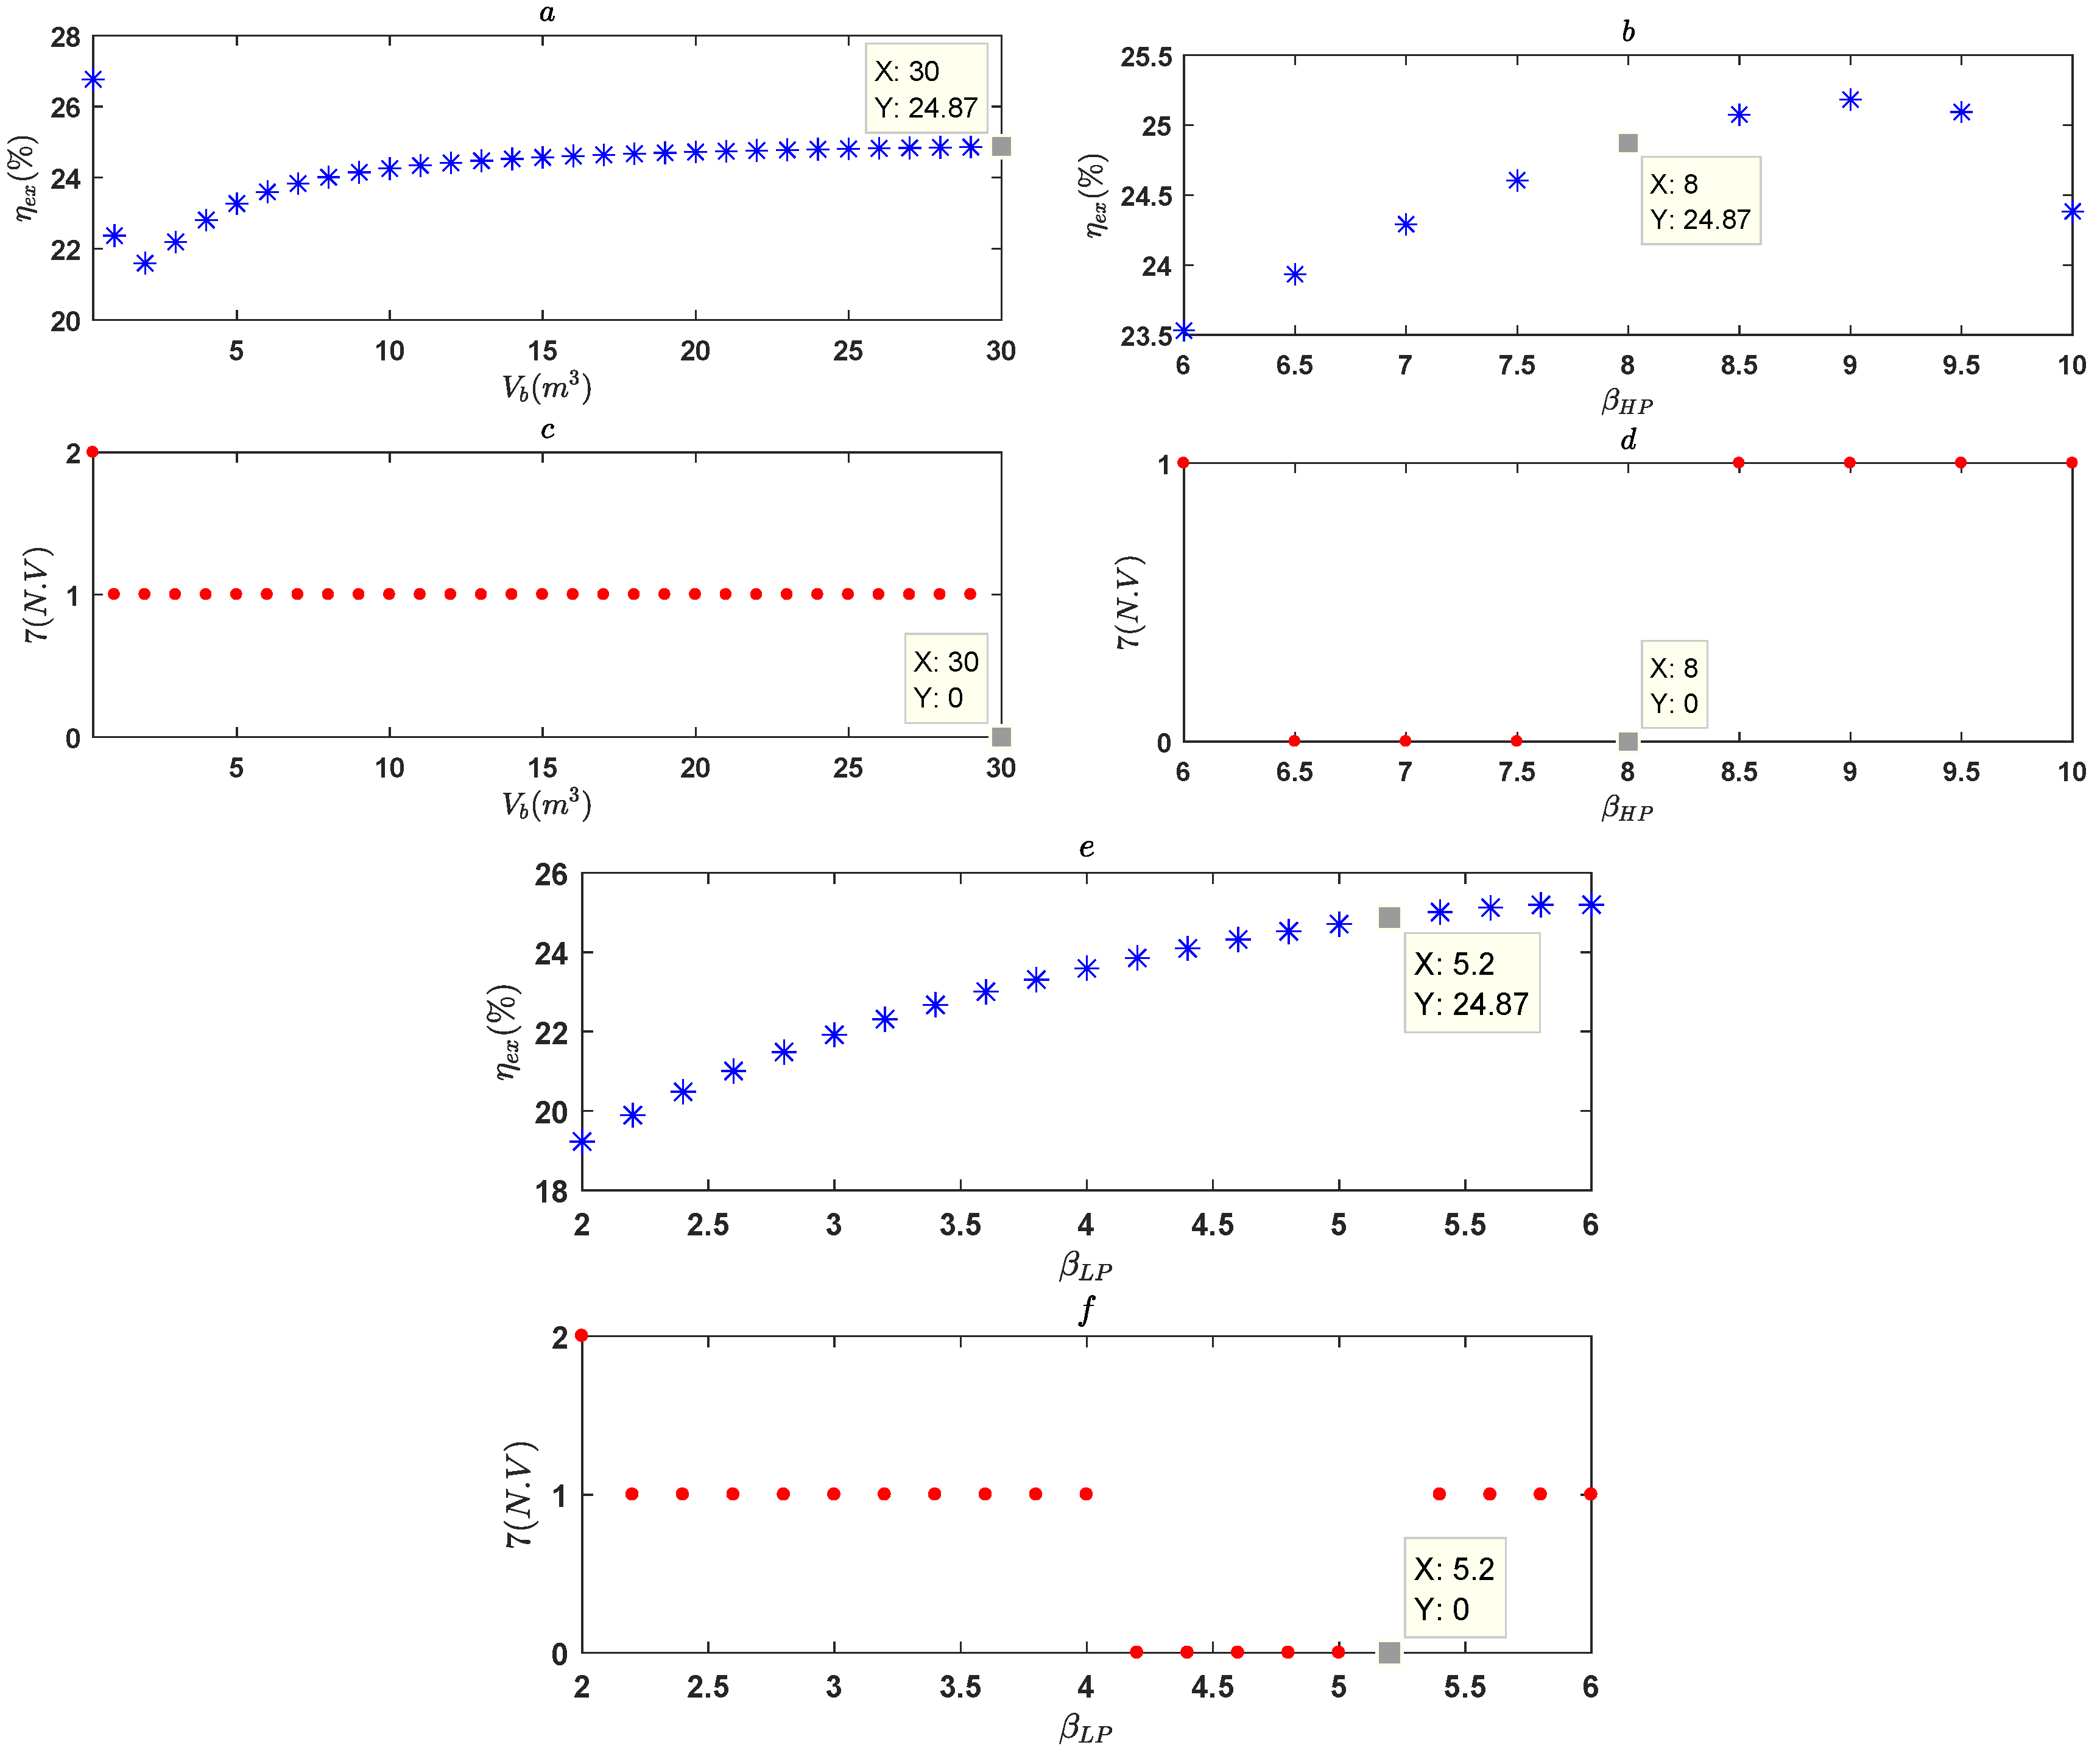
As can be seen in Figure 11a, the increase in volume of the air storage tank results in an increase of the global exergy efficiency. However, before the optimal value is reached, all other values violate one constraint as shown in Figure 11c. This means that if it had been possible to have a larger tank, the system efficiency would have been greater than the optimal value obtained. However, for a given SS-CAES system, a trade-off must be found between the constraints of space, of charging time, of discharge time and even of the cost of purchasing the storage tanks. Therefore, the optimal value of the air storage tank volume is closely linked to the imposed constraints of the system.

6.3.3. Pressure Ratio Values of High-Pressure and the Low-Pressure Expansion Stages of Pneumatic Motor

As it is shown in Figure 11b,e, the exergy efficiency increases almost linearly with both the pressure ratio of high-pressure and the low-pressure expansion stages of pneumatic motor. However, when the value of pressure ratio of high-pressure expansion stage is greater than 9, the global exergy efficiency begins to decrease (Figure 11b). This can be explained by the low temperature taken by the air at the exit of such expansion stage. In fact, the temperature of hot water produced during compression process is not high enough. Thus, the preheating of air between the expansion stages will no longer be enough to improve the expansion work of the low-pressure stage. Finally, imposed constraints (the minimum power delivered by the storage system during discharge process and the minimum difference between the hot water temperature and the inlet temperature of air of expansion stages) justify the optimal values returned by the optimization algorithm (Figure 11d,f).
For a SS-CAES system using pneumatic motor as expansion system, it is possible to increase its efficiency by using the pressure ratio values of 9 and 6 for the high-pressure and the low-pressure expansion stages, respectively. However, it should be considered in this case to use a water heating system (like solar water heaters) outside of the SS-CAES system. This water heating system would be used to increase the temperature of the hot water produced during the compression process.

6.3.4. Inlet Temperature Values of High-Pressure and the Low-Pressure Expansion Stages of Pneumatic Motor

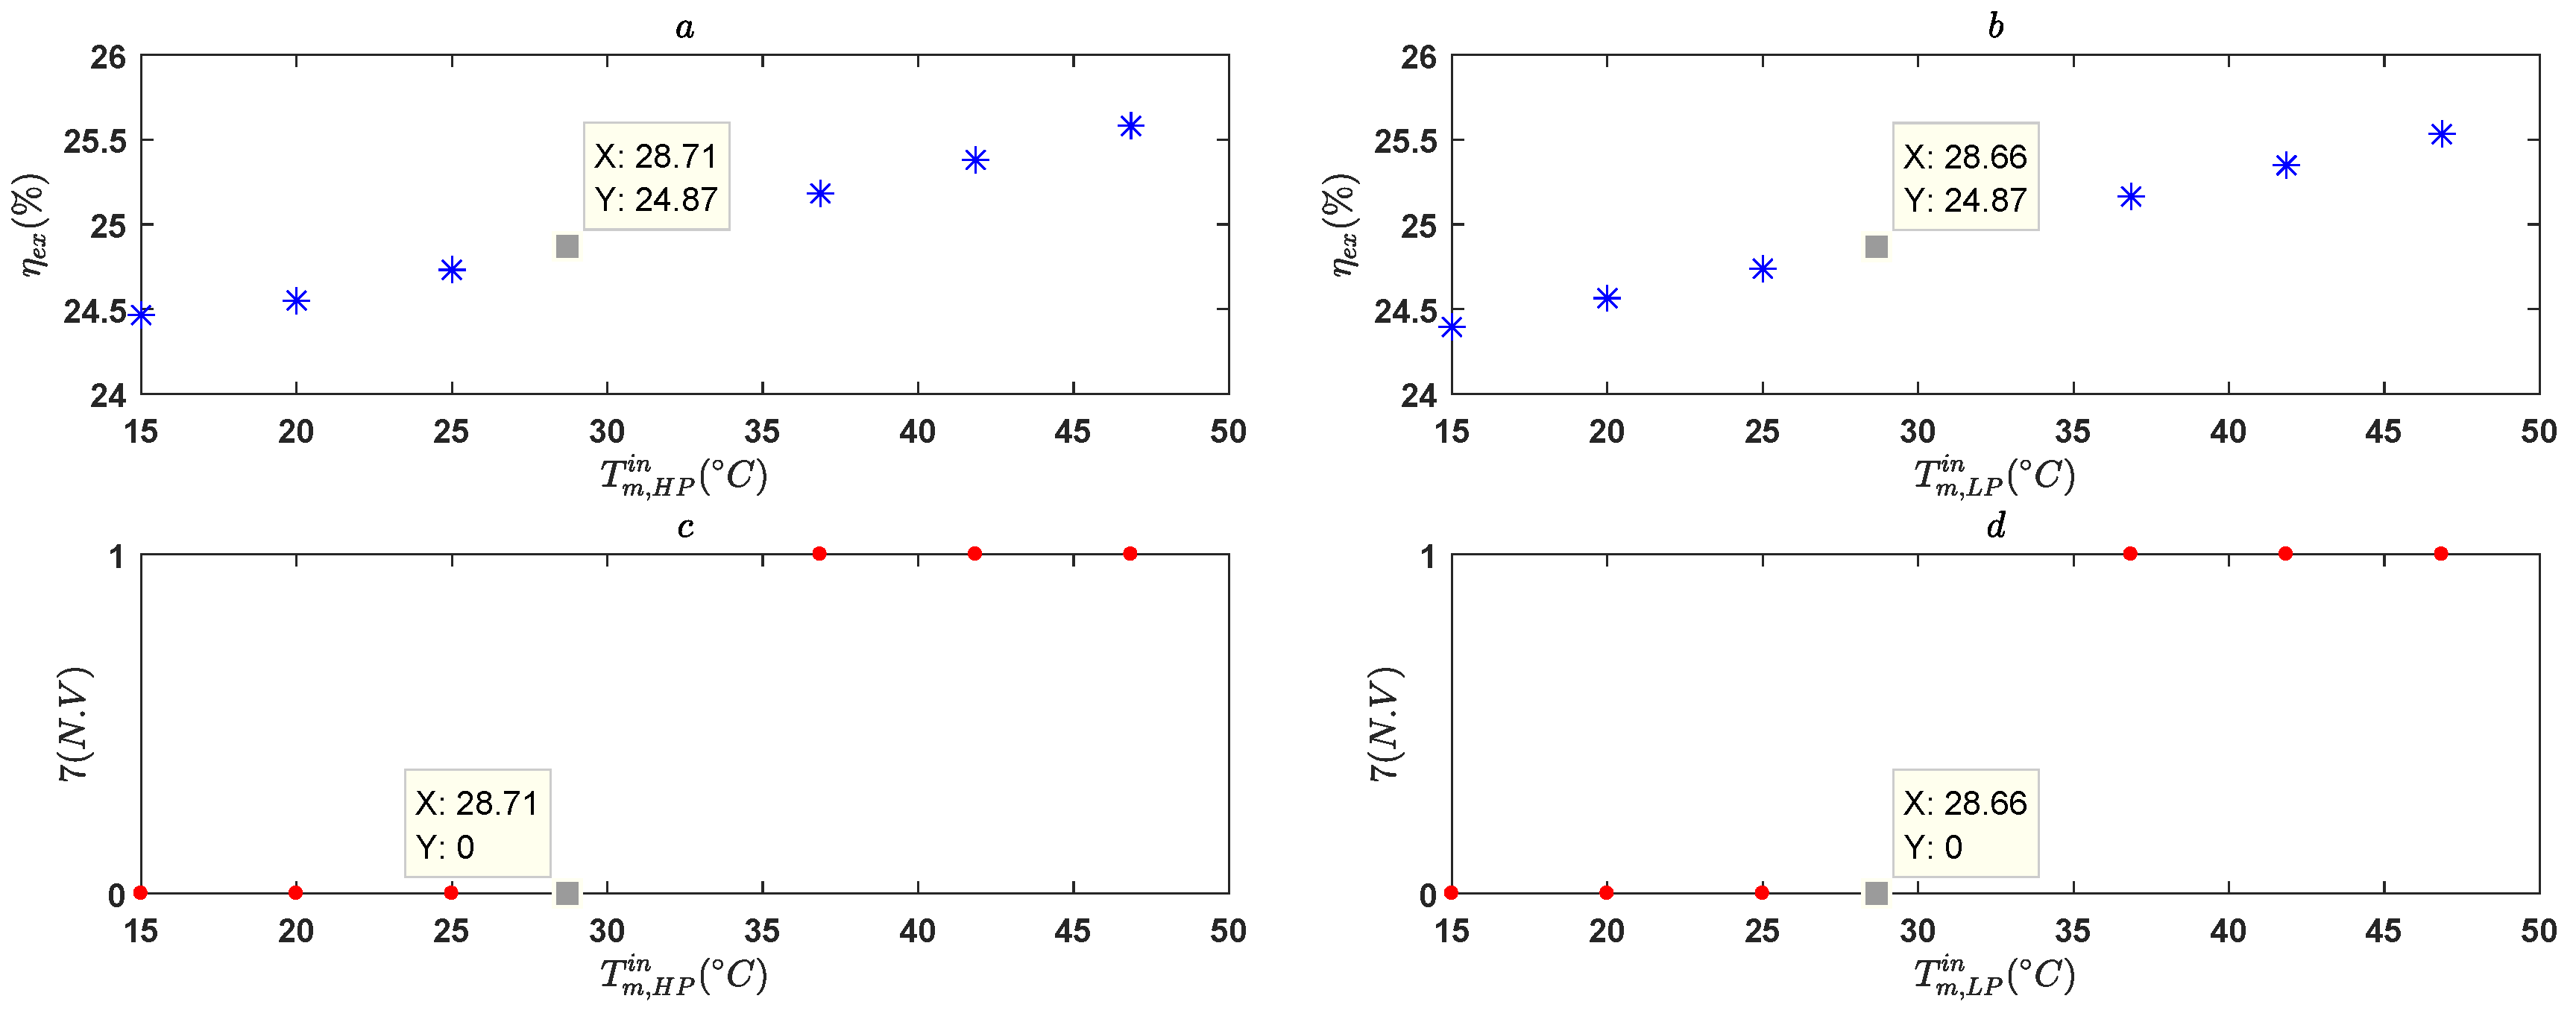
As shown in Figure 12a,b, the exergy efficiency increases linearly with both the inlet temperature of high-pressure and low-pressure expansion stages of pneumatic motor. Moreover, the optimal values of these two design parameters returned by the GA are the last ones which do not violate any of the imposed constraints (Figure 12c,d). If the temperature of the hot water had been higher, the optimal values of these two variables would have been higher too.
For a given SS-CAES, only thermomechanical stresses should limit the supply temperature of the expansion stages. Thus, when designing a SS-CAES using pneumatic air motor, consideration should be given, if necessary, to an external water heating system. In that case, during the preheating of the supplying air of the expansion stages during the discharge process, it is possible to move closer to the maximum permissible temperature at the inlet of these stages.

6.3.5. Compressor and Pneumatic Motor Isentropic Efficiency Values, of the Compressor and Pneumatic Motor Mechanical Efficiency Values

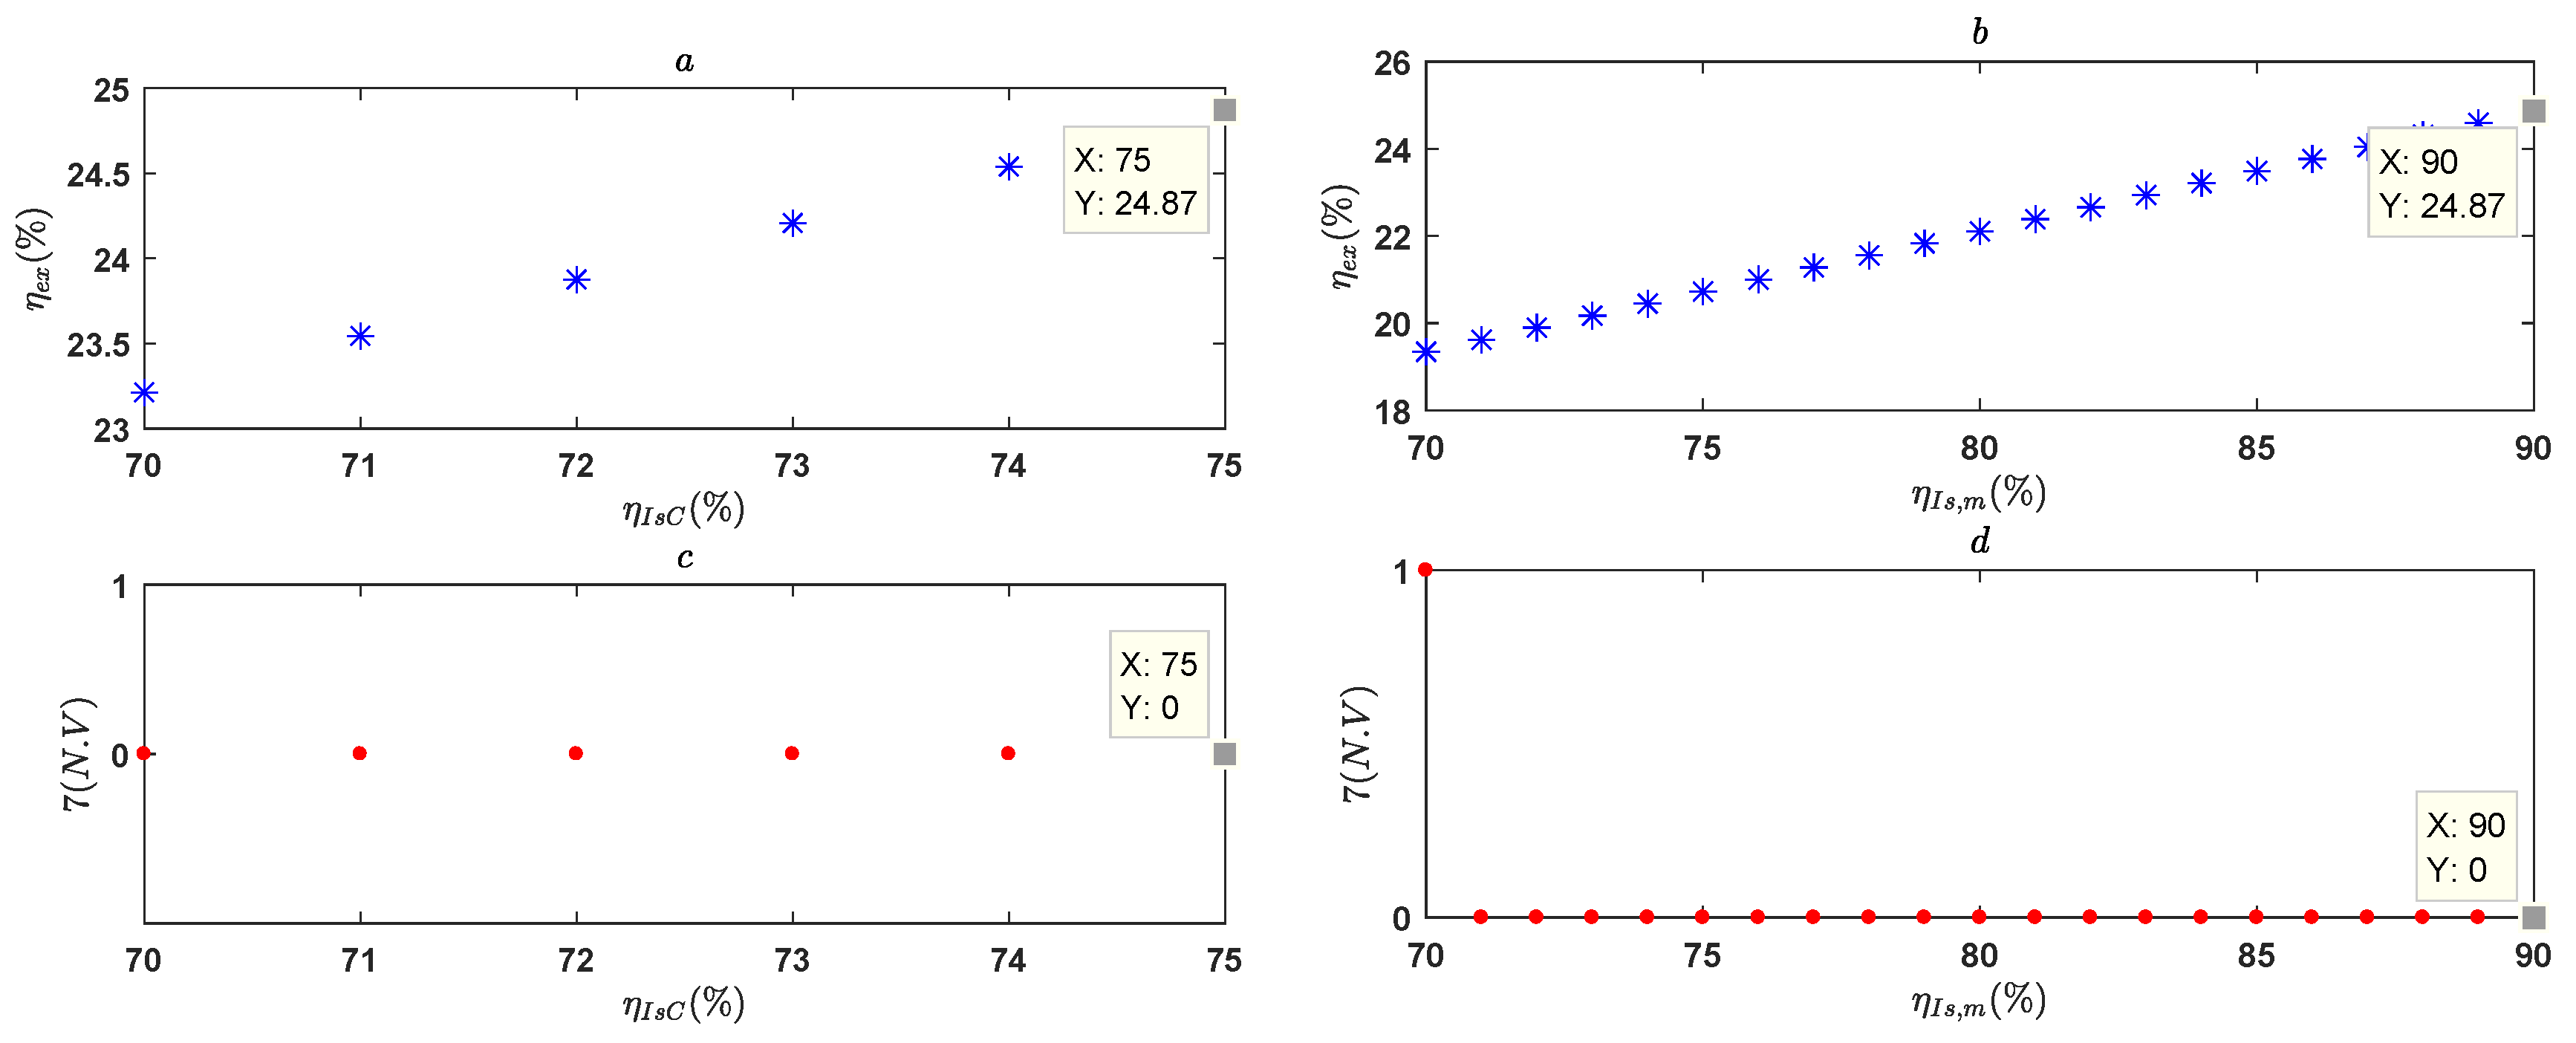
As it is shown in Figure 13a,b and Figure 14a,b respectively, the increase in the isentropic and mechanical efficiency of compressor and pneumatic motor leads to a linear increase of the exergy efficiency. Furthermore, it is important to note that this increase is done without any violation of constraints (Figure 13c,d and Figure 14c,d). Therefore, the maximum values of these four design parameters can be selected and set as constants in the cost function for optimization.
We should remember, however, that these results were predictable since for an energy system having turbomachines, the higher is the isentropic efficiency (or mechanical efficiency), the higher will be the system efficiency. Nevertheless, by including these four parameters among the optimization parameters, we are assessing the smooth functioning of the modified RCGA proposed in this work.

6.3.6. Compressor and Pneumatic Motor Mass Flow Rate Values

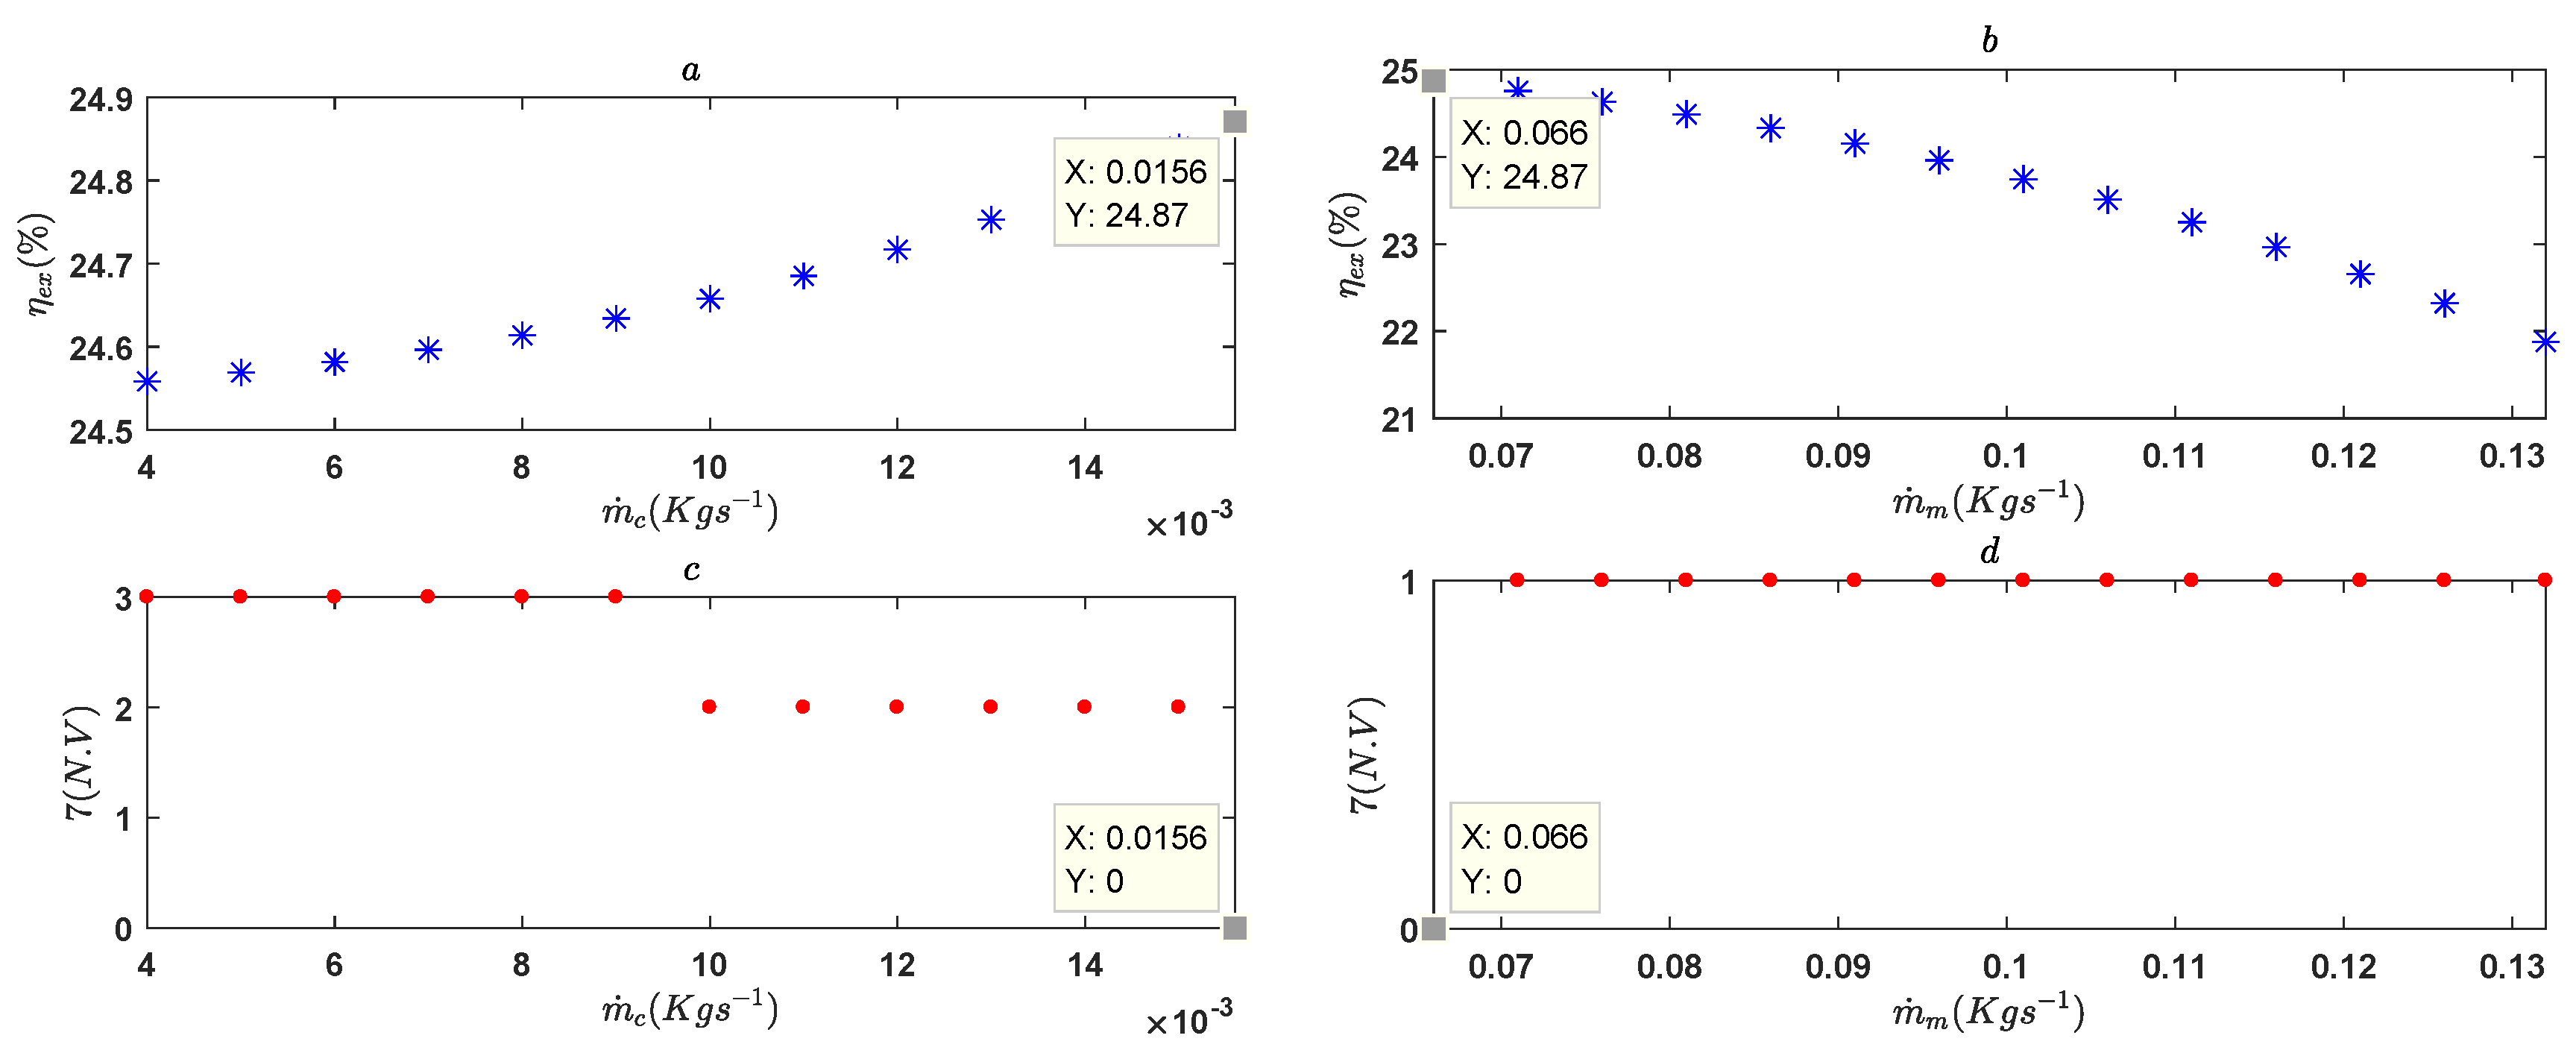
Figure 15a shows that the global exergy efficiency increases with the compressor mass flow rate. In addition, the single value that does not violate any constraint is that returned by the optimization algorithm (Figure 15c). Unfortunately, its scattered distribution (Figure 9f) does not allow one to set it as constant during the optimization procedure. Nevertheless, when designing a SS-CAES system, it would be appropriate to give preference to a compressor with a high mass flow rate.
For the pneumatic motor mass flow rate, its increase leads to a decrease in global exergy efficiency (Figure 15b) and as in the case of compressor mass flow rate, the optimum value of this parameter returned by optimization algorithm is the only one that does not violate any constraint (Figure 15d). In contrast to the scattered distribution of the compressor mass flow rate, a homogeneous convergence towards the minimum value can be noted in Figure 9g. Therefore, this minimum value of the pneumatic motor mass flow rate can be selected and set as a constant in the optimization algorithm. When designing a SS-CAES system, it would be appropriate to give preference to a pneumatic motor with a low mass flow rate.
7. Conclusions

This paper has presented the energy and exergy analyses of a SS-CAES system without fossil fuel used. The resulting thermodynamic model is fed to a modified RCGA to identify the optimal values of thirteen design parameter of the proposed storage system. The modified RCGA that has been clearly presented and tested to verify its stability and robustness. The results of the optimization indicate that for a maximum efficiency of a SS-CAES system using multistage reciprocating compressor and two stages pneumatic air motor:
  • The number of compression stage should be less than three.
  • The compressor pression ratio of each compression stages should be less than four.
  • The maximum value of air storage tank volume allowed by the constraints of spaces, of cost, of charge time and of discharge time should be preferred.
  • The pressure ratio together with the temperature of the supplying air of the expansion stages are highly dependent on the temperature of the hot water produced during compression process. However, the use of the maximum technologically acceptable values of these four parameters improve the efficiency of the storage systems.
  • A low mass flow of the pneumatic air motor coupled with a high mass flow rate of the compressor improves the efficiency of the storage system.
The presented modified RCGA can be used for optimizing all scale of CAES system under all kinds of constraints if the optimization problem is well formulated.

Author Contributions

Conceptualization, L.L. and T.G.; Methodology, T.G. and L.L.; Software, T.G. and D.T.; Validation, M.T., L.L. and T.G.; Formal Analysis, T.G. and L.L.; Investigation, D.T. and T.G.; Resources, M.T. and L.L.; Data Curation, T.G.; Writing-Original Draft Preparation, T.G.; Writing-Review & Editing, L.L. and T.G.; Visualization, T.G.; Supervision, L.L.; Project Administration, L.L.; Funding Acquisition, L.L. and M.T.

Funding

This research was funded by the European Commission H2020 MSCA programme, for the EU H2020-MSCA-RISE-2016-734340-DEWCOOL-4-CDC project, EU Commission.

Acknowledgments

The authors gratefully acknowledge the financial support of Erasmus Mundus Action 2 CARIBU. Also, the authors want to give their thanks to the support from CPER PREVER project for the experimental prototype.

Conflicts of Interest

The authors declare no conflict of interest.

Notations

VariableMeaningDimension
Symbols
ACross section m 2
C p Specific heat capacity at constant pressure J · kg 1 · K 1
e x Specific flow exergy kJ · kg 1
E x ˙ Q Time rate of exergy transfer kW
gAcceleration of gravity m · s 2
hSpecific enthalpy kJ · kg 1
HHeat transfer coefficient kW · m 2 · K 1
mMass kg
m ˙ Mass flow rate kg · s 1
nNumber of compression stage
P 0 Pressure of reference environment bar
PPressure bar
P c Probability of crossover
P m Probability of mutation
P e l c Electric power kW
Q ˙ Heat transfer rate kW
RGas constant kJ · kg 1 · K 1
sSpecific entropy kJ · kg 1 · K 1
SArea of heat transfer m 2
T 0 Temperature of reference environment C
TTemperature C
tTime s
V t volume of air storage tank kg 3
Greek symbols
β H P high-power pneumatic motor pressure ratio
β L P low-power pneumatic motor pressure ratio
η I s C compressor isentropic efficiency
η I s , m pneumatic motor isentropic efficiency
η e x exergy efficiency
η m C compressor mechanical efficiency
η m m pneumatic motor mechanical efficiency
η r e f reference efficiency of a virtual thermal power plant
π compressor pressure ratio
VariableMeaning
Subscripts
cCompressor
c w cooling water
D P Discharge Process
F P Filling Process
GGenerator
hhot
H P High power
h w heating water
inumber of the compression stage
I s Isentropic
L P low power
mmotor
nlast compression stage
R h Reheat
ttank
VariableMeaning
Superscripts
bboundary
DDestruction
i n inlet
jnumber of the parameter
LLower bound
lnumbers of normalized constraints
M a x Maximum
o u t outlet
Qheat
UUpper bound
WWork
Abbreviations
AA-CAESAdvanced Adiabatic Compressed-Air Energy Storage
C A E S Compressed-Air Energy Storage
C A S t Compressed-Air Storage tank
C C Combustion Chamber
C S Compression Stage
C . V Constraint Violation factor
C T E t o R T E Contribution of Thermal Energy to Round-Trip Efficiency
D R M Dynamic Random Mutation
Gelectric Generator
G A Genetic Algorithm
H E Heat Exchanger
H P e / L P e High- and Low-power expansion stage
H W t Hot Water tank
Melectric drive Motor
M a x G e n s maximum number of generations
N . V Number of Violation
P o p S i z e size of population
R C G A Real Coded Genetic Algorithm
R T E Round-Trip Efficiency
S B X Simulated Binary crossover
S P X Simplex crossover
S S - C A E S Small-Scale Compressed-Air Energy Storage
V C H Violation Constraint-Handling method

References

  1. Zakeri, B.; Syri, S. Electrical energy storage systems: A comparative life cycle cost analysis. Renew. Sustain. Energy Rev. 2015, 42, 569–596. [Google Scholar] [CrossRef]
  2. Mahlia, T.; Saktisahdan, T.; Jannifar, A.; Hasan, M.; Matseelar, H. A review of available methods and development on energy storage; technology update. Renew. Sustain. Energy Rev. 2014, 33, 532–545. [Google Scholar] [CrossRef]
  3. Sciacovelli, A.; Li, Y.; Chen, H.; Wu, Y.; Wang, J.; Garvey, S.; Ding, Y. Dynamic simulation of Adiabatic Compressed Air Energy Storage (A-CAES) plant with integrated thermal storage—Link between components performance and plant performance. Appl. Energy 2017, 185, 16–28. [Google Scholar] [CrossRef]
  4. Chen, L.; Zheng, T.; Mei, S.; Xue, X.; Liu, B.; Lu, Q. Review and prospect of compressed air energy storage system. J. Mod. Power Syst. Clean Energy 2016, 4, 529–541. [Google Scholar] [CrossRef] [Green Version]
  5. Evans, A.; Strezov, V.; Evans, T.J. Assessment of utility energy storage options for increased renewable energy penetration. Renew. Sustain. Energy Rev. 2012, 16, 4141–4147. [Google Scholar] [CrossRef]
  6. Yang, C.J.; Jackson, R.B. Opportunities and barriers to pumped-hydro energy storage in the United States. Renew. Sustain. Energy Rev. 2011, 15, 839–844. [Google Scholar] [CrossRef]
  7. Hedegaard, K.; Meibom, P. Wind power impacts and electricity storage—A time scale perspective. Renew. Energy 2012, 37, 318–324. [Google Scholar] [CrossRef]
  8. Chen, H.; Cong, T.N.; Yang, W.; Tan, C.; Li, Y.; Ding, Y. Progress in electrical energy storage system: A critical review. Prog. Nat. Sci. 2009, 19, 291–312. [Google Scholar] [CrossRef]
  9. Jannelli, E.; Minutillo, M.; Lavadera, A.L.; Falcucci, G. A small-scale {CAES} (compressed air energy storage) system for stand-alone renewable energy power plant for a radio base station: A sizing-design methodology. Energy 2014, 78, 313–322. [Google Scholar] [CrossRef]
  10. Kim, Y.M.; Lee, J.H.; Kim, S.J.; Favrat, D. Potential and Evolution of Compressed Air Energy Storage: Energy and Exergy Analyses. Entropy 2012, 14, 1501–1521. [Google Scholar] [CrossRef] [Green Version]
  11. Luo, X.; Wang, J.; Dooner, M.; Clarke, J. Overview of current development in electrical energy storage technologies and the application potential in power system operation. Appl. Energy 2015, 137, 511–536. [Google Scholar] [CrossRef] [Green Version]
  12. Rehman, S.; Al-Hadhrami, L.M.; Alam, M.M. Pumped hydro energy storage system: A technological review. Renew. Sustain. Energy Rev. 2015, 44, 586–598. [Google Scholar] [CrossRef]
  13. Marano, V.; Rizzo, G.; Tiano, F.A. Application of dynamic programming to the optimal management of a hybrid power plant with wind turbines, photovoltaic panels and compressed air energy storage. Appl. Energy 2012, 97, 849–859. [Google Scholar] [CrossRef]
  14. Cazzaniga, R.; Cicu, M.; Rosa-Clot, M.; Rosa-Clot, P.; Tina, G.; Ventura, C. Compressed air energy storage integrated with floating photovoltaic plant. J. Energy Storage 2017, 13, 48–57. [Google Scholar] [CrossRef]
  15. Tong, S.; Cheng, Z.; Cong, F.; Tong, Z.; Zhang, Y. Developing a grid-connected power optimization strategy for the integration of wind power with low-temperature adiabatic compressed air energy storage. Renew. Energy 2018, 125, 73–86. [Google Scholar] [CrossRef]
  16. Sadreddini, A.; Fani, M.; Aghdam, M.A.; Mohammadi, A. Exergy analysis and optimization of a CCHP system composed of compressed air energy storage system and ORC cycle. Energy Convers. Manag. 2018, 157, 111–122. [Google Scholar] [CrossRef]
  17. Alami, A.H.; Aokal, K.; Abed, J.; Alhemyari, M. Low pressure, modular compressed air energy storage (CAES) system for wind energy storage applications. Renew. Energy 2017, 106, 201–211. [Google Scholar] [CrossRef]
  18. Arabkoohsar, A.; Machado, L.; Koury, R. Operation analysis of a photovoltaic plant integrated with a compressed air energy storage system and a city gate station. Energy 2016, 98, 78–91. [Google Scholar] [CrossRef]
  19. Huang, Y.; Keatley, P.; Chen, H.S.; Zhang, X.J.; Rolfe, A.; Hewitt, N. Techno-economic study of compressed air energy storage systems for the grid integration of wind power. Int. J. Energy Res. 2017, 42, 559–569. [Google Scholar] [CrossRef]
  20. Zhang, Y.; Yang, K.; Li, X.; Xu, J. Thermodynamic analysis of energy conversion and transfer in hybrid system consisting of wind turbine and advanced adiabatic compressed air energy storage. Energy 2014, 77, 460–477. [Google Scholar] [CrossRef]
  21. Rabbani, M.; Dincer, I.; Naterer, G. Thermodynamic assessment of a wind turbine based combined cycle. Energy 2012, 44, 321–328. [Google Scholar] [CrossRef]
  22. Guney, M.S.; Tepe, Y. Classification and assessment of energy storage systems. Renew. Sustain. Energy Rev. 2017, 75, 1187–1197. [Google Scholar] [CrossRef]
  23. Madlener, R.; Latz, J. Economics of centralized and decentralized compressed air energy storage for enhanced grid integration of wind power. Appl. Energy 2013, 101, 299–309. [Google Scholar] [CrossRef]
  24. Barbour, E.; Mignard, D.; Ding, Y.; Li, Y. Adiabatic Compressed Air Energy Storage with packed bed thermal energy storage. Appl. Energy 2015, 155, 804–815. [Google Scholar] [CrossRef] [Green Version]
  25. Grazzini, G.; Milazzo, A. Thermodynamic analysis of CAES/TES systems for renewable energy plants. Renew. Energy 2008, 33, 1998–2006. [Google Scholar] [CrossRef] [Green Version]
  26. Kere, A.; Goetz, V.; Py, X.; Olives, R.; Sadiki, N. Modeling and integration of a heat storage tank in a compressed air electricity storage process. Energy Convers. Manag. 2015, 103, 499–510. [Google Scholar] [CrossRef]
  27. Peng, H.; Yang, Y.; Li, R.; Ling, X. Thermodynamic analysis of an improved adiabatic compressed air energy storage system. Appl. Energy 2016, 183, 1361–1373. [Google Scholar] [CrossRef]
  28. Wolf, D.; Budt, M. LTA-CAES—A low-temperature approach to Adiabatic Compressed Air Energy Storage. Appl. Energy 2014, 125, 158–164. [Google Scholar] [CrossRef]
  29. Allen, K. CAES: The Underground Portion. IEEE Trans. Power Appar. Syst. 1985, 4, 809–812. [Google Scholar] [CrossRef]
  30. Raju, M.; Khaitan, S.K. Modeling and simulation of compressed air storage in caverns: A case study of the Huntorf plant. Appl. Energy 2012, 89, 474–481. [Google Scholar] [CrossRef]
  31. Budt, M.; Wolf, D.; Span, R.; Yan, J. A review on compressed air energy storage: Basic principles, past milestones and recent developments. Appl. Energy 2016, 170, 250–268. [Google Scholar] [CrossRef]
  32. Facci, A.L.; Sánchez, D.; Jannelli, E.; Ubertini, S. Trigenerative micro compressed air energy storage: Concept and thermodynamic assessment. Appl. Energy 2015, 158, 243–254. [Google Scholar] [CrossRef]
  33. Li, Y.; Wang, X.; Li, D.; Ding, Y. A trigeneration system based on compressed air and thermal energy storage. Appl. Energy 2012, 99, 316–323. [Google Scholar] [CrossRef]
  34. Liu, J.L.; Wang, J.H. Thermodynamic analysis of a novel tri-generation system based on compressed air energy storage and pneumatic motor. Energy 2015, 91, 420–429. [Google Scholar] [CrossRef]
  35. Mei, S.; Wang, J.; Tian, F.; Chen, L.; Xue, X.; Lu, Q.; Zhou, Y.; Zhou, X. Design and engineering implementation of non-supplementary fired compressed air energy storage system: TICC-500. Sci. China Technol. Sci. 2015, 58, 600–611. [Google Scholar] [CrossRef]
  36. Venkataramani, G.; Parankusam, P.; Ramalingam, V.; Wang, J. A review on compressed air energy storage—A pathway for smart grid and polygeneration. Renew. Sustain. Energy Rev. 2016, 62, 895–907. [Google Scholar] [CrossRef]
  37. Kanoglu, M.; Dincer, I.; Rosen, M.A. Understanding energy and exergy efficiencies for improved energy management in power plants. Energy Policy 2007, 35, 3967–3978. [Google Scholar] [CrossRef]
  38. Ahmadi, P.; Dincer, I.; Rosen, M.A. Exergy, exergoeconomic and environmental analyses and evolutionary algorithm based multi-objective optimization of combined cycle power plants. Energy 2011, 36, 5886–5898. [Google Scholar] [CrossRef]
  39. Ahmadi, P.; Dincer, I. Thermodynamic and exergoenvironmental analyses, and multi-objective optimization of a gas turbine power plant. Appl. Therm. Eng. 2011, 31, 2529–2540. [Google Scholar] [CrossRef]
  40. Ezzat, M.; Dincer, I. Energy and exergy analyses of a new geothermal–solar energy based system. Sol. Energy 2016, 134, 95–106. [Google Scholar] [CrossRef]
  41. Liu, H.; He, Q.; Saeed, S.B. Thermodynamic analysis of a compressed air energy storage system through advanced exergetic analysis. J. Renew. Sustain. Energy 2016, 8, 034101. [Google Scholar] [CrossRef] [Green Version]
  42. Mohammadi, A.; Mehrpooya, M. Exergy analysis and optimization of an integrated micro gas turbine, compressed air energy storage and solar dish collector process. J. Clean. Prod. 2016, 139, 372–383. [Google Scholar] [CrossRef]
  43. Moran, M.J.; Shapiro, H.N.; Boettner, D.D.; Bailey, M.B. Fundamentals of Engineering Thermodynamics; John Wiley & Sons: Hoboken, NJ, USA, 2010. [Google Scholar]
  44. Hartmann, N.; Vöhringer, O.; Kruck, C.; Eltrop, L. Simulation and analysis of different adiabatic Compressed Air Energy Storage plant configurations. Appl. Energy 2012, 93, 541–548. [Google Scholar] [CrossRef]
  45. Rathore, M.M.; Kapuno, R. Engineering Heat Transfer; Jones & Bartlett Publishers: Burlington, MA, USA, 2011. [Google Scholar]
  46. Press, W.H.; Teulolsky, S.A.; Vetterling, W.T.; Flannery, B.P. Numerical Recipes: The Art of Scientific Computing; Cambridge University Press: New York, NY, USA, 2007. [Google Scholar]
  47. Cheung, B.C.; Carriveau, R.; Ting, D.S.K. Multi-objective optimization of an underwater compressed air energy storage system using genetic algorithm. Energy 2014, 74, 396–404. [Google Scholar] [CrossRef]
  48. Dincer, I.; Rosen, M.A. Exergy: Energy, Environment and Sustainable Development; Newnes: Oxford, UK, 2012. [Google Scholar]
  49. Kotas, T.J. The Exergy Method of Thermal Plant Analysis; Butterworth-Heinemann: London, UK, 1985. [Google Scholar]
  50. Bejan, A.; Tsatsaronis, G.; Moran, M. Thermal Design and Optimization; John Wiley & Sons: New York, NY, USA, 1995. [Google Scholar]
  51. Wang, Z.; Xiong, W.; Ting, D.S.K.; Carriveau, R.; Wang, Z. Conventional and advanced exergy analyses of an underwater compressed air energy storage system. Appl. Energy 2016, 180, 810–822. [Google Scholar] [CrossRef]
  52. Denholm, P.; Kulcinski, G.L. Life cycle energy requirements and greenhouse gas emissions from large scale energy storage systems. Energy Convers. Manag. 2004, 45, 2153–2172. [Google Scholar] [CrossRef]
  53. Holland, J.H. Adaptation in Natural and Artificial Systems: An Introductory Analysis with Applications to Biology, Control, and Artificial Intelligence; University of Michigan Press: Ann Arbor, MI, USA, 1975. [Google Scholar]
  54. Haupt, R.L.; Haupt, S.E. Practical Genetic Algorithms; John Wiley & Sons: Hoboken, NJ, USA, 2004. [Google Scholar]
  55. Deb, K.; Agrawal, R.B. Simulated Binary Crossover for Continuous Search Space. Complex Syst. 1995, 9, 115–148. [Google Scholar]
  56. Da Ronco, C.C.; Benini, E. A Simplex Crossover based evolutionary algorithm including the genetic diversity as objective. Appl. Soft Comput. 2013, 13, 2104–2123. [Google Scholar] [CrossRef]
  57. Chuang, Y.C.; Chen, C.T.; Hwang, C. A real-coded genetic algorithm with a direction-based crossover operator. Inf. Sci. 2015, 305, 320–348. [Google Scholar] [CrossRef]
  58. Chehouri, A.; Younes, R.; Perron, J.; Ilinca, A. A Constraint-Handling Technique for Genetic Algorithms using a Violation Factor. J. Comput. Sci. 2016, 12, 350–362. [Google Scholar] [CrossRef]
  59. Petrakopoulou, F.; Tsatsaronis, G.; Morosuk, T.; Carassai, A. Conventional and advanced exergetic analyses applied to a combined cycle power plant. Energy 2012, 41, 146–152. [Google Scholar] [CrossRef]
  60. Kelly, S. Energy Systems Improvement Based on Endogenous and Exogenous Exergy Destruction; Prozesswissenschaften der Technischen Universität Berlin: Berlin, Germany, 2008. [Google Scholar]
Figure 1. Schematic diagram of the proposed system.
Energies 12 00377 g001
Figure 2. Schematic diagram of compression air storage tank.
Energies 12 00377 g002
Figure 3. Proposed Real Coded Genetic Algorithm flow chart.
Energies 12 00377 g003
Figure 4. Global view and diagram of pilot system.
Energies 12 00377 g004
Figure 5. Comparison of model and experimental results for the charge and discharge tests.
Energies 12 00377 g005
Figure 6. Evolution of the maximum exergy efficiency in each generation.
Energies 12 00377 g006
Figure 7. Schematic diagram of optimized system.
Energies 12 00377 g007
Figure 8. Scattering of optimal design variables during evolution; the case of the number of compression stage (a), of the compression pressure ratio (b), of the volume of air storage tank (c), of the pressure ratio of the high-pressure expansion stage (d), of the pressure ratio of the low-pressure expansion stage (e) and of the inlet temperature of the high-pressure expansion stage (f).
Energies 12 00377 g008
Figure 9. Scattering of optimal design variables during evolution; the inlet temperature of the low-pressure expansion stage (a), of the isentropic efficiency of compressor (b), of the isentropic efficiency of pneumatic motor (c), of the mechanical efficiency of compressor (d), of the mechanical efficiency of pneumatic motor (e) of the compressor motor mass flow rate (f) and of the pneumatic motor mass flow rate (g).
Energies 12 00377 g009
Figure 10. Variation of global exergy efficiency and number of violated constraints with number of compression stages (a,c) and compressor pressure ratio (b,d) at optimal point.
Energies 12 00377 g010
Figure 11. Variation of global exergy efficiency and number of violated constraints with volume of air storage tank (a,c), pressure ratio of high-pressure expansion stage (b,d) and low-pressure expansion stage (e,f) of pneumatic motor at optimal point.
Energies 12 00377 g011
Figure 12. Variation of global exergy efficiency and number of violated constraints with inlet temperature of high-pressure (a,c) and low-pressure (b,d) expansion stages of pneumatic motor at optimal point.
Energies 12 00377 g012
Figure 13. Variation of global exergy efficiency and number of violated constraints with compressor (a,c) and pneumatic motor (b,d) isentropic efficiency at optimal point.
Energies 12 00377 g013
Figure 14. Variation of global exergy efficiency and number of violated constraints with compressor (a,c) and pneumatic motor (b,d) mechanical efficiency at optimal point.
Energies 12 00377 g014
Figure 15. Variation of global exergy efficiency and number of violated constraints with compressor (a,c) and pneumatic motor (b,d) mass flow rate at optimal point.
Energies 12 00377 g015
Table 1. Expression of the rate of exergy destruction for proposed storage system relevant components.
System ComponentExergy Destruction Rate
Air compressor (AC) E x ˙ c D = i = 1 n E x ˙ c , i i n i = 1 n E x ˙ c , i o u t + P e l c , c
Intercoolers (Int) E x ˙ I n t D = i = 1 n E x ˙ c , i o u t E x ˙ c , i + 1 i n i = 1 n E x ˙ c w , i o u t E x ˙ c w , i i n
Compressed-air storage tank (CASt) E x ˙ C A S t D = E x ˙ c , n o u t E x ˙ C A S t o u t
Heaters (He) E x ˙ H e D = i = H P , L P E x ˙ h w , i i n E x ˙ h w , i o u t i = H P , L P E x ˙ m , i i n E x ˙ m , i o u t
Pneumatic motor (PM) E x ˙ P M D = i = H P , L P E x ˙ m , i i n i = H P , L P E x ˙ m , i o u t P e l c , G
Table 2. Range of each decision variable.
Decision VariableRangeDecision VariableRange
n2–5 η I s C (%)70–75
π 2–6.5 η I s , m (%)70–90
V t (m 3 )0.3–30 η m C (%)65–75
β H P 6–10 η m m (%)75–90
β L P 2–6 m ˙ c (kg · s 1 ) 0.004–0.0156
T m , H P i n ( C)15–50 m ˙ m (kg · s 1 ) 0.066–0.132
T m , L P i n ( C)15–50
Table 3. Comparison between model results and experimental results of filling and discharge time of storage tank.
ParametersModel ResultsExperimental ResultsError (%)
Filling time (s)14,57214,874 2.0
Discharge time (s)18081767 2.3
Table 4. Comparison between obtained results and data published in [41] for compression and expansion process.
StateT ( C) e x (kJ · kg 1 )
Present WorkReferenceError(%)Present WorkReferenceError(%)
115.0015.00-00-
2147.66148.060.27119.70128.254.31
335.0035-110.62117.276.01
4176.47177.300.47221.57241.148.83
535.0035-183.45190.864.04
6176.47177.300.47312.40314.630.71
735.0035-274.37276.370.73
8176.47177.300.47403.32406.120.70
935.0035.00-365.28363.250.56
13540.00540.00-548.93552.890.72
14364.68374.712.68347.52358.263.09
15957.00957.00-803.68802.030.21
16461.48486.065.05203.08241.3718.86
Table 5. Parameters of modified RCGA for each case.
ParametersCase 1Case 2Case 3Case 4Case 5Case 6
P o p S i z e 50100100100100200
M a x G e n s 1001002005001000500
P c 0.600.600.600.600.600.60
P m 0.0050.0050.0050.0050.0050.005
Table 6. Optimal parameters from optimization.
Decision VariableOptimum ValueDecision VariableOptimum Value
n3 η I s C (%)75
π 3.8 η I s , m (%)90
V t (m 3 ) 30 η m C (%)75
β H P 8 η m m (%)90
β L P 5.2 m ˙ c (kg · s 1 ) 0.0156
T m , H P i n ( C) 28.71 m ˙ m (kg · s 1 ) 0.066
T m , L P i n ( C) 28.66
Table 7. Thermodynamic properties of each point of the optimized system.
StateStream m ˙ (kg · s 1 )T ( C)P (Bar)h (kJ · kg 1 )s (kJ · kg 1 · K 1 ) e x (kJ · kg 1 )
1Air0.0156201.01293.326.840
2Air0.01562003.84475.556.94152.61
3Air0.0156353.84308.386.50112.69
4Air0.0156223.8314.58499.916.61274.56
5Air0.01563514.58308.386.12225.01
6Air0.0156223.8355.42499.916.22386.88
7Air0.01563555.42308.385.74337.33
8Air0.06617.5741.60290.895.76312.83
9Air0.06628.7141.60302.065.80312.95
10Air0.066−94.315.20178.345.87167.87
11Air0.06628.715.20302.066.40138.00
12Air0.066−73.661199.466.4518.40
13Water0.0499201.0183.950.300
14Water0.049932.501.01136.190.471.07
15Water0.049934.321.01143.810.501.41
16Water0.049934.321.01143.810.501.41
17Water0.149733.711.01141.270.491.29
18Water0.298133.711.01141.270.491.29
19Water0.298133.121.01138.800.481.18
20Water0.298127.161.01113.890.400.35
21Water0.596330.141.01126.350.440.69
Table 8. Results of thermodynamic simulation.
ParametersUnitValue
C h a r g e t i m e ( t F P ) Hour 8.65
D i s c h a r g e t i m e ( t D P ) Hour 2.02
P e l c , c kW 12.00
P e l c , G kW 12.77
Q ˙ h kW 8.58
Q ˙ R h kW 8.90
m h w Ton 4.64
R T E % 79.07
η e x % 24.87
Table 9. Total exergy destruction and exergy destruction ratio of each component for a complete cycle of charge and discharge.
ComponentExergy DestructionExergy LossExergy Destruction Ratio
(kWh)(kWh)(%)
Compression stages39.52...53.04
Expansion stages9.50...12.75
Intercoolers17.09...22.94
Heaters4.61...6.18
CASt3.79...5.09
Overall system74.513.50100