Abstract
Anaerobic digestion of sewage sludge produces large amounts of CO2 which contribute to global CO2 emissions. Capture and conversion of CO2 into valuable products is a novel way to reduce CO2 emissions and valorize it. Membrane contactors can be used for CO2 capture in liquid media, while bioelectrochemical systems (BES) can valorize dissolved CO2 converting it to CH4, through electromethanogenesis (EMG). At the same time, EMG process, which requires electricity to drive the conversion, can be utilized to store electrical energy (eventually coming from renewables surplus) as methane. The study aims integrating the two technologies at a laboratory scale, using for the first time real wastewater as CO2 capture medium. Five replicate EMG-BES cells were built and operated individually at 0.7 V. They were fed with both synthetic and real wastewater, saturated with CO2 by membrane contactors. In a subsequent experimental step, four EMG-BES cells were electrical stacked in series while one was kept as reference. CH4 production reached 4.6 L CH4 m−2 d−1, in line with available literature data, at a specific energy consumption of 16–18 kWh m−3 CH4 (65% energy efficiency). Organic matter was removed from wastewater at approximately 80% efficiency. CO2 conversion efficiency was limited (0.3–3.7%), depending on the amount of CO2 injected in wastewater. Even though achieved performances are not yet competitive with other mature methanation technologies, key knowledge was gained on the integrated operation of membrane contactors and EMG-BES cells, setting the base for upscaling and future implementation of the technology.
Highlights:
- The CO2 captured in wastewater can be converted to CH4 through electromethanogenesis (Carbon Capture and Utilization, CCU).
- The process is suitable to chemically store renewable energy surplus as CH4 (Power to fuel).
- Membrane contactors for CO2 capture and bioelectrochemical systems (BES) for electromethanogenesis were successfully integrated for the first time.
- A stack of BES, fed with real municipal wastewater, was long-term tested under different electric configurations.
- A production of 4.6 L CH4 m−2 d−1 was achieved while storing 65% of applied electric energy.
- Carbon conversion efficiency was limited depending on CO2 amount injected in wastewater.
1. Introduction
Anaerobic digestion of sewage sludge, producing biogas (60% CH4 and 40% CO2 v/v approximately), is responsible for the yearly emission of 66 million of Nm3 CO2 in Spain. Concurrently, International Energy Agency (IEA) and European Commission fixed novel targets of 80% CO2 emissions reduction by 2050 [1,2]. The challenge of economy decarbonization requires the development and implementation of massive amounts of renewable energy sources (RES) and methods for carbon capture and use (CCU). However, the integration of RES (mainly wind and solar) in the electrical grid makes it difficult to match the energy production and demand, resulting in energy surplus phenomena. Electrical batteries can provide, nowadays, a solution for the storage of this surplus energy, but alternative technologies must be developed, prioritizing flexibility, energy capacity (from MWh to TWh) and discharge time scale (from milliseconds up to months). The production of fuels and bulk chemicals from CO2 using RES surplus, known as Power to gas/fuel, is a potential high capacity and seasonal energy storage solution [3,4]. In particular, the production of methane enables to merge existing gas and electricity grids into a single hybrid energy system, increasing its overall resilience and decreasing energy price. Chemical and biological methanation (currently implemented at pilot scale) allow converting biogas residual CO2 to CH4, reaching final biomethane standards [5]. The term biomethane defines a biogas rich in CH4 (>95% v/v), obtained from a biological source, which can be injected into natural gas grid or directly used as fuel for vehicles [6]. Both methanation options present drawbacks in terms of expensive catalyst, high temperature and pressure, or on-site H2 requirement [7].
Bioelectrochemical systems (BES) were first proposed in 2009 as an alternative way to drive the reduction of CO2 (dissolved into an aqueous medium) into biomethane [8]. Since then, several electromethanogenesis (EMG) studies were published [6,9,10]. Generally speaking, BES uses electro-active microorganisms for the treatment of wastewater, with production of electricity (microbial fuel cells, MFCs), hydrogen (microbial electrolysis cells, MECs), or other chemicals (microbial electrosynthesis cells, MES) [11]. The standard BES configuration comprises an anode, where water or organic matter is oxidized, and a cathode, where a counter reaction occurs (optionally separated by an ionic exchange membrane) [12]. The fist microbial rechargeable battery, combining a MES and a MFC into a single acetate-based system, was recently proposed for energy storage purposes (day time-scale) [13].
The EMG-BES technology represents an attractive solution for seasonal energy storage, like the other power-to-gas/fuel alternatives. In this case, the anode can be abiotic (performing water splitting) or biotic (organic matter oxidation). The biotic cathode can produce methane by two mechanisms: (i) indirect EMG, using H2 as electrochemical mediator, and (ii) direct EMG, using the cathode as direct reducing power source. It was demonstrated for direct EMG to be the most energy efficient mechanism [14]. Table 1 shows anode and cathode reactions of EMG-BES cells, with their reduction potential at biologically relevant conditions (pH 7, 25 °C).

Table 1.
Anode and cathode reactions of EMG-BES systems (SHE = standard hydrogen electrode).
Cathode potentials (Ecat) lower than −0.4 V vs standard hydrogen electrode (SHE) are required in practice to perform EMG, due to overpotentials. These overpotentials make it difficult to identify the actual reduction pathway (direct or indirect) taking place at the cathode. However, it can be assumed that the lower the Ecat, the most probable indirect EMG overcomes direct EMG as methane generating pathway. Moreover, at lower Ecat it is possible to increase reaction kinetics and achievable CH4 production rate (Figure 1).
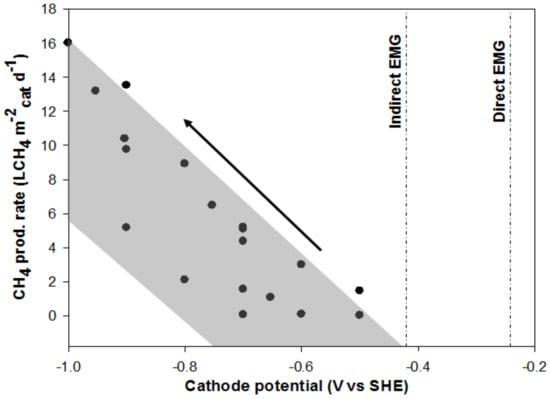
Figure 1.
Summary (not exhaustive) of the existing EMG-BES literature [8,14,15,16,17,18,19,20,21,22,23,24]. Surface specific methane production rate values are reported versus applied cathode potential. Standard reduction potentials for direct and indirect EMG (at biologic relevant conditions) are reported for reference.
From an energetic point of view, a bioanode performing oxidation of organic matter, contained in wastewater, allows to reduce the potential difference with the cathode, i.e. the voltage applied to the EMG-BES [12] (Table 1). In case of capturing CO2 directly into wastewater, it is therefore possible to operate both oxidation and reduction processes into a single-chamber reactor, without the use of an ionic exchange membrane. This represents a scalable and cheaper option than the double-chamber BES architecture. Ultimately, a voltage of 0.7–1.2 V must be applied in single-chamber EMG-BES for the process to occur at a significant rate [25]. A lower value favors direct EMG over indirect one as main CH4 generation pathway. Microbial inoculum source (for both bioanode and biocathode) can range from activated to anaerobic sludge, collected at municipal wastewater treatment plants (WWTPs), or enriched cultures from previously operated BES. Electrodes material is usually carbonaceous based, in form of carbon cloth, fiber or paper [17,26]. Graphite felt showed good results given its 3D structure suitable to biofilm attachment [17].
The CO2 must be captured in wastewater in order to be available for the EMG process. Adsorption in wastewater converts gaseous CO2 into carbonates and bicarbonates. Up to date, water scrubbing is the most used downstream technique for CO2 capture and biogas upgrading, consisting of an absorption column where CO2 is absorbed into water. In most cases the column regeneration step consists of a stripping phase, where the same amount of CO2 is released to the atmosphere, thereby not contributing to any emissions reduction target [27]. Alternative biogas upgrading methods are under study to improve separation process compared to water scrubbing, while valorizing captured CO2 and reducing operating costs. Among these methods, membrane contactors represent a promising alternative [28]. The use of membrane contactors presents numerous advantages over absorption columns, e.g., no flooding issues, no liquid drag by ascendant gas, limited formation of foams, virtually independent gas and liquid flow velocities [29]. A comprehensive evaluation of the latest developments in membrane-based technologies for CO2 capture was done by Luis et al. [30].
One of the materials that can be used for membrane manufacture is polypropylene (PP), reaching CO2 transfer rates (from gas to liquid phase) of approximately 2 × 10⁻⁴–4 × 10⁻⁴ mol m−2 s−1 in case of chemical absorption (alkanolamines) [31,32]. Other available membrane materials include silicone and polyvinylidene fluoride (characterized by larger pore sizes), for which CO2 transfer rate can reach 1 × 10⁻⁴–5.4 × 10⁻⁴ mol m−2 s−1 [33,34]. Alternatively, polytetrafluoroethylene (PTFE) membranes can be used, showing good resistance to water permeation from gas to liquid phase [35]. The CO2 transfer rate can be generally increased by increasing the liquid flow, decreasing the gas flow, or increasing the solvent concentration [34]. Gas-permeable hydrophobic membranes were previously applied to double-chamber MECs to transport CO2 and NH3 between anolyte and catholyte [36].
To authors’ knowledge, no studies have been reported about the integration of membrane contactors for CO2 capture in wastewater, and EMG-BES converting the dissolved CO2 into biomethane. As previously explained, the technology integration could fulfill the two complementary objectives of CCU and Power to gas/fuel. Therefore, in this study we integrated for the first time two lab-scale systems: an initial one dissolving CO2 into wastewater by means of two membrane contactors, and the other implementing EMG-BES cells for dissolved CO2 conversion to methane. A complete assessment in terms of wastewater treatment efficiency, methane production, current and power consumption and cathodic Coulombic efficiency was performed, leading to an estimation of carbon conversion and energy storage capacity of EMG-BES cells. The present study aims at setting the stepping stone for a successful future scale-up of the technology.
2. Materials and Methods
2.1. CO2 Capture into Wastewater by Membrane Contactors
The hollow fiber membranes act as selective separation barriers between the wastewater, circulating outside the fibers (shell), and the CO2-rich biogas, flowing on the inside (lumen) as shown in Figure 2a. The CO2 transfer (and capture) occurs when the gas phase reaches the liquid through the hydrophobic membrane pores. By increasing wastewater pH it is possible to accelerate the chemical absorption process due to the equilibrium shift occurring when CO2 is converted to carbonate and bicarbonate forms. A basifying agent like NaOH can be used, or lime as a cheaper alternative [37]. For this study a 3 M solution of NaOH was prepared dissolving pellets of NaOH in distilled water; 35 mL of the solution were added per liter of wastewater to reach pH 13 and increase alkalinity. NaOH addition caused the precipitation of calcium and magnesium hydroxides (Mg(OH)2 and Ca(OH)2), forming flocs which were settled in a pre-treatment tank kept at ambient temperature. After 24 h, the supernatant was poured into a homogenization tank, also kept at ambient temperature, where it was saturated with CO2. Two PP membrane contactors (3MTM Liqui-CelTM G542 X50, 3M, South Lakes Drive Charlotte, NC, USA) of 0.54 m2 each one were installed in series hydraulic configuration and used for CO2 capture (Figure 2b). The membranes material (PP) was chosen given its commercial maturity and ease of supply. The series-stack configuration was adopted to increase the available membrane surface for CO2 transport, though achieving complete biogas upgrading by a single transit through the stack. Synthetic biogas (30% CO2, 70% CH4 v/v, Carburos Metálicos, Barcelona, Spain) was introduced in the stack of membrane contactors on the lumen-side, from top to bottom, while the wastewater was pumped in counter current configuration on the shell-side. The wastewater was continuously recirculating from homogenization tank with a flow-rate of 600 mL min−1. The pressure of the influent biogas was set at 1 bar (manometer pressure), while its flow-rate was regulated at 2 L min−1.
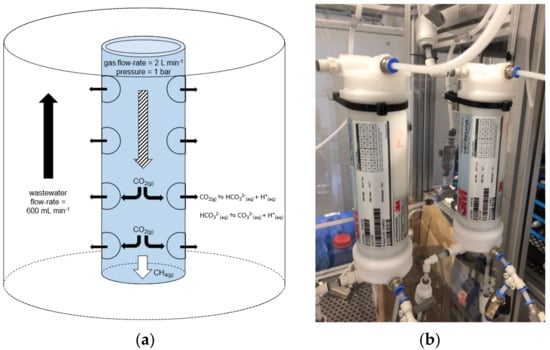
Figure 2.
Membrane contactors for CO2 capture: (a) operation parameters; (b) experimental setup.
The pH and electrical conductivity (EC) of wastewater were measured (at 5 min intervals) during the CO2 saturation process (HQ40 multimeter, Hach Lange, Barcelona, Spain). Liquid samples were regularly collected (also at 5 min intervals) through an auto-sampler (SHIMADZU ASI-V, Barcelona, Spain), to analyze the Total Carbon (TC) concentration of wastewater (SHIMADZSU TOC-V CSH analyzer). The amount of absorbed CO2 was calculated as the difference between TC values measured before (TC0) and after (TCfin) the CO2 saturation process. The CO2 transfer rate was estimated dividing the gradient of TC increase by the available membrane surface. Process parameters were set to reach a TCfin concentration in wastewater near 1.0 g L−1, relatively high compared with typical values of municipal effluents (around 0.2 g L−1). This concentration value was chosen in order: (i) not to be limiting for EMG process, (ii) to guarantee low cathodic overpotentials and (iii) based on previously published literature (equivalent amount of NaHCO3) [14,16].
A cleaning protocol was regularly carried out to eliminate fouling agents from membranes, which decreased their performance over time. The cleaning protocol included (i) a first 30 min washing step with distilled water, without recirculation, (ii) 45 min washing with 1 M sulfuric acid and recirculation, and (iii) 30 min final polishing with distilled water, without recirculation [38]. This protocol was carried out, every 3 experiments, to prevent membranes efficiency loss (to max 50%). Efficiency loss was evaluated by comparing the reached TCfin concentration in wastewater with the value achievable by clean membranes (TCfinclean), as detailed in Equation 1. An example of calculation is presented in Table A1 in the Appendix A.
Efficiency loss = (TCfinclean − TCfin)/TCfinclean
2.2. EMG-BES Construction, Operation and Characterization
Five replicates, single-chamber, membrane-less EMG-BES reactors were designed and built as shown in Figure 3. The net volume (V) of each reactor was 714 mL. Anode and cathode electrodes (170 cm2 projected surface, each) were made of thermally activated carbon felt, 4.6 mm thick (SGL Group, Munich, Germany). This material was chosen given its mechanical and electrical properties, and its appropriate surface chemistry, suitable for biofilm growth, based on previous experience [25]. The ratio between electrodes surface and reactor volume (23.8 m2 m−3) was within the range of values that could be calculated from previous EMG studies (10–40 m2 m−3) [8,16,21,23,24]. The electric connection to the external circuit was made by current collectors in graphite/fluoropolymer composite material (SGL Group).
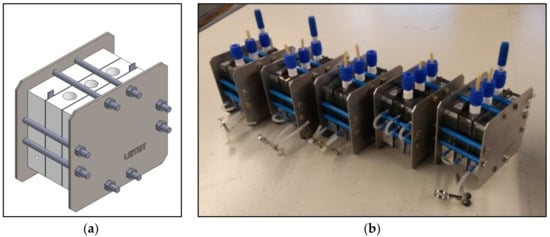
Figure 3.
(a) The design and (b) photos of the constructed EMG-BES reactors.
Reactors were inoculated in batch mode with a mixture of 50% acetate-based mineral medium and 50% anaerobic sludge, collected from the anaerobic digester recirculation line at a local WWTP (the sludge chemical composition is shown in Table A2 in the Appendix A). The mineral medium was composed of 450 mg L−1 NaCl, 165 mg L−1 MgCl2 6H2O, 13.6 mg L−1 CaCl2, 15.3 mg L−1 Mg2SO4, 8.4 g L−1 NaHCO3, 2.5 g L−1 CH3COONa, 128 mg L−1 K2HPO4, 50 mg L−1 NH4Cl, 1 mL L−1 trace elements solution (Table A3, Appendix A) and 5 mL L−1 vitamins solution [25]. A constant voltage of 0.7 V was applied between anode and cathode of each EMG-BES by using a potentiostat (VMP3, BioLogic, Grenoble, France). This voltage value was chosen based on a previous EMG study performed on single-chamber reactors, for which an energy efficiency of 61% was reported [22]. The inoculation strategy was chosen given its scalability, as the 2-electrodes configuration could be easily replicated and up-scaled by using a conventional power source.
After 28 days the hydraulic operation switched from batch to continuous feeding, maintaining an average hydraulic residence time (HRT) of 2.6 days. This HRT was kept steady for the rest of the experiment duration. A recirculation flux of 150 mL min−1 helped maintaining homogeneous conditions inside each reactor, avoiding concentration gradients and electrodes polarization. A thermostatic bath, installed along the recirculation loop, kept EMG-BES reactors at a mesophilic temperature of 32 ± 1 °C. The inoculation process was successfully completed in 120 days. The maturity of anode biofilm was assessed through cyclic voltammetries [39].
For a first experimental period following inoculation, all reactors were operated individually and fed with the acetate-based mineral medium previously described (until day 337). The feedstock medium, characterized by a COD concentration of 1.95 g O2 L−1 (COD, Chemical Oxygen Demand) and 1.2 g L−1 of inorganic carbon, was neutralized at pH 7, flushed with CO2 for 30 min and stored at 4 °C prior to its use. Its EC was around 11 mS cm−1. On day 338, the medium was replaced by municipal wastewater (primary settler effluent, collected at a local WWTP), saturated with CO2 through the membrane contactors system previously described and stored at 4 °C. Its chemical composition is summarized in Table A4 of the Appendix A. The CO2 saturated wastewater had generally a basic pH, which was neutralized by acetic acid until reaching a value of 7.5. At this pH, more than 90% of stored inorganic carbon was still present in soluble bicarbonate form, while gaseous CO2 stripping was limited to a negligible amount. Moreover, acetic acid addition increased wastewater EC to 11 mS cm−1 and COD content to 1.3 g O2 L−1. Sometimes, H2SO4 was added to facilitate pH regulation.
The EMG-BES cells were powered at a constant voltage of 0.7 V by using the potentiostat, until day 267. The current consumed by each EMG-BES was monitored once per minute, while individual electrode potentials were measured in comparison with an Ag/AgCl reference electrode (+0.197 V vs. SHE, Xi’an Yima Opto-electrical Technology, Shaanxi, China). From day 268 to the end of the experiment (day 440), BES 1–4 were electrically stacked in series at different stack voltages (2.4, 3.2 and 4 V respectively), through the same potentiostat. A passive system was adopted for voltage balancing. Current consumption was monitored once per minute. Individual voltage drops of the four connected cells were measured by a parallel-connected DAQ board (PicoLog 1216, Farnell, Barcelona, Spain). One EMG-BES reactor (BES 5) was kept operating individually for all the experimental period (440 days), as reference. The timeline of performed experiments on the 5 available EMG-BES reactors is presented for clarity in Figure 4.
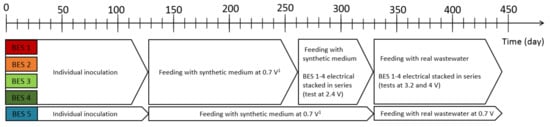
Figure 4.
Timeline of performed experiments on the five replicate EMG-BES reactors.1 In this period, complementary tests on applied voltage/cathode potential were performed (data not shown).
EMG-BES operation was evaluated on a weekly base, by averaging the electric results over cycles having duration of 160 h. Normalized values of current and power density were obtained dividing them by the cathode surface. Samples of influent (IN) and effluent (OUT) wastewater were collected from each reactor at the end of each cycle, and characterized in terms of pH, conductivity and total COD (LCK 514 kits, Hach Lange). Feeding rate (Q) and temperature were regularly checked. The organic loading rate (OLR) was calculated by equation 2, while the organic matter removal efficiency (ηCOD) was determined by equation 3.
OLR = CODIN·Q/V
ηCOD = (CODIN − CODOUT)/CODIN
The gas produced by each EMG-BES reactor was trapped by an external chamber and sampled with a syringe. Gas samples were analyzed to determine the volumetric content of CO2, CH4, O2 and N2 by a Micro-GC (Agilent 490, Barcelona, Spain) with dual channel cabinet and thermal conductivity detector. The methane production rate was obtained by multiplying total gas production rate (measurable through the external collection chamber) by its relative CH4 content. A normalized value of methane production was achieved dividing it by cathode surface.
The specific energy consumption of EMG-BES reactors (in kWh m−3 CH4) was calculated dividing consumed electric power by methane production rate. Considering Gibbs free energy of methane oxidation (11 kWh Nm−3 CH4), it was thereby possible to evaluate the energy storage efficiency, in the frame of a Power to gas/fuel technology approach [40]. Cathode columbic efficiency (CEcat), representing the proportion between the electrons recovered as CH4 versus available current, was calculated as described by Batlle-Vilanova et al. [6]. In some cases, CEcat calculation resulted in values higher than 100%. Reversing its calculation (1/CEcat), it was thereby possible to estimate the theoretical maximum amount of CH4 produced via EMG, versus effectively measured production.
Finally, the CCU potential of the integrated technology was evaluated in terms of carbon conversion efficiency (ηCONV) from dissolved CO2 to gaseous CH4. The ηCONV was calculated through equation 4, dividing the molar amount of recovered methane by the molar amount of inorganic carbon available in wastewater, considering 1-day calculation interval:
where Vmol is the molar volume of an ideal gas (24.5 L mol−1 at 1 atm pressure and 25 °C), IC is the inorganic carbon concentration of the influent wastewater, Mm is the molar mass of carbon (12 g mol−1) and Q is the measured wastewater feeding rate in each EMG-BES reactor.
ηCONV = (CH4 prod. rate/Vmol)/(IC/Mm × Q)
3. Results and Discussion
3.1. CO2 Capture in Wastewater through Membrane Contactors
Before starting each CO2 capture test, wastewater pH was increased to 13 (by NaOH addition), in order to increase both CO2 physical absorption kinetics and its chemical conversion to carbonates. Once the gas transfer started, the pH remained constant for approximately 20 min. An inflexion point could be generally observed between 25 and 28 min of operation (Figure 5a). Then the pH decreased down to a base value of 10, due to carbonates formation (H2CO3, HCO3− and CO32−), which were consequence of CO2 dissolution. Concurrently the EC decreased from 16 mS cm−1 to 8 mS cm−1, due to interaction of CO32− with the ions Ca2+ and Mg2+ and precipitation of resulting salts. After that, wastewater EC was increased to 11 ± 2.7 mS cm−1 before feeding the EMG-BES reactors, due to neutralization to pH 7.5 performed with acetic acid (details in Table A4 of Appendix A).
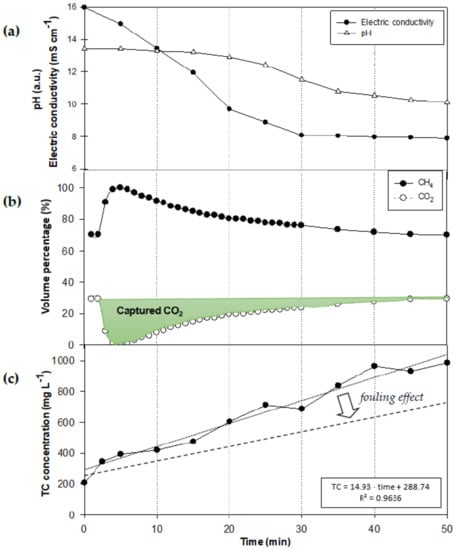
Figure 5.
Example of CO2 capture test. Sub-figures show the evolution in time of: (a) pH and electric conductivity of wastewater; (b) biogas effluent composition; (c) total carbon (TC) concentration of wastewater. Highlighted in green, the area corresponding to CO2 captured in wastewater. A regression curve in sub-figure (c) shows that CO2 transfer process follows linear dynamics (equation on the bottom right of figure). Membranes fouling reduces the CO2 transfer rate.
Figure 5b shows the composition of the biogas effluent (downstream membrane contactors) over time, during a CO2 saturation test. It can be observed that 50 minutes were sufficient to complete the carbon capture process (with adopted experimental conditions, and clean membranes), as the biogas effluent presented the same composition of the influent one (70% CH4, 30% CO2 v/v). For this reason, a pH value of 10 was chosen as signpost for calculating the amount of absorbed CO2. Its capture rate would have been residual at lower wastewater pH.
Finally, the Figure 5a,b shows that tuning wastewater pH (together with gas and liquid flow-rates) it is possible to simultaneously achieve CO2 capture and biogas upgrading by membrane contactors. Indeed, when wastewater is at pH 13, the gas effluent (downstream membrane contactors) respects biomethane standards in terms of CH4 content (100% v/v).
The captured CO2 (highlighted in green in Figure 5b) could be detected as increment of TC concentration in wastewater, reaching an average concentration of 1.0 ± 0.3 g TC L−1 (Figure 5c) for these specific operational conditions. This indicates an increase of about 0.8 g TC L−1 compared to initial wastewater concentration. The transfer rate of CO2 from biogas to wastewater was estimated from the gradient of the linear regression curve (R2 of 0.96), reaching 0.019 mM m−2 s−1. Although this value is lower than the maximum rates reported in literature for PP-based membranes [31], it is noteworthy to mention that real wastewater was used as CO2 absorption medium, instead than synthetic NaOH-based media generally reported in literature for this kind of experiment. Moreover, gas and liquid flow-rates used for the experiment were lower than typical reported values for membrane-based CO2 capture tests. Higher flow-rate values could have increased CO2 transfer rate, at the expenses of a lower quality of the biogas effluent in terms of CH4 content. Also differences in membrane structure (pore size, porosity, thickness, etc.), compared to literature experiments, might have affected the process.
The CO2 transfer rate was progressively reduced by membranes fouling, as shown in Figure 5c and Table A1 (Appendix A) going from Test 1 to Test 3. It was demonstrated that periodic cleanings, performed every 3 experiments, could keep the membranes at optimal conditions.
3.2. Operation of Individual EMG-BES at Constant Voltage and Synthetic Feeding
During the first part of the experiment, after inoculation phase, five identical EMG-BES cells were operated individually at a constant voltage of 0.7 V and fed with synthetic wastewater at an OLR of 0.7 ± 0.1 kg COD m−3 d−1. The OLR was chosen based on previous authors’ experience, acquired on MFCs, and it was kept fairly constant throughout the whole experiment. Figure 6a shows that methane production rate gradually increased, reaching 1.8 ± 0.8 L CH4 m−2 d−1 on day 266 (BES 3). Performances were quite different between the five replicate reactors, although they were kept at identical operative conditions (Table A5, Table A6, Table A7, Table A8 and Table A9 in the Appendix A report a selection of operation cycles, for comparison). This was likely due to the method adopted for offgas extraction and separation, allowing its occasional accumulation in the reactors headspace. Generally, BES 1 was the reactor showing the poorest performance in terms of methane production, while BES 3 and 4 were the best performing ones.
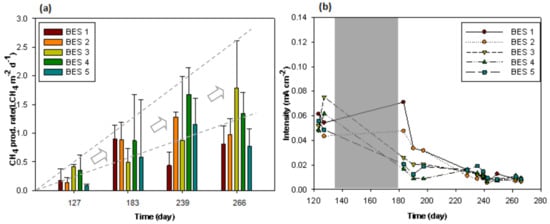
Figure 6.
(a) CH4 production rate of individual EMG-BES (after inoculation), operated at a constant voltage of 0.7 V and fed with synthetic medium; (b) Current density consumption measured during the same period. No electrical data were collected within the experimental period reported in grey.
On the other hand, EMG-BES current consumption was more comparable. It decreased over time, after the inoculation period, going from 0.06 ± 0.01 mA cm−2 down to 0.01 ± 0.01 mA cm−2 for all reactors (Figure 6b). Accordingly, the cathode potential gradually increased from −0.8 V vs SHE (day 127) to −0.4 V vs SHE (day 266, end of experimental period). The behavior was not investigated in detail, although it may indicate a switch in bioelectrochemical methane production pathway from indirect EMG to direct EMG (see Table 1). At the same time, cathodic columbic efficiency increased from 10–25% (day 127) to more than 100% at the end of the experimental period. This indicates that methane was being generated by more metabolic pathways than the pure bioelectrochemical one, like acetoclastic methanogenesis and hidrogenotrophic pathways.
Effluent wastewater pH increased one point compared to the influent, reaching 8.0 ± 0.3. The EC slightly reduced along the process, likely due to a partial biomass washout. The pH variation affected offgas composition, where CO2 was never detected at a volume percentage higher than 10% (average of 2–3%, depending on considered EMG-BES). At that pH, according to carbonate equilibrium, more than 99% of CO2 was present in soluble carbonate and bicarbonate forms. The content of CH4 was around 30%, while the remaining gas was composed by N2 (60–65%) and O2 (2–3%) (Table A5, Table A6, Table A7, Table A8 and Table A9, in the Appendix A). Nitrogen presence was due to air intrusion in the system, which was kept at slight depression. However, the ratio between O2 and N2 of the offgas was lower than that of atmospheric air (4% compared with 27%). This because O2 content of air entering in the system was mainly consumed by the heterotrophic bacteria colonizing EMG-BES reactors. Organic matter (COD) removal efficiency was stable around 93 ± 2%.
3.3. Operation of Individual EMG-BES at Constant Voltage and Municipal Wastewater Feeding
One EMG-BES reactor (BES 5) was kept operating individually for the entire experimental period, as a reference. When synthetic feeding was replaced by CO2 saturated wastewater, the production of methane decreased from 1.5 ± 1.3 L-CH4 m−2 d−1 (day 288) to 0.3 ± 0.1 L-CH4 m−2 d−1 (day 351). It gradually reached 0.8 ± 0.7 L-CH4 m−2 d−1, while maintaining an OLR of 0.5 ± 0.1 kg COD m−3 d−1 (see Figure 7 and Table A9 in the Appendix A).
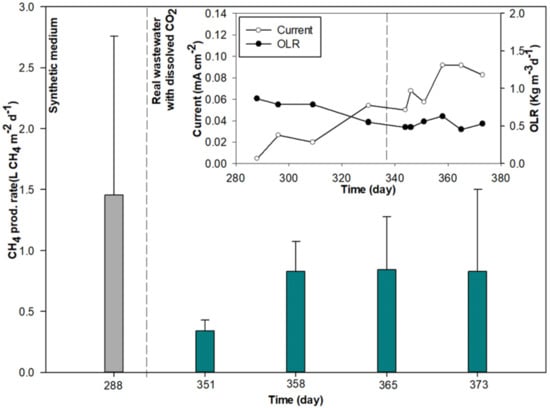
Figure 7.
CH4 production rate of individual EMG-BES (BES 5), operated at constant voltage of 0.7 V, when passing from synthetic to municipal wastewater feeding. Sub-figure represents current density consumption and applied organic loading rate (OLR) during the same experimental period. Reference vertical lines identify the moment when synthetic feeding was replaced by real wastewater feeding.
Current consumption increased from 0.01 to 0.08 mA cm−2 and cathode potential decreased to −0.6 V vs SHE. This implies that bioelectrochemical CH4 production was more relevant with real municipal wastewater (cathode Coulombic efficiency between 36% and 40%), compared to synthetic feedstock. Performance improvement may be caused by continuous biomass replenishment with municipal wastewater feeding, turning into a synergic effect with EMG-BES preexisting microbial population (mostly attached onto cathode surface), in an opposite manner to the natural dilution effect occurring in CSTR-like reactors (CSTR = Continuously Stirred Tank Reactor).
The pH of wastewater effluent slightly increased compared to the first experimental period, up to 8.3 ± 0.3. This was due to both a higher starting point (influent pH of 7.5) and a higher current consumption. The average organic matter removal decreased to 83 ± 5%, due to the more complex wastewater matrix. The CH4 content in offgas increased to 40%, while the rest was mainly N2 (55%, due to air intrusion) and CO2 (2%).
3.4. Operation of Series-Stacked EMG-BES with Municipal Wastewater Feeding
During the last experimental period, 4 EMG-BES cells were electrically connected in series at different stack voltages and were fed in parallel with CO2 saturated wastewater at an OLR ranging between 0.5 and 0.7 Kg COD m−3 d−1 (Figure 8). When operating a series-connected stack, it is important to achieve a cell balance condition to tune the electrodes potentials (both anodic and cathodic one) and drive microbial metabolism towards the desired end-products.
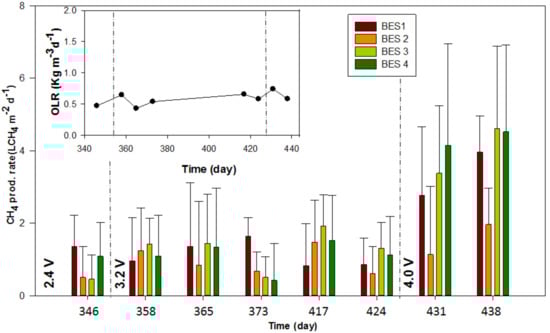
Figure 8.
CH4 production rate of series-connected EMG-BES at different stack voltages (2.4, 3.2 and 4.0 V). The sub-figure represents the applied organic loading rate (OLR).
During the days 268–346 the stacked system was operated at 2.4 V. The stack voltage was not balanced within the four connected cells (0.8 V, 0.6 V, 0.8 V and 0.2 V for BES 1 to 4, respectively). Current consumption (unique value for a series-stacked system) stabilized on low values, between 0.02 and 0.03 mA cm−2. It is worth mentioning that cathode potential was near −0.4 V vs SHE, irrespective of considered cell. Measured methane production rates were between 0.5 ± 0.6 and 1.4 ± 0.8 L CH4 m−2 d−1, in line with literature data presented in Figure 1 (at similar cathode potentials). CH4 content in the offgas of the four reactors was between 50% and 59%, while remaining gas was mainly N2 (33–43%), due to air intrusion in the system. Gaseous CO2 was present at 3–6% (due to wastewater effluent pH, around 8.2 ± 0.1), while O2 could be detected only in traces (1% max). Organic matter removal efficiency of EMG-BES stack stabilized at 90 ± 1%, due to acetate-based nature of wastewater influent (still used at this experiment time, as shown in Figure 4).
During the days 347–424 the stack voltage was increased to 3.2 V. It still divided in an uneven way between the four connected cells (1.0 V, 0.9 V, 0.7 V and 0.6 V for BES 1 to 4, respectively) although the stack was more balanced than previous test at 2.4 V. Current density remained around 0.02–0.03 mA cm−2. Cathode potential of BES 1 and 2 was around −0.45 V vs SHE, while that of BES 3 and 4 slightly decreased to −0.5 V vs SHE. Methane production rates of individual EMG-BES did not follow any apparent trend, and were between 0.4 ± 1.0 and 1.9 ± 0.8 L CH4 m−2 d−1. The offgas was composed on average by: 44–47% CH4, 52–54% N2, 1–2% CO2 and 0–1% O2, due to the reasons exposed before (effluent pH at 8.4 ± 0.1). Organic removal efficiency decreased to 80 ± 7%, due to the more complex matrix of the adopted municipal wastewater.
Given the slightly better results obtained by the stack at 3.2 V, in terms of voltage balancing, it was decided to further increase the stack voltage to 4.0 V. The condition was maintained until the end of the experiment (day 440). This time, the 4 EMG-BES showed balanced voltage drops around 1.0 V. The potentials of the four cathodes remained between −0.4 and −0.5 V vs SHE, while average current consumption was near 0.02 mA cm−2. Methane production rate increased to 3.3 ± 1.3 L CH4 m−2 d−1 (on average), with a maximum value of 4.6 ± 2.2 L CH4 m−2 d−1 measured for BES 3 on day 438. The improvement was likely due to the balanced condition achieved by the stack, in terms of individual EMG-BES voltage drops. For this operational condition, measured methane production rates were higher than literature reported data (Figure 1). Nevertheless, only 30–50% of total methane production was EMG-driven (estimation based on 1/CEcat calculation), while the remaining part was likely generated by alternative metabolic pathways. CH4 represented 54–58% of the offgas mixture, while N2 was present at 37–40%. The amounts of CO2 and O2 in the offgas were always less than 2%. Organic removal efficiency was stable at 78 ± 1%.
3.5. Carbon Conversion and Energy Storage Efficiency of EMG-BES Technology
Data in the scientific literature regarding carbon conversion and/or energy storage efficiency of EMG-BES cells is not sufficient. Nevertheless, estimation and optimization of these two parameters are of the utmost importance for the technology to become attractive as CCU and/or power to gas/fuel solution. Currently available methanation technologies (chemical and biological methanation) show high CO2 to CH4 conversion efficiencies (90–95%), but low values of energy efficiency (<70%) [41]. EMG-BES technology is believed to close the gap in this sense, requiring mild operational conditions and no expensive catalysts. The resilience of electrotrophic microbes to fluctuations in renewable energy supply was recently demonstrated, pointing out another key advantage compared to traditional methanation methods [42]. The efficiency of the combined technology of membrane contactors and EMG-BES was evaluated and compared to current state-of-the-art technologies, using lab-scale results.
During the first experimental part, individual EMG-BES cells were fed with synthetic wastewater at an inorganic carbon loading rate of 0.5 kg-C m−3 d−1. This inorganic carbon was converted to CH4 with an efficiency of 0.5–6.2%, quite low due to the intentionally high inorganic carbon load adopted for the experiment, which aimed achieving non-limiting EMG conditions. Moreover, in case of acetate-based wastewater, the anodic oxidation produces exactly the same molar amount of CO2 that can be bioelectrochemically converted to CH4 at the cathode (Table 1). This represents a limitation of the single-chamber EMG-BES architecture and it does not allow achieving high carbon conversion efficiencies, as organic matter oxidation at the anode produces an excess of CO2. Nevertheless, it must be pointed out that CO2 injection to wastewater is useful for other reasons: (i) decrease of cathode overpotentials and voltage requirements; (ii) increase of EMG process kinetics, due to higher reactants concentration; and (iii) carbon capture in wastewater.
The specific energy consumption of EMG-BES cells stabilized around 1–2 kWh m–3 CH4, lower than the thermodynamic limit for the direct conversion of CO2 to CH4 (11 kWh Nm–3 CH4). This led to an apparent energy storage efficiency higher than 100%, but could be explained considering that methane was being generated by more metabolic pathways than the pure bioelectrochemical one, like acetoclastic and/or hydrogenotrophic methanogenesis.
During the second experimental part, BES 5 was fed with CO2 saturated municipal wastewater, without significant adverse effects on methane generation. The inorganic carbon loading rate was kept similar to the previous scenario (0.4 ± 0.1 kg-C m−3 d−1), but CO2 to CH4 conversion efficiency slightly decreased to 0.7–3.7%, possibly due to the activity of competing bacteria present in wastewater. On the other hand, specific energy consumption for methane generation increased to 16–18 kWh m−3 CH4, corresponding to an energy storage efficiency of 61–68%. Similar results have been reported by Fu et al. operating with single-chamber EMG-BES at a voltage of 0.7 V [22].
In conclusion, the results reported in this study are still low compared with currently available methanation methods, in terms of both CO2 conversion and energy storage efficiency. Further research is needed to improve the overall performance of the system, and demonstrate the feasibility of coupling membrane contactors and EMG-BES technologies (operating with real wastewater) towards a combined CCU and Power to gas/fuel approach. Some of the key technological challenges to tackle in future works are: novel electrode materials and architecture, reactors design, improved bacteria-electrode interaction, and scaling-up strategies.
4. Conclusions
A novel integrated technology for CCU and electricity storage was studied, based on membrane contactors for CO2 capture in wastewater coupled with EMG-BES cells for CO2 bioconversion to CH4 with simultaneous wastewater treatment. After the first experimental trials performed with synthetic wastewater and individual reactors operation, a complete EMG-BES stack was developed and operated. Real municipal wastewater was saturated at 1 g L–1 inorganic carbon and parallelly fed to four laboratory scale, single-chamber EMG-BES reactors, electrically connected in series at different voltages. CH4 production reached a maximum of 4.6 L CH4 m–2 d–1, in line with available literature data. Specific energy consumption stabilized at approximately 16–18 kWh m-3 CH4 corresponding to an energy storage efficiency around 65%. Organic matter was removed from municipal wastewater at nearly 80% efficiency. Between 0.3% and 3.7% of the injected CO2 was converted to CH4. The reactor performances with real wastewater were comparable to the operation with synthetic wastewater. This represents a step forward towards technology implementation to real-case scenarios. Although achieved performances are not yet competitive with other mature methanation technologies, key knowledge was gained on the integrated operation of membrane contactors and EMG-BES cells, setting the base for their future scaling-up.
Author Contributions
P.B.-J. and E.B. designed and built the EMG-BES cells. D.G. and E.L. designed and built the CO2 dissolution system. D.M., A.C.-E and R.R.-A performed the experimental work and elaborated the data. R.R. and A.C. wrote the paper (equal contribution) under the coordination of D.M. All the other coauthors helped with paper revision. M.D.P., P.B.-J., E.B. and J.G.-M managed funding acquisition and project direction.
Funding
This work has been financially supported by the Spanish Ministry of Economy and Competitiveness under the project Power2Biomethane (RTC-2016-5024-3, 2016).
Conflicts of Interest
The authors declare no conflict of interest. The funders had no role in the design of the study; in the collection, analyses, or interpretation of data; in the writing of the manuscript, or in the decision to publish the results.
Appendix A
Table A1.
Selection of four consecutive CO2 capture tests, performed with membrane contactors. Tests 1 and 4 are representative of clean membranes condition (cleaning routine performed after Test 3).
Table A1.
Selection of four consecutive CO2 capture tests, performed with membrane contactors. Tests 1 and 4 are representative of clean membranes condition (cleaning routine performed after Test 3).
| Test | pH0 | pHfin | EC0 (mS cm−1) | ECfin (mS cm−1) | TC0 (mg L−1) | TCfin (mg L−1) | Efficiency loss (%) |
|---|---|---|---|---|---|---|---|
| Test 1 | 13.5 | 10.4 | 16.0 | 7.9 | 200.5 | 960.5 | clean |
| Test 2 | 13.9 | 10.9 | 31.3 | 21.5 | 291.3 | 689.7 | 28 |
| Test 3 | 13.7 | 11.7 | 15.5 | 10.3 | 138.2 | 552.4 | 42 |
| Test 4 | 13.43 | 9.94 | 13.68 | 7.72 | 249.6 | 933.5 | clean |
Table A2.
Characterization of anaerobic sludge used for EMG-BES inoculation. Values are presented as average ± standard deviation.
Table A2.
Characterization of anaerobic sludge used for EMG-BES inoculation. Values are presented as average ± standard deviation.
| Parameter | Value |
|---|---|
| pH | 7.4 ± 0.2 |
| Conductivity (mS cm−1) | 7.7 ± 0.1 |
| COD (g O2 L−1) | 22.8 ± 1.9 |
| BOD5 (g O2 L−1) | 1.054 |
| NTOT (g L−1) | 0.739 ± 0.396 |
| TSS (g L−1) | 22.9 ± 0.3 |
| VSS (g L−1) | 14.1 ± 1.4 |
Table A3.
Composition of trace elements solution.
Table A3.
Composition of trace elements solution.
| Component | Concentration (mg L−1) |
|---|---|
| FeCl3 | 650 |
| ZnCl2 | 70 |
| H3BO3 | 6 |
| NiCl2 · 6H2O | 24 |
| Na2MO4 · 2H2O | 36 |
| CoCl2 · 6H2O | 238 |
| CaCl2 · 2H2O | 87 |
| CuSO4 · 5H2O | 2.9 |
| MnSO4 · H2O | 85.3 |
Table A4.
Characterization of wastewater used for EMG-BES operation, at three stages: (i) as collected at WWTP; (ii) after CO2 capture; and (iii) after EMG-BES treatment. Values presented as average ± standard deviation.
Table A4.
Characterization of wastewater used for EMG-BES operation, at three stages: (i) as collected at WWTP; (ii) after CO2 capture; and (iii) after EMG-BES treatment. Values presented as average ± standard deviation.
| Parameter | (i) at WWTP | (ii) after CO2 Capture* | (iii) after EMG-BES |
|---|---|---|---|
| pH | 7.5 ± 0.2 | 7.7 ± 0.2 | 8.3 ± 0.3 |
| Conductivity (mS cm−1) | 2.3 ± 0.1 | 11.5 ± 3.1 | 10.8 ± 2.2 |
| COD (mg O2 L−1) | 421.4 ± 34.1 | 1346.9 ± 97.6 | 218.6 ± 7.0 |
| BOD5 (mg O2 L−1) | 240.9 ± 20.7 | - | - |
| NTOT (mg L−1) | 60.6 ± 3.9 | - | - |
*Values measured after pH neutralization by acetic acid.
Table A5.
Selection of five cycles for BES 1, operated at constant 0.7 V voltage with synthetic medium.
Table A5.
Selection of five cycles for BES 1, operated at constant 0.7 V voltage with synthetic medium.
| Cycle | Electric Parameters | Liquid Phase Parameters | Gas Phase Parameters | Efficiency Parameters | |||||||||||||
|---|---|---|---|---|---|---|---|---|---|---|---|---|---|---|---|---|---|
| N - | Day* - | Current mA cm−2 | Ecat V vs SHE | pHOUT - | ECOUT mS cm−1 | OLR Kg COD m−3 d−1 | ηCOD % | O2 % | N2 % | CH4 % | CO2 % | CH4 rate L m−2 d−1 | Air cont. mL d−1 | Energy kWh m−3CH4 | CEan % | CEcat % | ηCONV % |
| 18 | 127 | 0.054 | −0.814 | 8.48 | 10.1 | 0.433 | 91 | 2.5 | 70.7 | 12.0 | 0.8 | 0.176 | 22.6 | 51.5 | 23.4 | 13.0 | 0.8 |
| 26 | 183 | 0.071 | −0.789 | - | - | 0.610 | - | 1.3 | 59.5 | 35.1 | 1.6 | 0.895 | 33.0 | 13.3 | - | 50.3 | 2.4 |
| 33 | 235 | 0.012 | - | 8.34 | 9.97 | 0.554 | 96 | 2.2 | 75.3 | 21.1 | 1.9 | 0.330 | 25.6 | 6.1 | 3.8 | 109.7 | 1.0 |
| 34 | 239 | 0.009 | - | 8.11 | 9.61 | 0.757 | 92 | 1.8 | 72.0 | 24.7 | 1.2 | 0.437 | 27.7 | 3.5 | 2.2 | 193.7 | 1.2 |
| 36 | 266 | 0.009 | −0.431 | 8.44 | 8.51 | 0.891 | 93 | 8.7 | 62.4 | 30.1 | 0.8 | 0.815 | 36.8 | 1.9 | 1.9 | 361.2 | 1.9 |
*Reported day is the final day of cycle N.
Table A6.
Selection of five cycles for BES 2, operated at constant 0.7 V voltage with synthetic medium.
Table A6.
Selection of five cycles for BES 2, operated at constant 0.7 V voltage with synthetic medium.
| Cycle | Electric Parameters | Liquid Phase Parameters | Gas Phase Parameters | Efficiency Parameters | |||||||||||||
|---|---|---|---|---|---|---|---|---|---|---|---|---|---|---|---|---|---|
| N - | Day* - | Current mA cm−2 | Ecat V vs SHE | pHOUT - | ECOUT mS cm−1 | OLR Kg COD m−3 d−1 | ηCOD % | O2 % | N2 % | CH4 % | CO2 % | CH4 rate L m−2 d−1 | Air cont. mL d−1 | Energy kWh m−3CH4 | CEan % | CEcat % | ηCONV % |
| 18 | 127 | 0.043 | −0.886 | 8.5 | 10.16 | 0.577 | 92 | 3.8 | 68.9 | 13.3 | 0.9 | 0.137 | 15.4 | 52.7 | 13.8 | 12.7 | 0.5 |
| 26 | 183 | 0.048 | −0.876 | - | - | 0.718 | - | 1.9 | 58 | 35 | 2.1 | 0.892 | 32.2 | 9.0 | - | 74.1 | 2.6 |
| 33 | 235 | 0.009 | - | 8.23 | 9.26 | 0.718 | 92 | 5.7 | 83.3 | 7.9 | 0.3 | 0.146 | 33.5 | 10.4 | 2.3 | 64.7 | 0.5 |
| 34 | 239 | 0.012 | - | 8.13 | 10.5 | 0.718 | 93 | 2.2 | 70.9 | 24.1 | 1.9 | 1.281 | 82.0 | 1.6 | 3.1 | 425.8 | 4.4 |
| 36 | 266 | 0.006 | −0.426 | 8.47 | 8.6 | 0.669 | 94 | 6.5 | 63.9 | 30.6 | 1.1 | 0.978 | 44.5 | 1.0 | 1.6 | 650.1 | 3.0 |
*Reported day is the final day of cycle N.
Table A7.
Selection of five cycles for BES 3, operated at constant 0.7 V voltage with synthetic medium.
Table A7.
Selection of five cycles for BES 3, operated at constant 0.7 V voltage with synthetic medium.
| Cycle | Electric Parameters | Liquid Phase Parameters | Gas Phase Parameters | Efficiency Parameters | |||||||||||||
|---|---|---|---|---|---|---|---|---|---|---|---|---|---|---|---|---|---|
| N - | Day* - | Current mA cm−2 | Ecat V vs SHE | pHOUT - | ECOUT mS cm−1 | OLR Kg COD m−3 d−1 | ηCOD % | O2 % | N2 % | CH4 % | CO2 % | CH4 rate L m−2 d−1 | Air cont. mL d−1 | Energy kWh m−3CH4 | CEan % | CEcat % | ηCONV % |
| 18 | 127 | 0.075 | −0.825 | 8.57 | 10.12 | 0.511 | 89 | 2.5 | 64.4 | 19.1 | 0.5 | 0.418 | 30.7 | 30.1 | 28.1 | 22.2 | 1.7 |
| 26 | 183 | 0.026 | −0.807 | - | - | 0.423 | - | 1.9 | 71.2 | 17.7 | 0.3 | 0.487 | 42.6 | 9.0 | - | 74.7 | 2.4 |
| 33 | 235 | 0.012 | - | 8.33 | 9.83 | 0.423 | 96 | 2.4 | 78.1 | 17.7 | 1.7 | 0.589 | 56.6 | 3.4 | 5.0 | 195.8 | 1.4 |
| 34 | 239 | 0.010 | - | 8.13 | 10.52 | 0.423 | 97 | 2.4 | 66.6 | 29.7 | 1.5 | 0.875 | 42.7 | 1.9 | 4.2 | 349.0 | 2.9 |
| 36 | 266 | 0.007 | −0.439 | 8.19 | 10.44 | 0.655 | 96 | 1.9 | 58.3 | 41.9 | 2.0 | 1.786 | 54.1 | 0.7 | 1.9 | 1018 | 5.6 |
*Reported day is the final day of cycle N.
Table A8.
Selection of five cycles for BES 4, operated at constant 0.7 V voltage with synthetic medium.
Table A8.
Selection of five cycles for BES 4, operated at constant 0.7 V voltage with synthetic medium.
| Cycle | Electric Parameters | Liquid Phase Parameters | Gas Phase Parameters | Efficiency Parameters | |||||||||||||
|---|---|---|---|---|---|---|---|---|---|---|---|---|---|---|---|---|---|
| N - | Day* - | Current mA cm−2 | Ecat V vs SHE | pHOUT - | ECOUT mS cm−1 | OLR Kg COD m−3 d−1 | ηCOD % | O2 % | N2 % | CH4 % | CO2 % | CH4 rate L m−2 d−1 | Air cont. mL d−1 | Energy kWh m−3CH4 | CEan % | CEcat % | ηCONV % |
| 18 | 127 | 0.062 | −0.806 | 8.54 | 9.91 | 0.511 | 93 | 2.1 | 59.2 | 27.1 | 0.7 | 0.358 | 17.0 | 29.1 | 22.3 | 23.0 | 1.5 |
| 26 | 183 | 0.017 | −0.426 | - | - | 0.728 | - | 3 | 56.2 | 32.5 | 4.2 | 0.868 | 32.7 | 3.3 | - | 203.6 | 2.5 |
| 33 | 235 | 0.013 | - | 8.36 | 8.87 | 0.728 | 97 | 3.2 | 77.5 | 18.5 | 0.8 | 0.158 | 14.4 | 13.8 | 3.1 | 48.5 | 0.5 |
| 34 | 239 | 0.011 | - | 8.04 | 10.4 | 0.728 | 92 | 2.0 | 63.4 | 33.4 | 1.9 | 1.673 | 69.1 | 1.1 | 2.8 | 606.6 | 6.2 |
| 36 | 266 | 0.009 | −0.452 | 8.46 | 8.93 | 0.813 | 93 | 2.9 | 59.7 | 38.7 | 1.6 | 1.348 | 45.3 | 1.1 | 2.0 | 597.4 | 3.4 |
*Reported day is the final day of cycle N.
Table A9.
Selection of 10 cycles for BES 5, operated at constant 0.7 V voltage with synthetic medium (first five cycles) and real municipal wastewater (last five cycles).
Table A9.
Selection of 10 cycles for BES 5, operated at constant 0.7 V voltage with synthetic medium (first five cycles) and real municipal wastewater (last five cycles).
| Cycle | Electric Parameters | Liquid Phase Parameters | Gas Phase Parameters | Efficiency Parameters | |||||||||||||
|---|---|---|---|---|---|---|---|---|---|---|---|---|---|---|---|---|---|
| N - | Day* - | Current mA cm−2 | Ecat V vs SHE | pHOUT - | ECOUT mS cm−1 | OLR Kg COD m–3 d−1 | ηCOD % | O2 % | N2 % | CH4 % | CO2 % | CH4 rate L m−2 d−1 | Air cont. mL d−1 | Energy kWh m−3CH4 | CEan % | CEcat % | ηCONV % |
| 18 | 127 | 0.049 | −0.776 | 8.48 | 10.10 | 0.564 | 93 | 3.9 | 67.4 | 7.9 | 0.8 | 0.087 | 16.2 | 94.6 | 15.9 | 7.1 | 0.3 |
| 26 | 183 | 0.020 | −0.386 | - | - | 0.393 | - | 2.3 | 59.0 | 31.3 | 2.0 | 0.580 | 23.8 | 5.8 | - | 115.7 | 3.1 |
| 34 | 239 | 0.015 | - | 8.11 | 9.61 | 0.777 | 93 | 3.0 | 69.2 | 29.9 | 1.2 | 1.155 | 58.2 | 2.2 | 3.5 | 307.1 | 3.4 |
| 36 | 266 | 0.009 | −0.418 | 8.44 | 8.51 | 0.813 | 97 | 1.8 | 60.4 | 38.2 | 2.0 | 0.778 | 26.8 | 1.9 | 1.9 | 344.8 | 2.0 |
| 39 | 288 | 0.005 | - | - | - | 0.905 | 98 | 0.0 | 39.6 | 45.7 | 1.8 | 1.455 | 27.4 | 0.6 | 1.0 | 1161 | 3.3 |
| 49 | 351 | 0.057 | - | 8.40 | 10.80 | 0.560 | 87 | 0.6 | 70.4 | 17.6 | 0.5 | 0.341 | 29.7 | 28.1 | 20.0 | 23.9 | 0.7 |
| 50 | 358 | 0.092 | - | 8.42 | 11.04 | 0.630 | 83 | 0.9 | 55.0 | 35.2 | 1.1 | 0.827 | 28.1 | 18.7 | 30.0 | 35.9 | 1.8 |
| 51 | 365 | 0.092 | - | 8.49 | 10.26 | 0.455 | 84 | 0.4 | 65.7 | 35.8 | 1.2 | 0.843 | 33.7 | 18.3 | 41.1 | 36.5 | 2.2 |
| 52 | 373 | 0.083 | - | 8.26 | 9.03 | 0.530 | 76 | 0.3 | 68.5 | 33.4 | 1.6 | 0.830 | 37.1 | 16.8 | 35.1 | 39.9 | 2.7 |
| 53 | 379 | 0.056 | - | 8.53 | 8.26 | 0.631 | 78 | 0.0 | 67.6 | 37.0 | 1.9 | 1.167 | 46.4 | 8.1 | 19.4 | 83.1 | 3.7 |
*Reported day is the final day of cycle N.
References
- International Energy Agency. Energy Technology Perspectives 2010; International Energy Agency: Paris, France, 2010. [Google Scholar]
- European Commission. European Energy Roadmap 2050; European Commission: Brussels, Belgium, 2011. [Google Scholar]
- World Energy Council World Energy Resources-E-Storage. Available online: https://www.worldenergy.org/wp-content/uploads/2017/03/WEResources_E-storage_2016.pdf. (accessed on 22 January 2019).
- Directorate-General for Research and Innovation (European Commission). Novel Carbon Capture and Utilisation Technologies; European Commission: Bruxells, Belgium, 2017. [Google Scholar]
- Bailera, M.; Lisbona, P.; Romeo, L.M.; Espatolero, S. Power to Gas projects review: Lab, pilot and demo plants for storing renewable energy and CO2. Renew. Sustain. Energy Rev. 2017, 69, 292–312. [Google Scholar] [CrossRef]
- Batlle-Vilanova, P.; Puig, S.; Gonzalez-Olmos, R.; Vilajeliu-Pons, A.; Balaguer, M.D.; Colprim, J. Deciphering the electron transfer mechanisms for biogas upgrading to biomethane within a mixed culture biocathode. RSC Adv. 2015, 5, 52243–52251. [Google Scholar] [CrossRef]
- Götz, M.; Koch, A.M.; Graf, F. State of the Art and Perspectives of CO2 Methanation Process Concepts for Power-to-Gas Applications. In Proceedings of the International Gas Union Research Conference, Copenhagen, Denmark, 17–19 September 2014. [Google Scholar]
- Cheng, S.; Xing, D.; Call, D.F.; Logan, B.E. Direct Biological Conversion of Electrical Current into Methane by Electromethanogenesis. Environ. Sci. Technol. 2009, 43, 3953–3958. [Google Scholar] [CrossRef]
- Blasco-Gómez, R.; Batlle-Vilanova, P.; Villano, M.; Balaguer, M.; Colprim, J.; Puig, S. On the Edge of Research and Technological Application: A Critical Review of Electromethanogenesis. Int. J. Mol. Sci. 2017, 18, 874. [Google Scholar] [CrossRef]
- Choi, K.-S.; Kondaveeti, S.; Min, B. Bioelectrochemical methane (CH4) production in anaerobic digestion at different supplemental voltages. Bioresour. Technol. 2017, 245, 826–832. [Google Scholar] [CrossRef] [PubMed]
- Bajracharya, S.; Sharma, M.; Mohanakrishna, G.; Dominguez Benneton, X.; Strik, D.P.B.T.B.; Sarma, P.M.; Pant, D. An overview on emerging bioelectrochemical systems (BESs): Technology for sustainable electricity, waste remediation, resource recovery, chemical production and beyond. Renew. Energy 2016, 98, 153–170. [Google Scholar] [CrossRef]
- Rabaey, K.; Rozendal, R.A. Microbial electrosynthesis—Revisiting the electrical route for microbial production. Nat. Rev. Microbiol. 2010, 8, 706–716. [Google Scholar] [CrossRef] [PubMed]
- Molenaar, S.D.; Mol, A.R.; Sleutels, T.H.J.A.; Ter Heijne, A.; Buisman, C.J.N. Microbial Rechargeable Battery: Energy Storage and Recovery through Acetate. Environ. Sci. Technol. Lett. 2016, 3, 144–149. [Google Scholar] [CrossRef]
- Van Eerten-Jansen, M.C.A.A.; Jansen, N.C.; Plugge, C.M.; de Wilde, V.; Buisman, C.J.N.; ter Heijne, A. Analysis of the mechanisms of bioelectrochemical methane production by mixed cultures. J. Chem. Technol. Biotechnol. 2015, 90, 963–970. [Google Scholar] [CrossRef]
- Villano, M.; Aulenta, F.; Ciucci, C.; Ferri, T.; Giuliano, A.; Majone, M. Bioelectrochemical reduction of CO2 to CH4 via direct and indirect extracellular electron transfer by a hydrogenophilic methanogenic culture. Bioresour. Technol. 2010, 101, 3085–3090. [Google Scholar] [CrossRef]
- Jiang, Y.; Su, M.; Zhang, Y.; Zhan, G.; Tao, Y.; Li, D. Bioelectrochemical systems for simultaneously production of methane and acetate from carbon dioxide at relatively high rate. Int. J. Hydrog. Energy 2013, 38, 3497–3502. [Google Scholar] [CrossRef]
- Zhen, G.; Zheng, S.; Lu, X.; Zhu, X.; Mei, J.; Kobayashi, T.; Xu, K.; Li, Y.-Y.; Zhao, Y. A comprehensive comparison of five different carbon-based cathode materials in CO2 electromethanogenesis: Long-term performance, cell-electrode contact behaviors and extracellular electron transfer pathways. Bioresour. Technol. 2018, 266, 382–388. [Google Scholar] [CrossRef] [PubMed]
- Baek, G.; Kim, J.; Lee, S.; Lee, C. Development of biocathode during repeated cycles of bioelectrochemical conversion of carbon dioxide to methane. Bioresour. Technol. 2017, 241, 1201–1207. [Google Scholar] [CrossRef]
- Dykstra, C.M.; Pavlostathis, S.G. Methanogenic Biocathode Microbial Community Development and the Role of Bacteria. Environ. Sci. Technol. 2017, 51, 5306–5316. [Google Scholar] [CrossRef] [PubMed]
- Siegert, M.; Yates, M.D.; Spormann, A.M.; Logan, B.E. Methanobacterium Dominates Biocathodic Archaeal Communities in Methanogenic Microbial Electrolysis Cells. ACS Sustain. Chem. Eng. 2015, 3, 1668–1676. [Google Scholar] [CrossRef]
- Yang, H.-Y.; Bao, B.-L.; Liu, J.; Qin, Y.; Wang, Y.-R.; Su, K.-Z.; Han, J.-C.; Mu, Y. Temperature dependence of bioelectrochemical CO2 conversion and methane production with a mixed-culture biocathode. Bioelectrochemistry 2018, 119, 180–188. [Google Scholar] [CrossRef] [PubMed]
- Fu, Q.; Kuramochi, Y.; Fukushima, N.; Maeda, H.; Sato, K.; Kobayashi, H. Bioelectrochemical Analyses of the Development of a Thermophilic Biocathode Catalyzing Electromethanogenesis. Environ. Sci. Technol. 2015, 49, 1225–1232. [Google Scholar] [CrossRef]
- Van Eerten-Jansen, M.C.A.A.; Veldhoen, A.B.; Plugge, C.M.; Stams, A.J.M.; Buisman, C.J.N.; Ter Heijne, A. Microbial Community Analysis of a Methane-Producing Biocathode in a Bioelectrochemical System. Archaea 2013, 2013, 1–12. [Google Scholar] [CrossRef]
- Van Eerten-Jansen, M.C.A.A.; Heijne, A. Ter; Buisman, C.J.N.; Hamelers, H.V.M. Microbial electrolysis cells for production of methane from CO2: Long-term performance and perspectives. Int. J. Energy Res. 2012, 36, 809–819. [Google Scholar] [CrossRef]
- Muñoz-Aguilar, R.; Molognoni, D.; Bosch-Jimenez, P.; Borràs, E.; Della Pirriera, M.; Luna, Á. Design, Operation, Modeling and Grid Integration of Power-to-Gas Bioelectrochemical Systems. Energies 2018, 11, 1947. [Google Scholar] [CrossRef]
- Wei, J.; Liang, P.; Huang, X. Recent progress in electrodes for microbial fuel cells. Bioresour. Technol. 2011, 102, 9335–9344. [Google Scholar] [CrossRef]
- Appels, L.; Baeyens, J.; Degrève, J.; Dewil, R. Principles and potential of the anaerobic digestion of waste-activated sludge. Prog. Energy Combust. Sci. 2008, 34, 755–781. [Google Scholar] [CrossRef]
- Cui, Z.; DeMontigny, D. A review of CO2 capture using hollow fiber membrane contactors. Carbon Manag. 2013, 4, 69–89. [Google Scholar] [CrossRef]
- Falk-Pedersen, O.; Grønvold, M.S.; Nøkleby, P.; Bjerve, F.; Svendsen, H.F. CO2 Capture with Membrane Contactors. Int. J. Green Energy 2005, 2, 157–165. [Google Scholar] [CrossRef]
- Luis, P.; Van Gerven, T.; Van der Bruggen, B. Recent developments in membrane-based technologies for CO2 capture. Prog. Energy Combust. Sci. 2012, 38, 419–448. [Google Scholar] [CrossRef]
- Zhang, H.-Y.; Wang, R.; Liang, D.T.; Tay, J.H. Modeling and experimental study of CO2 absorption in a hollow fiber membrane contactor. J. Memb. Sci. 2006, 279, 301–310. [Google Scholar] [CrossRef]
- Dindore, V.Y.; Versteeg, G.F. Gas-liquid mass transfer in a cross-flow hollow fiber module: Analytical model and experimental validation. Int. J. Heat Mass Transf. 2005, 48, 3352–3362. [Google Scholar] [CrossRef]
- Al-Marzouqi, M.H.; Marzouk, S.A.M.; El-Naas, M.H.; Abdullatif, N. CO2 Removal from CO2−CH4 Gas Mixture Using Different Solvents and Hollow Fiber Membranes. Ind. Eng. Chem. Res. 2009, 48, 3600–3605. [Google Scholar] [CrossRef]
- Mansourizadeh, A.; Ismail, A.F.; Abdullah, M.S.; Ng, B.C. Preparation of polyvinylidene fluoride hollow fiber membranes for CO2 absorption using phase-inversion promoter additives. J. Memb. Sci. 2010, 355, 200–207. [Google Scholar] [CrossRef]
- Chabanon, E.; Roizard, D.; Favre, E. Membrane contactors for postcombustion carbon dioxide capture: A comparative study of wetting resistance on long time scales. Ind. Eng. Chem. Res. 2011, 50, 8237–8244. [Google Scholar] [CrossRef]
- Sleutels, T.H.J.A.; Hoogland, B.J.; Kuntke, P.; Heijne, A.; Buisman, C.J.N.; Hamelers, H.V.M. Gas-permeable hydrophobic membranes enable transport of CO2 and NH3 to improve performance of bioelectrochemical systems. Environ. Sci. Water Res. Technol. 2016. [Google Scholar] [CrossRef]
- Han, S.-J.; Yoo, M.; Kim, D.-W.; Wee, J.-H. Carbon Dioxide Capture Using Calcium Hydroxide Aqueous Solution as the Absorbent. Energy Fuels 2011, 25, 3825–3834. [Google Scholar] [CrossRef]
- Aymà Maldonado, P.; Galí Mascarilla, D.; Pérez Mejías, L.; Sanchis Pérez, S.; Licon-Bernal, E.; Simón Font, X.; Garcia-Montaño, J. Contactores de membrana para la recuperación de nitrógeno en corrientes líquidas residuales: Efecto de la temperatura y limpieza. Tecnoaqua 2017, 28, 2–10. [Google Scholar]
- Molognoni, D.; Bosch-Jimenez, P.; d D Sirvent, J.; Miles, V.; Della Pirriera, M.; Aliaguilla, M.; Borràs, E. Evaluation of different inoculation strategies for electromethanogenesis reactors. In Proceedings of the 6th Meeting of the International Society for Microbial Electrochemistry and Technology (ISMET 6), Lisbon, Portugal, 3–6 October 2017. [Google Scholar]
- Geppert, F.; Liu, D.; van Eerten-Jansen, M.; Weidner, E.; Buisman, C.; ter Heijne, A. Bioelectrochemical Power-to-Gas: State of the Art and Future Perspectives. Trends Biotechnol. 2016, 34, 879–894. [Google Scholar] [CrossRef]
- Sterner, M. Bioenergy and Renewable Power Methane in Integrated 100% Renewable Energy Systems; Kassel University Press: Kassel, Germany, 2009; ISBN 978-3-89958-798-2. [Google Scholar]
- Del Pilar Anzola Rojas, M.; Mateos, R.; Sotres, A.; Zaiat, M.; Gonzalez, E.R.; Escapa, A.; De Wever, H.; Pant, D. Microbial electrosynthesis (MES) from CO2 is resilient to fluctuations in renewable energy supply. Energy Convers. Manag. 2018, 177, 272–279. [Google Scholar] [CrossRef]


© 2019 by the authors. Licensee MDPI, Basel, Switzerland. This article is an open access article distributed under the terms and conditions of the Creative Commons Attribution (CC BY) license (http://creativecommons.org/licenses/by/4.0/).