1. Introduction
With the development of economy and society, the demand for electricity is growing. At present, primary energy accounts for 40% of the global energy used for power generation, and renewable energy only accounts for 3.6% [
1]. The massive exploitation of fossil energy such as oil, coal and natural gas will not only affect the reserves of non-renewable energy [
2], but also cause an increase in carbon dioxide emissions, which will lead to an increase in sea level and disturbances in the global climate system [
3]. In response to environmental climate changes, countries have developed new energy development strategies. Although there are differences in geographical location, economic status, and energy structure, energy is getting greener and cleaner, and power generation methods are becoming more and more abundant [
4].
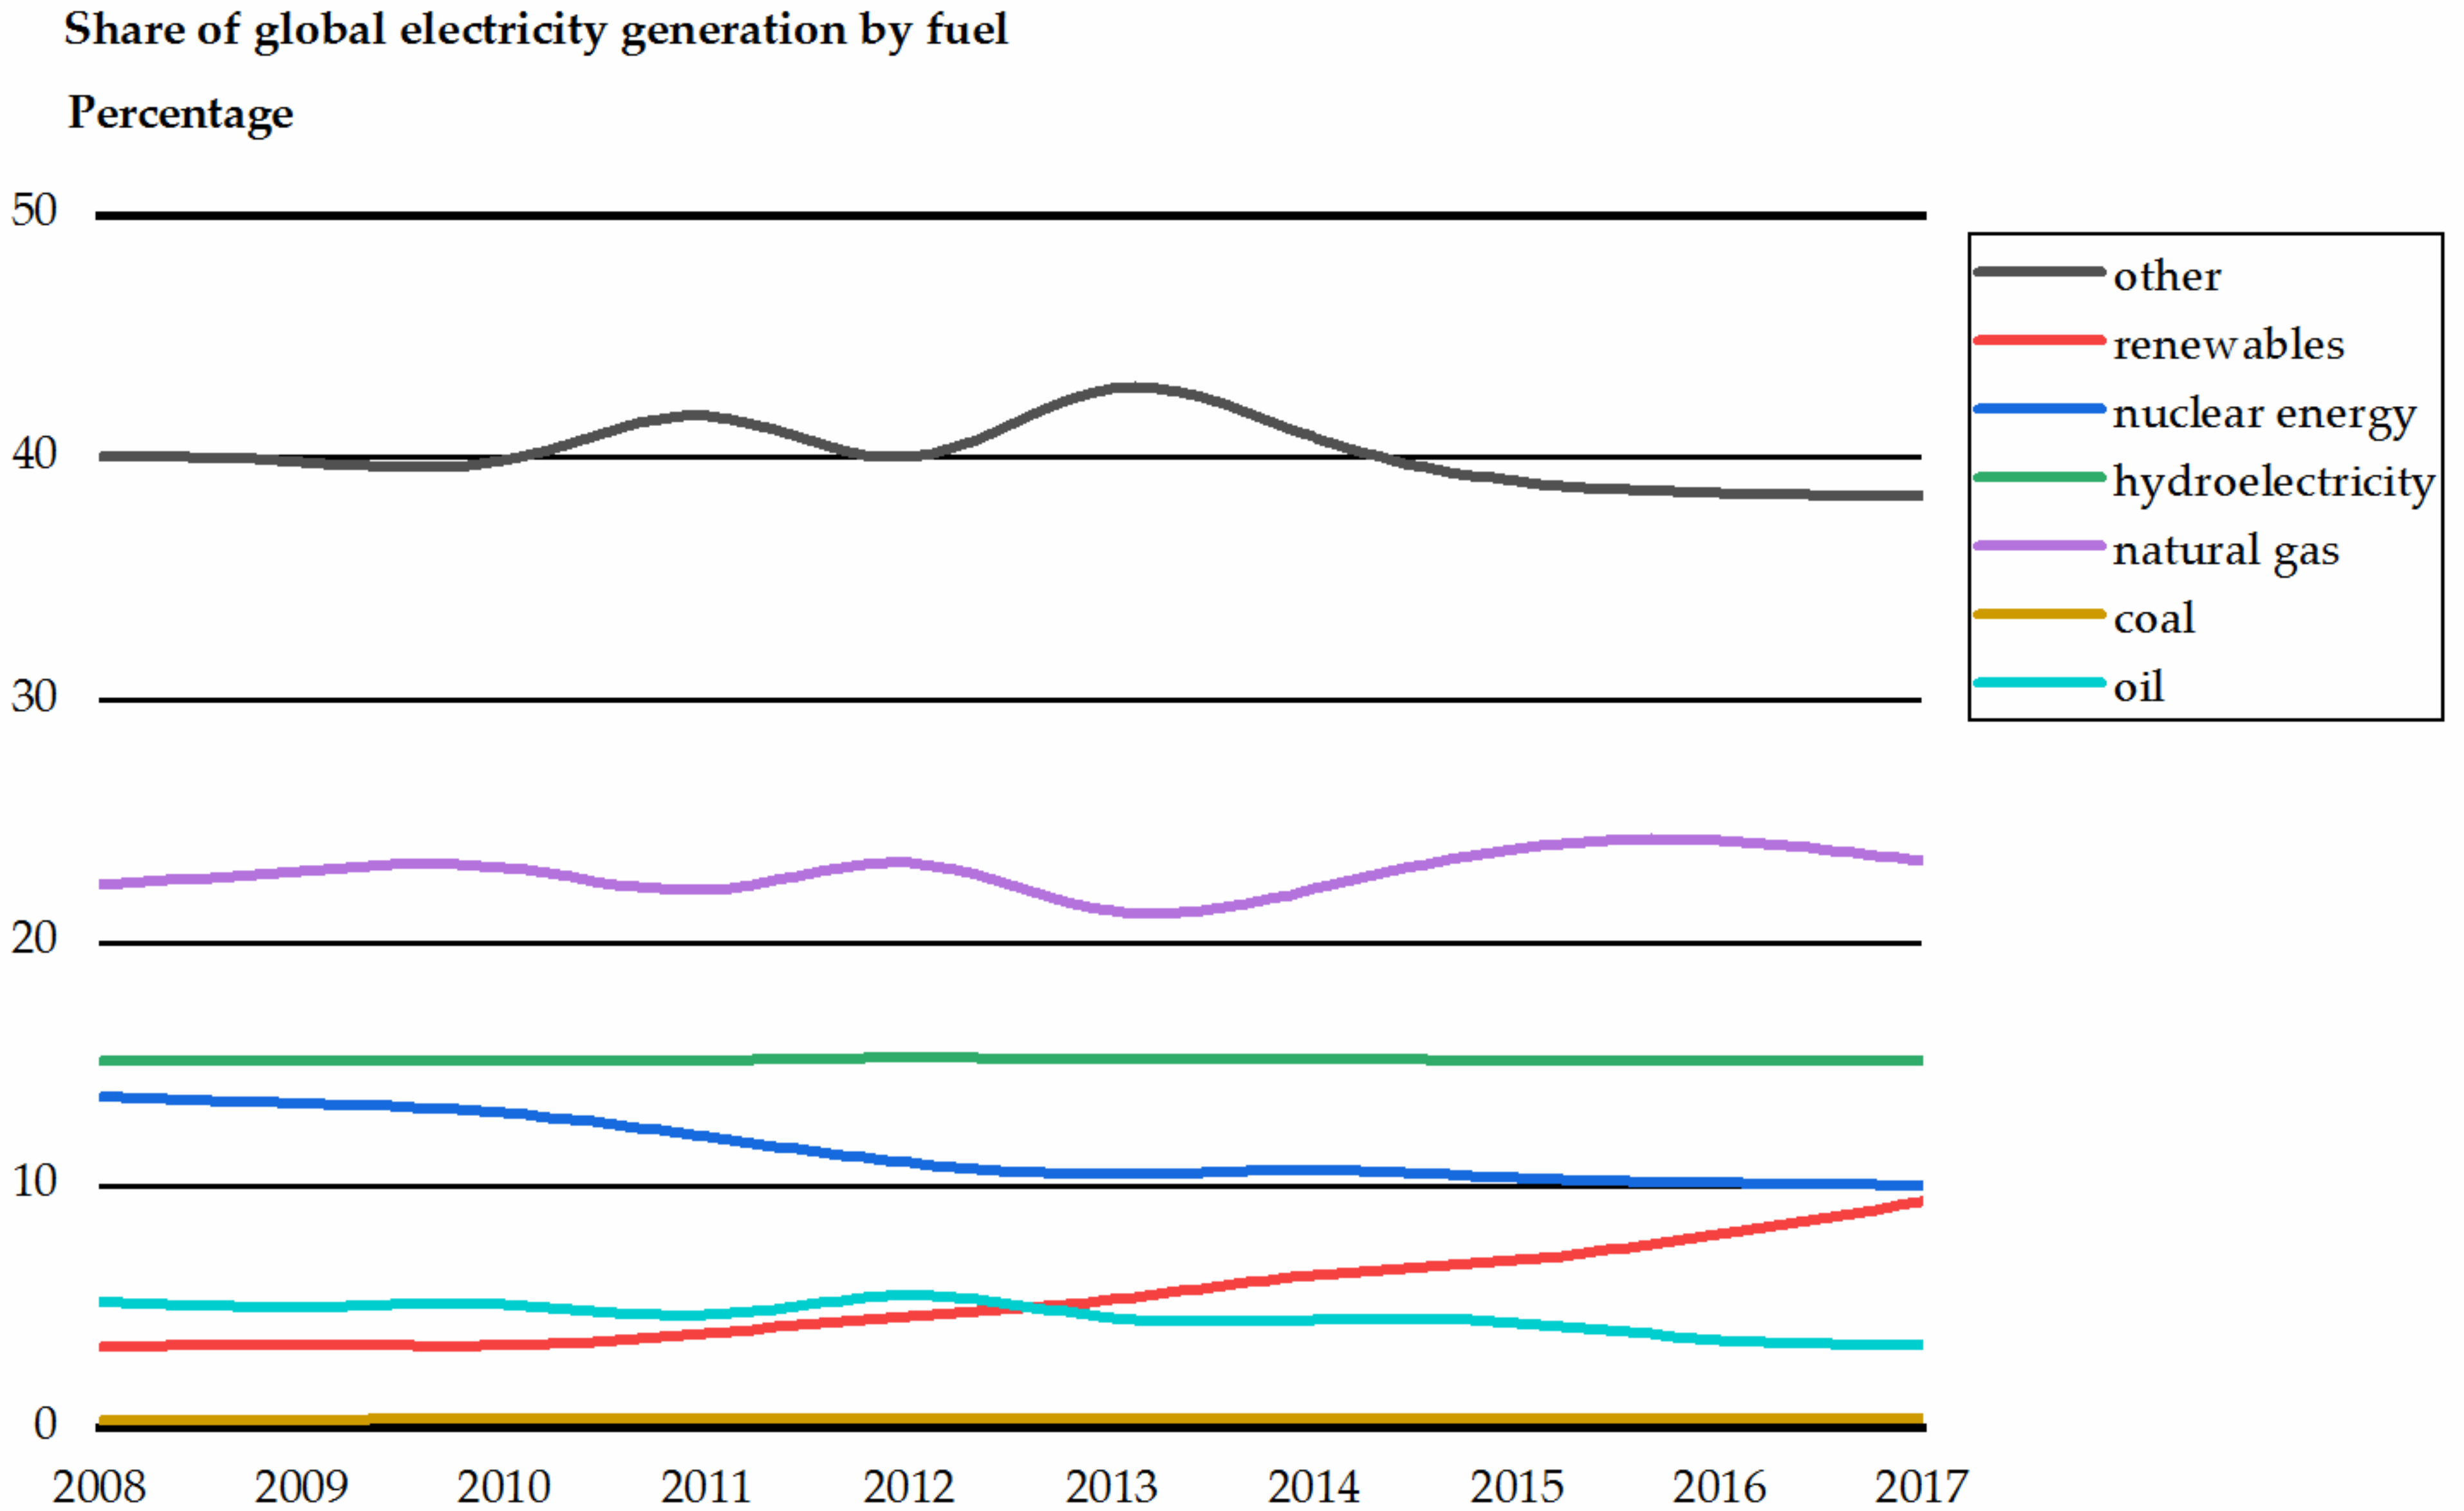
As can be seen from
Figure 1, big changes have taken place in the energy structure used for power generation, and the proportion of renewable energy power generation has been rising. As an important component of new energy, solar energy has become one of the most promising energy sources [
5,
6] due to its almost unlimited, clean and pollution-free nature [
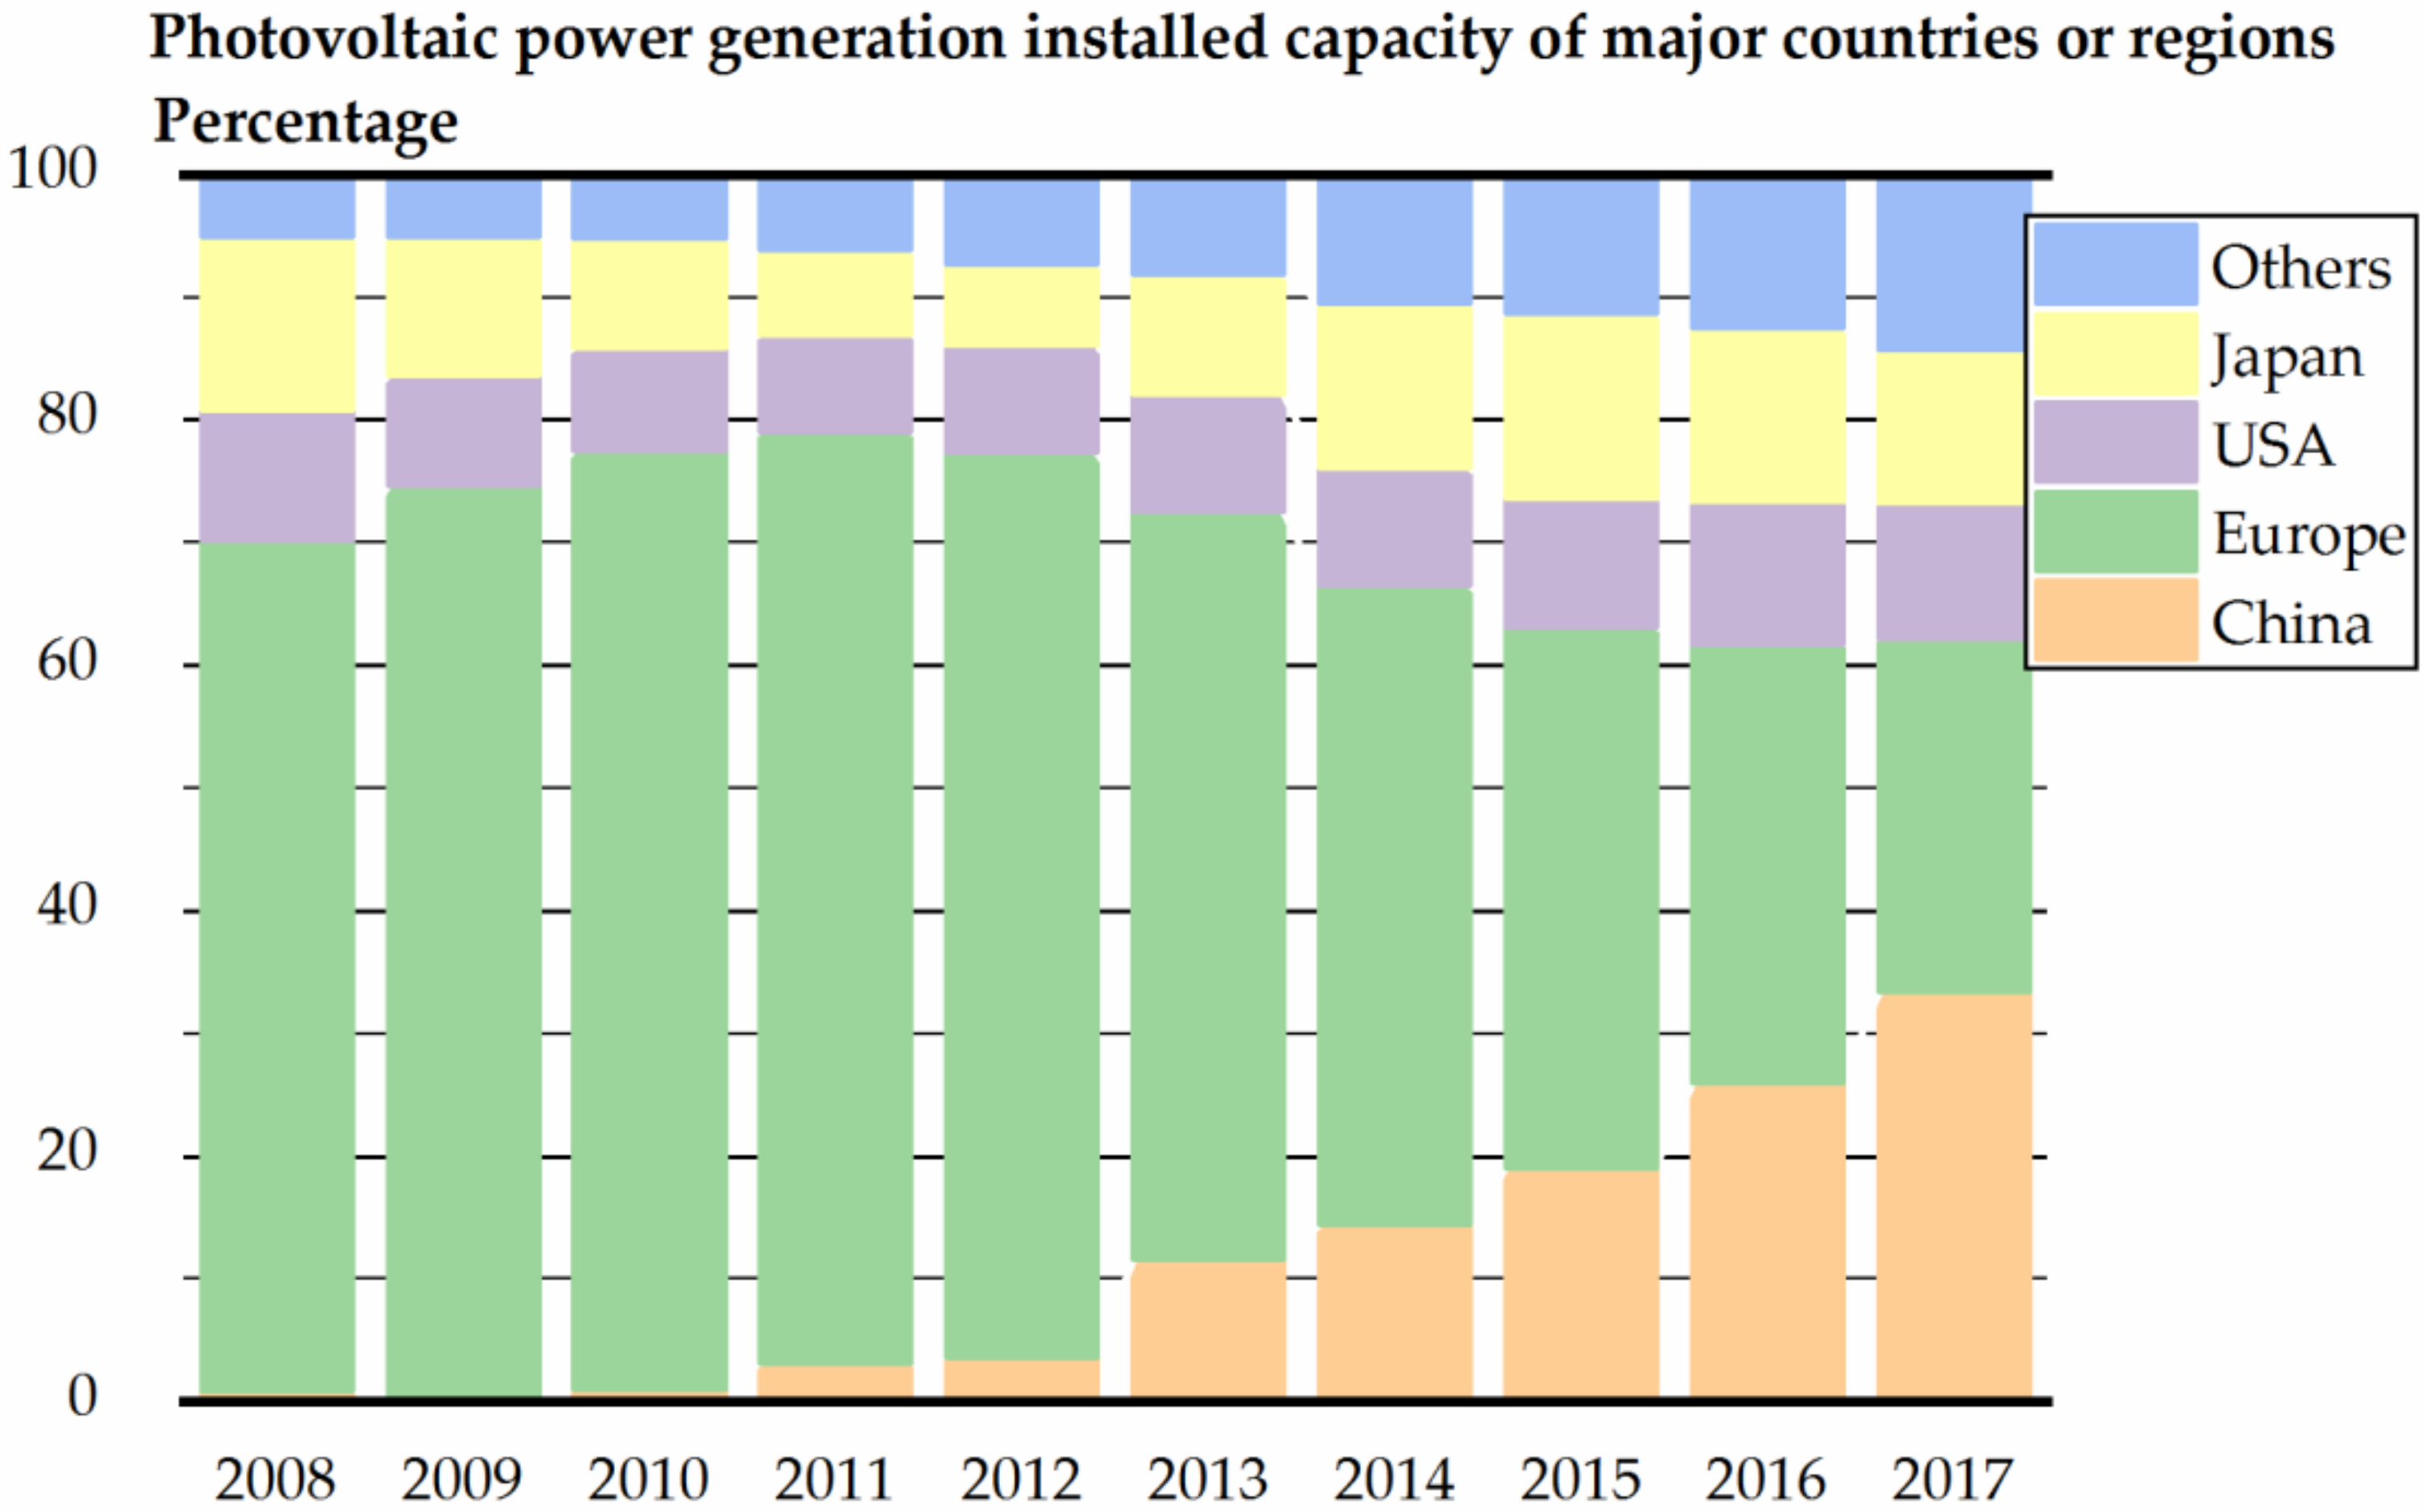
7]. The newly added photovoltaic power generation accounts for almost a quarter of the world’s power generation increases [
8], and the installed capacity of photovoltaic power generation in various countries or regions is shown in
Figure 2.
From
Figure 2, we can see that the development speed of the photovoltaic industry in the United States and Japan is basically consistent with that of the world, and the photovoltaic power generation industry in China has achieved good results. The ratio of the photovoltaic installed capacity of China to that of the world has grown rapidly, from 0.92% in 2008 to 33% in 2017. Since 2013, China has maintained a new installed capacity of more than 10 million kilowatts (10 GW) for five consecutive years. In 2017, China’s installed capacity of photovoltaic power generation ranked first in the world. It indicates that the investment of Chinese government in photovoltaic power generation have achieved an effective balance with photovoltaic system output. Therefore, it is representative to take China as an example to explore the key drivers of photovoltaic power generation efficiency in the macro environment.
The efficiency mentioned in the study differs from the definition in the power generation system. It mainly reflects the effectiveness of the input and output factors in the photovoltaic system, rather than defining the ratio between the output power and input power. The efficiency of the study cannot be assessed using a simple formula and needs to be analyzed and studied in combination with multiple methods.
In the research of improving photovoltaic power generation efficiency through a technological transformation, the ratio between output power and input is generally improved by adjusting unit performance, optimizing system settings, and replacing photovoltaic cells. Cha proposed that sudden and severe weather will increase the failure rate of the PV system and rapidly reduce the power output [
9]. Vaillon believed that reducing light, electricity, and heat losses could improve unit performance and increase the power production of photovoltaic installations [
10]. The study by Babatunde found that there are differences in the energy output efficiency of photovoltaic systems at different tilt angles and directions [
11], and these differences may even affect the investment income of solar projects [
12]. The use of a battery with high thermal stability, low impurity content and low processing sensitivity can ensure the efficiency of the power output of the device after a long period of operation [
13]. Zhao proved that the non-fullerene polymer solar cell (PSC) has superior thermal stability and its power conversion efficiency is significantly better than other solar cells [
14].
Driving factors research at the macro level mainly serves to promote the development of the photovoltaic industry. Tiba’s research indicated that local climate variables such as solar irradiance, wind speed, and ambient temperature determine the economic viability of a PV project [
15]. Purohit predicted that if a high-resolution time series database can be built to predict solar radiation data, it will have a considerable impact on the financing of solar projects [
16]. Strong solar radiation [
17], low energy technology costs [
18], and accurate forecasting capacity [
19] can effectively guarantee the financing of photovoltaic projects and the operation and maintenance after production. Garcia-Alvarez found that compared with the tariff scale and contract period, the on-grid tariff policy has a significant impact on photovoltaic power generation [
20], and policymakers should make special modifications to grid tariffs and electricity prices to help excellent PV systems enter the market [
21]. The research by Ding showed that residents in different regions have different expectations for photovoltaic power generation facilities. The government should adopt useful policies to promote photovoltaic projects according to local conditions [
22].
However, according to the research results in other fields, macro factors also have a significant role in improving efficiency. Ma et al. used the ultra-efficiency relaxation-based measurement (SBM) model and Tobit regression to study China’s eco-efficiency and found that expanding openness, increasing R&D expenditure, and increasing population urbanization rate have a positive impact on eco-efficiency [
23]. Wang used Seiford’s linear transformation method to estimate China’s water use efficiency, and then used the Tobit model to analyze the influencing factors and found that export dependence, technological progress, and educational value have positive effects on water use efficiency [
24]. It had provided a scientific basis for developing water resources development plans.
Therefore, if we study the relative effectiveness of input and output in photovoltaic power generation systems from a macro perspective, the key factors affecting the efficiency of photovoltaic power generation in government decision-making can be observed. Finding key factors can provide a direction for countries to formulate solar energy development strategies, and exploring the impact of key factors can guide the government to improve the effectiveness of photovoltaic power generation systems based on actual conditions. This study takes the development of China as an example, constructs the evaluation index of photovoltaic power generation efficiency, and analyzes the macroscopic influencing factors of photovoltaic power generation efficiency. The indicators and key factors mentioned in the study enrich the research results of photovoltaic power generation efficiency, and suggestions and ideas can be used as a reference for improving production efficiency.
3. Indicator Selection and Data Source
The photovoltaic power generation industry has been booming in China for only a short time, and some areas are still in the nascent start-up stage. Therefore, this paper only studies provinces with an installed capacity greater than 100 MW by the end of 2017. In addition, due to the discontinuity of data collection in the photovoltaic industry, this paper focuses on the study of 2015 and 2016. The 15 provinces involved in the study can be divided into five regions according to economic and geographical characteristics. North China (N) includes three provinces (Shanxi, Hebei, and Neimenggu); East China (E) includes five provinces (Jiangsu, Zhejiang, Anhui, Jiangxi, and Shandong); Central China (C) includes one province (Henan); Southwest China (SE) includes 1 province (Yunnan), and Northwest China (NW) includes five provinces (Shaanxi, Gansu, Qinghai, Ningxia, and Xinjiang). In general, photovoltaic power generation in the Northwest is the best. The relevant data of this study are from the China Statistical Yearbook, the China Energy Statistical Yearbook and the publication of the China Electricity Council.
3.1. Input and Output Variables of the DEA Model
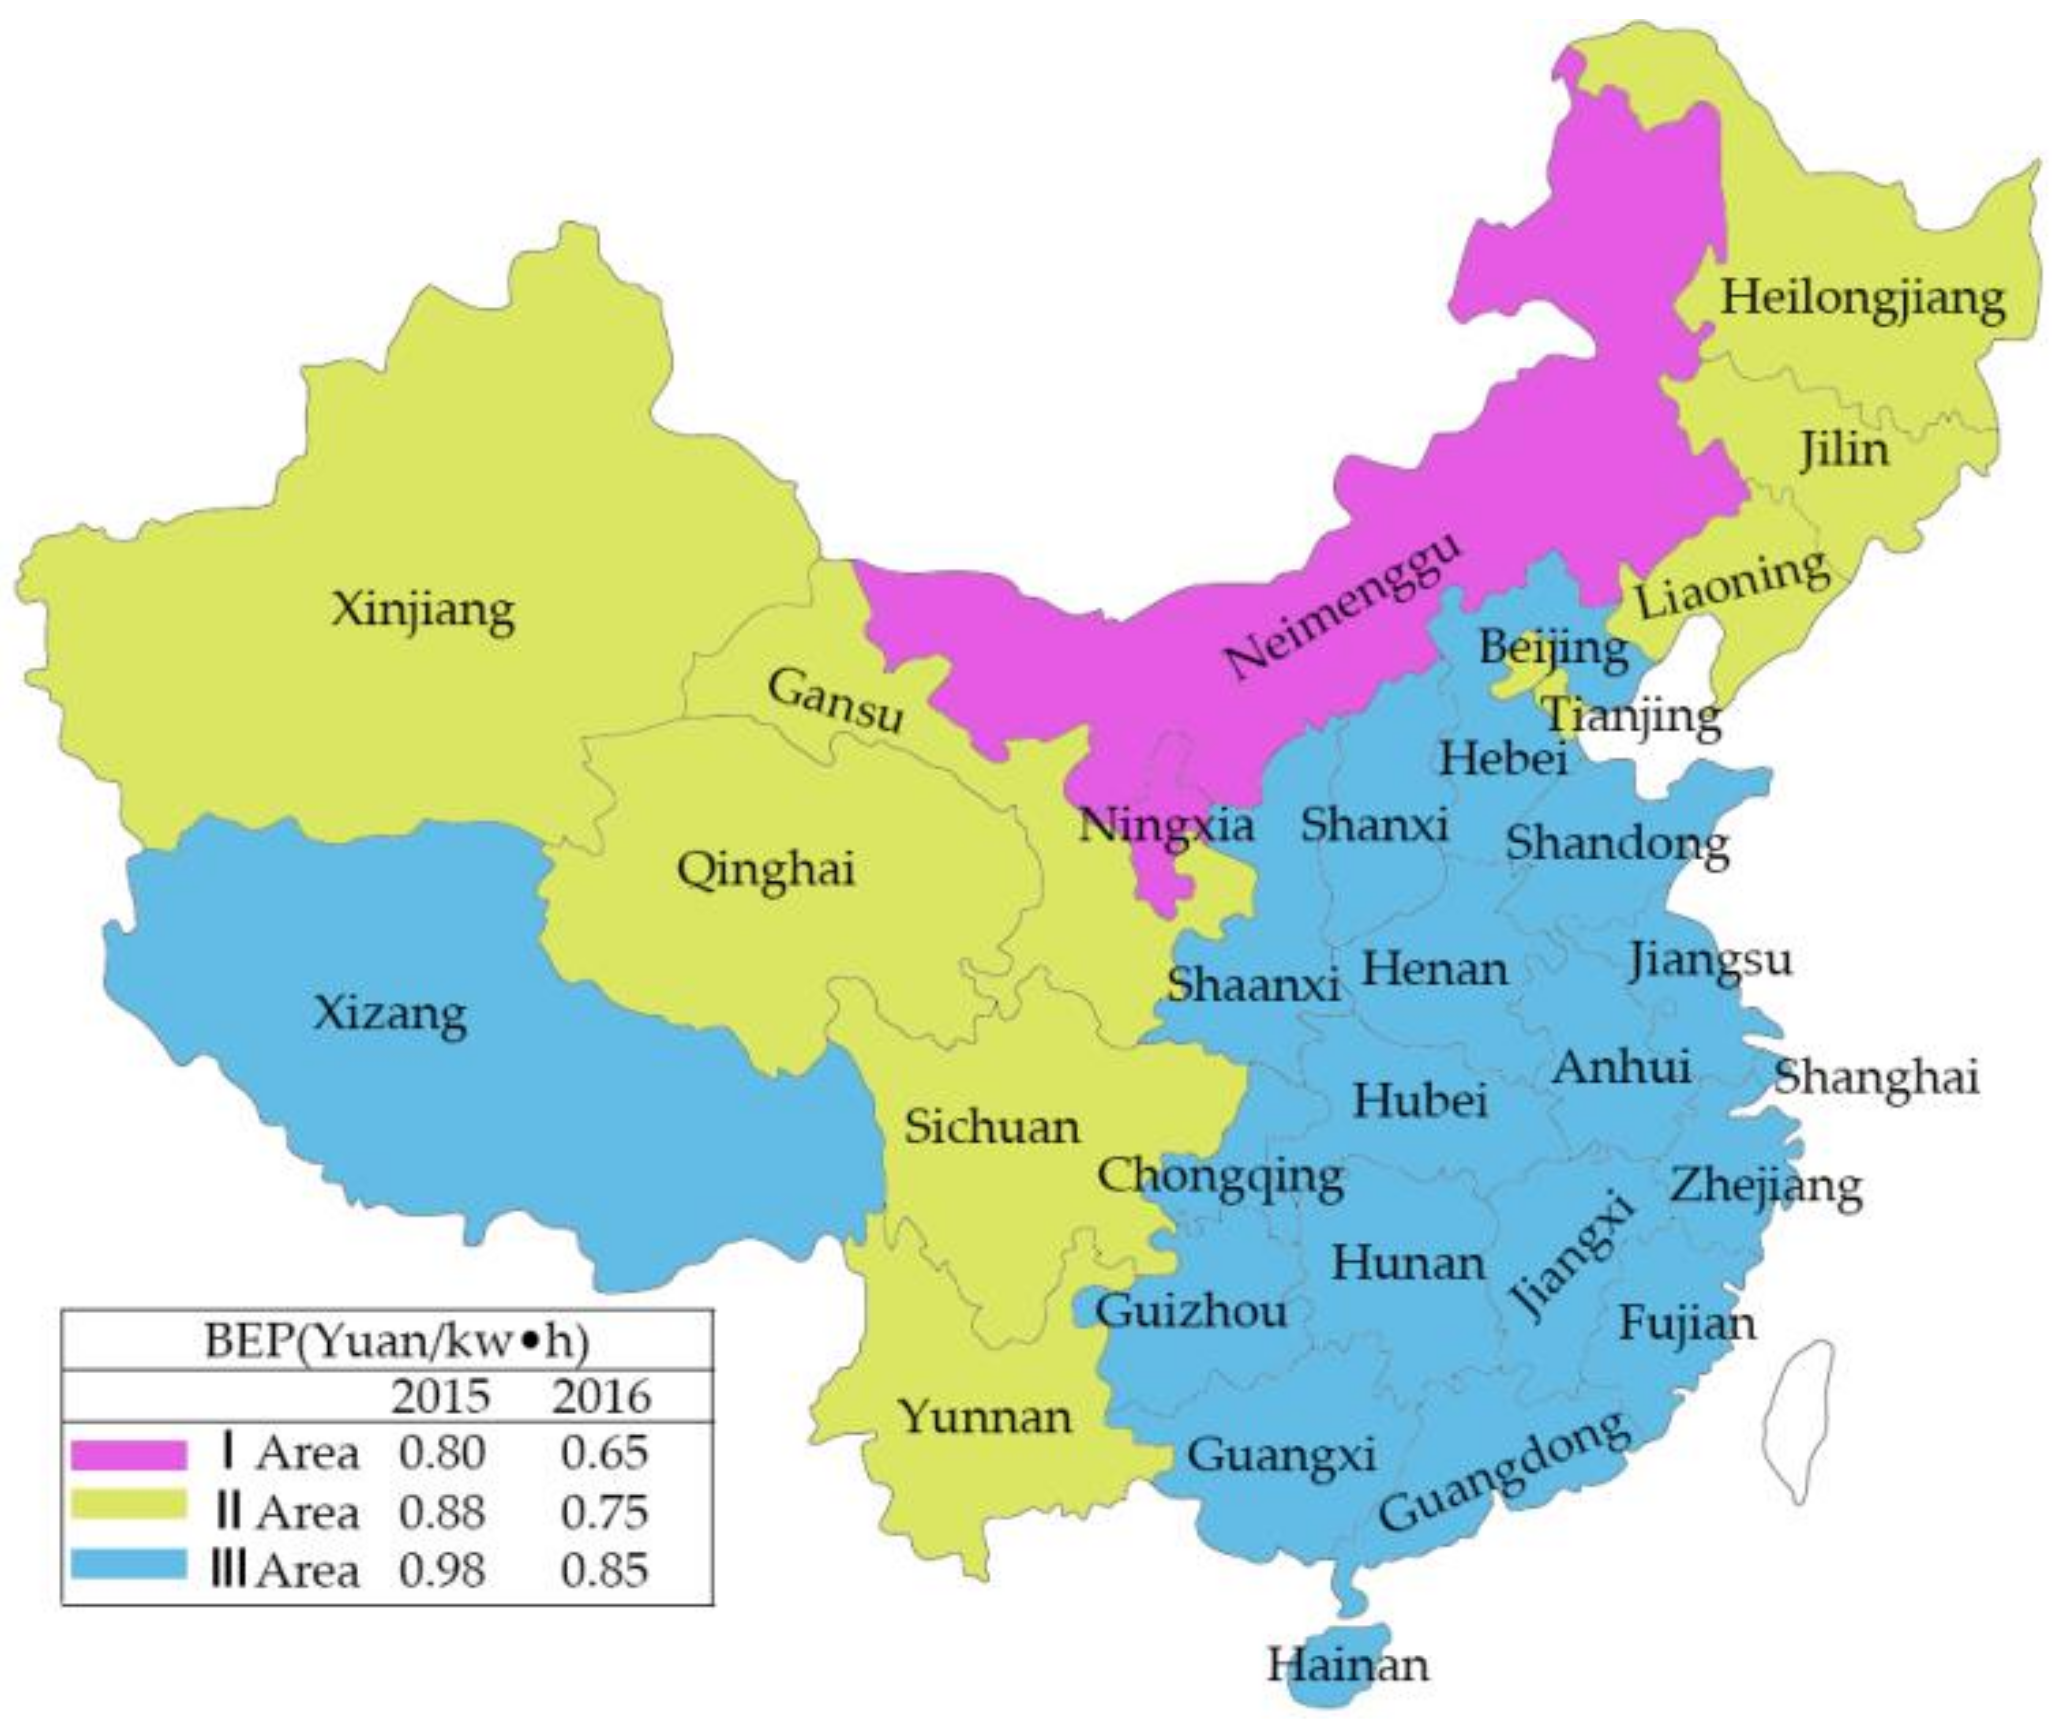
This study calculates a DEA matrix of 30 decision units, and each DMU contains input variables and output variables. Benchmark electricity price (BEP), installed capacity (IC), asset investment (AI) and annual utilization hours (AUH) are input variables, and the power generation (PG) is the output variable. The Chinese government divides the country into three types of resource zones based on the annual equivalent solar energy utilization hours. The electricity price of each resource area is shown in
Figure A1.
Different on-grid photovoltaic tariffs are implemented in different resource areas, and the government will adjust the electricity price standards year by year according to the development of photovoltaics. The installed capacity reflects the scale of China’s photovoltaic power generation industry and provides a basis for the calculation of other indicators. Asset investment refers to the capital invested by the state in the photovoltaic industry, which is determined by the total investment amount of the power industry and the proportion of the installed capacity of photovoltaics in each region to the total installed capacity. Annual utilization hours can describe the operating quality of the photovoltaic project unit. The amount of power generation is the sum of on-grid electricity and discarded photovoltaics. Discarded photovoltaic is caused by the consumption of the grid during the operation period and is part of the output of the photovoltaic project. Incorporating the discarded photovoltaics into the output analysis can reflect the power generation capacity of the photovoltaic project better.
Table 1 lists the descriptive statistics for input and output data.
3.2. Variables in the Regression Model
Many studies have found that national policies and demographic factors have a major impact on the photovoltaic industry, and a regression model is established to explore improvements in photovoltaic power generation efficiency. The regression model includes three dimensions: traditional energy situation, photovoltaic development status, regional economy, and urban development.
The proportion of thermal power generation is measured by the ratio of thermal power generation to total power generation. The radius of electrical energy reflects the power supply capacity of the photovoltaic project, measured by the amount of photovoltaic power generation, the total social electricity consumption and the geographical area of each region. The PV asset investment and PV benchmark price have been described in detail in the previous section. Other indicators are national macro development indicators, and the basic data can be directly obtained in the National Bureau of Statistics.
Table 2 describes the explanatory variables used in the regression model analysis.
4. Empirical Analysis Results and Discussion
4.1. The Estimation of Photovoltaic Power Generation Efficiency in China
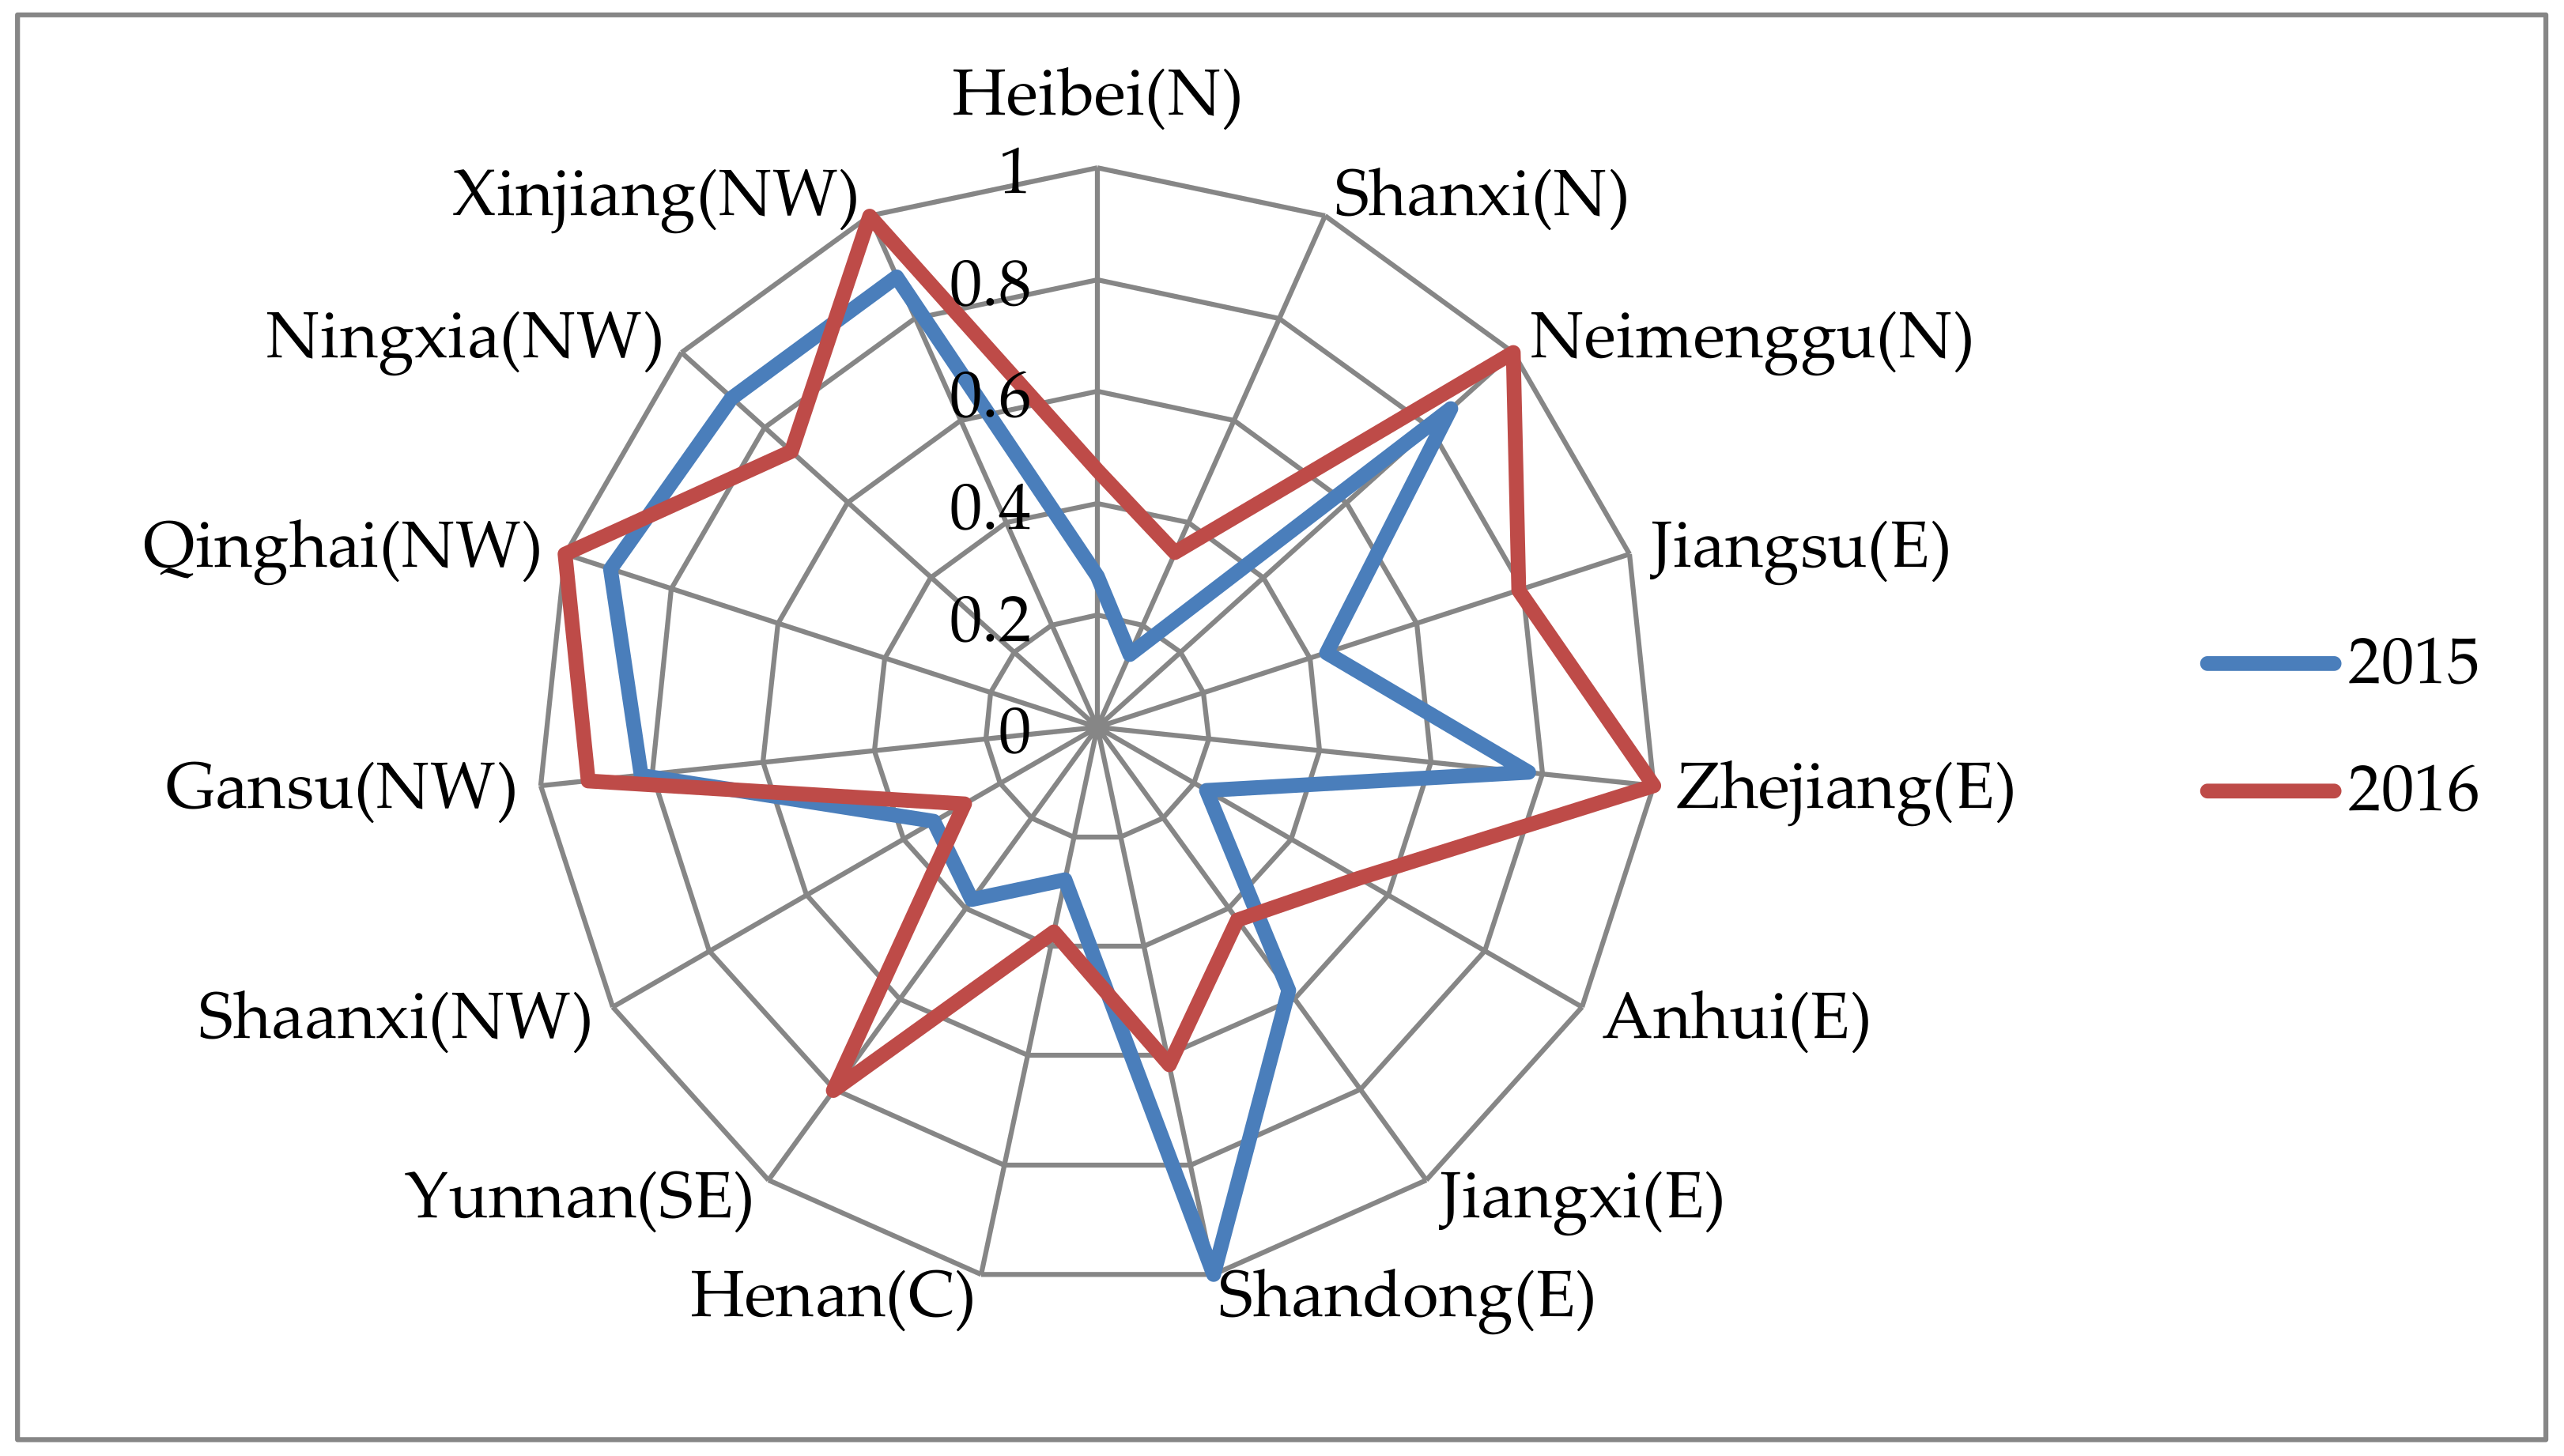
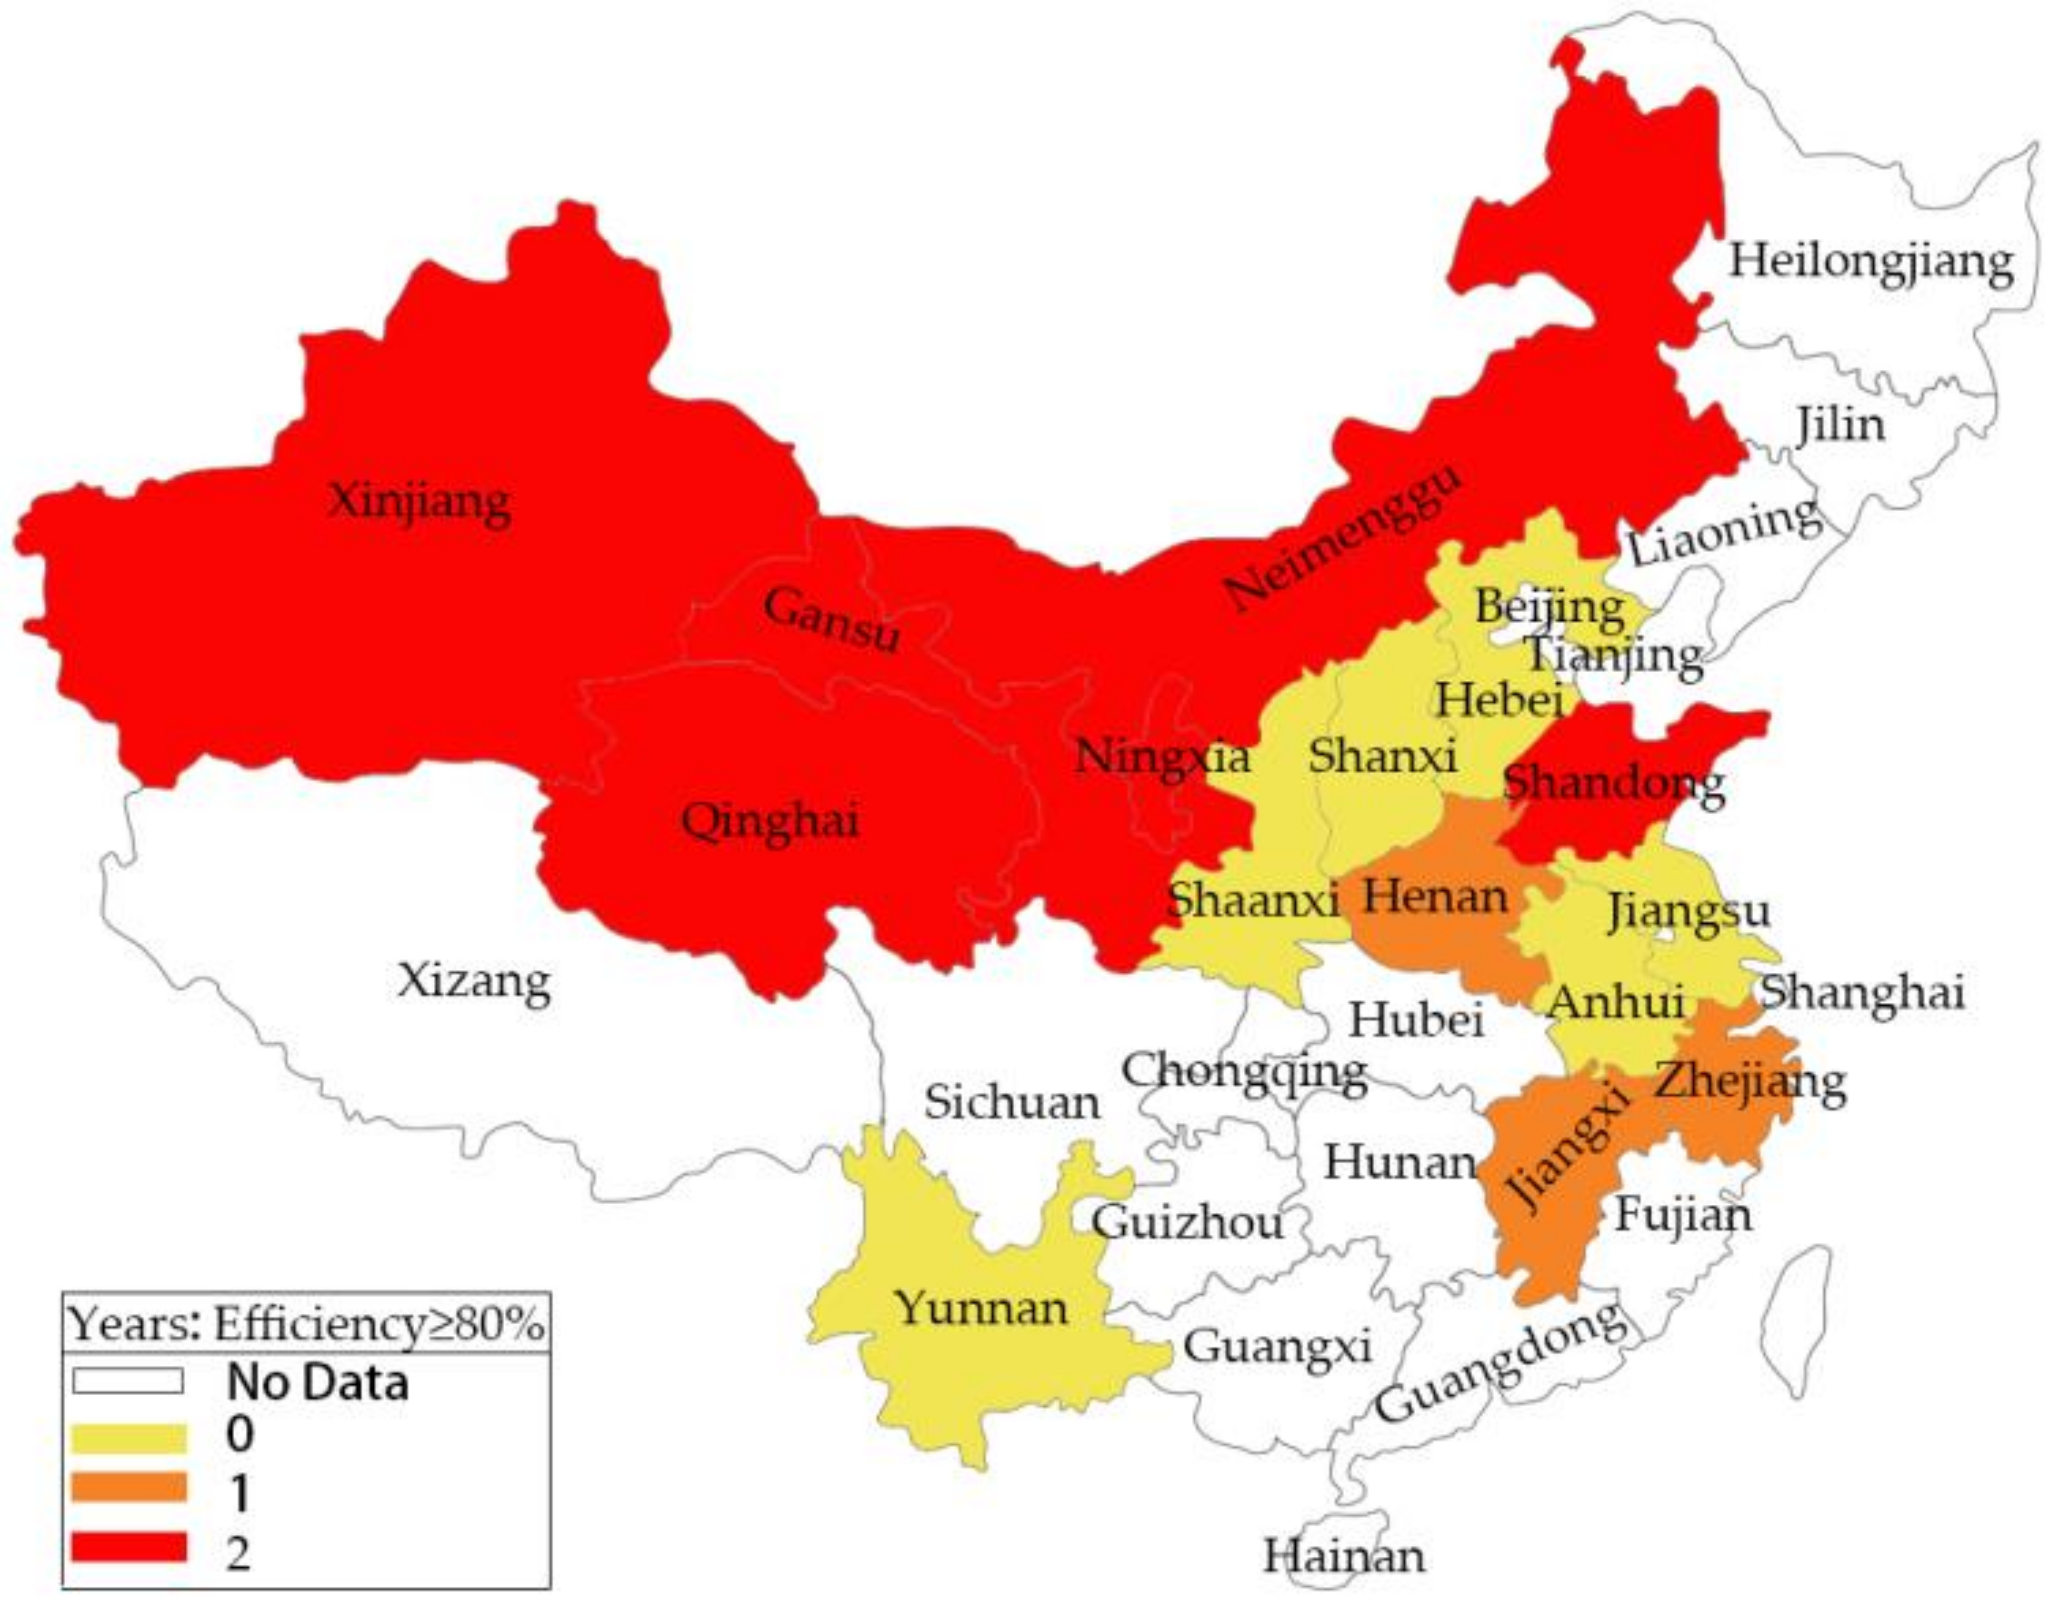
Since the scale return of photovoltaic power generation efficiency is variable, the maximum output should be actively sought to achieve higher efficiency on the basis of considering the ideal input. This study uses Max DEA software to evaluate the efficiency using five input indicators and one output indicator. The calculation results are shown in
Figure 4.
It can be seen from the figure that there are regional differences in photovoltaic power generation efficiency in China. Among the 15 provinces with the large scale of photovoltaic power generation, six provinces have photovoltaic power generation efficiency exceeding 80% for two years, and three provinces have more than 80% in only one year, and the efficiency of photovoltaic power generation in another six provinces needs to be improved. The five provinces with the highest average efficiency are Shandong, Qinghai, Xinjiang, Ningxia, and Zhejiang.
Qinghai, Xinjiang, and Ningxia are located in northwestern China. Although the northwest is a less developed area, the region has the geographical characteristics and resource advantages to adapt to the development of clean energy. Firstly, the northwest region has a high altitude, so the solar energy resources are abundant and it has good basic conditions for photovoltaic power generation. Secondly, the area has a small population density, a wide geographical area and abundant land resources, so the cost of building photovoltaic projects is not expensive and the development has fewer constraints. Furthermore, the northwestern region is located in the interior of China, with a dry climate, insufficient water resources, and coal resources. So the advantages of traditional energy power generation are not obvious and the development potential of various clean energy sources such as wind power and solar energy is vast. Finally, the level of modernization and industrialization in Northwest China is not as good as that in other regions. In order to balance the development of different regions, the Chinese government encourages the construction of large-scale projects, so the subsidies and policy support for photovoltaic projects are more vigorous.
Shandong and Zhejiang are located in East China. The eastern part is a relatively developed area and has a greater demand for electricity. In order to meet the requirements of the transition of energy structure to clean green, the photovoltaic power generation with less pollution is booming. In addition, in the more developed regions, there are usually more modern industries, advanced technologies, higher management levels, and better human resources, which will undoubtedly increase the utilization rate of solar energy resources.
It can be concluded from
Figure 5 that the installed capacity of photovoltaics in 15 provinces in China is relatively large, while the other 16 provinces are small in scale and are not worthy of efficiency analysis. From the perspective of regional distribution, the photovoltaic power generation efficiency values in the northwest and eastern regions are relatively high, and the values in the central, north, northeast, and southwest are lower. These results show that there is a significant imbalance in the spatial distribution of photovoltaic power generation efficiency in China, showing a low intermediate efficiency and a high efficiency at both ends.
The difference in photovoltaic power generation efficiency indicates that the central region where solar energy resources are not superior and the economy is relatively underdeveloped will face severe development pressure in the process of developing photovoltaic power generation. If photovoltaic policies of developing technologies and reducing power generation costs in other regions are used blindly, the competitiveness of photovoltaic power generation may be weakened, which will not be conducive to the improvement of photovoltaic power generation efficiency.
4.2. Analysis of Factors Affecting Photovoltaic Power Generation Efficiency
From the results of efficiency estimation, solar energy resources, urban development level, traditional energy application, and national development strategies will all affect photovoltaic power generation efficiency. This section considers the availability and applicability of the data based on the above factors. The selected indicators are shown in
Table 2. The Tobit regression equation is set according to the primary selection index as follows:
where
it represents the overall efficiency of photovoltaic power,
is the coefficient to be determined, and
is the error term. The results calculated using the STATA 12.0 software are shown in
Table 3.
Tobit regression results showed that only the radius of electrical energy (REE) and per capita GDP (PCGDP) passed the 1% significance test, and the consumer price index passed the 5% significance test. REE has a positive impact on photovoltaic power generation efficiency. The larger the production radius, the wider the transmission range of photovoltaic projects in the region. When the production radius exceeds the grid radius requirement, the voltage quality of the client is difficult to guarantee, and other photovoltaic power plant projects are needed to support the stability of the grid operator.
PCGDP and CPI are also indicators that have a positive effect on photovoltaic power generation efficiency. The increase in per capita income will lead to multiple investments in funding for photovoltaic research technology. In addition, the increase in income level also gives people a high-quality requirement for the living environment. Photovoltaic power generation can reduce carbon emissions and reduce pollution, and promote the environment to develop in a green and friendly direction.
The original index regression fitting effect is not ideal, the main reason may be that there is multiple collinearities of different driving factors. Principal component analysis showed that the KMO test value was greater than 0.7 and the Bartlett spheroid test had a P value of less than 0.05. These two indicators again verified the correlation between the variables, making principal component analysis possible. The gravel diagram shows that it is reasonable to extract 3–5 principal components. According to the results of the analysis of variance, the variance contribution of the three principal components is 83.169%, which contains most of the information from the original data. And according to the analysis matrix, common factor has a reasonable realistic interpretation. The expressions for the common factors
and
are as follows:
According to the above expression, the Tobit regression equation is re-established as follows:
where
represents the overall efficiency of photovoltaic power
,
and
are three common factors,
is the coefficient to be determined, and
is the error term.
As can be seen from
Table 4, the three common factors
and
extracted by principal component analysis all passed the 5% significance test.
Fossil energy drive has a negative impact on photovoltaic power generation efficiency. The proportion of thermal power generation (PTPG) and coal consumption (CC) can explain the richness of coal resources and the advantages of fossil energy power generation. Compared with photovoltaic power generation, the traditional power generation method is relatively mature, with low cost, low technical requirements, and higher power generation efficiency. Therefore, when fossil energy such as coal and natural gas is used more, technical support or scientific research and development has limited impact on the efficiency of photovoltaic power generation. The use of solar energy resources requires the implementation of relevant incentive policies.
Economic development drive has a positive impact on photovoltaic power generation efficiency. The increase in urbanization rate (UR) means an increase in urban population and an increase in urban load. While the secondary industry is the main force of power consumption, the faster the secondary industry increases, the faster the regional power load increases, and more power is needed to provide electricity. That created conditions for the improvement of photovoltaic power generation efficiency. PCGDP represents the level of development in a region, and the higher the level of modernization, the more capital and opportunities that can provide photovoltaic development. The increase in capital and opportunities mean that local governments will begin to pay attention to the development of photovoltaic power generation technology, which promotes the efficient development of photovoltaic power generation efficiency.
Encourage photovoltaic policy drive has a positive impact on photovoltaic power generation efficiency. REE is determined by the installed capacity and the geographical area of each region. The expansion of radius will not only improve the power supply reliability of the power supply and the power grid, but also facilitate the centralized management of photovoltaic power generation projects. Therefore, building photovoltaic projects based on actual power demand and solar radiation range can improve photovoltaic power generation efficiency. The more assets invested, the higher the technical level of photovoltaic power generation and the management level of enterprises. The improvement of the technical efficiency of semiconductor silicon materials for converting solar energy, distributed photovoltaic grid-connecting capability, and network cross-regional exchange capability can quickly help improve photovoltaic power generation efficiency. It should be noted that the benchmark electricity price (BEP) has a negative coefficient in the composition matrix of the common factor , and the reduction of the electricity price has a positive influence on the photovoltaic power generation efficiency value. The on-grid price is the real-time price of the electricity generated by the power generation enterprise in the grid. When the price is low, the grid company is more willing to buy the electricity produced by the photovoltaic project, which will help promote the efficiency of photovoltaic power generation.
5. Conclusions and Recommendations
5.1. Conclusions
Solar energy is a renewable green energy source. Its efficient use can alleviate fossil energy pressures and reduce greenhouse gas emissions. This study discusses the improvement of photovoltaic power generation efficiency from the perspective of economy and policy. There are regional differences in the development level of photovoltaic power generation in China. In general, nearly 50% of the provinces have large scale photovoltaic power generation, which is worth studying. The areas with high power generation efficiency are mainly concentrated in the northwest and east. Northwestern China has better basic conditions of solar energy resources and has resource advantages and policy advantages. The Eastern China economy is more developed, with capital advantages and technological advantages. However, for Central China where the resource advantage is not obvious and the economic base is not superior, the pressure for improving photovoltaic power generation efficiency is greater.
At this stage, the central region usually chooses traditional energy generation in terms of power generation mode, and the advantages of new energy power generation development are not obvious. However, with the increase in per capita GDP, the rapid development of the secondary industry, these macro-changes will promote the transformation of energy into a green and efficient direction, which will have a positive impact on the improvement of photovoltaic power generation efficiency. On the other hand, the increase in the radius of electrical energy, the addition of photovoltaic investment and the orderly reduction of benchmark electricity price will create favorable conditions for the efficiency of photovoltaic power generation.
5.2. Policy Recommendations
For China, the central region is a disadvantaged area for the development of photovoltaic power generation. In planning and constructing major photovoltaic power generation projects, the main distribution network adjustment and compensation mechanism should be established based on the solar energy resources and the power generation of other energy sources. Effectively improve the efficiency of photovoltaic power generation, and achieve the goal of stimulating the development of photovoltaic power generation according to local conditions:
(1) Establishing photovoltaic power generation demonstration projects
In the initial stage of solar power generation, the demonstration project should be promoted. Through the construction of the first batch of solar thermal power generation demonstration projects, technological progress and large-scale development will be promoted, localization of equipment will be promoted, and the integration capability of photovoltaic power generation industry will be gradually cultivated. Expand the market scale of photovoltaic power generation projects based on the experience of improving the efficiency of photovoltaic power generation in demonstration projects.
(2) Maintaining photovoltaic on-grid tariffs and subsidies in a regionally differentiated and declining state.
Regional differentiation can effectively ensure that enterprises achieve certain economic benefits while ensuring that enterprises participate in the energy market competition fairly, and thus actively promote the efficiency of photovoltaic power generation. The declining on-grid tariffs can effectively stimulate the photovoltaic industry to accelerate technology research and development, reduce power generation costs, and stimulate new technology applications that can improve photovoltaic power generation efficiency.
(3) Actively promote photovoltaic poverty alleviation projects
Make full use of the characteristics of the wide distribution of solar energy resources, and pay attention to the issue of photovoltaic power generation to solve poverty. Focus on the pre-existing poverty-stricken areas with good lighting conditions, and build distributed photovoltaic power generation systems or regional-scale large-scale photovoltaic power plants in the form of asset income poverty alleviation and village promotion. In this way, we can achieve precise poverty alleviation, increase people’s expectations for photovoltaic power generation projects, and promote the improvement of power generation efficiency.
In addition to focusing on the improvement of power generation efficiency, new development ideas such as comprehensive energy storage technology are also worthy of attention in the promotion of photovoltaic projects. China can combine the development and construction of solar energy projects with the integration and complimentary use of solar energy systems through various types of energy storage technologies. It not only improves the efficiency of photovoltaic power generation, but also ensures the stability of the energy system and the grid-friendly type.


