Abstract
In order for electrolysis cells to operate optimally, mass transport must be improved. The key initial component for optimal operation is the current collector, which is also essential for mass transport. Water as an educt of the reaction must be evenly distributed by the current collector to the membrane electrode assembly. As products of the reaction, hydrogen and oxygen must also be directed quickly and efficiently through the current collector into the channel and removed from the cell. The second key component is the stoichiometry, which includes the current density and water volume flow rate and represents the ratio between the water supplied and water consumed. This study presents the correlation of the stoichiometry, two-phase flow in the channel and gas fraction in the porous transport layer for the first time. The gas-water ratio in the channel and porous transport layer during cell operation with various stoichiometries was investigated by means of a model in the form of an ex situ cell without electrochemical processes. Bubble formation in the channel was observed using a transparent cell. The gas-water exchange in the porous transport layer was then investigated using neutron radiography.
1. Introduction
The efficient production of hydrogen is vital to making the transition to a renewable energy system based on hydropower, wind and photovoltaics. Water electrolysis is an attractive option for fully integrating such renewable means of power generation. Proton exchange membrane (PEM) water electrolyzers are considered especially promising due to their versatility in terms of current density and their high conversion efficiency. In the literature, several review papers [1,2,3] have given a good overview of the state of the art in PEM electrolysis. A PEM electrolyzer consists of a membrane electrode assembly (MEA), current collectors, bipolar plates with flow channels, distributors and end plates. The current collector is a porous medium between the MEA and bipolar plate, which is placed on both sides of the electrode. The two most important roles of a current collector are electrical conduction between the electrode and bipolar plate and the efficient transport of water and gas between the electrode and flow channels. At the anode of a PEM electrolyzer, liquid water is fed through the current collector to the MEA and dissociated into molecular oxygen. Any gas produced is directed through the current collector into the flow channel. Liquid water is the educt in the anode reaction, and simultaneously wets the membrane to maintain a high level of proton conductivity. If the oxygen produced cannot be removed quickly and efficiently, the channel is blocked, limiting mass transport. The efficient mass transport of liquid (water) and gas (oxygen) through the anode current collector is therefore decisive for the stable operation of a PEM electrolyzer. Many studies have contributed to a better understanding of mass transport in electrolysis cells. Investigations by Grigoriev et al. [4], for example, correlate electrical performance with the properties of the current collector, such as porosity, pore size, and hydrophobicity. The optimal pore size of current collectors was determined to be 12–13 µm. However, a definitive correlation between cell performance and pore size has not yet been clearly established. Hwang et al. [5] conducted electrolysis experiments with unitized reversible fuel cells that feature different Ti-felt current collectors. The authors concluded that if the mean pore diameter (MPD) of a porous current collector is smaller than approximately 60 µm, then the electrolysis performance is not noticeably influenced by either the polytetrafluoroethylene content or the porosity. For MPD > 100 µm, the cell performance decreased at high current densities (> 0.5 A/cm2). In a study by Ito et al. [6], the flow pattern of the two-phase flow in the flow channel was analyzed, and the relationship between the flow pattern and electrolysis performance was investigated.
In collaboration with Hackemüller et al. [7], we tested several titanium PTLs with different porosities and pore sizes. PTLs with porosity below 20% have mass transfer limitations. Depending on the material properties (hydrophilicity, contact angle) and the pore properties (capillary effects), some pores will contribute to gas transport and the others to water transport. One of the tasks of this work is to determine which porosity actually contributes to the measurement transport of water and gas.
At the cathode, hydrogen gas is produced that then diffuses through the current collectors to the flow channel. In contrast to the anode reaction, no liquid water is required for the cathode reaction, with water reaching the cathode side through osmosis. In this way, there is a two-phase flow on the cathode side as well. The activation overpotential of the cathode reaction is low [7], and so the effect of the properties of the cathode current collector on the cell performance is limited.
To optimize the mass transport in an electrolysis cell, the dependence between the flow regime and cell performance must be understood. A number of studies have made key contributions to characterizing the two-phase flow in the channel. For instance, Ito et al. [8] described the flow patterns in the two-phase flow, as well as the bubble size dependence on the pore diameter of the porous transport layer (PTL). They observed that larger bubbles form at large pores, which restricts water supply. Mishima [9] investigated the flow regime in vertical capillary tubes with a diameter of 1–4 mm. The Mishima-Ishii model has been verified and represents a map of the flow regimes that shows bubble formation as a function of water-gas ratios. The average rise in velocity of slug bubbles was correlated with the drift flux model. A two-phase frictional pressure loss was measured. Using an optically-accessible square microchannel, Cubaut et al. [10] tested various water-gas ratios and two-phase flows and investigated bubble formation. In spite of the different descriptions of flow regimes that can be found in the literature [8,9,11,12,13,14,15,16,17], the flow behavior in the two-phase flow in the channel can be categorized as follows: “dispersed bubbly flow”—spherical, individual bubbles in the channel; “plug flow”—the bubbles become larger than the channel cross section so that they assume an elongated shape; “slug flow”—the bubbles are much longer than they are wide; “churn flow”—longer bubbles are interspersed with smaller ones; “annular flow”—a flow in which the gas phase forms a monobubble that is rarely interrupted.
One parameter that characterizes the water-gas ratio in an electrochemical cell is the stoichiometry. This is defined as the mass ratio between water that has been split to water that has been added. When the stoichiometry is 1, the added water is completely split. Unfortunately, the literature provides little information on the stoichiometry used. Olesen et al. describe mass transport models investigated using a circular cell with interdigitated channels [18]. The authors specified a stoichiometry of λ = 350 without explaining why they selected this particular stoichiometry. Our previous study [19] describes cell operation at three stoichiometries (λ = 100, 350, 600). During the measurements, the gas-water distribution in the current collector, also called porous PTL, and in the channel was observed using neutron radiography. At higher stoichiometries, the gas is quickly and efficiently removed from the PTL and channel. At a stoichiometry of approximately 100, a short-term gas accumulation was observed in the PTL. The gas-blocked the pores in the PTL for several seconds (3–5 s), during which time newly-produced gas also accumulated and could no longer be transported into the channel. After several seconds, this blockage dissolved and the gas-water exchange functioned again. This earlier study was primarily concerned with electrochemical characterization and only three different stoichiometries were investigated (λ = 100, 350, 600). In order to supplement this investigation, the present study was conducted. Here, the focus was primarily on investigating smaller stoichiometries with the aim of more accurately defining the point at which mass transport limitations occur. These measurements were carried out with neutron radiography. The examined stoichiometry range was λ = 120–160. Another objective was to clarify the extent to which the two-phase flow regime in the channel influences mass transport in the PTL. These measurements were carried out with a transparent cell. The examined stoichiometry range was λ = 95–1035.
2. Materials and Methods
2.1. Cell and Sample
An ex situ cell was designed for the investigations reported here. The cell was not an actual electrolysis cell, but a model that served to simulate the two-phase flow in the channel of an electrolysis cell. It had two straight channels (15 × 2 × 2 mm3). These were separated by a titanium sintered body with a porosity of 48.99% (17 × 4 × 0.8 mm3). The sintered body was placed in a matching recess in the components between the two channels. The plates and edge of the sintered body were glued together using instant adhesive (Loctite 408). Each channel had an inlet and outlet for the media supply. A pressure measuring unit was also installed in front of the inlet to measure the pressure drop, as each medium flowed through the sintered body. Two cells were assembled according to the schematic shown in Figure 1: one transparent cell made of acrylic glass and one stainless steel cell. The transparent cell was used to investigate bubble formation and agglomeration in the channel. The stainless steel cell, meanwhile, was used for neutron radiography due to its lower absorption.
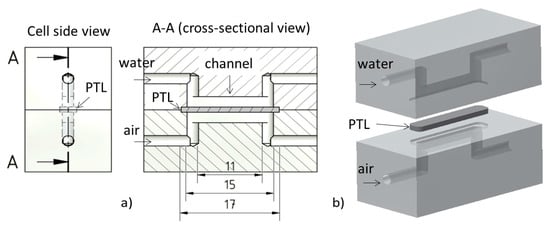
Figure 1.
(a) Elements of the cell design; (b) 3D model of the cell.
A PTL sample was investigated. This PTL was sintered from HDH titanium powder (i.e., produced using the hydride-dehydride process [20]) with a particle fraction below 45 µm. The pore size distribution and porosity were measured using mercury porosimetry. The average pore size was 5 ± 0.45 µm and the porosity was 48.99 ± 0.41%. Permeability was also measured for this sample. The permeability measured with air was 4.5 × 10⁻¹² m2 and the permeability measured with water was 8 × 10⁻¹² m2.
2.2. Acrylic Glass Cell Test
Bubble formation in the channel was recorded using a Panasonic DHC-SD66 camera at a video resolution of 1080i. An image processing program was then used to quantify the recorded videos and a total of 10 images were analyzed for each stoichiometric state. In turn, the edges of the bubbles were marked and their area calculated.
In the optically accessible cell, bubble formation was observed and the gas fraction in the channel calculated. As the PTL was not transparent and the pores of the PTL were no longer located in the optically accessible portion, neutron radiography was used.
2.3. Neutron Radiography Test
Using neutron radiography, the PTL was observed in situ and changes in the gas-water content in the pores were detected at a resolution of 100 µm.
The measurement was conducted at the CONRAD (COld Neutron RADiography) station in BER II at the Helmholz-Zentrum, Berlin [21,22]. A nuclear fission reaction produced neutrons that were decelerated by a moderator and then guided to different measuring stations. The wavelengths of the neutrons ranged from 0.1 nm to 1.1 nm, with a maximum of 0.25 nm. The temperature of the neutrons was approximately 152 K and their energy was 13 meV [23]. For optimal resolution, the sample was placed as close to the scintillator as possible, with an exposure time of 5 s. The field of view of the detector was 16 × 13.5 mm2 at a resolution of 2562 × 2160 pixels and a lateral resolution of 100 µm. The cell was mounted on a translational table with a rotational table top, which permits precise adjustment and positioning.
Image processing was based on the Lambert-Beer law, which states that the beam intensity is attenuated during transmission through the material. The attenuation depends on the material’s attenuation coefficient and thickness (Equation (1)). To calculate the material thickness, Equation (1) was solved for z (Equation (2)):
where I0 is the original beam intensity, It is the transmitted beam intensity, µ is the material-specific attenuation coefficient and z is the material thickness.
Every image contains two-dimensional information as a projection of the irradiated material on the detector. Water absorbs large amounts of radiation, so the channel or PTL filled with water appear dark. When the channel or PTL are empty, less radiation is absorbed. In this case, the transmitted radiation has more energy and the image is brighter.
An image of the cell in the dry state was used as a reference image. To determine the thickness of the water layer in the cell, each image was divided using a reference image, then logarithmized, inverted, and divided by the water absorption coefficient (Equation (2)). This resulted in the two-dimensional mapping of the water content of the cell. The Lambert Beer law is the standard means to edit the neutron and synchrotron images. Because we ultimately divide the images of the cell in the humidified state through the images of the cell in the dry state, the artifacts and deviations are shortened out.
2.4. Operating Programs and Tests
The cell was positioned so that the channel was horizontal, while the lower channel outlet was closed off. The medium added to the lower channel was forced to propagate through the sintered body. Meanwhile, the upper channel outlet had a horizontal extension where the water was collected in a container.
The medium was supplied by a syringe pump, which enabled the flow rate to be set with µL/min precision.
A schematic of the experimental procedure is shown in Figure 2. The images show the central part of the cell, i.e., the porous sintered body and the two parallel channels. At the beginning of the measurement, the cell was dry (see Figure 2a). After 10 min, water was fed into the lower channel at a flow rate of 20 µL/min. We observed how the water penetrated (“imbibition”) in the PTL (Figure 2b). At the same time, the pressure required to conduct water through the PTL was measured. The third step was to investigate the droplet formation on the PTL surface (Figure 2c). In step 4, the entire cell was wet (Figure 2d). For a certain time period, we observed how the water permeated the PTL, and whether the gas fraction in the PTL changed. In step 5 (Figure 2e), air was fed in through the lower channel (drainage). We then measured the pressure required for the gas to penetrate the water-filled porous medium. At the same time, how the gas penetrated in the PTL was observed, as was subsequent gas bubble formation on the PTL surface. In step 6 (Figure 2f), air was fed in from below, and water simultaneously from above, to simulate the cell in operation at various stoichiometries.
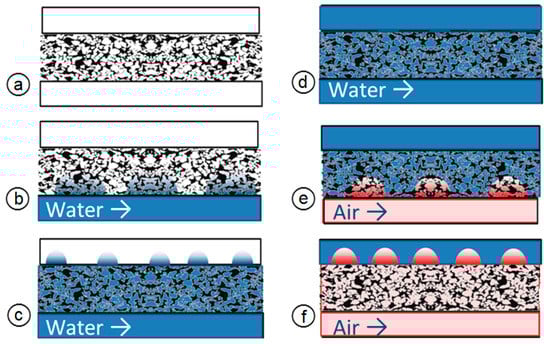
Figure 2.
Schematic experiment plan: (a)–dry cell; (b)–imbibition; (c)–bubble formation; (d)–water penetration through PTL; (e)–drainage; (f)–bubble formation.
The calculation of the water-gas ratios for the simulation of processes that take place in an electrolysis cell can be found in the section outlining the calculations.
2.5. Stoichiometry Calculations
In this experiment, no actual cell with an electrochemical reaction was used. Simple cells with few components can be more easily positioned relative to the detector, achieving better spatial resolution in neutron radiography. It was assumed that the gas fed into the lower channel was produced by an MEA. In both cases, in an electrolysis cell and a model, gas would flow through the PTL and exit into the channel. This model was used to investigate two-phase flow in the channel and PTL as a function of stoichiometry. It was assumed that the electrolysis cell used had an active surface area of 0.3 cm2. It was further assumed that the cell worked at a current density of 2 A/cm2, which is a typical operating point.
The stoichiometry is the ratio between the volume of the water that has been added (educt) and the volume of the water used in the reaction.
Stoichiometry is defined as follows:
According to Faraday’s law, stoichiometry can be calculated as follows:
It therefore follows:
λ: stoichiometry
: educt of the reaction (mL/min)
: water used (mL/min)
A: active surface area of cell (cm2)
M: molar mass (g/mol)
m: mass (g)
j: current density (A/cm2)
z: charge number
F: Faraday constant
n: amount of substance
Q: total electric charge
ρ: density (kg/L)
Once the stoichiometry has been determined for a specific volume flow, the volume of water converted per unit of time can be calculated. When the volume of converted water is known, the reaction equation can be used to calculate the volume of oxygen produced. At this point, only the amount of oxygen is interesting because we are investigating mass transport on the anode side. Let the converted water be X. It follows that the mass of converted water is:
with the following reaction equation:
with Vm = 22.4 L/mol (ideal gas), the volume of oxygen produced is:
n(H2O) = m(H2O)/M(H2O) = X/18 (mol)
1 H2O → ½ O2 + 1 H2
n(O2) = n(H2O)/2 = X/36 (mol)
Vm(O2) = 22.4 × X/36 = 0.622 × X
The volume of oxygen produced is independent of the stoichiometry and of the water volume flow; It depends only on the current density.
Table 1 shows the investigated stoichiometries and water-gas ratios.

Table 1.
Experimental parameters.
The gas volume flow is constant at 2.09 mL/ min.
The stoichiometry variation was investigated in the optical experiment. The ratio between water (in the upper channel) and air, which was fed into the lower channel and flows through the PTL into the upper channel, varied.
3. Results
The bubble formation and water-gas ratio in the channel were observed using a transparent cell. The image series in Figure 3 shows the characteristic bubble pattern in the channel for the respective stoichiometry. Using an image processing program, ten images were analyzed for each stoichiometry. The edges of the bubbles were marked and the bubble area calculated. The bubble volume was calculated from the cross-sectional area. Bubbles still adhering to the PTL were distinguished from freely moving bubbles and analyzed separately. The size of the bubbles still adhering to the PTL was independent of the stoichiometry and varied between 0.02 mm3 and 0.2 mm3. The bubbles always left the PTL at the same spot. As soon as a bubble exceeded a critical size, it detached from the surface. A new bubble then formed immediately at the same location. This effect is also described in the literature: larger pores result in larger bubbles [9]. Smaller bubbles agglomerate into larger bubbles in the channel. At the same time, bubbles in the channel are carried away with the water flow. The faster the water flow (higher stoichiometry), the faster the bubbles are moved in the channel and the less time they have to agglomerate. Figure 3a shows bubble size as a function of stoichiometry. At a stoichiometry of 1000, the bubbles have an average size of 1 mm3. At a stoichiometry of 300, the bubbles have an average size of 9 mm3. At a stoichiometry of 134, the bubbles have an average size of 34 mm3, i.e., half the entire channel volume. Bubbles at a stoichiometry of 94 could not be measured. In this case, there was only one single bubble, and since both ends of the bubble cannot be viewed in one image, the actual size of the bubble could not be measured. Figure 3b shows bubble volume as a function of stoichiometry. All measured bubbles are depicted in black, while the mean values are red, and the maximum bubble volume for each stoichiometry is shown in blue.
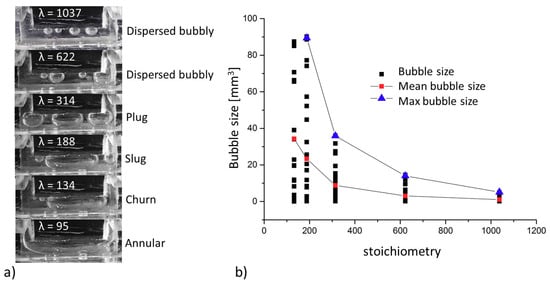
Figure 3.
(a) Bubble sizes in the channel characteristic of each stoichiometry; (b) bubble size and mean bubble size as a function of stoichiometry.
At smaller stoichiometries, some of the bubbles pushed against the water flow into the inlet area. This can be seen in the image depicting λ = 188: a single bubble is located in the left-hand inlet channel.
The studies of Cubaud et al. [10] and Mishima et al. [1] provide important insights into the flow regimes of certain water-gas ratios.
The measuring procedures for investigating the two-phase flow described in the literature involve either mixing certain ratios of water and gas before the reaching channel or simultaneously feeding water and gas into the channel. In our method, the gas was directed through the PTL from the lower channel to ensure that the experiment was designed to approximate a real electrolysis cell. Despite this important difference, the two-phase flows observed in the experiment were similar to the effects described in the literature. Figure 4 shows the literature values plotted together with our data. The data fit the entire flow regime distribution well and even expand it towards smaller volume flows.
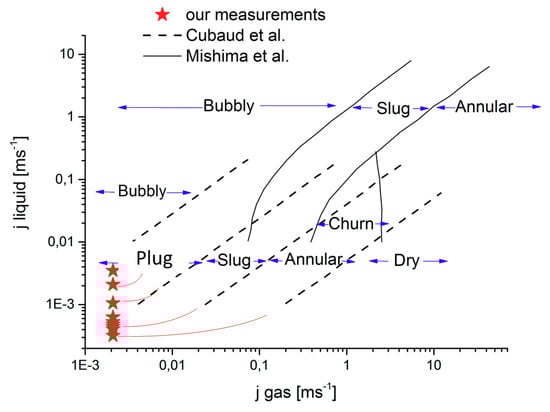
Figure 4.
Flow regimes in the two-phase flow according to Cubaud et al. (2004) [10] and Mishima et al. (1996) [1], and in comparison to our own results.
The experiment only shows one small cell or the inlet area of a large cell. In a real electrolysis cell, more oxygen will always exit the PTL into the channel. If the cell had a larger surface area, there would be large slugs close to the channel outlet. The ratios between the stoichiometry and bubble size only apply to the inlet area. Depending on the surface area of the cell and channel geometry, the channel length can reach several hundred millimeters. Depending on the current density, the flow at the outlet area is only annular.
Using neutron radiography, not only could the bubble formation in the channel be determined, but also the gas fraction in the PTL. For this purpose, the area of the image in which the PTL is located was marked and the average transmission intensity determined. The transmission served to determine the water volume according to Equation (1). Figure 5 shows the water content in the PTL over time as a percentage of the pore volume.
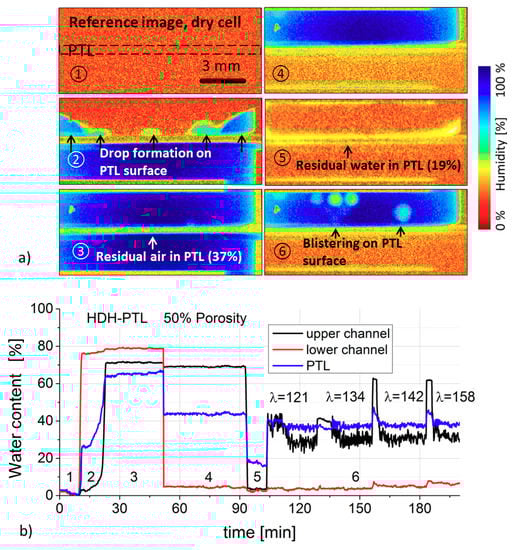
Figure 5.
(a) Water–gas fractions in the cell (neutron radiographs) corresponding to Figure 2; (b) Water fraction over time in the upper and lower channels and PTL.
Images 1–6 in Figure 5a show the water distribution in the cell at different operating conditions. Figure 5b shows the relevant water fraction over time in the PTL and in the upper and lower channels. During the first phase, the cell was dry and the water fraction at zero. The second phase shows the wetting of the cell. The blue curve in Figure 5b shows the water fraction in the PTL. As soon as water had filled the lower channel, the water fraction in the PTL abruptly increased to 26%. At this time, the water filled the pores that were easily accessible from the surface. The first transport pathways through the PTL were then created, and the first droplets formed on the surface. The water fraction in the upper channel also increased, while the pressure in the lower channel rose to 0.3 bar. The pressure of 0.3 bar, which established itself in the lower channel, was a characteristic value for the PTL used here. It was the pressure needed to push a volume flow of 40 µL/min through the PTL. Over the next 10 min, further transport pathways opened up and the water fraction in the PTL increased to 63%. Within 30 min, the water content in the PTL increased by another 3% as water flowed through it.
In phase 4, the lower channel was filled with air. The air was accumulated and compressed for as long as it took for the necessary pressure to be achieved to push it through the wet PTL. The titanium PTL was hydrophilic and a certain pressure was required to displace the water from the pores (drainage). The water fraction in the PTL remained unchanged at 44% of the pore volume. Pores close to the surfaces that contributed to the roughness were filled with air. At an air volume flow of 300 µL/min, the pressure reached 150 mbar in 40 min. After this, the first bubbles were visible in the upper channel.
Phase 5 began when the water in the upper channel was displaced by air. The PTL was then permeated by air. During this phase, the water content in the PTL decreased to 19%. During the next 10 min, the water in another 4% of the pore volume was displaced by air.
In phase 6, water was added to the upper channel and air to the lower channel at the same time. The volume flows and stoichiometries of 120–160 were simulated. The water-gas ratio in the PTL did not change. Here, water took up 37% of the PTL pore volume, irrespective of the stoichiometry. The figure also shows regular peaks, which occurred when the syringe pump was exchanged and contribute no additional information.
5. Conclusions
A transparent ex situ cell was designed, reproducing two-phase flow in an electrolysis cell. The two-phase flow regime was investigated for the first time as a function of stoichiometry and compared to findings reported in the literature. Specifically, stoichiometries of 95–1037 were investigated. Furthermore, neutron radiography was used to observe bubble formation in the channel and to determine the gas and water fractions in the PTL. The following conclusions can be drawn on the basis of this study:
- Bubbles always exit the PTL at the same location. Preferred pathways exist for gas transport through the PTL.
- Observations of two-phase flows in the literature were also made in this PTL. The Mishima model was expanded for smaller volume flows.
- Using neutron radiography, the water-gas fraction in the pores of the PTL were determined.
- During the imbibition and penetration of the porous medium with water, the breakthrough point occurred at a pore water fraction of 26%.
- While water flowed through the PTL (imbibition), 37% of the pore volume was occupied by air and did not contribute to the transport of water.
- When air flowed through the PTL (drainage), 15% of the pore volume was blocked with water and did not contribute to the transport of air.
- During the stoichiometry experiment, replicating a two-phase flow through the PTL, the water fraction in the pores was 37%.
The values determined here are material-specific and characterize a PTL made of HDH particles at a porosity of 48.99% and an average pore size of 5 µm (value determined using mercury porosimetry). It shows that the 37% of all pores contribute to water transport and the other 63% contribute to gas transportation. This is an important finding, since even for samples with higher porosity, the pore constitution and hydrophobe/hydrophile material properties could lead to limitations in the water/gas transport. The method presented here could be used in turn to compare materials for current collectors.
Author Contributions
Conceptualization, O.P. and W.L.; Methodology and carrying out measurement in HZB, O.P., L.G., E.B., W.Z.; Consulting, technical and scientific support in HZB, N.K., H.M., T.A.; Software, O.P.; Visualization, O.P.; Writing—original draft preparation, O.P.; Writing—review and editing, W.L.; Supervision, M.M. and W.L.; Project administration, I.M. and M.M.; Funding acquisition, D.S. and W.L.
Funding
This research was funded by NestPEL project provided from the German Federal Ministry for Economic Affairs and Energy (BMWi, funding reference number: 03ET6044A) is highly appreciated.
Acknowledgments
The authors would like to thank the HZB for the beam time and numerous scientific discussions. We would also like to thank Richard Wegner, Christian Bordin, Roger Keller, Norbert Commerscheidt, and Juri Romazanov (all at Forschungszentrum Jülich).
Conflicts of Interest
The authors declare no conflict of interest.
Abbreviation
| (PEM) | Proton exchange membrane |
| (MEA) | membrane electrode assembly |
| (MPD) | mean pore diameter |
| (PTL) | porous transport layer (PTL) |
| CONRAD | COld Neutron RADiography |
References
- Babic, U.; Suermann, M.; Büchi, F.N.; Gubler, L.; Schmidt, T.J. Critical Review—Identifying Critical Gaps for Polymer Electrolyte Water Electrolysis Development. J. Electrochem. Soc. 2017, 164, F387–F399. [Google Scholar] [CrossRef]
- Lee, C.H.; Banerjee, R.; Arbabi, F.; Hinebaugh, J.; Bazylak, A. Porous Transport Layer Related Mass Transport Losses in Polymer Electrolyte Membrane Electrolysis—A Review. In Proceedings of the Asme 14th International Conference on Nanochannels, Microchannels, and Minichannels, Washington, DC, USA, 10–14 July 2016. [Google Scholar]
- Zhao, C.; Xu, T.; Valliappan, S. Numerical modelling of mass transport problems in porous media: A review. Comput. Struct. 1994, 53, 849–860. [Google Scholar] [CrossRef]
- Grigoriev, S.A.; Millet, P.; Volobuev, S.A.; Fateev, V.N. Optimization of porous current collectors for PEM water electrolysers. Int. J. Hydrog. Energy 2009, 34, 4968–4973. [Google Scholar] [CrossRef]
- Hwang, C.M.; Ishida, M.; Ito, H.; Maeda, T.; Nakano, A.; Hasegawa, Y.; Yokoi, N.; Kato, A.; Yoshida, T. Influence of properties of gas diffusion layers on the performance of polymer electrolyte-based unitized reversible fuel cells. Int. J. Hydrog. Energy 2011, 36, 1740–1753. [Google Scholar] [CrossRef]
- Ito, H.; Maeda, T.; Nakano, A.; Hasegawa, Y.; Yokoi, N.; Hwang, C.M.; Ishida, M.; Kato, A.; Yoshida, T. Effect of flow regime of circulating water on a proton exchange membrane electrolyzer. Int. J. Hydrog. Energy 2010, 35, 9550–9560. [Google Scholar] [CrossRef]
- García-Valverde, R.; Espinosa, N.; Urbina, A. Optimized method for photovoltaic-water electrolyser direct coupling. Int. J. Hydrog. Energy 2011, 36, 10574–10586. [Google Scholar] [CrossRef]
- Ito, H.; Maeda, T.; Nakano, A.; Hwang, C.M.; Ishida, M.; Kato, A.; Yoshida, T. Experimental study on porous current collectors of PEM electrolyzers. Int. J. Hydrog. Energy 2012, 37, 7418–7428. [Google Scholar] [CrossRef]
- Mishima, K. Hibiki, T. Some characteristics of air-water two-phase flow in small diameter vertical tubes. Int. J. Multiph. Flow 1996, 22, 703–712. [Google Scholar] [CrossRef]
- Cubaud, T.; Ho, C.-M. Transport of bubbles in square microchannels. Phys. Fluids 2004, 16, 4575–4585. [Google Scholar] [CrossRef]
- Zhao, T.; Bi, Q. Co-current air–water two-phase flow patterns in vertical triangular microchannels. Int. J. Multiph. Flow 2001, 27, 765–782. [Google Scholar] [CrossRef]
- Xu, J.; Cheng, P.; Zhao, T. Gas–liquid two-phase flow regimes in rectangular channels with mini/micro gaps. Int. J. Multiph. Flow 1999, 25, 411–432. [Google Scholar] [CrossRef]
- Ide, H.; Kariyasaki, A.; Fukano, T. Fundamental data on the gas–liquid two-phase flow in minichannels. Int. J. Therm. Sci. 2007, 46, 519–530. [Google Scholar] [CrossRef]
- Fukano, T.; Kariyasaki, A. Characteristics of gas-liquid two-phase flow in a capillary tube. Nuclear Eng. Des. 1993, 141, 59–68. [Google Scholar] [CrossRef]
- Chen, L.; Tian, Y.; Karayiannis, T. The effect of tube diameter on vertical two-phase flow regimes in small tubes. Int. J. Heat Mass Transf. 2006, 49, 4220–4230. [Google Scholar] [CrossRef]
- Coleman, J.W.; Garimella, S. Two-phase flow regimes in round, square and rectangular tubes during condensation of refrigerant R134a. Int. J. Refrigeration 2003, 26, 117–128. [Google Scholar] [CrossRef]
- Triplett, K.; Ghiaasiaan, S.M.; Abdel-Khalik, S.I.; Sadowski, D.L. Gas–liquid two-phase flow in microchannels Part I: Two-phase flow patterns. Int. J. Multiph. Flow 1999, 25, 377–394. [Google Scholar] [CrossRef]
- Olesen, A.C.; Romer, C.; Kaer, S.K. A numerical study of the gas-liquid, two-phase flow maldistribution in the anode of a high pressure PEM water electrolysis cell. Int. J. Hydrog. Energy 2016, 41, 52–68. [Google Scholar] [CrossRef]
- Panchenko, O.; Borgardt, E.; Zwaygardt, W.; Hackemüller, F.J.; Bram, M.; Kardjilov, N.; Arlt, T.; Manke, I.; Müller, M.; Stolten, D.; et al. In-situ two-phase flow investigation of different porous transport layer for a polymer electrolyte membrane (PEM) electrolyzer with neutron spectroscopy. J. Power Sources 2018, 390, 108–115. [Google Scholar] [CrossRef]
- McCracken, C.G.; Motchenbacher, C.; Barbis, D.P. Review of Titanium-Powder-Production Methods. Int. J. Powder Metall. 2010, 46. [Google Scholar]
- Kardjilov, N.; Hilger, A.; Manke, I.; Strobl, M.; Dawson, M.; Banhart, J. New trends in neutron imaging. Nuclear Instrum. Methods Phys. Res. Sect. A 2009, 605, 13–15. [Google Scholar]
- Kardjilov, N.; Hilger, A.; Manke, I.; Strobl, M.; Dawson, M.; Williams, S.; Banhart, J. Neutron tomography instrument CONRAD at HZB. Nuclear Instrum. Methods Phys. Res. Sect. A 2011, 651, 47–52. [Google Scholar] [CrossRef]
- Kardjilov, N.; Hilger, A.; Manke, I.; Woracek, R.; Banhart, J. CONRAD-2: The new neutron imaging instrument at the Helmholtz-Zentrum Berlin. J. Appl. Crystallogr. 2016, 49, 195–202. [Google Scholar] [CrossRef]
© 2019 by the authors. Licensee MDPI, Basel, Switzerland. This article is an open access article distributed under the terms and conditions of the Creative Commons Attribution (CC BY) license (http://creativecommons.org/licenses/by/4.0/).