Abstract
The article presents the results of experimental and numerical investigation of turbulent premixed methane flames diluted by carbon dioxide (up to 30%) at atmospheric and elevated pressures (up to 0.5 MPa). The study included the influence of fuel properties and operation parameters on the emission of NOx and CO as well as flame properties. The investigation has been prepared for two combustion system configurations (axisymmetric flames and flames supported by a pilot flame) in a wide range of air/fuel equivalence ratios (ϕ = 0.42 ÷ 0.85). It has been reported that reduction of NOx emission by CO2 fuel dilution reached a level of up to 45% in atmospheric conditions and 30% at elevated pressure, decreasing with a drop in the equivalence ratio. The results have shown influence of pressure on NOx composition, where for pressurized tests, NO2 was doubled compared to atmospheric tests. Carbon monoxide emission rises with CO2 content in the fuel as a result of thermal dissociation, but this phenomenon is mitigated by a pressure increase. Planar laser induced fluorescence (PLIF) study has shown that flame length decreases with an increase in pressure and CO2 content in the fuel. Fuel staging increased NOx emission, especially for richer flames (ϕ > 0.6) at low pressure, while CO increased in the whole range of equivalence ratios.
1. Introduction
Reports published at the International Panel on Climate Change in Paris showed that human economic activity is responsible for global warming. Almost 200 countries committed to reduce their carbon dioxide emissions, considered to be the main cause of climate change. In the presented scenario, the lack of emissions reduction will lead to an increase in global average temperature of 3 °C. This would have catastrophic consequences for people and the natural environment. The aim of the agreement is to limit temperature growth by 2 °C, or by 1.5 °C if possible [1]. Carbon dioxide emissions should be reduced by almost half by 2030. Achieving these goals will require unprecedented transformation of the energy sector. In the 2050 perspective, it would be necessary to completely abandon combustion of hard coal and lignite. In addition, in the transitional period of abandoning fossil fuel consumption, it is necessary to develop methods of reducing carbon dioxide emissions and preventing their release into the atmosphere.
Due to imperfections of currently available renewable energy technologies (RE), network management methods, and energy storage systems [2,3], it is necessary to further develop combustion techniques that reduce carbon dioxide emissions. Currently, there are a number of methods allowing decarburization of the energy sector. These are solutions which are either in the research and development phase or already commercially available. They include carbon capture and storage (CCS), the use of hydrogen in electricity generation, and natural gas (NG) combustion in place of coal in the transitional period.
There are many available methods allowing CO2 capture related to CCS. Precombustion capture and oxyfuel combustion are the most effective; however, they are not applicable in many processes. Referring to Bounaceur et al. [4], the most cost-effective post-combustion CCS method is membrane separation. To properly function while maintaining profitability, this approach requires at least 30% CO2 content in exhaust gas. For this reason, it is necessary to develop solutions allowing to increase the CO2 content. Carbon dioxide containing natural gases and exhaust gases recirculation (EGR) are potential solutions to cope with CO2 dilution obstacles. Combustion of gaseous fuels in gas turbines is a very difficult process because of high power concentration, elevated pressure, limitation of maximum temperature (turbine inlet temperature, TIT), and a high share of oxygen in flue gases (around 15 vol %). These parameters influence flame stability, turbine durability, cycle efficiency, and emission of pollutant compounds. Additional carbon dioxide delivered to the combustion chamber, e.g., from EGR, can affect combustion parameters such as flame temperature, laminar and turbulent flame speed, heat transfer, flame length, combustion efficiency, and NO and CO emission. A lot of research has been done on EGR application in micro-gas turbines (MGT) and gas turbines in the context of CCS [5,6,7]. Recently, Best et al. investigated the impact of CO2-enriched air combustion in the micro-gas turbine Turbec T100 PH. They expected that 8% CO2 by volume may be supplied to combustion air without blowoff (about 35% EGR). The influence of CO2 on NOx reduction was in the range from 0.20 g/kWh to 1.01 g/kWh, although a minor decrease of efficiency was observed [5]. ElKady et al. [8] tested the general electric DLN combustor with EGR rate up to 40%. Their results showed significant reduction in NOx formation amounting to 47% and lower acoustic instability as well as almost constant combustion efficiency and carbon monoxide emission. A similar conclusion was conveyed by Lipardi et al. [9]; during numerical and experimental investigations of an opposed jet burner, they confirmed NO formation decrease. However, the condition for this is a sufficiently long post-flame residence time; otherwise, NO formation in the flame front is increased. Investigation of the biogas combustion process with CO2 content of up to 40% in a swirl dual lean premixed combustor presented by Lee et al. [10] showed a decrease in flame temperature when the dilution rate is increased, resulting in a reduction of thermal NOx emissions. Furthermore, they showed that delivering more than 30% of a mixture of CH4/CO2 in the pilot mode increased NOx emission significantly, due to different temperature distribution in the combustion area. Lafay et al. [11] studied biogas combustion in a gas turbine configuration. They observed that CO2-diluted methane/air flames become unstable in higher equivalence ratios compared to methane/air flames. Furthermore, the addition of CO2 shifts reaction zone location and reaction intensity.
Perris et al. [12] experimentally and numerically investigated the methane/air swirl flames diluted by CO2 at atmospheric pressure. They found CO2 dilution limits equal to 12% and 30% for rich and lean conditions, respectively. The limits correspond to flame blowoff. Simulations performed by Giorgetti et al. showed that applying EGR to micro-gas turbines can reduce the mass flow rate of exhaust gases by as much as 50% while tripling CO2 concentration compared to the traditional cycle. An additional share of carbon dioxide in the supplied fuel considered in this work can further increase the effectiveness of the MGT cycle [13].
Summarizing the previous studies, it can be noticed that fuel dilution by CO2 results in:
- -
- a decrease in flame temperature;
- -
- a reduction of thermal NOx emissions;
- -
- relatively slower heat release;
- -
- suppression of combustion oscillations.
Another important issue related to the decarburization process is the wider utilization of nonstandard gases such as low-heating-value natural gases with CO2 content, biogas, and landfill gas, as well as synthesis gases, especially from processes with CO2 and liquid biofuels [14]. Significant natural gas reservoirs containing high CO2 concentrations are spread around the world. For example, in the Pannonian Basin region, CO2 content ranges from 0.5 to 99.5% with an average value of 28% [15]. The direct use of natural gases containing CO2 increases its concentration in the flue gas and indirectly reduces carbon dioxide emissions during processing into carbon dioxide-free, high-methane gas.
The aim of the performed research work focuses on understanding the CO2 dilution effect on flames in the premixed methane/air mixture at elevated pressures. The obtained results can be helpful for utilization of nonstandard, high-CO2-content gases in conditions corresponding to micro-gas turbines and gas turbine operation, as well as in application to EGR for pressurized gas combustion systems.
2. Experimental Study
2.1. Test Rig
The experiment was performed in a high-pressure test rig with a maximum thermal power of 400 kW and a maximum operation pressure of 2 MPa. The combustion process of the air/fuel mixture took place in an optically accessible combustion chamber of a length of 320 mm and an internal diameter of 75 mm. The air/fuel mixture stream was delivered through a 25-mm nozzle located in the axis of a quartz tube, while the secondary fuel mixture was delivered through an array of five jets (a nozzle of a diameter of 1 mm) placed on the perimeter of the main burner nozzle (the case with a pilot flame). The secondary fuel jets were injected parallel to the main stream.
The air/fuel mixture was mixed and preheated to 630 K using an 8D electrical heater located upstream of the combustion chamber. The flame stability was provided by a sudden radial expansion by a factor of three between the inlet nozzle and combustion chamber walls. It provided external zone recirculation which stabilizes the premixed flame. The target elevated pressure was obtained using a fully automatically controlled valve located downstream of the combustion chamber. The flue gas composition was measured using a set of gas analyzers at atmospheric pressure (500 mm downstream of the pressure valve). The analyzers, manufactured by Siemens, measured carbon monoxide, carbon dioxide, and oxygen content, while for nitric oxides, the Eco-Physics analyzer was used. The main parameters of gas analyzers are presented in Table 1.

Table 1.
Parameters of gas analyzers.
The temperature inside the combustion chamber and the flue gas temperature were measured using S-type thermocouples within a range of up to 1800 K and an accuracy of 1%, while for temperature of the air/fuel mixture, a K-type thermocouple was used (a measuring range of up to 800 K at 1% accuracy). The scheme of the test rig is shown in Figure 1. All measured data collected in the experiments were registered online and recorded on a computer disk with a frequency of 1 Hz.
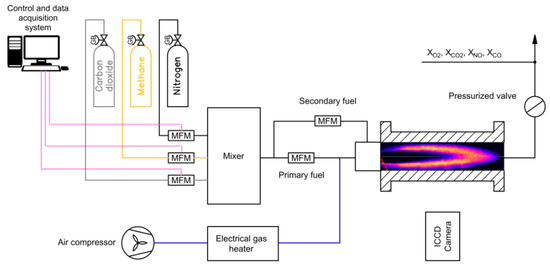
Figure 1.
Scheme of test setup.
Aside from thermodynamic properties of the combustion process and emission of toxic compounds, the study also measured the reaction zone position in the combustion chamber as well as flame length using planar laser induced fluorescence (PLIF) techniques. In the PLIF diagnostic method, OH radicals were detected to assess the flame front position in the combustion chamber. The OH PLIF system was built on a dye laser system pumped by a solid-state Nd:YAG laser with a 9 mJ pulse at 285 nm, a pulse duration of 30 ns, and an ICCD camera with a repetition rate of 20 Hz. The 285-nm PLIF light sheet entered the reactor from the rear axial window of the tank. The signal from excited OH radicals was collected by an image intensifier camera equipped with a UV filter lens. The camera was located perpendicular to the axis of the combustion chamber. More information about the laser/camera configuration can be found in [13]. For each studied case, more than 1000 raw images were collected. The post-process adaptation of the methodology is proposed in [16], with the latest modifications described in [17].
2.2. Measurements
The experimental study was done for three fuels: methane as a comparative fuel and a mixture of methane and carbon dioxide with a volume fraction of 15 and 30 vol %. For all experiments, main fuel stream mass velocities were kept on a constant level equal to 40 m/s, while the secondary fuel velocity was changed depending on the test’s conditions. The composition and main parameters of fuels are presented in Table 2.
Table 2.
Composition and main parameters of fuels.
During the investigation, two combustion system setups were used. In the first one, the whole fuel dose was delivered to the combustion chamber by the main nozzle, while in the second case, the fuel was injected using both the main and secondary fuel nozzles at a 9 and 20 vol % share of the volume (the pilot mode combustion, PMC), respectively. The PMC was used to increase flame stability, especially in the case of lean flammable mixtures.
The experiments were performed in a wide range of operational parameters: the air/fuel equivalence ratio ranged from 0.4 to 0.86, and absolute pressure of up to 0.5 MPa was used. The main parameters of the combustion process are presented in Table 3.
Table 3.
Mixture composition and combustion parameters.
3. Numerical Modeling
The objective of the numerical investigation was to determine the properties of flammable mixtures for experimentally tested lean-burn. Moreover, prediction of flue gases composition with selected chemical reaction mechanisms was conducted and focused on the harmful pollutant emission of nitric oxides and carbon oxide. Calculations were performed with a modified three-step 1D numerical code based on the FreeFlame and BurnerFlame models from Cantera libraries [18]. For each test case, an initial grid of a 0.5-m width with automatic refinement was applied. The freely propagating flat flame structure was determined for a multicomponent transport model and adiabatic conditions. The final resulting temperature was reported as an adiabatic flame temperature (TA). Furthermore, the initial flame speed followed by a significant temperature rise was marked as laminar flame speed (SL). The adiabatic flame structure was recalculated incorporating the radiative heat flux, which resulted in modification of temperature and the species profile along the domain. The temperature profile was fixed and recalculated in accordance with a fitted empirical curve Qloss/Qload, where the heat loss ratio depends on combustion pressure, mixture composition, and adiabatic flame temperature [19]. The final temperature profile was implemented in the BurnerFlame, where a burner stabilized solution was achieved. Data from each numerical test point were recalculated to a volumetric share in ppm at 0% O2 in dry reference combustion gases. Moreover, in the case of NO, NO2, and CO prediction possibilities, four kinetic reaction mechanisms were investigated and compared (SanDiego, Creck [20,21], GRI-Mech3.0 [22], Tian [23]).
The numerical investigation was performed for operational parameters corresponding to the experimental setup and exceeding the air/fuel equivalence ratio range (from 0.4 up to 0.9) and absolute pressure of up to 1.0 MPa. The main parameters of the numerical setup are presented in Table 4.
Table 4.
Numerical setup matrix.
Numerical calculation results of the thermodynamic properties of laminar flames are presented in Table 5 and Table 6 as a function of the pressure, equivalence ratio, and dilution rate. It was observed that a decrease in the equivalence ratio leads to a decrease of SL and TA. The same variations of laminar flame speed and adiabatic flame temperature were observed in the case of a growing ratio of CO2 dilution. A more notable effect of CO2 as an inert gas was observed for mixtures close to stoichiometric conditions as a result of a higher combustion process temperature. For given shares of CO2 laminar flame speed and adiabatic flame temperature, values were growing with an increase in the equivalence ratio. The decrease in the value of TA as a result of thermal dissociation of CO2 and H2O is reduced by an increase in pressure. Since thermal dissociation occurs only at high temperatures (above 2000 K), the impact of pressure on TA is visible only for combustion of rich mixtures. There is a slight increase in temperature with a pressure increase. Based on the laminar flame speed definition proposed by Mallard and Le Chatelier [24], it can be noted that pressurization of the combustion system will lead to an increase in SL as a result of increasing density.
Table 5.
Adiabatic flame temperature at elevated pressures and Tsub = 630 K (SanDiego).
Table 6.
Laminar flame speed at elevated pressures and Tsub = 630 K (SanDiego).
For each tested chemical reaction mechanism, trends were reproduced properly. However, some differences were observed, especially for laminar flame speed and emission results. The best quantitative results were achieved with SanDiego and Creck mechanisms, when the mechanism proposed by Tian underpredicted NO and SL.
Radiation heat flux affected adiabatic flame temperature for atmospheric pressure from 15 K for lean methane flames up to 48 K for ϕ = 0.91 when CO2 dilution was used.
Figure 2 and Figure 3 show a comparison of the numerical and experimental measurement results of nitrogen oxides as a function of the equivalence ratio. There is a good qualitative and quantitative agreement between the model predictions and the experimental results for the entire investigated parameter ranges, such as ϕ, pressure, and the CO2 dilution rate. Figure 4 presents calculated and measured results of CO emission. A significant discrepancy between the predicted and measured carbon monoxide was found. The trends are similar only for mixtures close to stoichiometric conditions, but there is a large quantitative discrepancy, which could be a result of the ideally premixed inlet composition and the laminar flow of the model. Moreover, a slight increase in CO emission for lean mixtures near the blowout point could not be reproduced without complex flow modeling. Both the experimental and numerical results show that CO emission increased with CO2 dilution and decreased with pressurization of the combustion system.
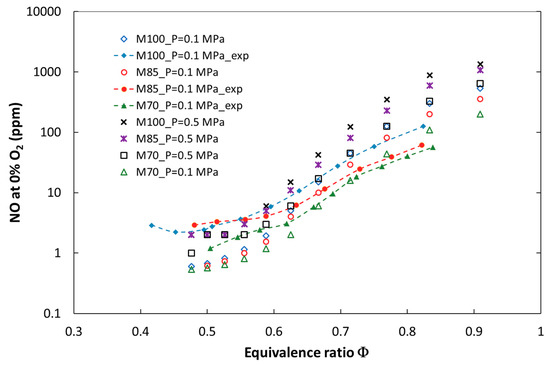
Figure 2.
Calculated and experimental NO emissions for the tested fuels at atmospheric and elevated combustion pressure (P = 0.5 MPa).
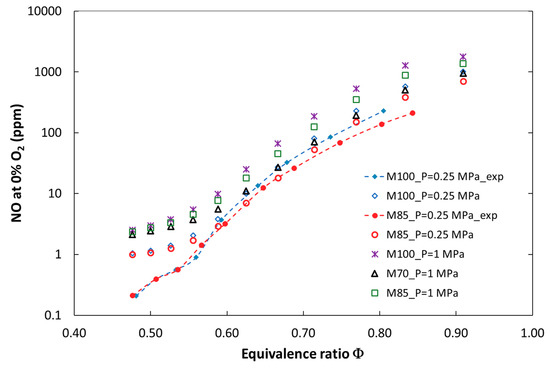
Figure 3.
Calculated and experimental NO emissions for the tested fuels at elevated combustion pressures of 0.25 MPa and 1 MPa.
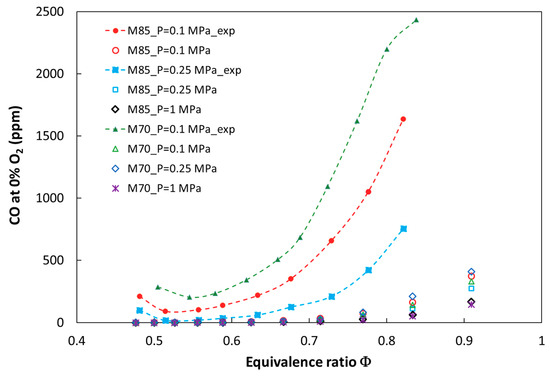
Figure 4.
Calculated and experimental CO emissions for the tested fuels at elevated combustion pressures.
4. Experimental Results and Discussion
4.1. Emission of Pollutant Compounds
During measurements, the influence of the physicochemical properties of the gaseous fuels and operating parameters on the combustion characteristics was investigated. The first part of the measurements examined the influence of the equivalence ratio, fuel composition, and pressure in the combustion chamber on toxic compound emission. The tests were done for the first combustion chamber setup, in which the entire fuel dose was delivered by the main nozzle. The emission characteristics are presented in Figure 5, Figure 6, and Figure 7.
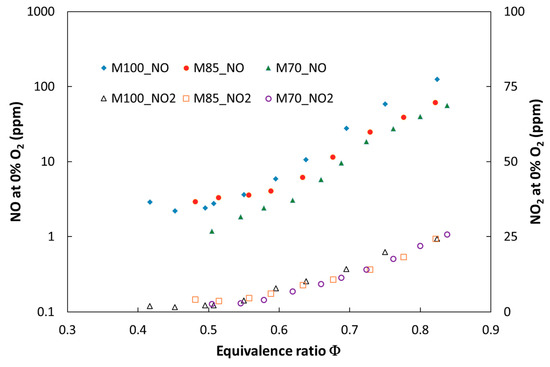
Figure 5.
Experimental NO and NO2 emissions for the tested fuels for atmospheric combustion pressure (P = 0.1 MPa) versus equivalence ratio.
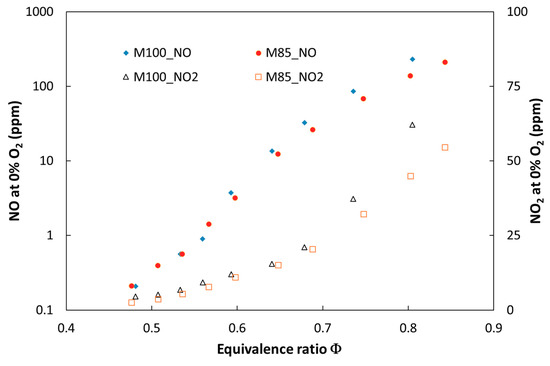
Figure 6.
Experimental NO and NO2 emissions for the tested fuels at elevated combustion pressure (P = 0.25 MPa) versus equivalence ratio.
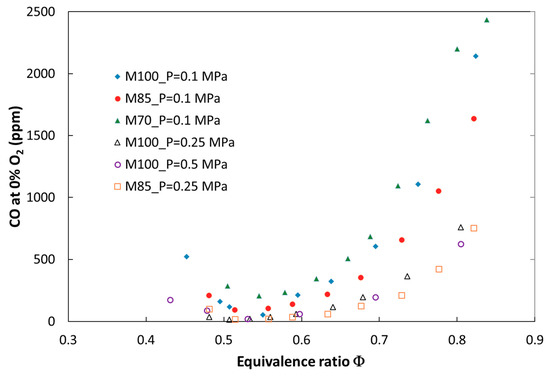
Figure 7.
Experimental CO emission at elevated combustion pressure (P = 0.25 MPa) versus equivalence ratio.
Figure 5 and Figure 6 show the expected decrease of NO and NO2 emissions as indicated by the flame cooling effect caused by addition of carbon dioxide. This effect is more significant for the tests performed at atmospheric pressure, where an increase of the CO2 share in the fuel to 30 vol % caused the overall nitric oxide emissions to decrease by 45% (ϕ = 0.83). It was observed that the effect of dilution on NOx emission became more significant with a decreasing equivalence ratio. Such a trend was observed for both atmospheric and pressurized tests.
The analysis of the combustion chamber pressure impact on NOx emission revealed a significant increase of NOx for both analyzed fuels. The emission rises almost four times in the rich mixture (t = 0.85) when the combustion pressure changes from 0.1 to 0.5 MPa. It was observed that for pressurized tests, the composition of NOx varies and amount of nitric dioxide rises. This augmentation is caused mainly as a result of the reaction NO + HO2 → NO2 + OH, where HO2 is formed according to the third body reaction H + O2 + M → HO2 + M. The increase of combustion pressure could increase the probability of a three body reaction occurring once the mean free path of the molecules decreases [25]. It can be noticed that pressure increase above 0.5 MPa promoted HO2 formation from the OH → H2O → HO2 → OH feedback loop; direct formation through H radicals is no longer visible.
Nitric dioxide increased in the whole range of investigated equivalence ratio values for both fuels (M100 and M85) and became more significant in richer mixture conditions, for which incomplete fuel combustion occurs during the process (see Figure 6). Numerical and experimental studies presented in [26] showed that trace amounts of hydrocarbons greatly promote nitric oxide conversion to NO2.
The influence of carbon dioxide content in the fuel as well as the impact of pressure on carbon monoxide emission are presented in Figure 7. When CO2 increases, CO is higher for the same value of the equivalence ratio. It is a result of thermal dissociation of carbon dioxide in the high-temperature region of the flame. The process of thermal dissociation increases in magnitude with an increase in the equivalence ratio (an increase in flame temperature) and decreases with pressure.
In the second part of the investigation, a new combustion setup was introduced (the pilot mode). Volume shares of 9% and 20% of gas were delivered as a secondary fuel through nozzles located on the perimeter of the main burner nozzle. Such a burner design was tested as a method for the increase of flame stability, especially for lean-burn. The influence of pilot mode combustion (PMC) on emission characteristics of CO2-diluted premixed flames is presented in Figure 8, Figure 9, and Figure 10.
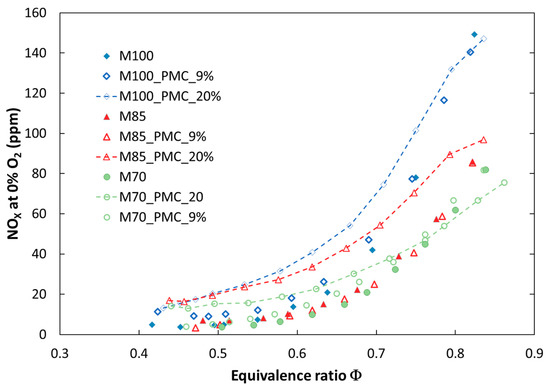
Figure 8.
Comparison of experimental NOX emissions for tested fuels for various configurations of the combustion process at atmospheric pressure (P = 0.1 MPa).
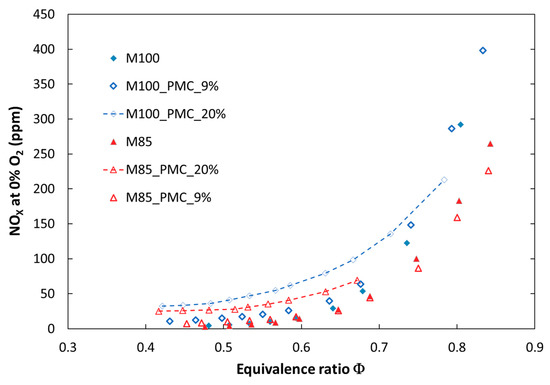
Figure 9.
Comparison of experimental NOX emissions for tested fuels in various configurations of the combustion process at elevated pressure (P = 0.25 MPa).
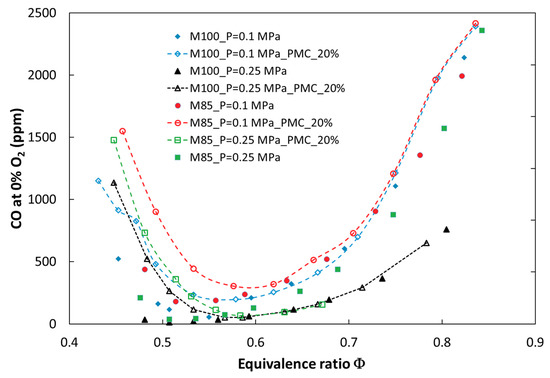
Figure 10.
Experimental CO emissions for tested fuels in various configurations of the combustion process versus equivalence ratio.
It can be observed that introducing a portion of fuel by a pilot nozzle (a pilot flame) caused an increase in nitrogen oxides emission. The increase depends on the amount of secondary fuel and becomes significant for a volume flow rate of 20 vol %. The effect of PMC on NOx emission is stronger in the case of atmospheric pressure, especially in a richer combustion mixture (ϕ > 0.6). This is because NOx emission is proportional to temperature, and the temperature is higher in a rich zone. The opposite effect was observed only for the fuel M70, where for richer mixtures, nitrogen oxide emission decreased (M70_PMC_20%). This may be a result of a greater radiation heat loss from the reaction zone and a decreased local temperature. It should be noted that for 9% (vol) of fuel delivered by the pilot nozzle, the influence on NOx emission is negligible for lean mixtures in both atmospheric and pressurized tests. Another measured toxic compound was carbon monoxide. Implementation of PMC caused a significant increase in CO emission in the whole range of investigated fuel mixtures and combustion pressures (Figure 10). This may be due to a weak mixing process of pilot fuel with oxidizer delivered by the main nozzle. In addition, the diffusion flame is located next to the cooled combustion chamber wall, which can result in extinguishing of the flame. The analysis of pollutant emissions from combustion systems (atmospheric and pressurized) showed that dilution of methane by CO2, from exhaust gas recirculation, for example, caused a decrease in nitrogen oxide emission, but an increase in carbon monoxide. The received values of NOx emission for lean mixtures were below the emission limits (81.4 ppmv [27]) for the gas turbine used. In addition, increasing the share of carbon dioxide above 20% (volume) in the fuel shifted emission limits by up to 195 ppmv and exceeded the limit of CO emission (280 ppmv for natural gas). It can be concluded that dilution of natural gas by CO2 provided a positive effect on emission characteristics of the investigated flames and provided better conditions for the decarburization process of electricity production through implementing CCS in a gas turbine plant.
4.2. Flame Structure
The flame structure was studied by means of flame visualization using the method described in Section 2.1. The flame structure and the reaction zone position constitute very important information for understanding nitrogen oxide emission and flame stability. In addition, flame visualization allows calculating flame length and turbulent flame speed. Flame structures marked on the basis of the OH radical (OH PLIF) for the investigated fuels are presented in Figure 11 and Figure 12. The presented results focus on describing the influence of fuel properties (content of CO2) and operating parameters (pressure, ϕ) on the shape, reaction zone position, and flame length.
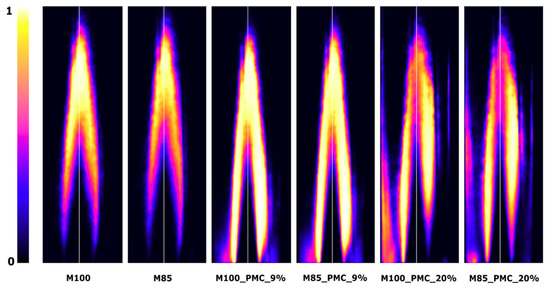
Figure 11.
Examples of OH-PLIF images (scaled min–max) for M100 and M85 fuels, with PMC at 0.25 MPa and ϕ = 0.63.
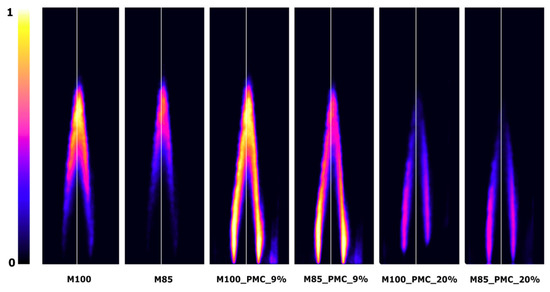
Figure 12.
Examples of OH-PLIF images (scaled min–max) for M100 and M85 fuels, with PMC at 0.5 MPa and ϕ = 0.63.
Figure 11 and Figure 12 are examples of typical OH-PLIF images in lean mixture conditions (ϕ = 0.63) at a constant temperature and bulk velocity (Tu = 630 K, ub = 40 m/s). The color scale represents the OH-PLIF signal, with the white color corresponding to the maximum signal. The constant color scale was used during the image analysis. It can be seen that CO2 diluted in the fuel caused an elongation of the flame front, increasing the flame volume, and consequently leading to a more distributed heat release. Aside from a temperature decrease through CO2 dilution, a more distributed heat release weakens the process of nitrogen oxide formation. An increase in combustion pressure has an opposite effect to CO2 fuel dilution. As shown, a significant reduction of flame length and volume was observed.
The flame structure changed when the combustion process was done in the PMC mode. When 9% of fuel was delivered to the combustion system (M100_PMC_9%, M85_PMC_9%), the additional signal of OH radicals was collected next to the nozzle output. The higher intensity of OH formation appeared between the flame front and the external recirculation zone (ERZ). This suggests an increase in the reaction zone size, resulting in a more distributed heat release, slower combustion, and reduction of flame stability. When PMC reaches 20% (M100_PMC_20%, M85_PMC_20%), the pilot burner starts to play an important role in the combustion process. Two reaction zones were observed: one in the center and the other next to the combustion chamber wall, where diffusion of the combustion process of the secondary fuel and oxidizer from the ERZ occurs. Increasing the CO2 dilution rate at PMC values of 9 and 20% did not significantly change the flame structure and did not reduce the signal intensity of the OH radicals.
For each testing point, an averaged OH-PLIF image was prepared and supplemented with two fitted curves. The first one was based on scaled OH signal strength along the burner symmetry axis, and the second presented a calculated progress variable. Flame length was determined as the most probable flame front axial position and marked as XMP for a point where the reaction progress variable was equal to 0.5. The influence of CO2 dilution and the combustion setup on flame length is presented in Figure 13.
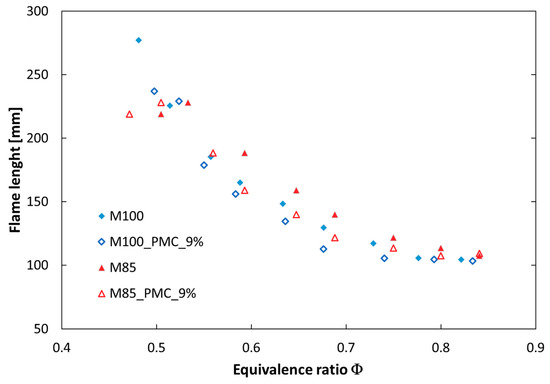
Figure 13.
Flame length for the fuels M100 and M85 at elevated pressure (P = 0.25 MPa) versus equivalence ratio.
The flame length (XMP) increased with a raised share of CO2 in the fuel, but a more significant change (elongation) can be observed when the equivalence ratio is lowered (XMP was doubled with a change in ϕ from 0.83 to 0.52). The use of the pilot mode combustion shortened the reaction zone for both investigated fuels.
5. Conclusions
The experimental and numerical studies of methane/CO2/air flames were performed at elevated pressures. The impact of CO2 dilution, pressure, mixture composition, and combustion setup configuration on the overall emission of toxic compounds and flame properties was shown. Based on the obtained results, the following conclusions can be provided:
- Experimental and numerical results showed that dilution of the methane/air mixture by carbon dioxide decreased the emission of nitrogen oxides at atmospheric and elevated pressures. The emissions drop by up to 45% in atmospheric conditions and 30% at elevated pressure. In the pressurized system, the composition of NOx was changing while the NO2/NOx ratio increased.
- Introduction of CO2 changed the flame structure, causing elongation of the reaction zone and increasing the flame volume, especially in lean mixture conditions. It provided a more distributed heat release, resulting in an increased flame stability.
- The combustion setup in the pilot mode combustion increased flame stability, but also increased NOx and CO emission. The effect of PMC on pollutant emission increased with an increasing share of the secondary fuel, but was mitigated by an increase in the CO2 dilution rate.
- The presented model of numerical calculation of NOx emission ensured good quantitative and qualitative agreement with experimental data, indicating that it can be used as a tool for predicting NOx emission in other combustion systems.
The results of the presented study indicate the possibility of using nonstandard gases with a high content of CO2 (landfill gas, biogas, low calorific natural gas), as well as introduction of an external recirculation system in pressurized combustion systems, such as micro- and gas turbines.
Funding
This work was supported by internal grant of Poznan University of Technology, Chair of Thermal Engineering, Grant number DSPB-5035.
Conflicts of Interest
The authors declare no conflict of interest.
Nomenclature
| CCS | carbon capture and storage |
| EGR | external gas recirculation |
| ERZ | external recirculation zone |
| F1 | primary fuel |
| F2 | secondary fuel delivered in PMC |
| ICCD | intensified digital camera |
| NG | natural gas |
| OH | hydroxyl radicals |
| PLIF | planar laser induced fluorescence |
| PMC | pilot mode combustion |
| RE | renewable energy sources |
| TIT | turbine inlet temperature |
| Qload | heat delivered to combustion chamber |
| Qloss | heat loos from combustion chamber |
| SL | laminar flame speed |
| TA | adiabatic flame temperature |
| Tsub | substrates temperature |
| XMP | flame front position |
| ub | bulk velocity |
| ϕ | equivalence ratio |
References
- UN. Convention on Climate Change: Climate Agreement of Paris; United Nations: New York, NY, USA, 2015; pp. 1–27. [Google Scholar]
- Luo, X.; Wang, J.; Dooner, M.; Clarke, J. Overview of current development in electrical energy storage technologies and the application potential in power system operation. Appl. Energy 2015, 137, 511–536. [Google Scholar] [CrossRef]
- Saboori, H.; Hemmati, R.; Ghiasi, S.M.S.; Dehghan, S. Energy storage planning in electric power distribution networks—A state-of-the-art review. Renew. Sustain. Energy Rev. 2017, 79, 1108–1121. [Google Scholar] [CrossRef]
- Bounaceur, R.; Lape, N.; Roizard, D.; Vallieres, C.; Favre, E. Membrane processes for post-combustion carbon dioxide capture: A parametric study. Energy 2006, 31, 2220–2234. [Google Scholar] [CrossRef]
- Best, T.; Finney, K.N.; Ingham, D.B.; Pourkashanian, M. Impact of CO2-enriched combustion air on micro-gas turbine performance for carbon capture. Energy 2016, 115, 1138–1147. [Google Scholar] [CrossRef]
- Ali, U.; Hughes, K.J.; Ingham, D.B.; Ma, L.; Pourkashanian, M. Effect of the CO2 enhancement on the performance of a micro gas turbine with a pilot-scale CO2 capture plant. Chem. Eng. Res. Des. 2017, 117, 11–23. [Google Scholar] [CrossRef]
- Baker, R.W.; Freeman, B.; Kniep, J.; Wei, X.; Merkel, T. CO2 capture from natural gas power plants using selective exhaust gas recycle membrane designs. Int. J. Greenh. Gas Control 2017, 66, 35–47. [Google Scholar] [CrossRef]
- ElKady, A.M.; Evulet, A.; Brand, A.; Ursin, T.P.; Lynghjem, A. Application of Exhaust Gas Recirculation in a DLN F-Class Combustion System for Postcombustion Carbon Capture. J. Eng. Gas Turbines Power 2009, 131, 034505. [Google Scholar] [CrossRef]
- Lipardi, A.C.A.; Versailles, P.; Watson, G.M.G.; Bourque, G.; Bergthorson, J.M. Experimental and numerical study on NOxformation in CH4–air mixtures diluted with exhaust gas components. Combust. Flame 2017, 179, 325–337. [Google Scholar] [CrossRef]
- Lee, K.; Kim, H.; Park, P.; Yang, S.; Ko, Y. CO2 radiation heat loss effects on NOx emissions and combustion instabilities in lean premixed flames. Fuel 2013, 106, 682–689. [Google Scholar] [CrossRef]
- Lafay, Y.; Taupin, B.; Martins, G.; Cabot, G.; Renou, B.; Boukhalfa, A. Experimental study of biogas combustion using a gas turbine configuration. Exp. Fluids 2007, 43, 395–410. [Google Scholar] [CrossRef]
- De Persis, S.; Cabot, G.; Pillier, L.; Gökalp, I.; Boukhalfa, A.M. Study of lean premixed methane combustion with CO2 dilution under gas turbine conditions. Energy Fuels 2013, 27, 1093–1103. [Google Scholar] [CrossRef]
- Giorgetti, S.; Bricteux, L.; Parente, A.; Blondeau, J.; Contino, F.; De Paepe, W. Carbon capture on micro gas turbine cycles: Assessment of the performance on dry and wet operations. Appl. Energy 2017, 207, 243–253. [Google Scholar] [CrossRef]
- Kun-Balog, A.; Sztankó, K.; Józsa, V. Pollutant emission of gaseous and liquid aqueous bioethanol combustion in swirl burners. Energy Convers. Manag. 2017, 149, 896–903. [Google Scholar] [CrossRef]
- Dolton, G.L. Pannonian Basin Province, Central Europe (Province 4808)—Petroleum Geology, Total Petroleum Systems, and Petroleum Resource Assessment. USGS Bull. 2006, 2204-B, 1–47. [Google Scholar]
- Daniele, S.; Jansohn, P.; Boulouchos, K. Flame Front Characteristic and Turbulent Flame Speed of Lean Premixed Syngas Combustion at Gas Turbine Relevant Conditions. In Proceedings of the ASME Turbo Expo 2009: Power for Land, Sea, and Air Volume 2: Combustion, Fuels and Emissions, Orlando, FL, USA, 8–12 June 2009; pp. 393–400. [Google Scholar]
- Griebel, P.; Bombach, R.; Inauen, A.; Schären, R.; Schenker, S.; Siewert, P. Flame Characteristics and Turbulent Flame Speeds of Turbulent, High-Pressure, Lean Premixed Methane/Air Flames. In Proceedings of the ASME Turbo Expo 2005: Power for Land, Sea, and Air Volume 2: Turbo Expo 2005, Reno, NV, USA, 6–9 June 2005; pp. 405–413. [Google Scholar]
- Goodwin, D.G.; Moffat, H.K.; Speth, R.L. Cantera: An Object- Oriented Software Toolkit for Chemical Kinetics, Thermodynamics, and Transport Processes. Available online: https://cantera.org/ (accessed on 10 September 2018).
- Siewert, P. Flame Front Characteristics of Turbulent Premixed Lean Methane/Air Flames at High-Pressure and High-Temperature; Swiss Federal Institute of Technology ETH-Zurich: Zurich, Switzerland, 2005. [Google Scholar]
- Ranzi, E.; Frassoldati, A.; Grana, R.; Cuoci, A.; Faravelli, T.; Kelley, A.P.; Law, C.K. Hierarchical and comparative kinetic modeling of laminar flame speeds of hydrocarbon and oxygenated fuels. Prog. Energy Combust. Sci. 2012, 38, 468–501. [Google Scholar] [CrossRef]
- Frassoldati, A.; Cuoci, A.; Faravelli, T.; Niemann, U.; Ranzi, E.; Seiser, R.; Seshadri, K. An experimental and kinetic modeling study of n-propanol and iso-propanol combustion. Combust. Flame 2010, 157, 2–16. [Google Scholar] [CrossRef]
- Sung, C.J.; Law, C.K.; Chen, J.-Y. Augmented Reduced Mechanisms for NO Emission in Methane Oxidation. Combust. Flame 2001, 125, 906–919. [Google Scholar] [CrossRef]
- Tian, Z.; Li, Y.; Zhang, L.; Glarborg, P.; Qi, F. An experimental and kinetic modeling study of premixed NH3/CH4/O2/Ar flames at low pressure. Combust. Flame 2009, 156, 1413–1426. [Google Scholar] [CrossRef]
- Warnatz, J.; Maas, U.; Dibble, R.W. Combustion: Physical and Chemical Fundamentals, Modeling and Simulation, Experiments, Pollutant Formation; Springer: Berlin/Heidelberg, Germany, 2006; ISBN 9783540453635. [Google Scholar]
- Miller, J.A.; Bowman, C.T. Mechanism and modeling of nitrogen chemistry in combustion. Prog. Energy Combust. Sci. 1989, 15, 287–338. [Google Scholar] [CrossRef]
- Hunderup, J.W.; Roby, R.J. An experimental investigation of the conversion of NO to NO2 at high pressure. In Proceedings of the ASME 1995 International Gas Turbine and Aeroengine Congress and Exposition, Houston, TX, USA, 5–8 June 1995; Volume 3. [Google Scholar]
- Directive, C. Directive 2010/75/EU of the European Parliament and of the Council of 24 November 2010 on industrial emissions (integrated pollution prevention and control) (Recast) (Text with EEA relevance). Off. J. Eur. Union L 2010, 334, 17–119. [Google Scholar]
© 2019 by the author. Licensee MDPI, Basel, Switzerland. This article is an open access article distributed under the terms and conditions of the Creative Commons Attribution (CC BY) license (http://creativecommons.org/licenses/by/4.0/).