1. Introduction
The increasing number of refrigeration units has led to an increase of CO
2 emissions and the destruction of the ozone layer. Calm [
1] pointed out that refrigeration units contribute greenhouse gases to the atmosphere by leaking refrigerants and consuming energy to power the system. Improving the efficiency of the refrigeration units, using low global warming potential (GWP) refrigerants, and minimising refrigerant leakages can be effective solutions for global warming.
Several low GWP refrigerants (R1234yf, R152a, R290, and R600a) were considered as potential replacements for R134a. Similar or even superior performances of the low GWP refrigerants were reported by a number of works [
2,
3,
4,
5]. However, the high flammability of low GWP refrigerants leads to safety concerns in the application. Thus, minimisation of the refrigerant charge and leakage becomes more important than ever during the design process of refrigeration units. Refrigerant distribution is strongly related to refrigerant leakage rate and refrigerant charge [
6]. Investigating the refrigerant distribution enables a deeper understanding of the impact of refrigerant charge and helps to reduce the refrigerant charge. Numerous works have been done to investigate the impact of the refrigerant distribution under various operating conditions. Li et al. [
6] investigated the refrigerant distribution of a split air conditioner using R290 as the working fluid. The results indicated that 60% of the total charge of the refrigerant was accumulated in the heat exchanger at steady-state conditions. Bjork and Palm [
7,
8] carried out the experiments to investigate the refrigerant distribution in a domestic refrigerator at steady-state conditions and transient conditions. The results show that at a start-up condition, the refrigerant moves to the condenser before restoring the steady-state refrigerant distribution. For steady-state conditions, the experimental results indicated that with the rise of the thermal load, the refrigerant mass increased in the condenser while a reverse trend was found in the evaporator. Tang et al. [
9] tested the refrigerant distribution and leakage in a split type household air conditioner using R290. The results indicated that 85–92% of the refrigerant accumulates in the low-pressure side of the system and the evaporator holds the most mass of the refrigerant. The refrigerant distribution within refrigerant systems varies with the change of the refrigerant charge, temperature, and compressor speed. Han et al. [
10] experimentally investigated the transient refrigerant distribution inside the main components of an air conditioner in heating mode. The results indicated that the increase of the refrigerant quality in the condenser prior to restarting can increase the pressure in the condenser. Poggi et al. [
11] reviewed the influence of the refrigerant on the refrigeration systems and pointed out that the refrigerant charge in the liquid pipes was 60% of the total charge for the direct expansion system, and 40% for the flooded system. Pulinkuzhi et al. [
12] estimated the refrigerant inventory in each component of a vapour compression refrigeration (VCR) system by using an analytical technique, which is a modified version of the Otaki method [
13]. The results indicated that the heat exchangers are the major stakeholder of refrigerants.
Despite a number of relevant works mentioned above, all refrigeration systems involved oil lubricant for lubricating compressors. The refrigerant is inevitably dissolved in oil lubricant, resulting in an increase of total refrigerant charge, thus higher refrigerant leakage. In addition, the oil lubricant can deteriorate the pressure drop and capacity in heat exchangers. A novel oil-free VCR system has been prototyped for the purpose of refrigerant charge reduction, which can utilise compact heat exchangers (e.g., micro-channel). A model of refrigerant mass distribution in a prototype oil-free VCR system using a linear compressor and R134a is presented in this study. The oil-free system was tested with various refrigerant charges.
2. The Prototype Oil-Free Refrigeration Unit
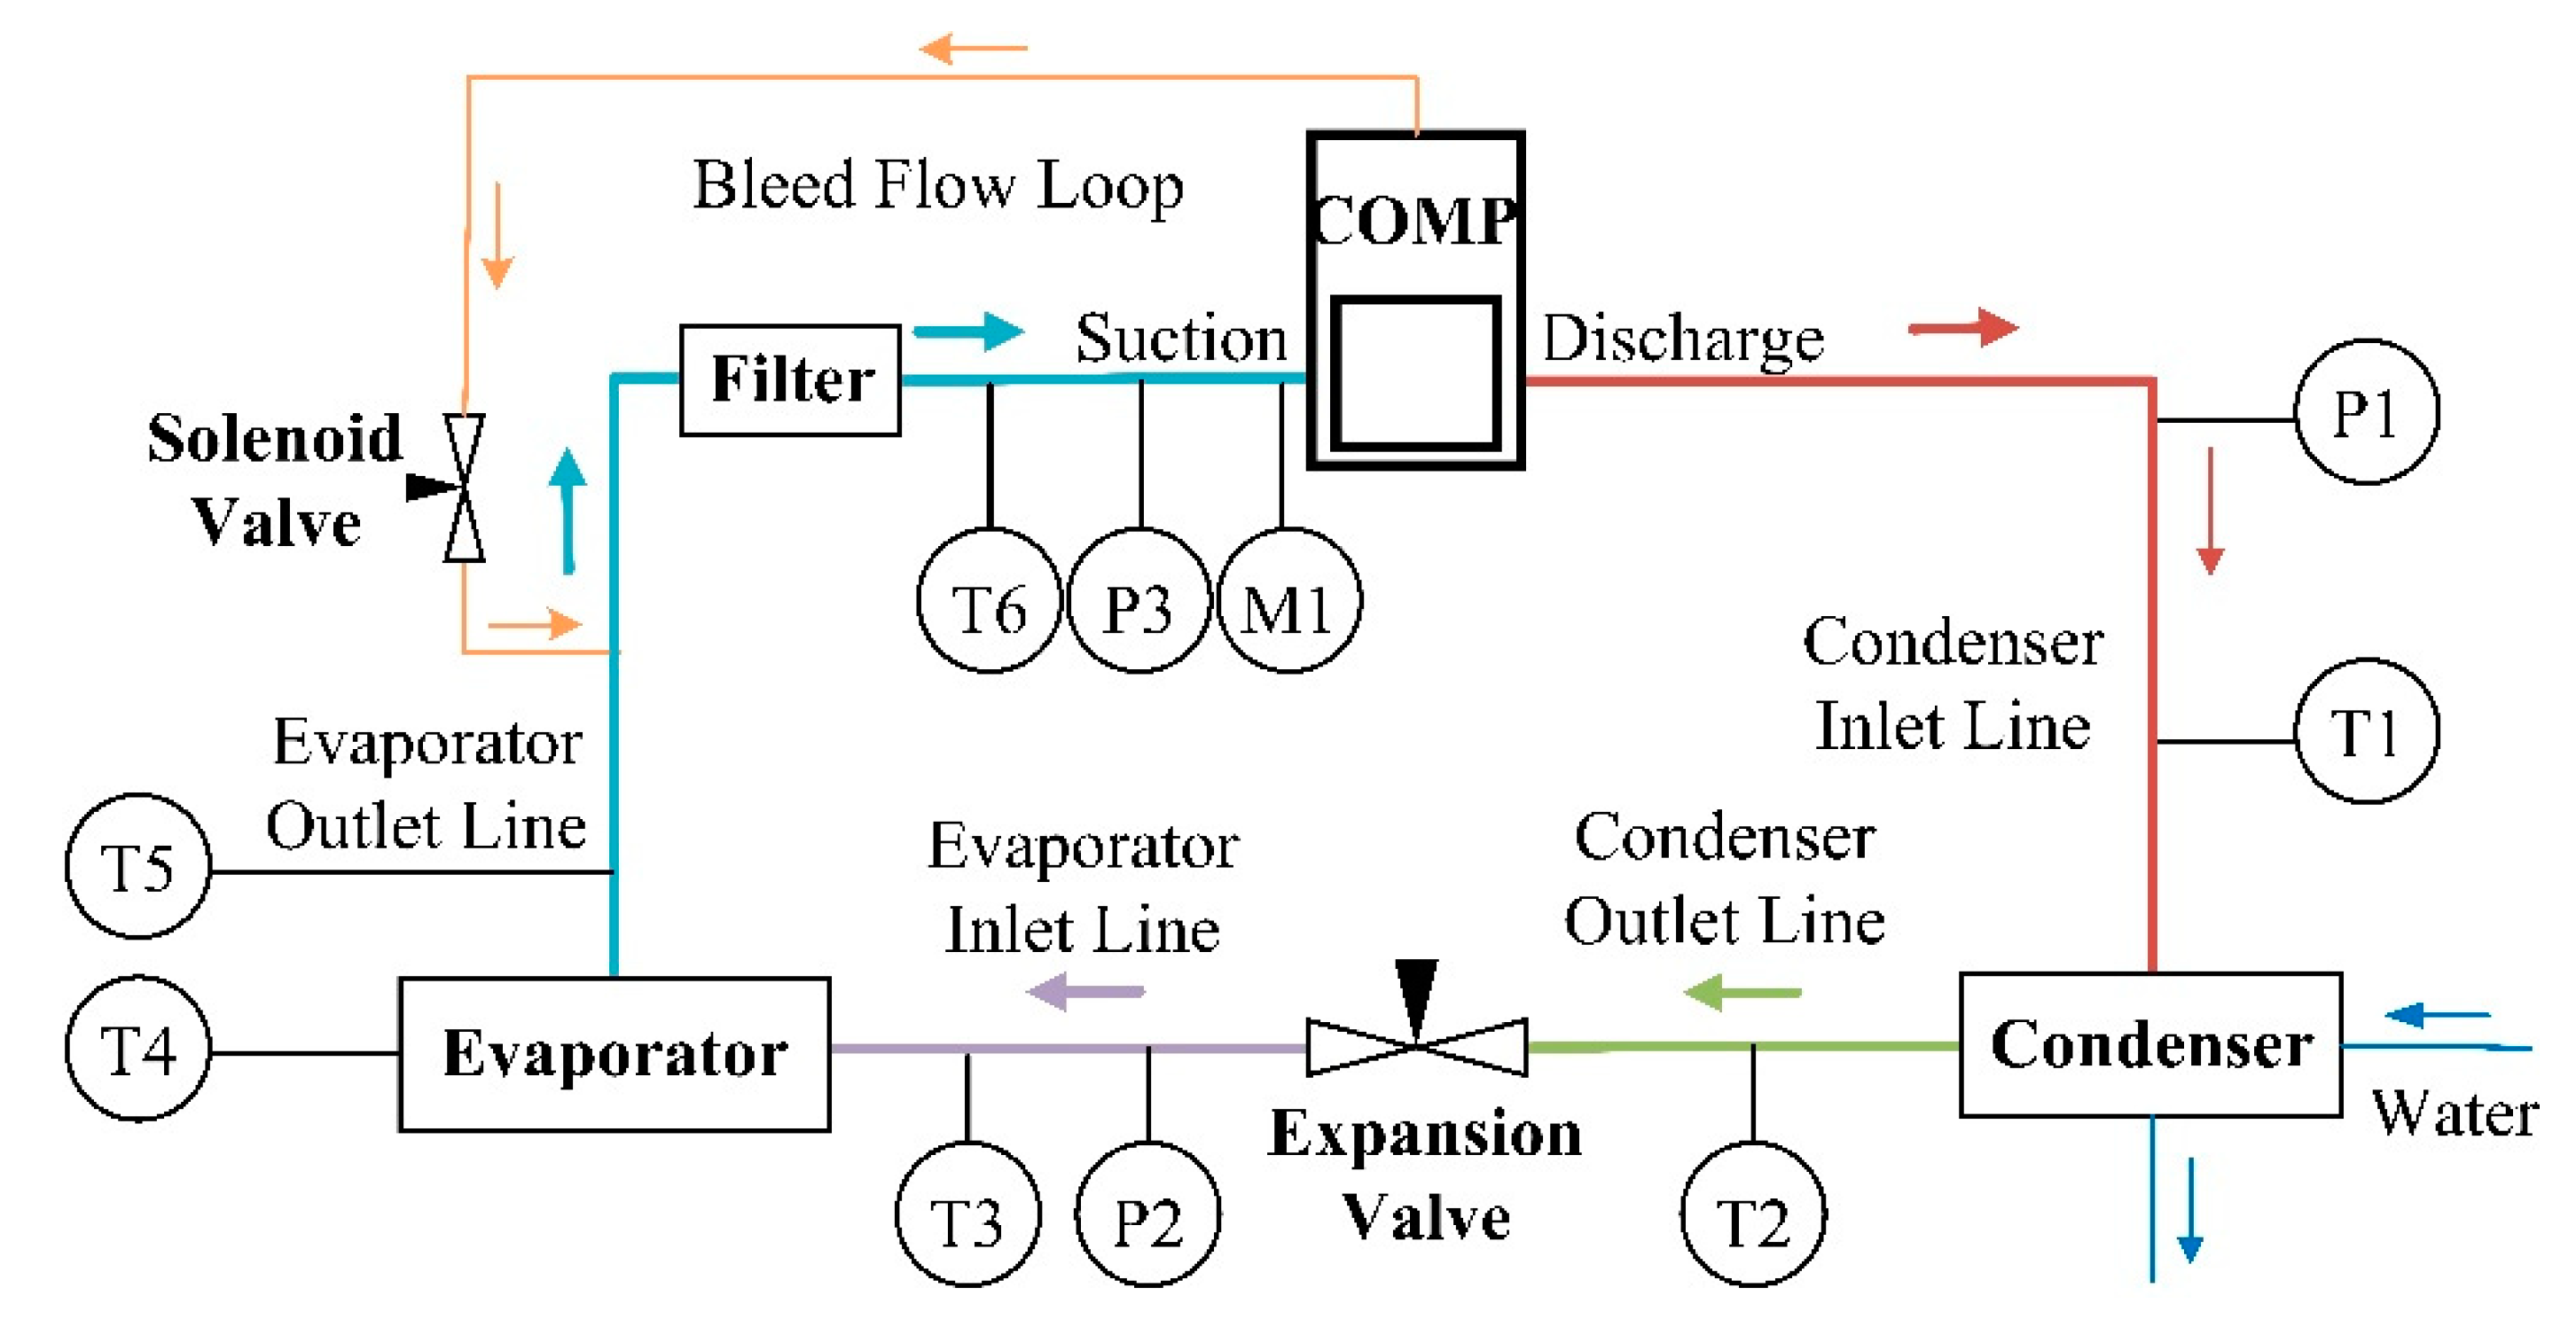
Figure 1 shows the schematic of the prototype oil-free refrigeration unit and its instrumentation. The prototype oil-free refrigeration unit mainly composes of an oil-free linear compressor with various strokes; a water-cooled coaxial condenser with a length of 2.325 m, an inner diameter 0.0127 m, and an outer diameter 0.016 m; an annular evaporator with an electric heater, a length of 1.280 m, an inner diameter 0.0079 m, an outer diameter 0.0127 m, and a filter for separating the liquid refrigerant.
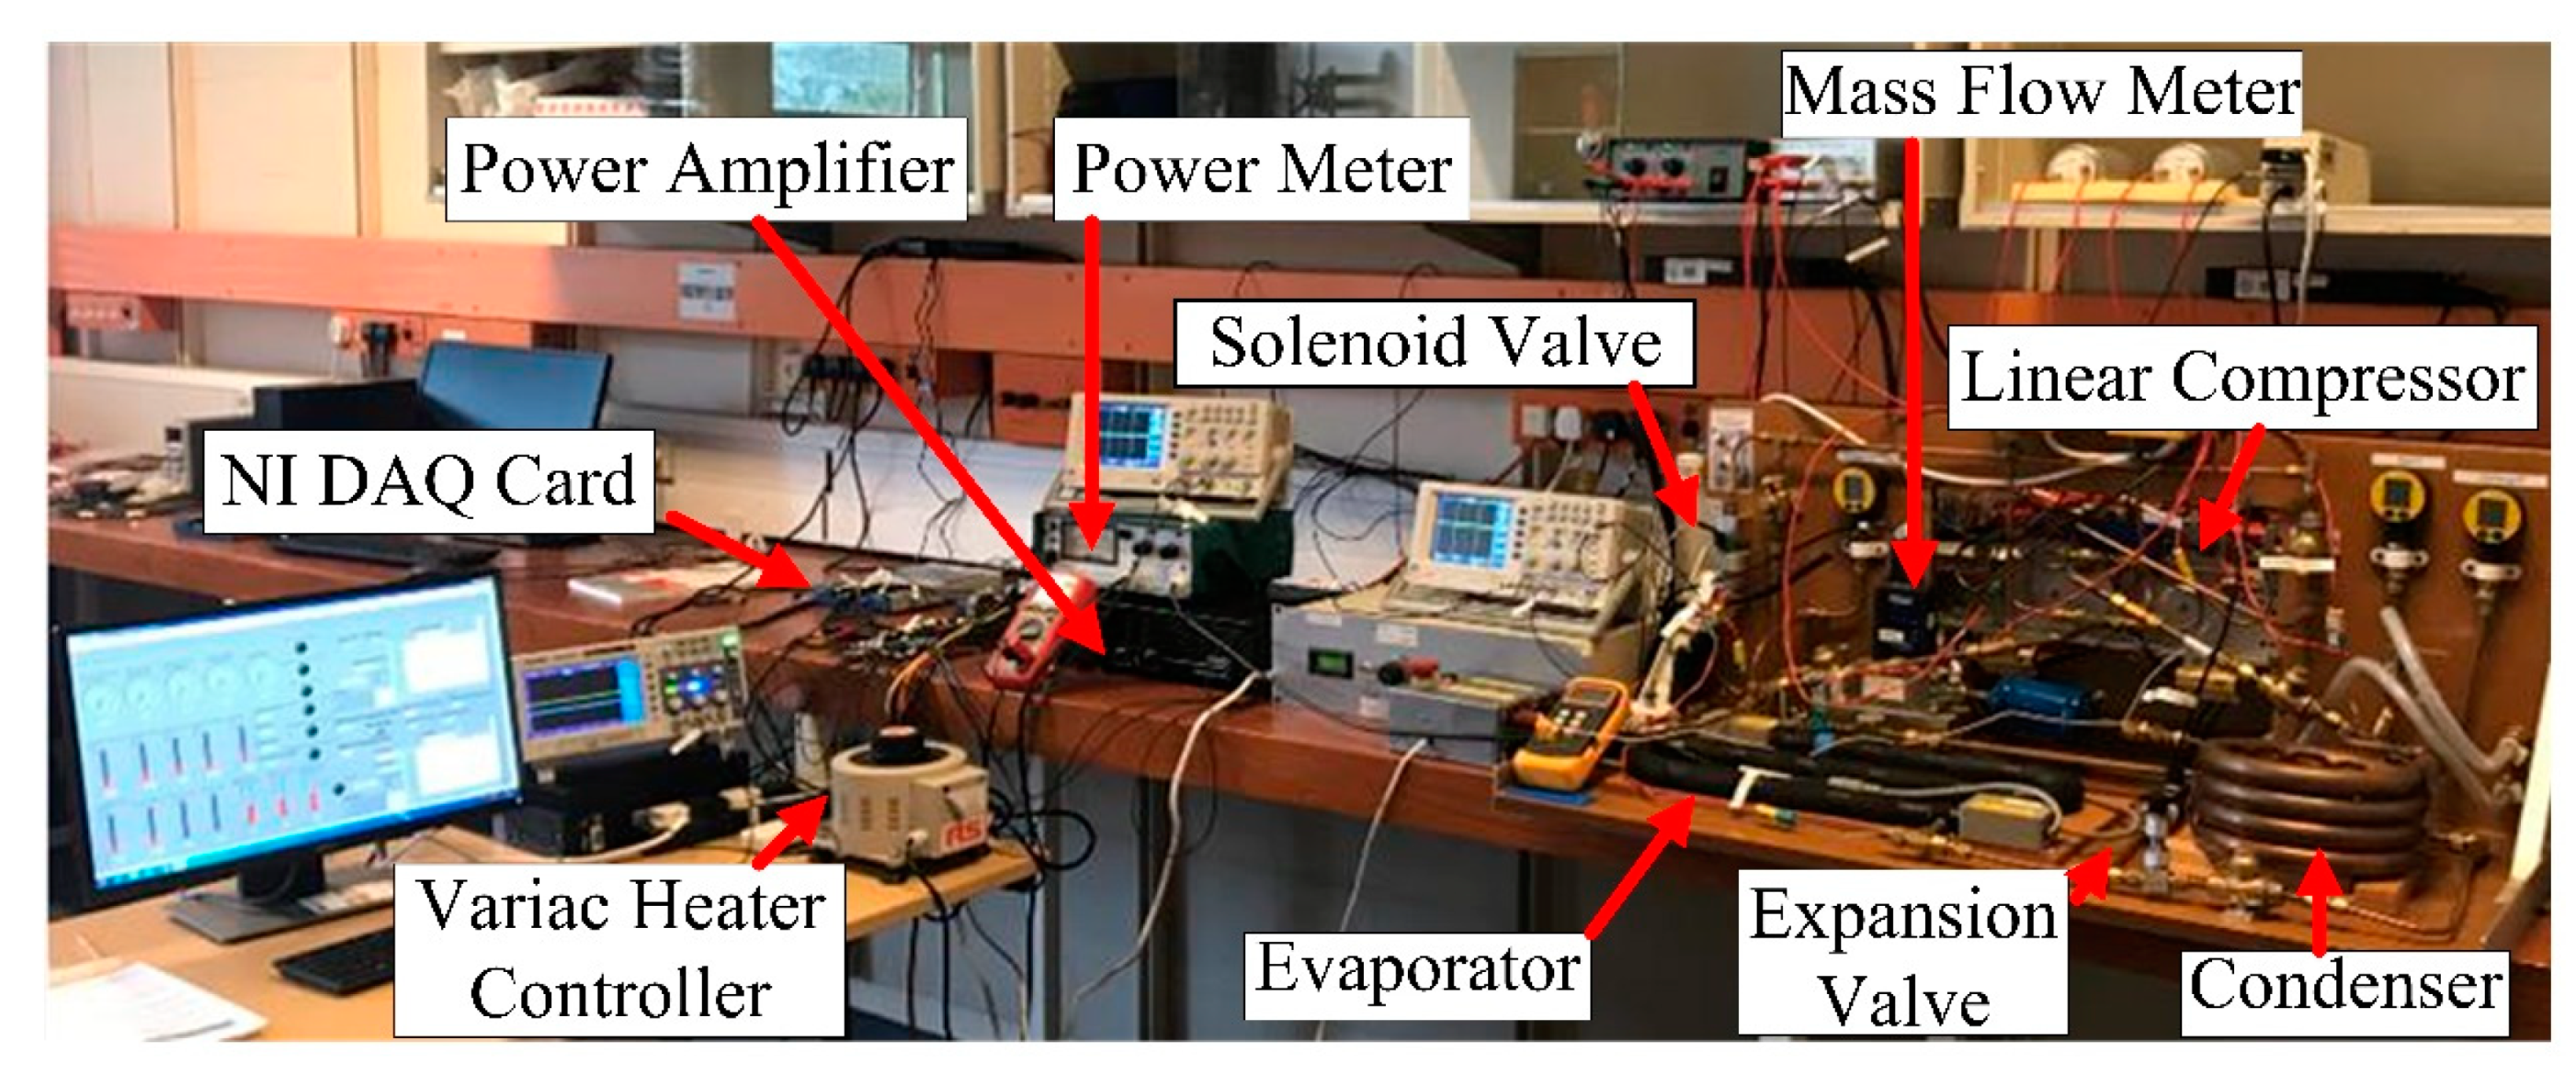
Figure 2 shows the complete experimental apparatus for the oil-free VCR system. The hot compressed refrigerant vapour condenses in the condenser before flowing to the evaporator. Between the evaporator and condenser, an expansion valve is added to control the pressure ratio. The liquid refrigerant absorbs the heat from the electric heater then returns to the compressor. In order to minimize the piston draft, a bleed flow loop and a solenoid valve were added to the system. The evaporator was covered with thermal insulation material to eliminate the heat transfer between the environment and the evaporator. Six K-type thermocouples were used to measure the temperatures at discharge, condenser outlet, evaporator inlet, evaporator wall, evaporator outlet, and suction. Three DRUCK PMP 1400 pressure transducers monitored pressures at discharge, evaporator inlet, and suction. A data acquisition card of NI USB-6341 was used to collect parameters of temperatures, pressures, and mass flow rate, monitored by LabVIEW in a computer.
Experiments of the prototype oil-free refrigeration unit were conducted using R134a as working fluid with a large range of operating conditions, as shown in
Table 1. The condenser outlet temperature was controlled at 40 °C during the experiments. Normally, a set of experimental data was read every 15 min to allow sufficient time for the system to reach thermal equilibrium. The absolute uncertainty of pressure and temperature measurements is 0.015 bar and 0.5 °C. The relative uncertainty of mass flow is 1%.
3. Modelling of Refrigerant Distribution
The entire refrigerant circuit is divided into the evaporator, condenser, vapour lines, liquid line, bleed flow loop, and filter to investigate the refrigerant distribution in the oil-free refrigeration unit. Vapour lines consist of a condenser inlet line and evaporator outlet line. The liquid line is a condenser outlet line. The evaporator inlet line was considered as a two-phase line without a change of void fraction. The physical parameters of the oil-free refrigeration unit lines are listed in
Table 2. The condenser inlet line and the evaporator outlet line consists of two sections of pipes with different diameters.
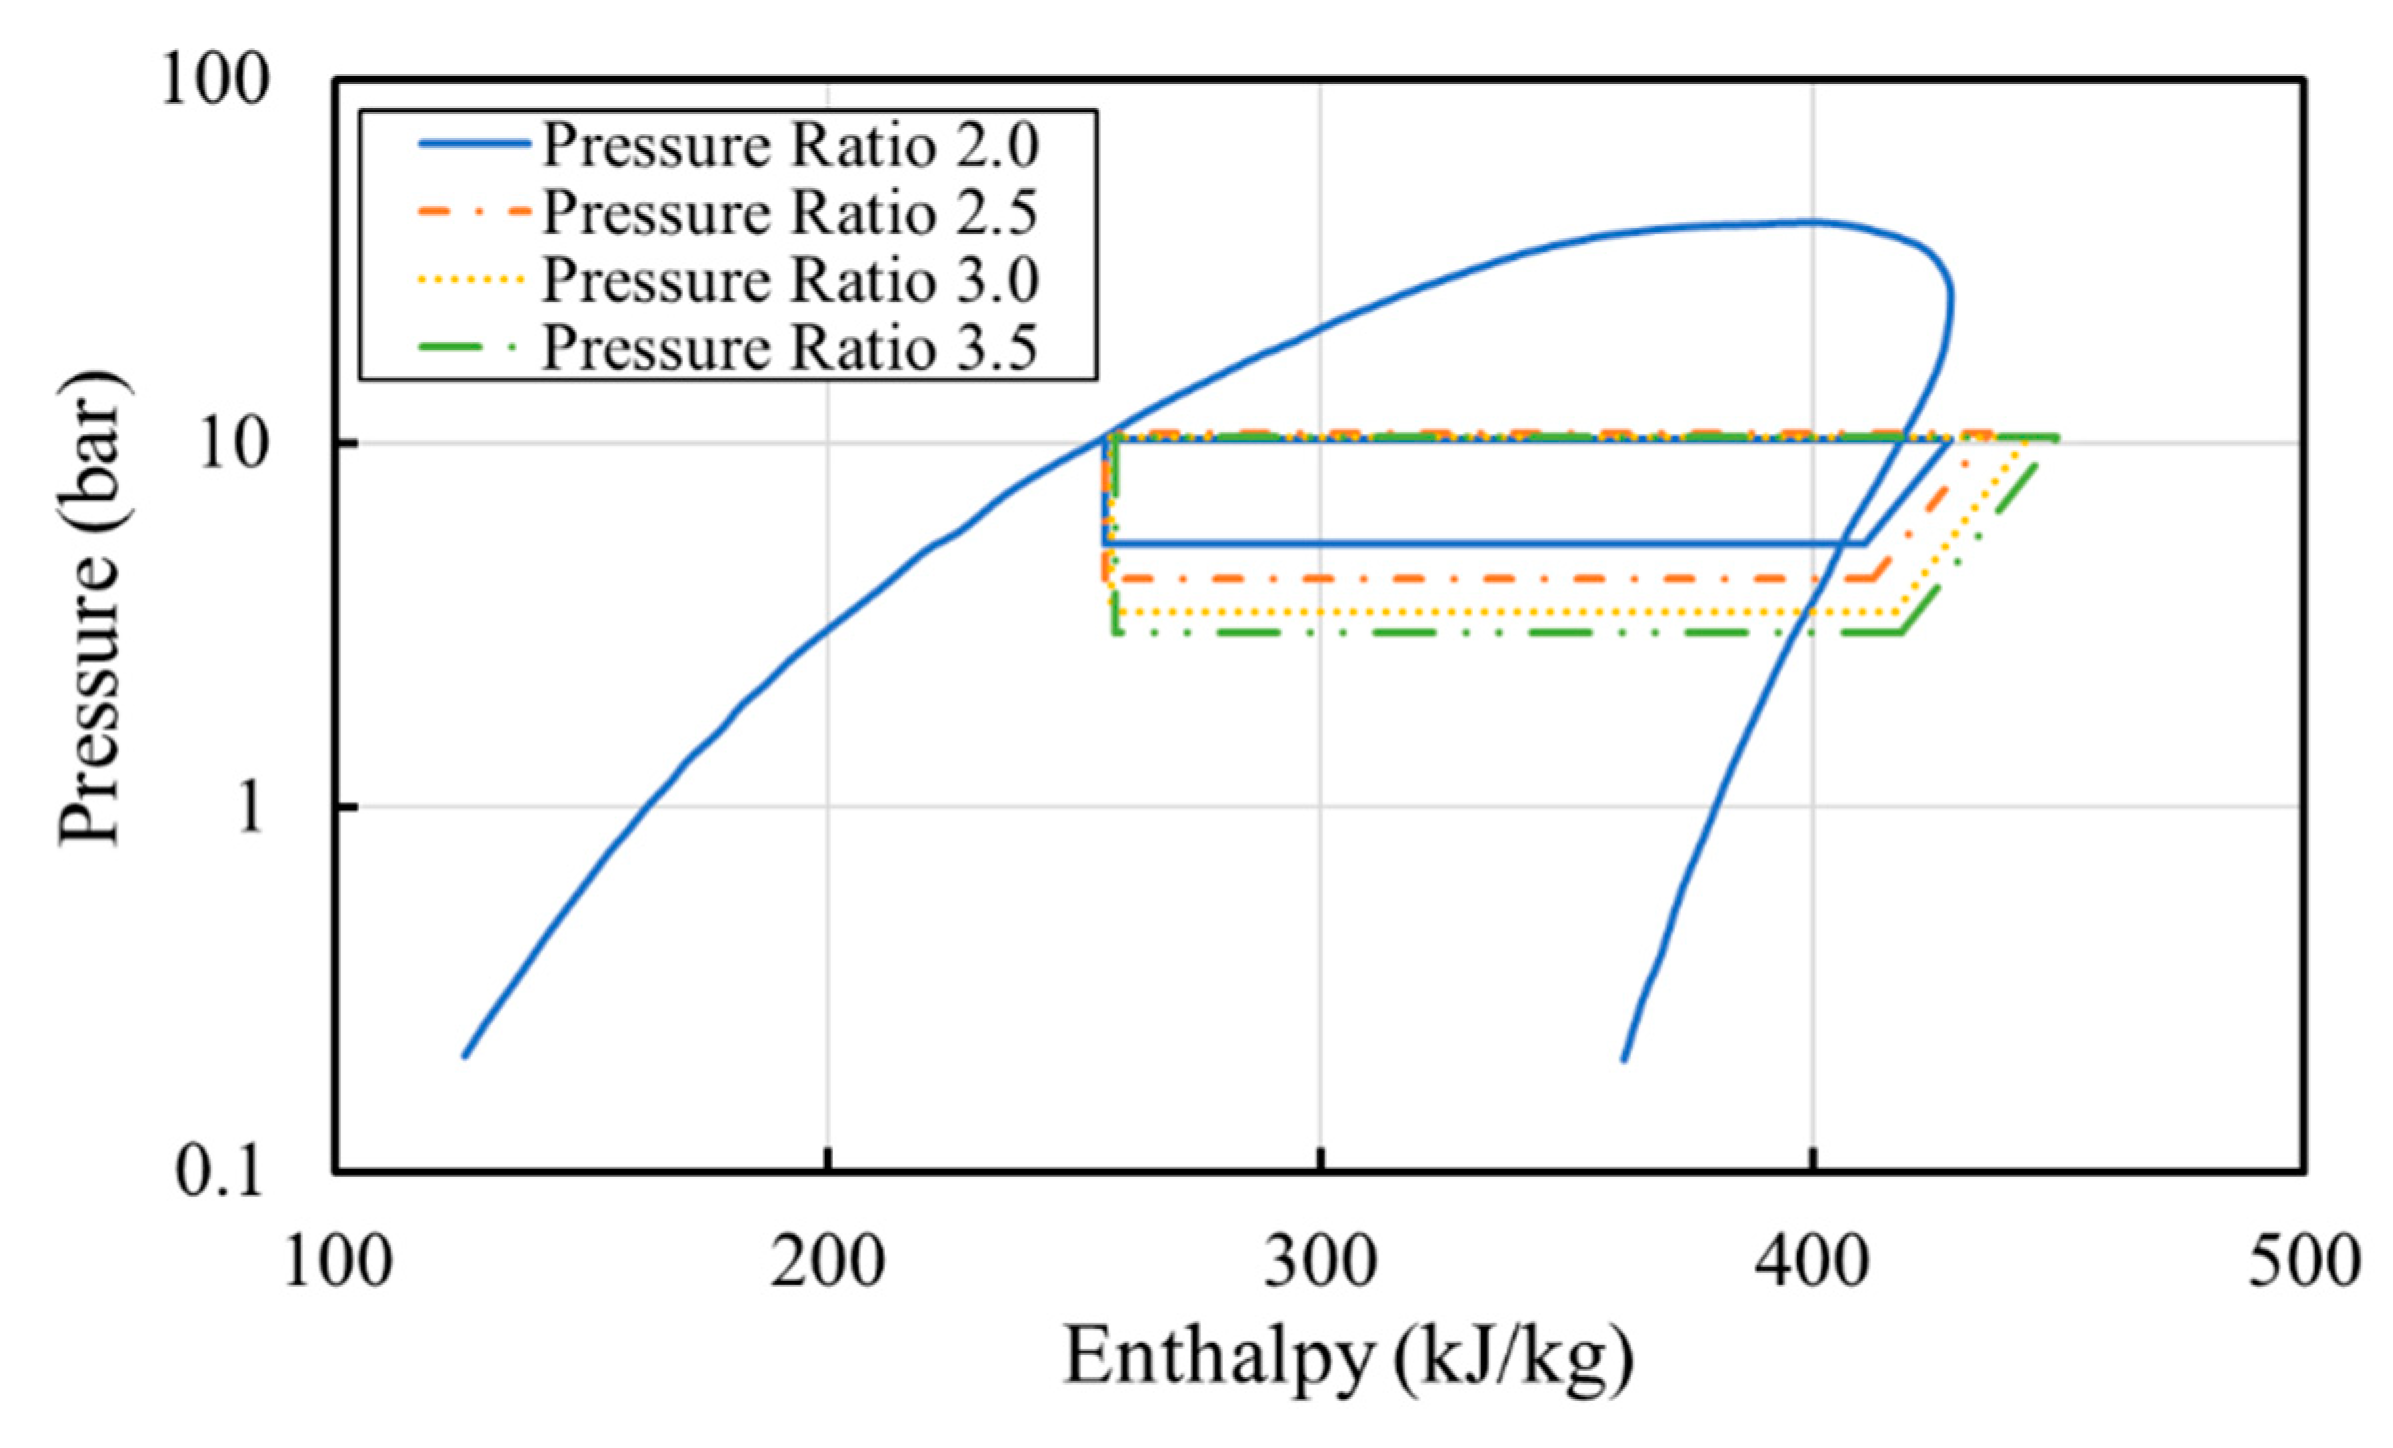
Figure 3 shows the pressure–enthalpy (
P-h) diagram of R134a with various pressure ratios from 2.0 to 3.5, a compressor stroke of 0.012 m, at a refrigerant charge of 0.28 kg. The enthalpy at the condenser inlet, condenser outlet, and evaporator outlet was calculated based on measured temperatures and pressures according to the National Institute of Standards and Technology (NIST) thermal properties database [
14]. The enthalpy at the evaporator inlet was assumed to be equal to the condenser outlet. The compression process was considered as an adiabatic process, and the entropy at the compressor inlet is the same as the evaporator outlet. As can be seen from
Figure 3, due to the decrease in the saturation temperature, the superheat increases with the pressure ratio.
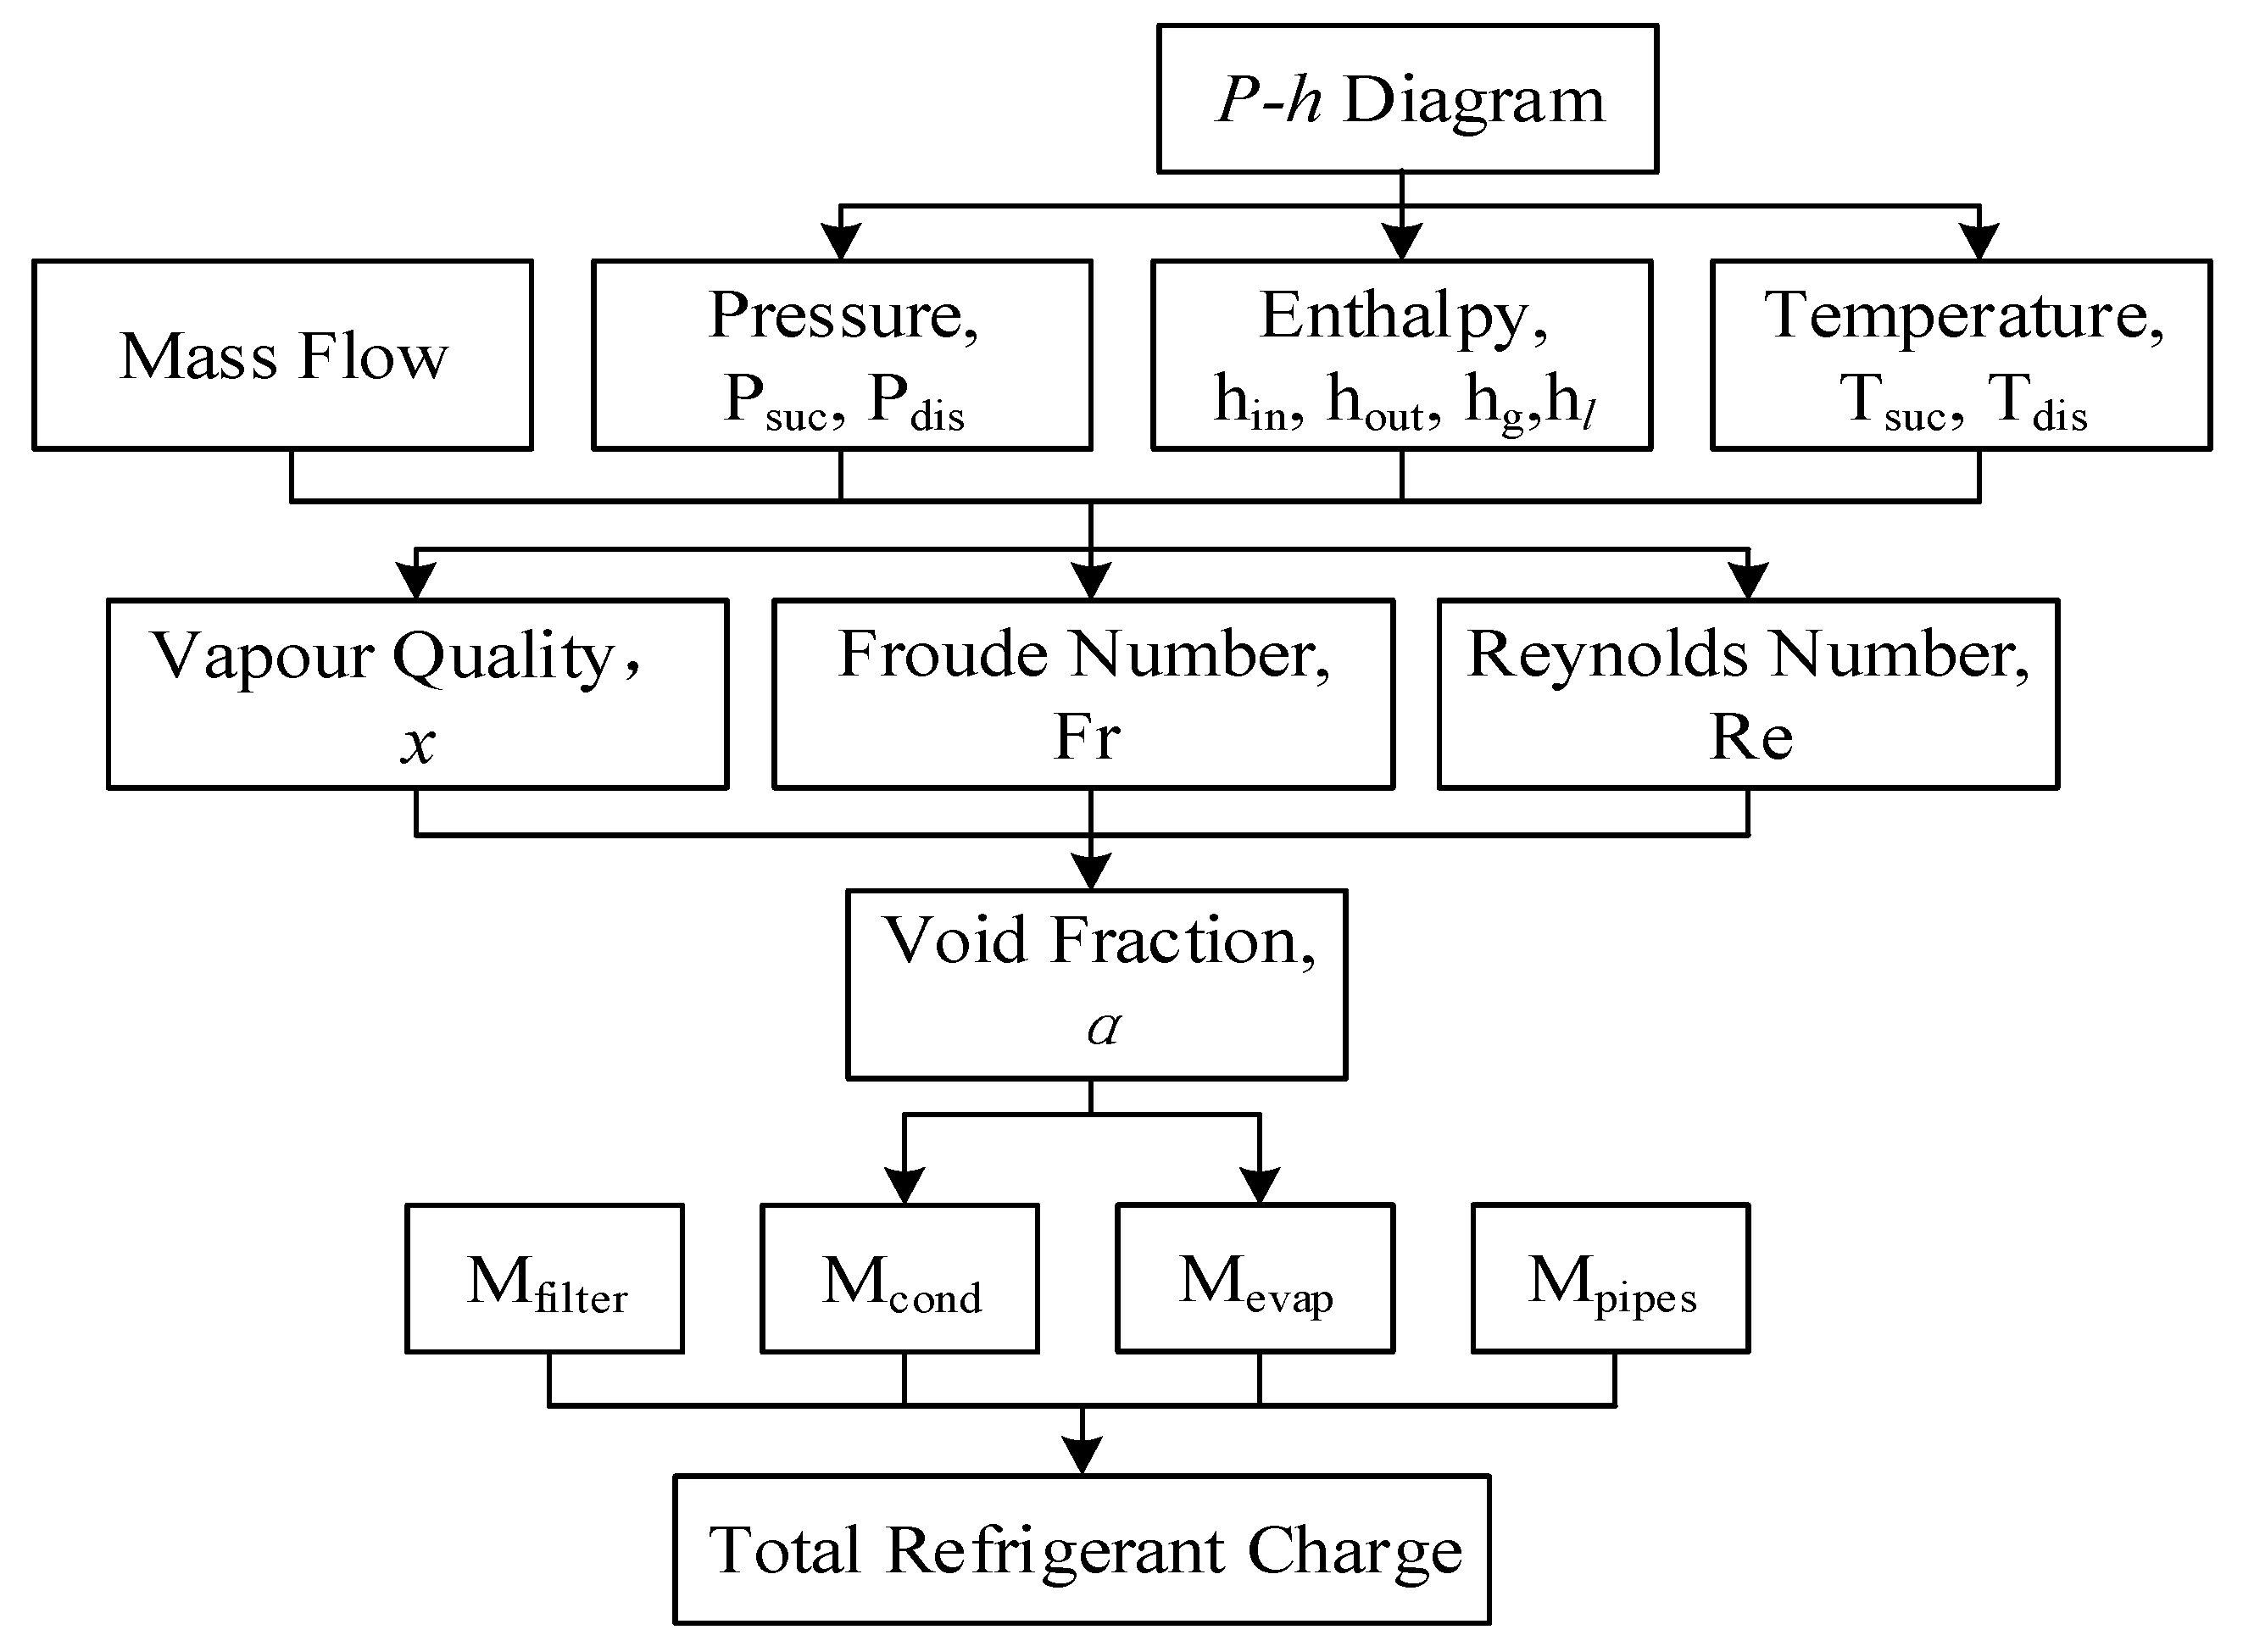
Figure 4 shows the modelling process of refrigerant distribution in the prototype oil-free refrigeration unit. Based on experimental results and
Figure 3, the pressure, temperature, and enthalpy of the refrigerant at the evaporator and condenser inlet and outlet, mass flow rate of the prototype oil-free refrigeration unit, vapour phase refrigerant quality, and liquid phase refrigerant quality can be determined. Then vapour quality, Froude number, Reynolds number, and void fraction can be calculated. As the compressor has much less volume, the refrigerant inventory was ignored in this study [
12]. Due to oil-free operation, the refrigerant dissolved in the lubrication does not need to be considered. The vapour quality was assumed to change linearly in the heat exchangers. Based on the parameters mentioned above, the refrigerant accumulated in the evaporator and condenser can be predicted, and the total refrigerant mass is the sum of the refrigerant in filter mass, pipes mass, evaporator mass, and condenser mass.
3.1. Evaporator
The estimation of refrigerant quality in heat exchangers is the most important part of the refrigerant distribution analysis due to large volume and multiple refrigerant phases. According to the
P-h diagram, the vapour quality at the evaporator inlet can be calculated as
where
is the evaporator inlet enthalpy,
is the enthalpy of the saturated vapour in the evaporator, and
is the enthalpy of the saturated liquid in the evaporator.
As the evaporator outlet only has vapour phase flow, the vapour quality at the evaporator outlet can be considered as 1.0.
The two-phase length in the evaporator can be calculated as
where
is the total length of the evaporator (1.28 m),
is the evaporator outlet enthalpy.
The selection of the void fraction model can significantly affect the heat transfer coefficient. The Hughmark model concerned both the liquid fraction and vapour fraction predictions in the pipes and developed a gas–liquid system near atmospheric pressure. It is found that the model predicts horizontal flow quite well [
15]. According to the Hughmark model [
16], the void fraction
can be expressed as
in which
where
is the vapour refrigerant density and
is the liquid refrigerant density.
The two-phase Reynolds number
can be expressed as
where
is the hydraulic diameter of heat exchanger,
is the liquid viscosity, and
is the vapour viscosity.
G is the mass flux, which can be calculated as
where A is the heat exchanger cross-section area.
is the Froude number, which can be expressed as
where
is the gravitational acceleration.
Combining the above equations, the refrigerant accumulated in the two-phase heat exchanger can be calculated as
where
is the two-phase cross-sectional area, and
is the two-phase length.
The refrigerant in the evaporator consists of the two-phase and vapour-phase region. The length of vapour-phase region, thus, can be calculated as
The refrigerant accumulated as the vapour-phase flow in the evaporator
can be calculated as
where
is the evaporator cross-sectional area.
The refrigerant accumulated in the evaporator, thus, is expressed as
3.2. Condenser
The refrigerant at the condenser outlet was considered as a pure liquid refrigerant. Thus, the vapour quality at the condenser outlet can be considered as zero. The condenser consists of three regions: vapour-phase, two-phase, and liquid-phase. The length of three regions in the condenser can be expressed as
where
is the total length of the condenser (2325 mm),
is the saturated vapour enthalpy in the condenser, and
is the saturated liquid enthalpy in the condenser.
The refrigerant accumulated as vapour-phase flow
and liquid- phase flow
in the condenser can be calculated as
where
is the condenser cross-sectional area,
is the vapour-phase density in the condenser, and
is the liquid-phase density in the condenser.
The refrigerant accumulated as two-phase flow
in the condenser can also be calculated as
where
is the two-phase cross-sectional area in the condenser,
is the length of the two-phase region in the condenser.
Thus, the refrigerant accumulated in the condenser can be expressed as
3.3. Pipes, Filter, and Bleed Flow Loop
The refrigerant accumulated in the pipes, filter, and bleed flow loop was considered as single-phase. The refrigerant in evaporator inlet line was considered as two-phase with a constant void fraction due to short length and insulation. Thus, the refrigerant accumulated in single-phase components can be calculated as
where
is the cross-sectional area,
is the density of the single-phase, and
is the length of single-phase components.
The refrigerant accumulated in the evaporator inlet line can be expressed as
where
is the two-phase line cross-sectional area,
is the density of the refrigerant in the evaporator inlet line,
is the evaporator inlet line length.
The definition of the mean absolute percentage error (MAPE) is
where
is the experimental value,
is the calculated value, and n is the number of samples.
4. Results and Discussions
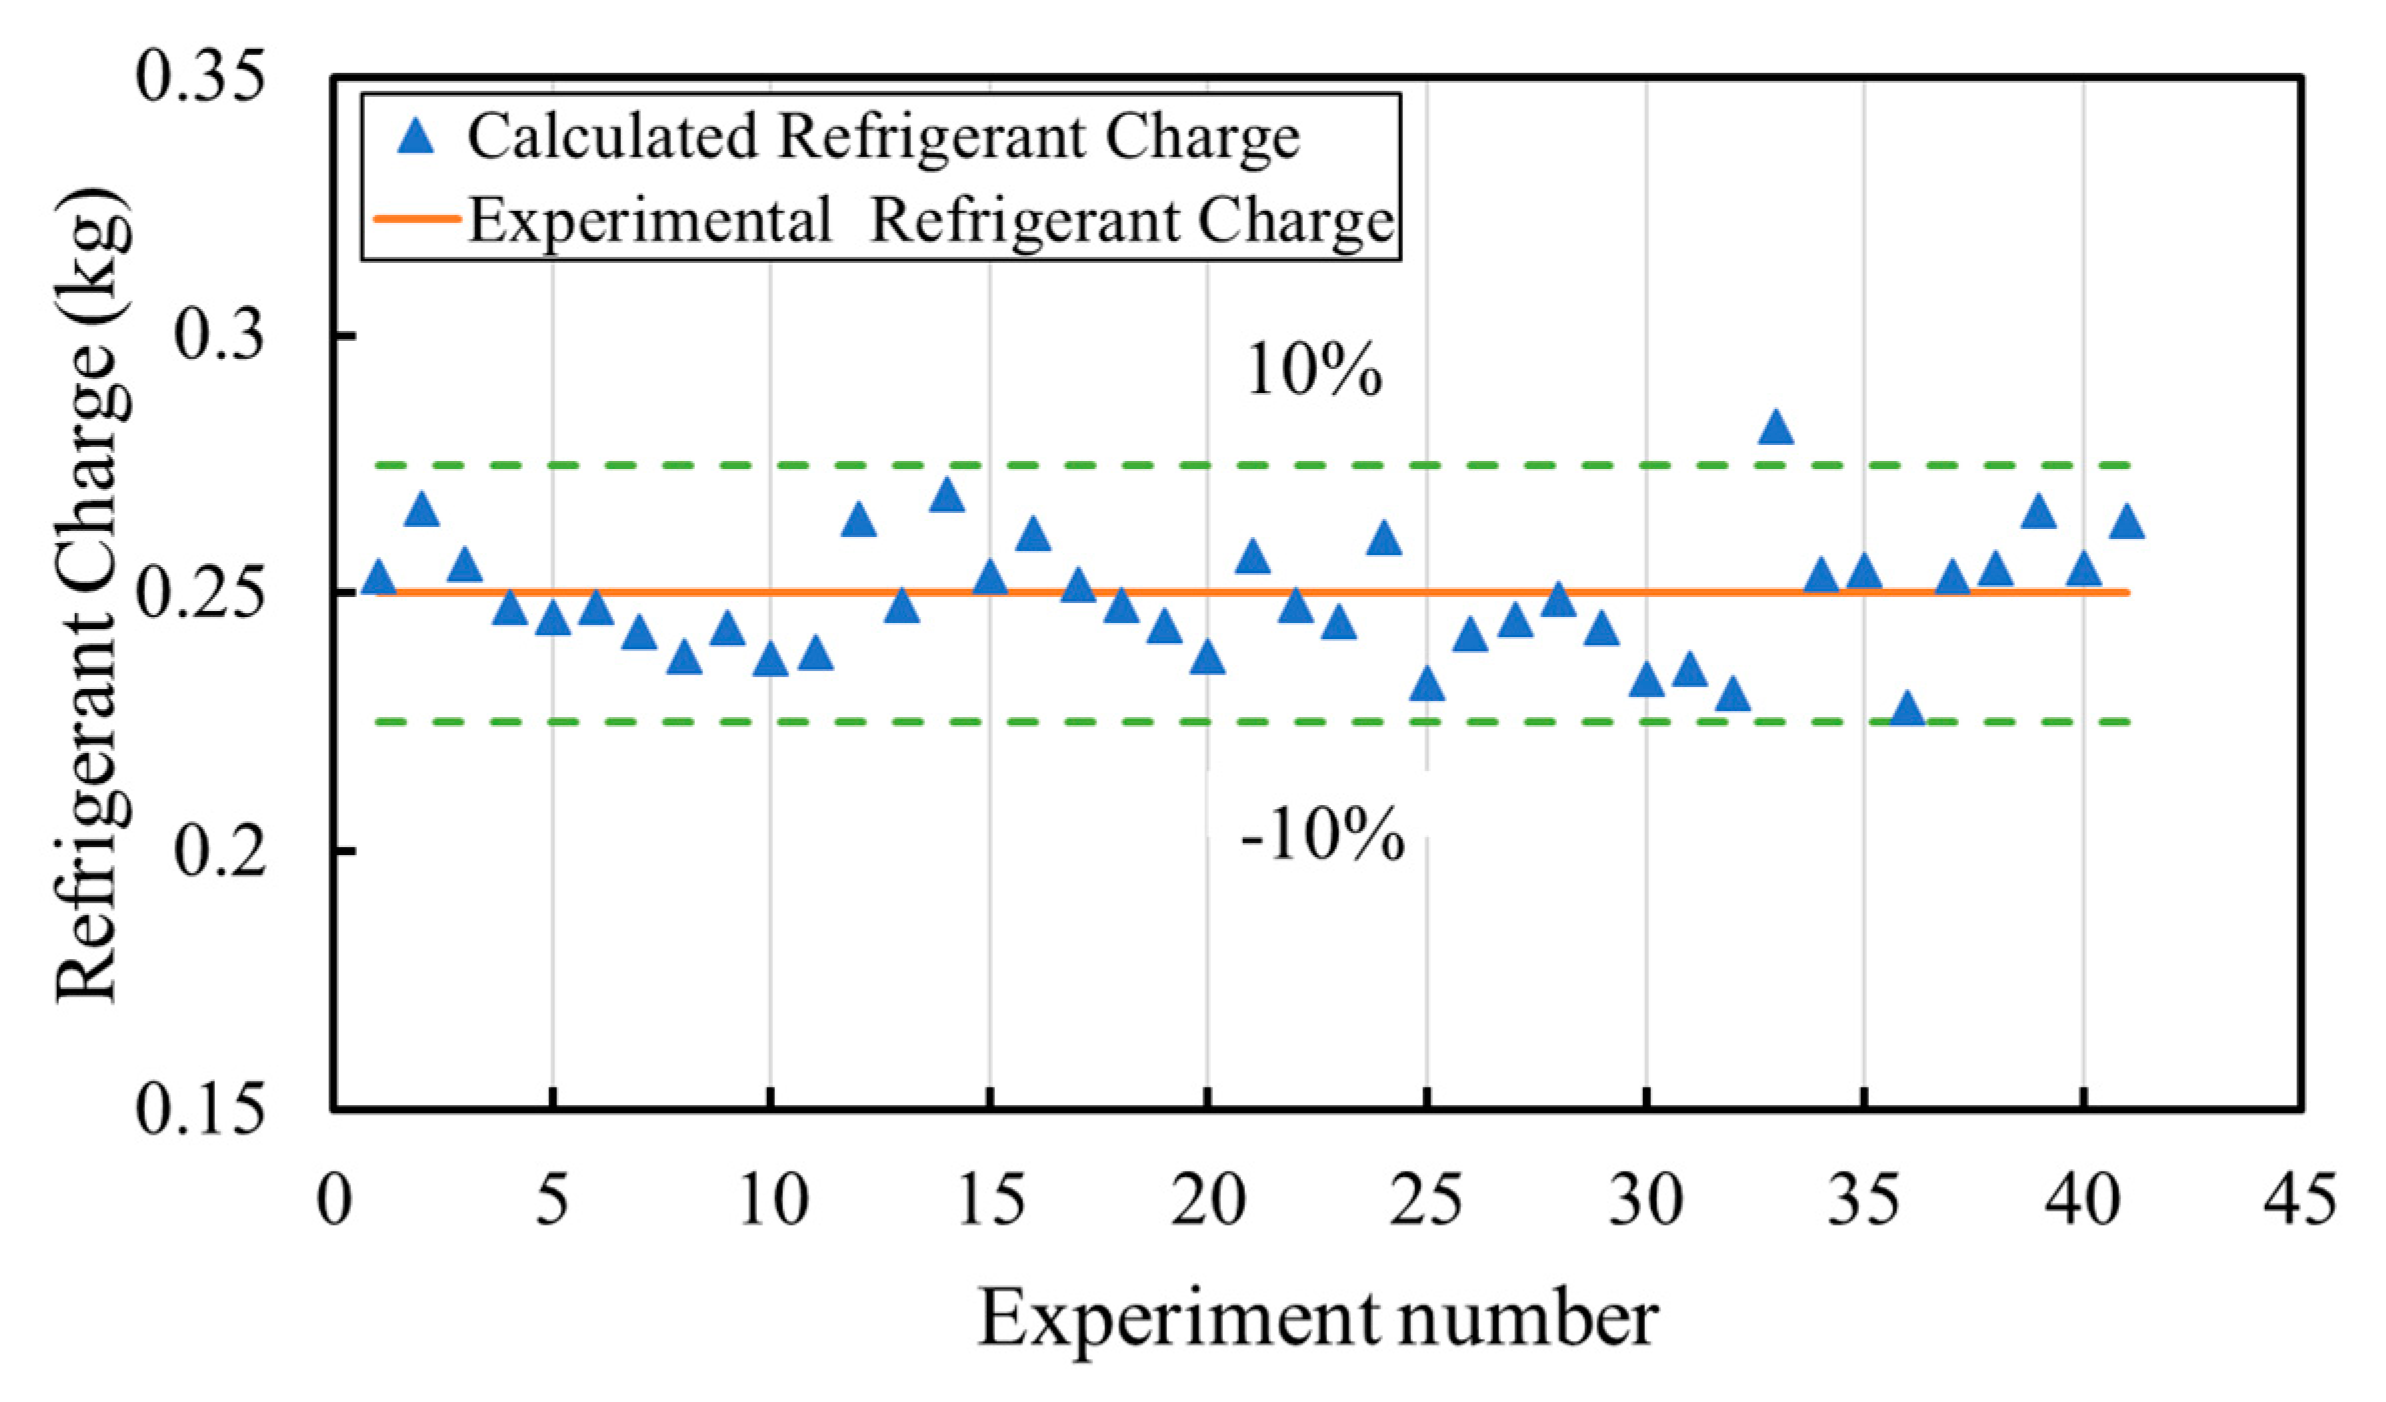
Figure 5 shows the estimated total refrigerant charges for various operating conditions against the experimental refrigerant charge (0.25 kg). As mentioned in
Section 3, the measured pressure, temperature, and mass flow rate can be used to calculate the enthalpy, void fraction, and vapour quality. The length of the phase regions and the refrigerant accumulated in each component can be estimated. The predictive total refrigerant charge has an error mostly within ±10%, and the largest error is 12.9%. The calculated refrigerant charge has a MAPE of 3.7%. Therefore, the proposed model can effectively predict the refrigerant distribution in the prototype oil-free refrigeration unit.
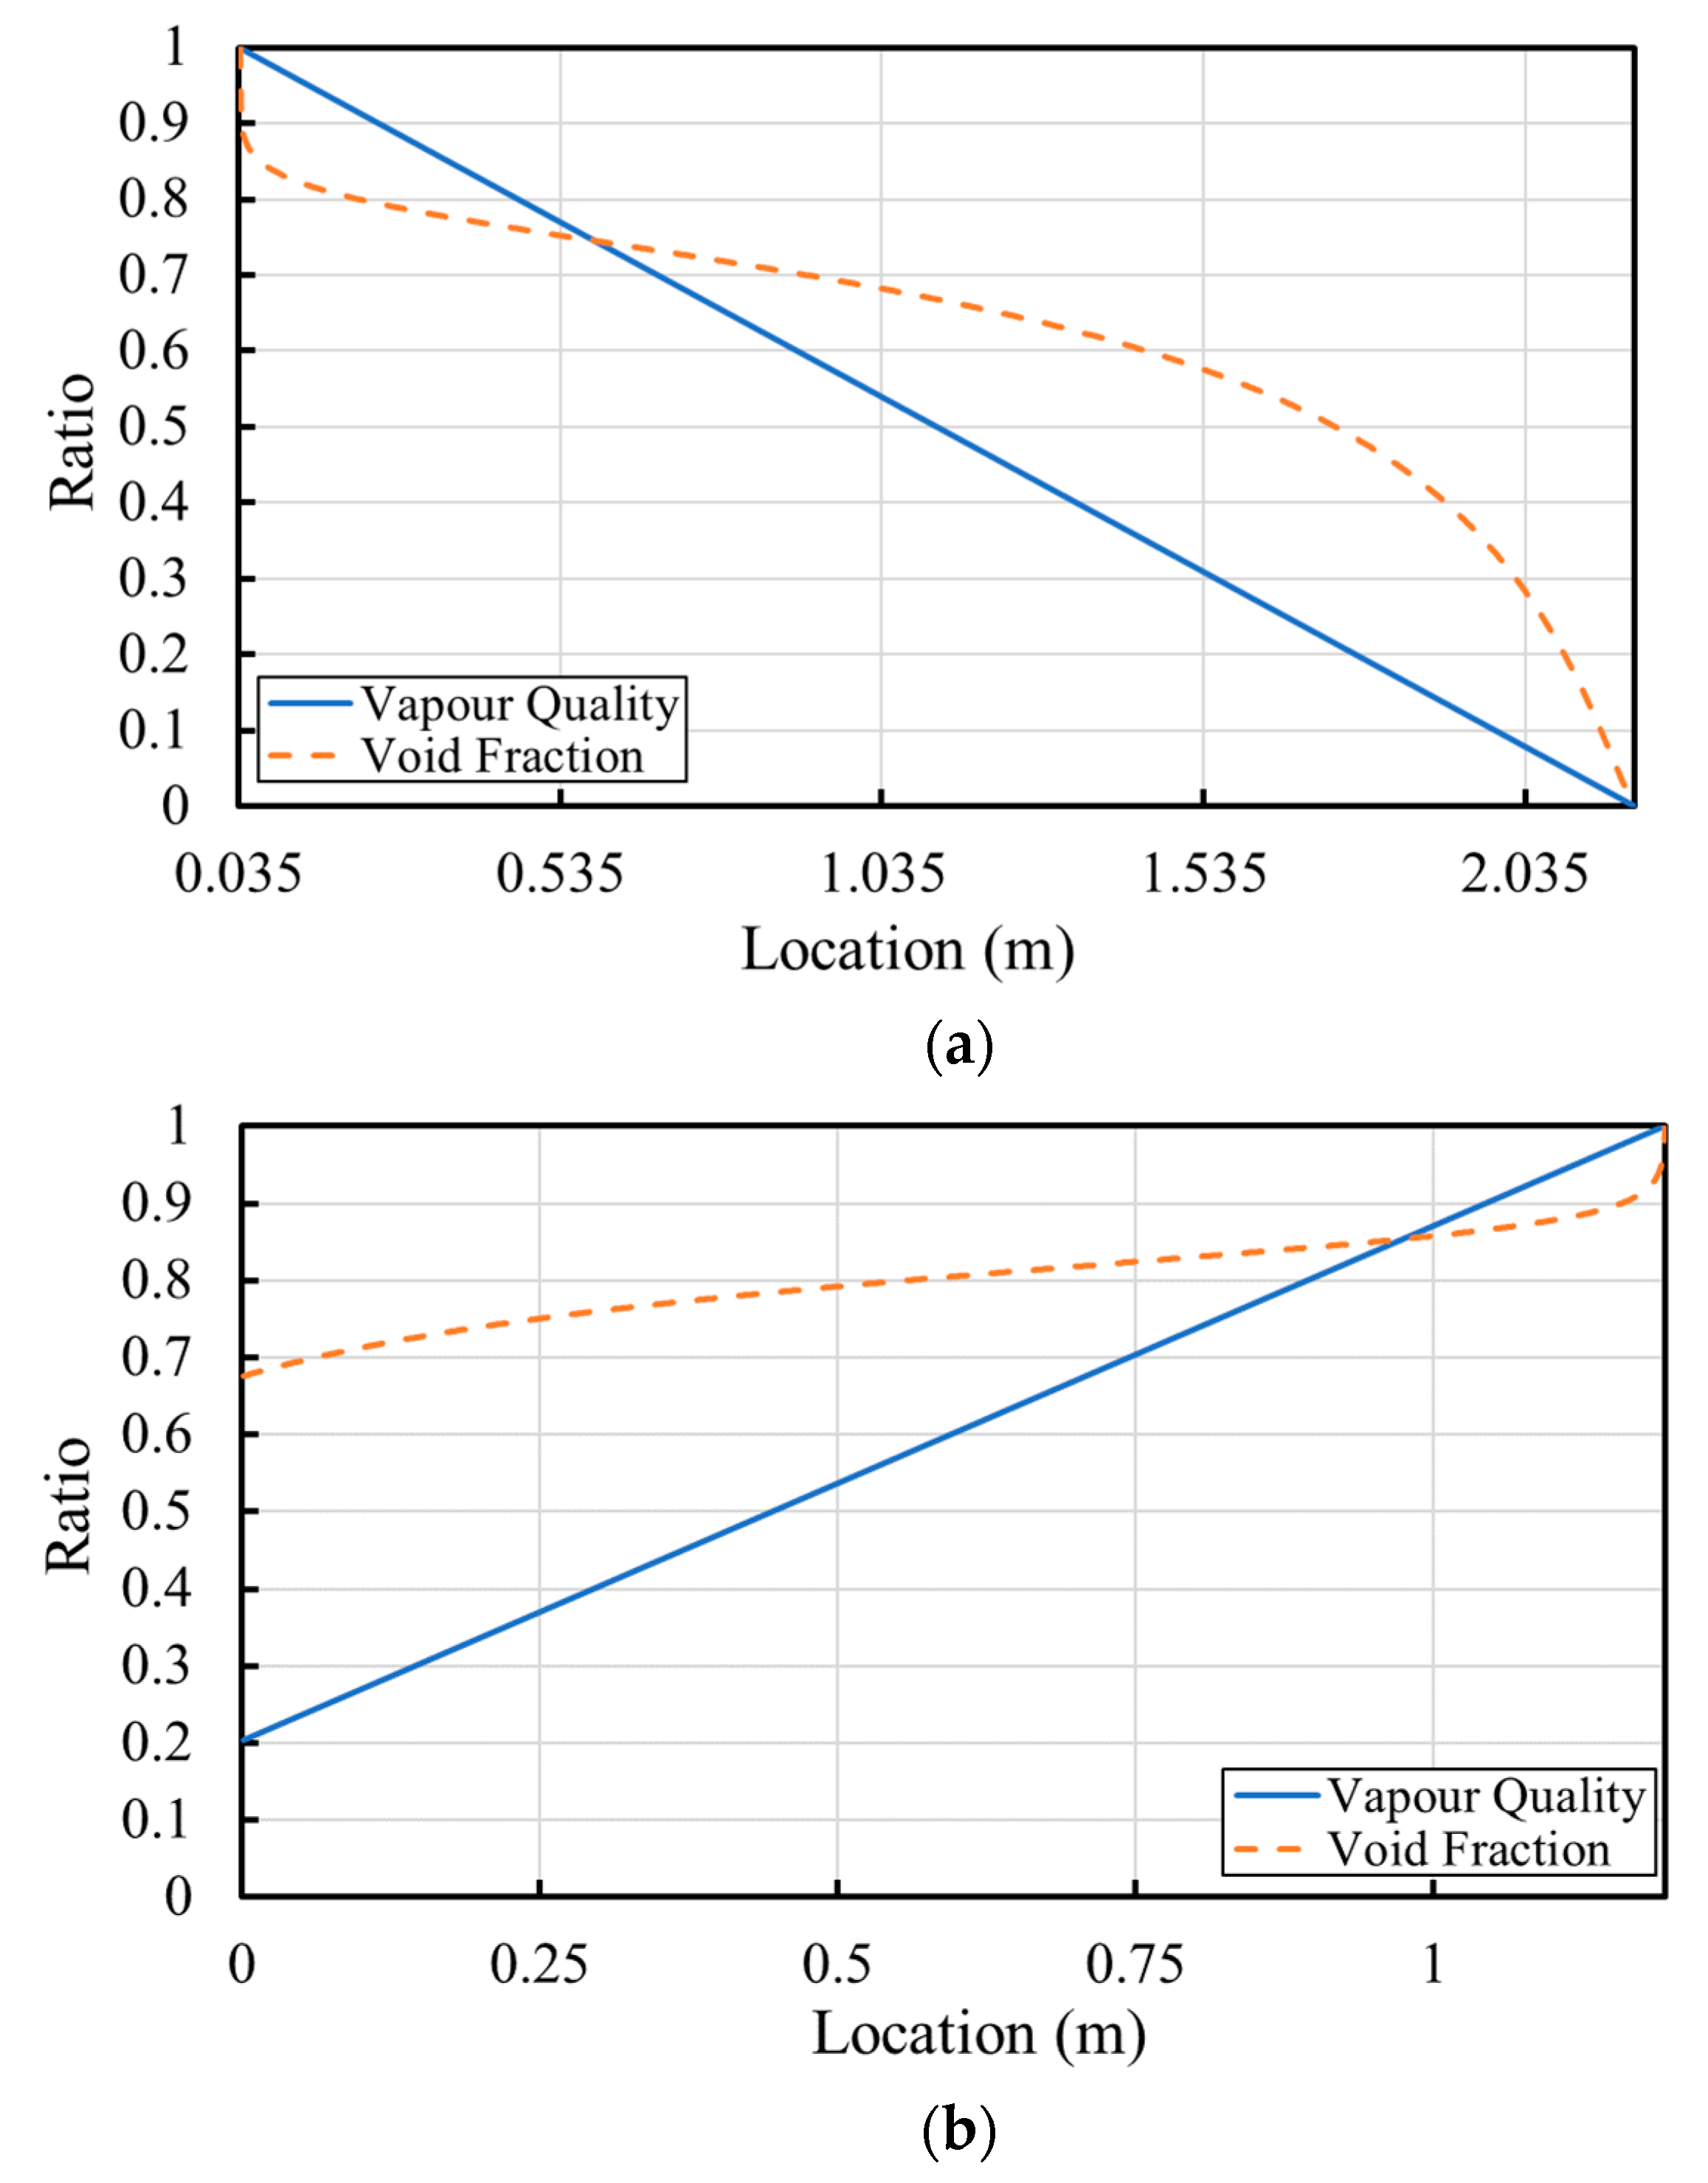
Figure 6 shows the predicted vapour quality and void fraction based on the model against the location of the two-phase region in the heat exchangers for a refrigerant charge of 0.28 kg and a compressor stroke of 0.012 m. The vapour quality in the evaporator starts at 0.2 due to the evaporation of the refrigerant in the evaporator inlet line. As the condenser inlet only has a vapour phase flow, the two-phase flow region begins at 0.035 m from the condenser inlet.
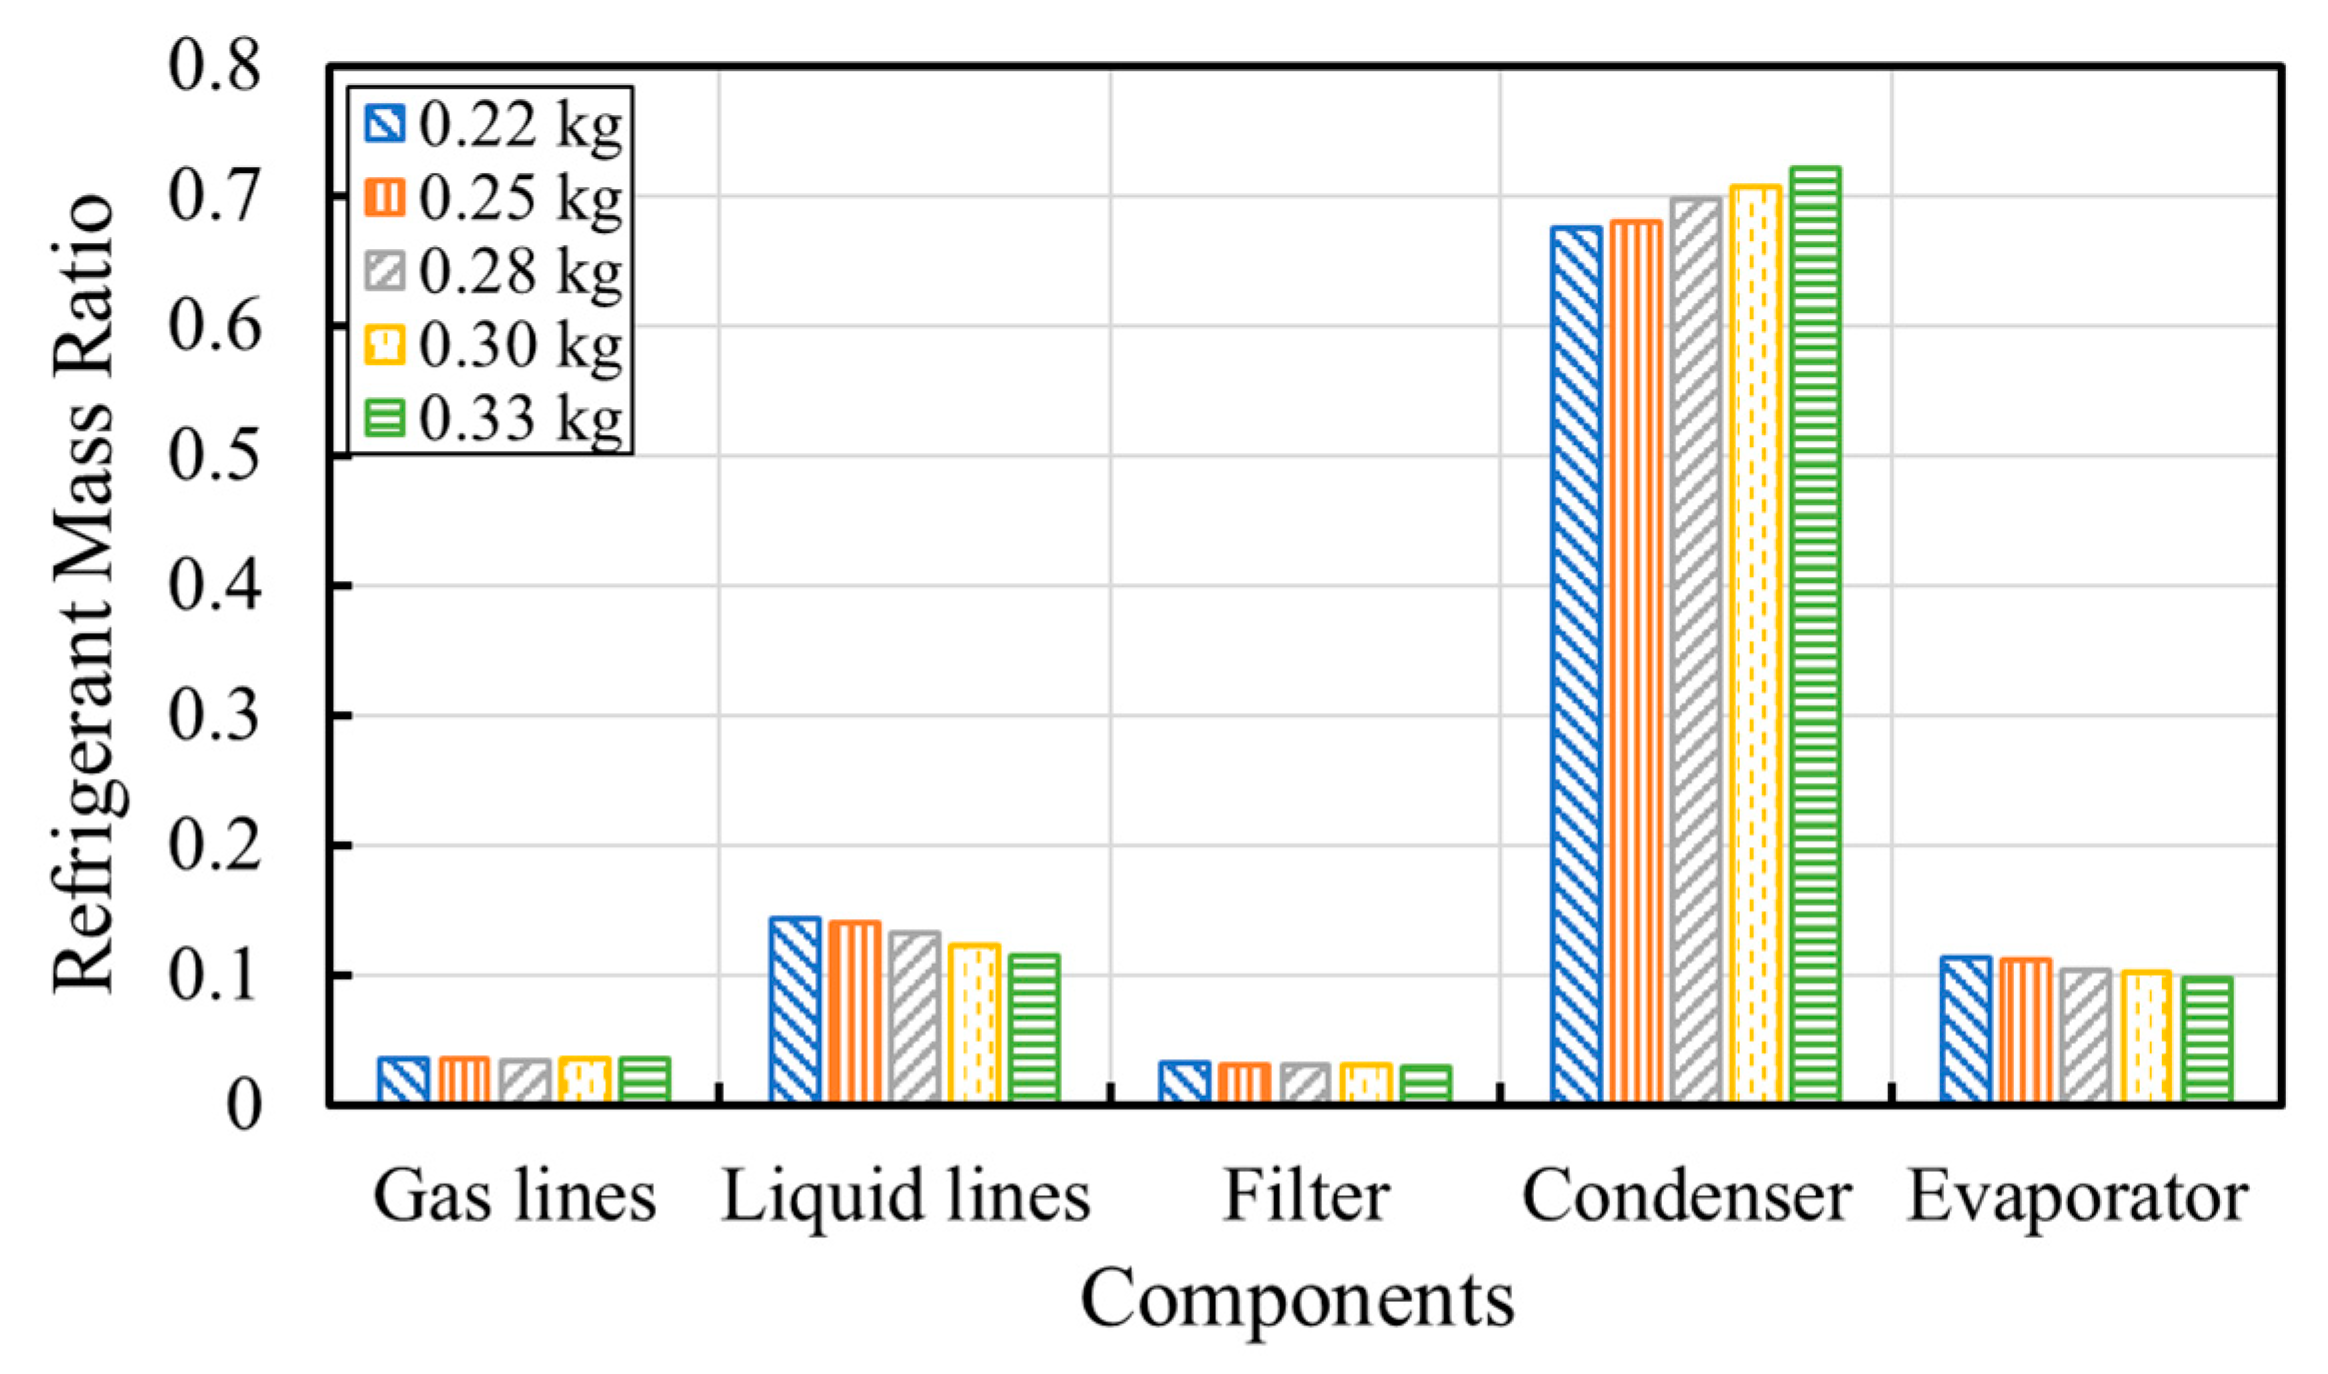
Figure 7 shows the predicted refrigerant distribution in the prototype oil-free refrigeration unit with different total refrigerant charges at a pressure ratio of 2.5. The condenser represents the maximum refrigerant mass. As the refrigerant charge increases, the accumulation of the refrigerant in the condenser increases. The refrigerant charge increased from 0.22 kg to 0.33 kg, and the amount of refrigerant in the condenser increases by 6.8%. At a refrigerant charge of 0.33 kg, the refrigerant accumulated in the condenser reaches 0.201 kg, which accounts for 72.1% of the overall refrigerant charge. Excessive refrigerant restored in the condenser leads to flooding, resulting in a deterioration of the system performance and an over-charged refrigeration unit. The refrigerant mass ratio hardly varies in other components as the total refrigerant charge changes.
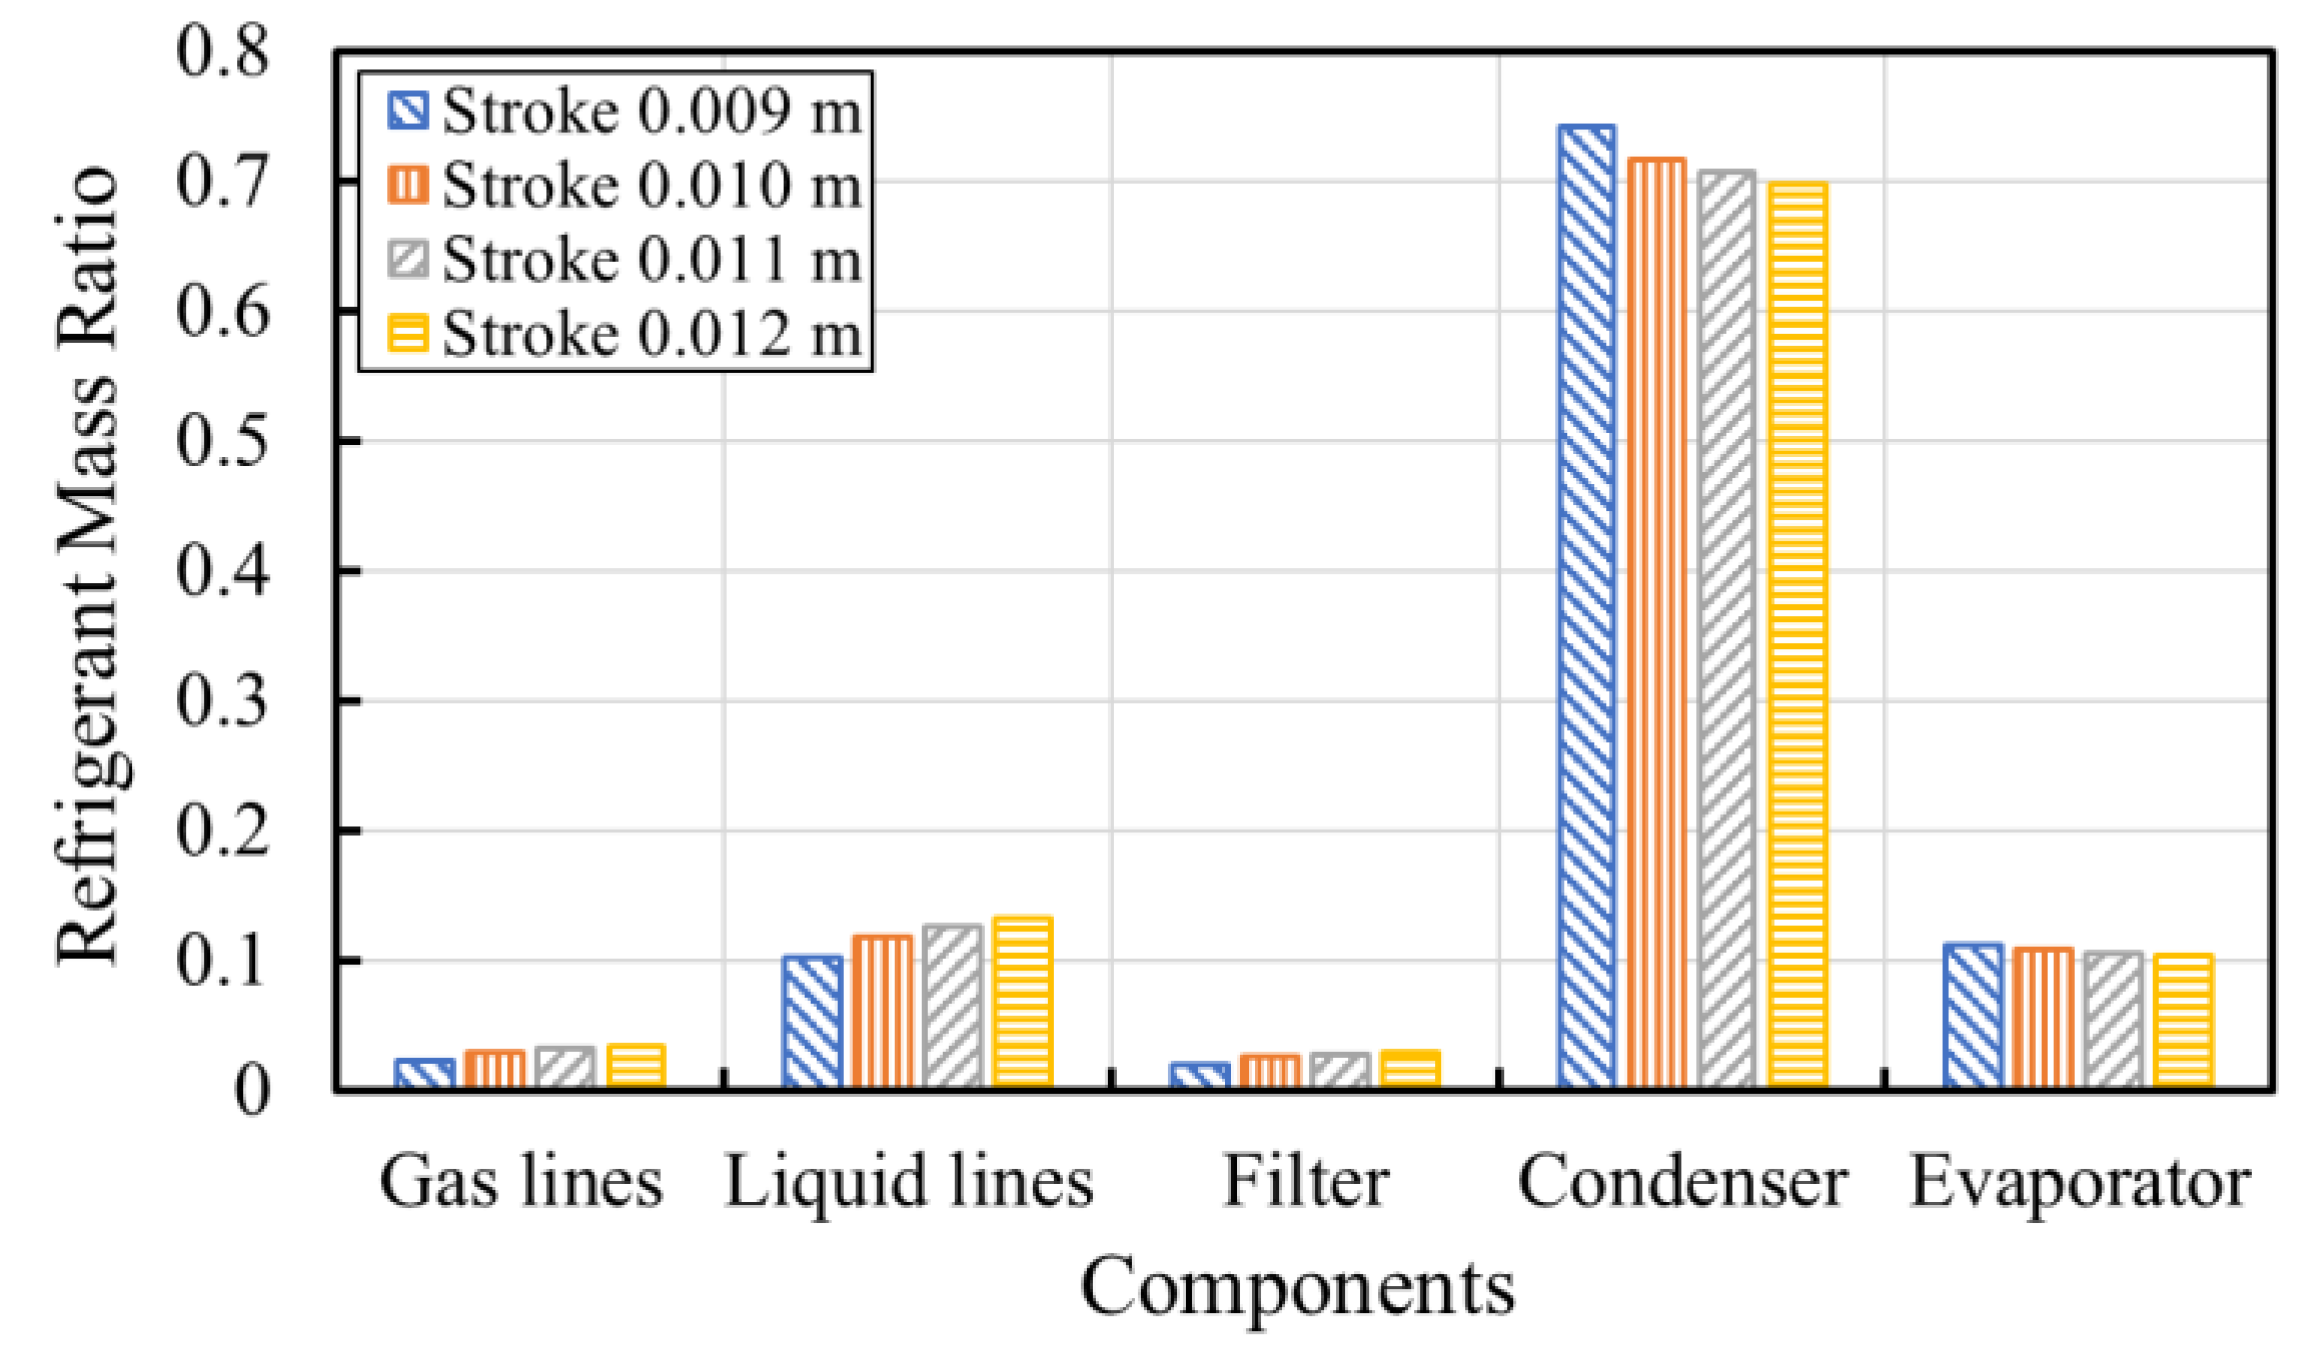
Figure 8 shows the predicted refrigerant distribution in the prototype oil-free refrigeration unit with different compressor strokes at a refrigerant charge of 0.28 kg and a pressure ratio of 2.5. As the compressor stroke increases, the refrigerant mass ratio in the condenser has an obvious decrement due to the increase of circulated refrigerant in the prototype oil-free refrigeration unit. The two-phase length in the evaporator increases with the compressor stroke due to the increase of saturation temperature and compression work. Li et al. [
2] pointed out that the mass flux and the system operating pressure increases with the increase of compressor stroke. According to Equations (3)–(8), the void fraction increases from 0.5 to 0.7 with the increase of compressor stroke and mass flow rate. Though the amount of the refrigerant circulated in the system and the two-phase length increase with the compressor stroke, the increase of the void fraction leads to approximately the same amount of refrigerant accumulated in the evaporator. Due to the increased density of the refrigerant, the refrigerant in the gas lines, liquid lines, and filter increase with the increase of the compressor stroke.
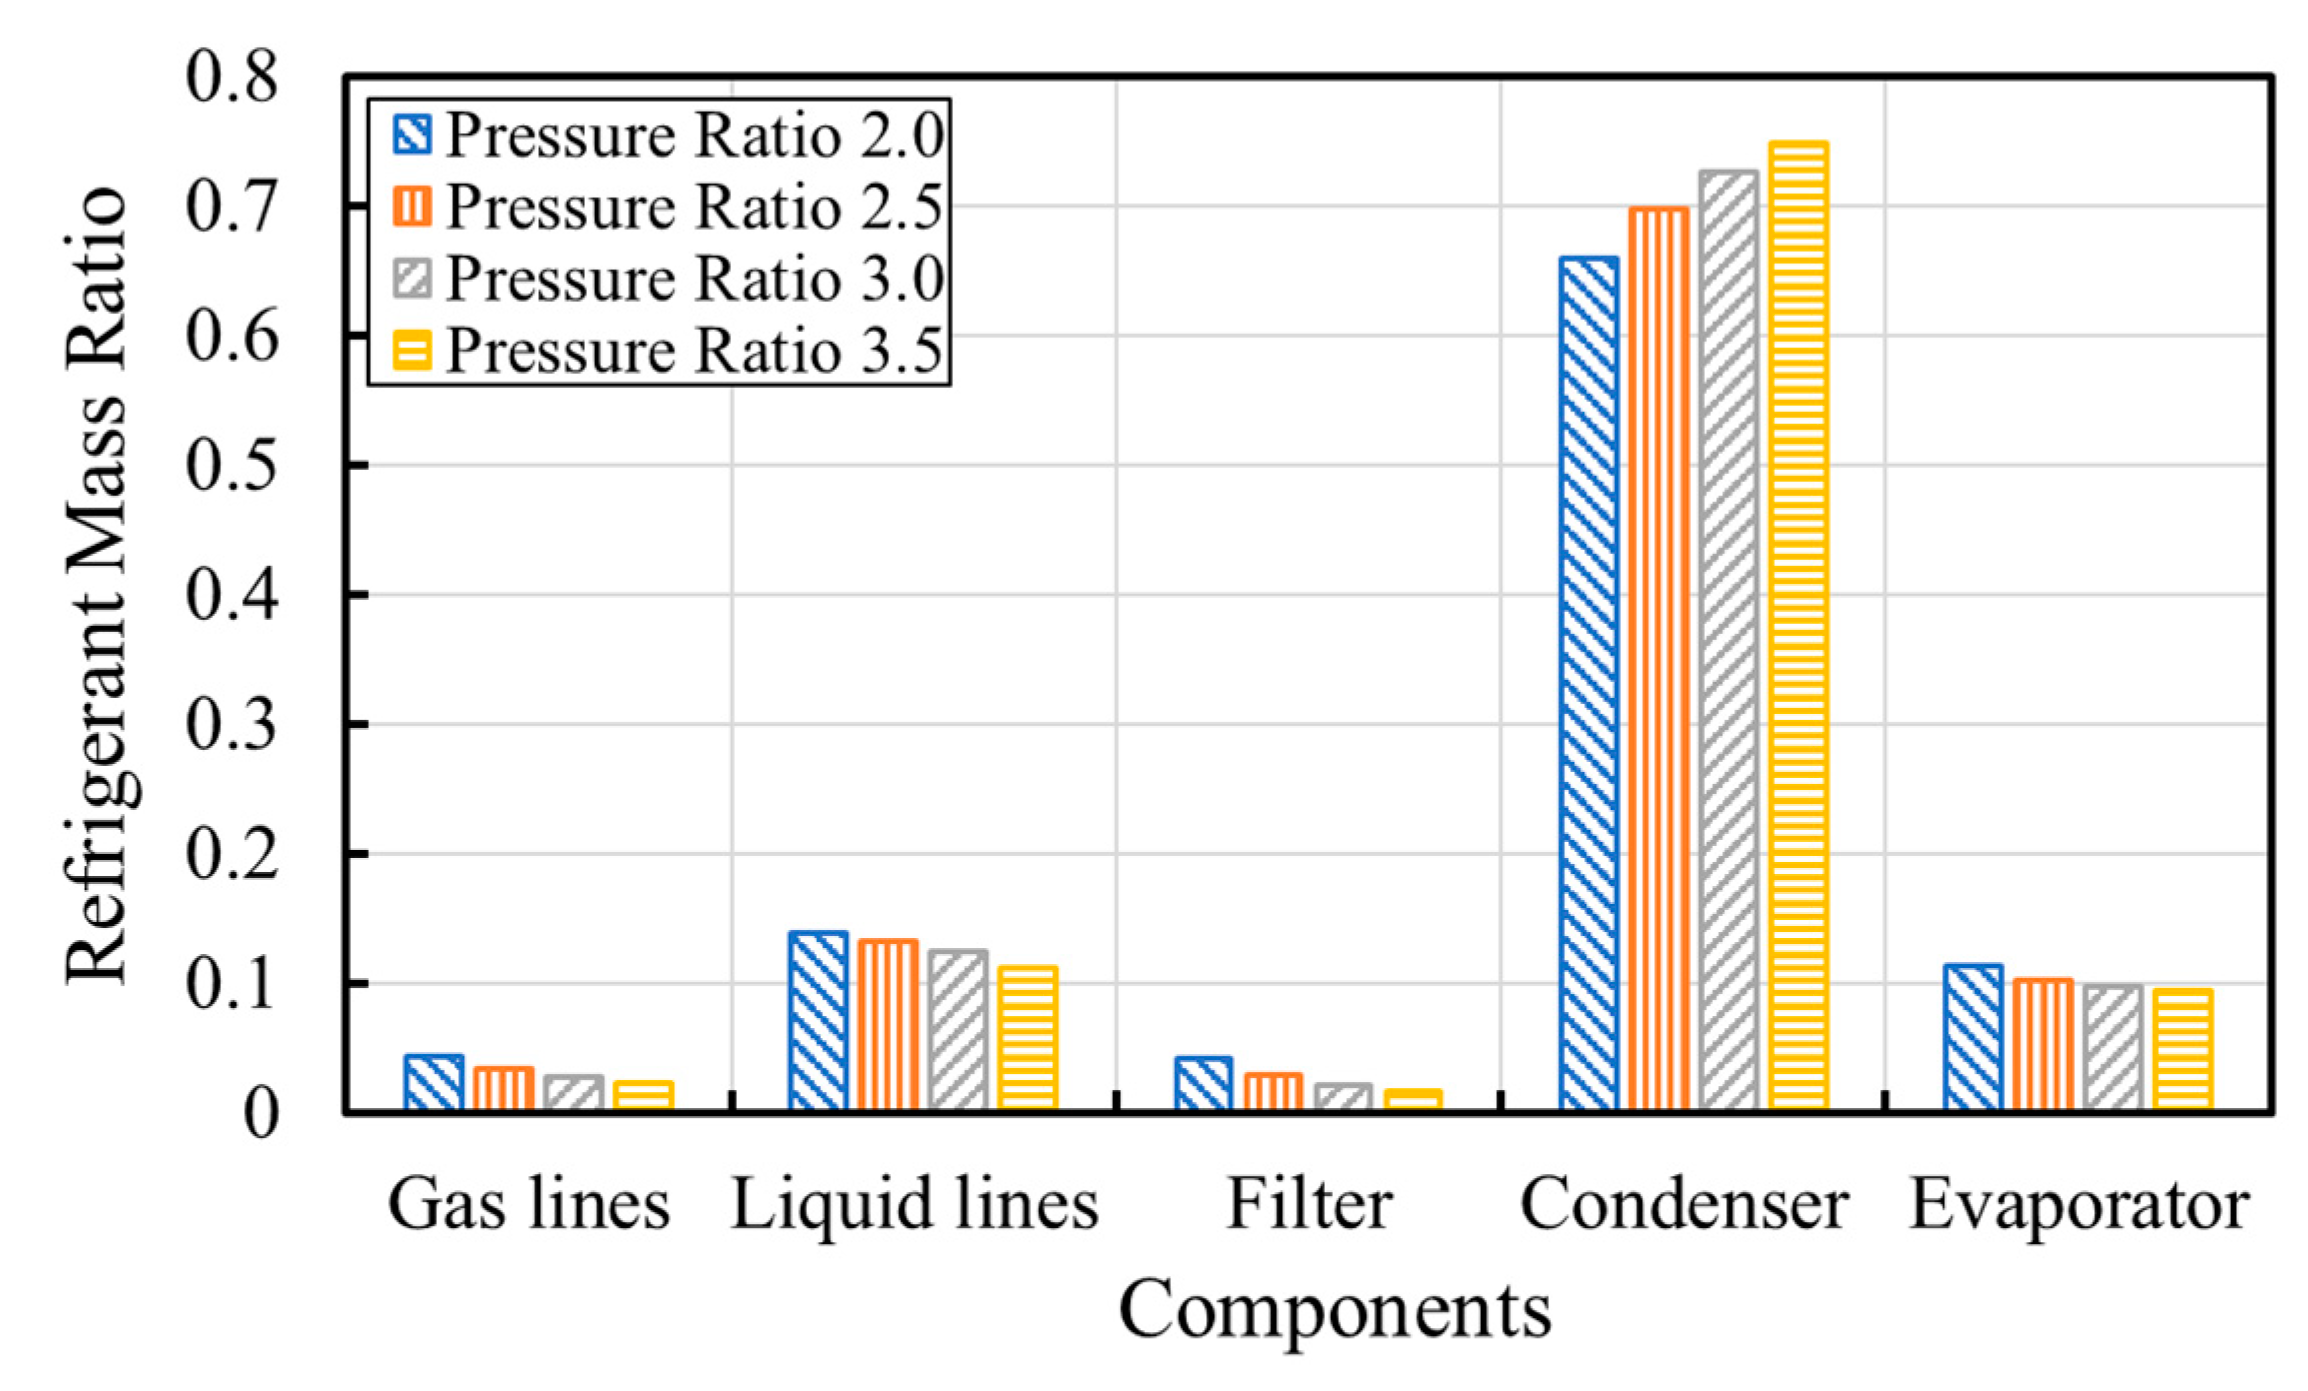
Figure 9 shows the predicted refrigerant distribution in the prototype oil-free refrigeration unit with different pressure ratios for a compressor stroke of 0.012 m at a fixed refrigerant charge of 0.28 kg. The refrigerant mass ratio in the condenser has an obvious increment with the increase of pressure ratio. Due to the reduced refrigerant vapour density, the refrigerant accumulated in the vapour lines and filter decrease slightly. With various operating conditions, the majority of refrigerant is inventoried in the condenser. With the decrease in the compressor volumetric efficiency, the refrigerant accumulated in the condenser increases with the pressure ratio. At a pressure ratio of 3.5, the proportion of refrigerant in the condenser can reach 74%. As can be seen from
Figure 7,
Figure 8 and
Figure 9, the refrigerant distributed in the condenser is most sensitive to compressor operating conditions and total refrigerant charges.
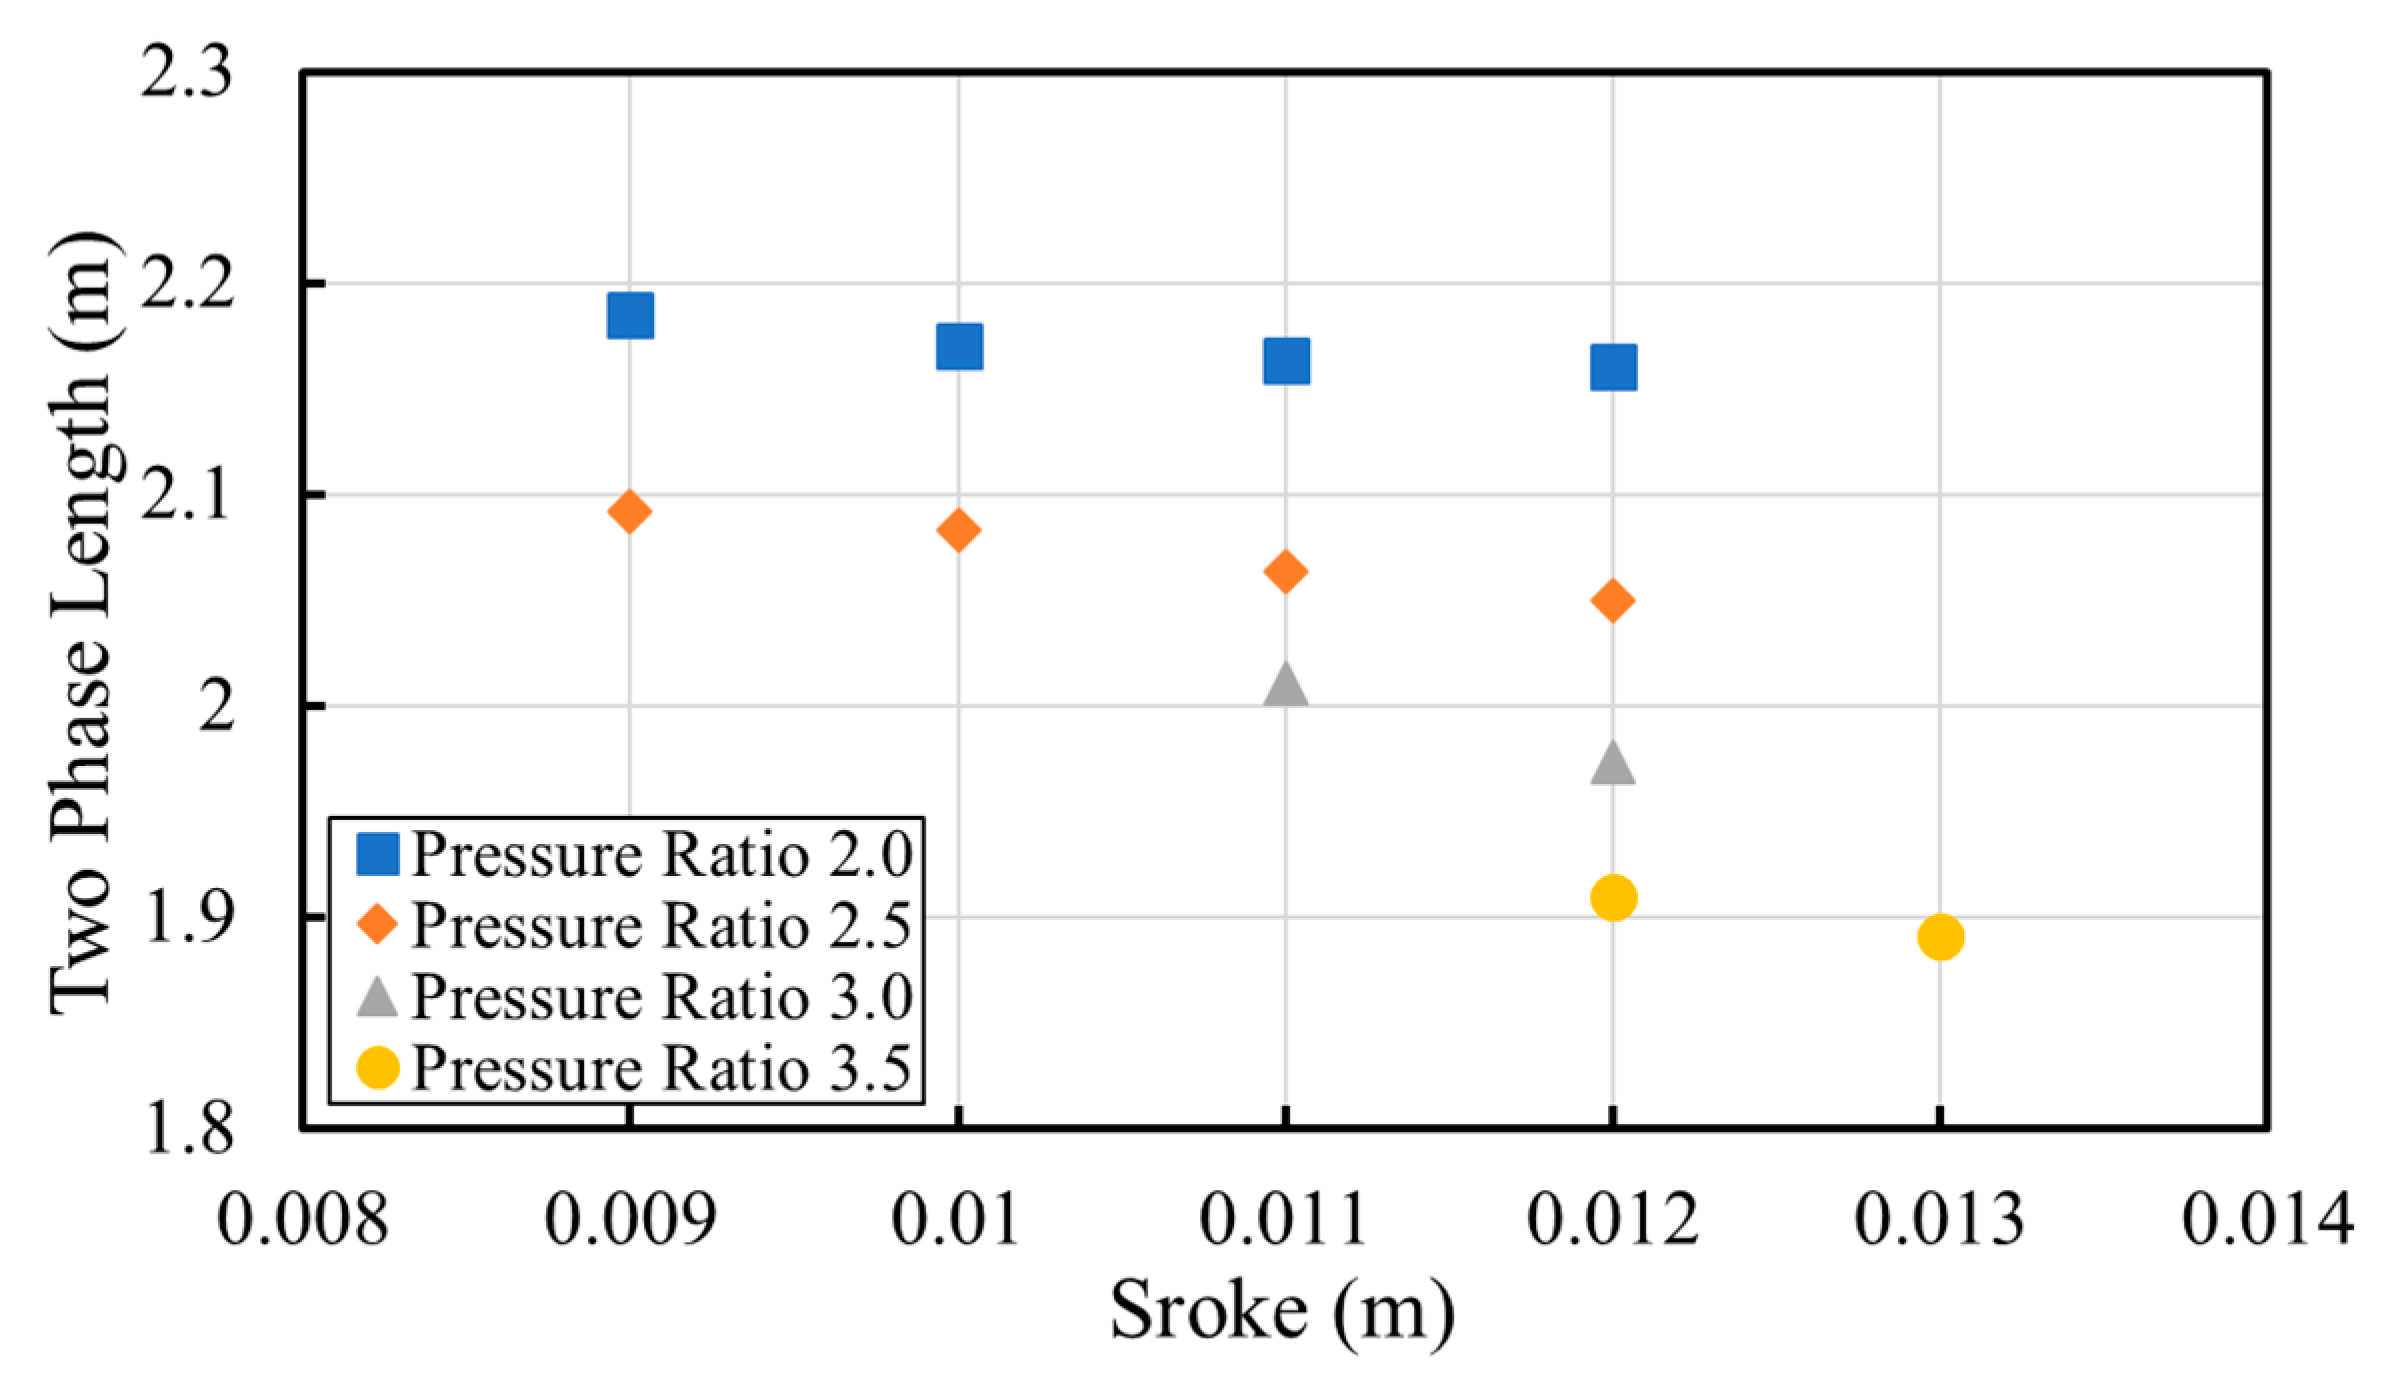
Figure 10 shows the predicted two-phase length of the condenser against compressor strokes with various pressure ratios at a refrigerant charge of 0.28 kg. It can be seen that the refrigerant of the two-phase region in the condenser decreases slightly with the increase of compressor strokes at a fixed pressure ratio. At a fixed compressor stroke, the two-phase length decreases with the increase of pressure ratio due to the increase of the compressor discharge temperature, as shown in
Figure 4. The decrease in the two-phase length represents an increase of the single-phase length resulting in a reduction of heat transfer performance of the condenser. The two-phase length in the condenser reaches 1.88 m at a pressure ratio of 3.5 and a compressor stroke of 0.012 m. Excessive reduction of the two-phase flow length can lead to flooding in the condenser, resulting in a decrease in the condensing heat transfer coefficient.
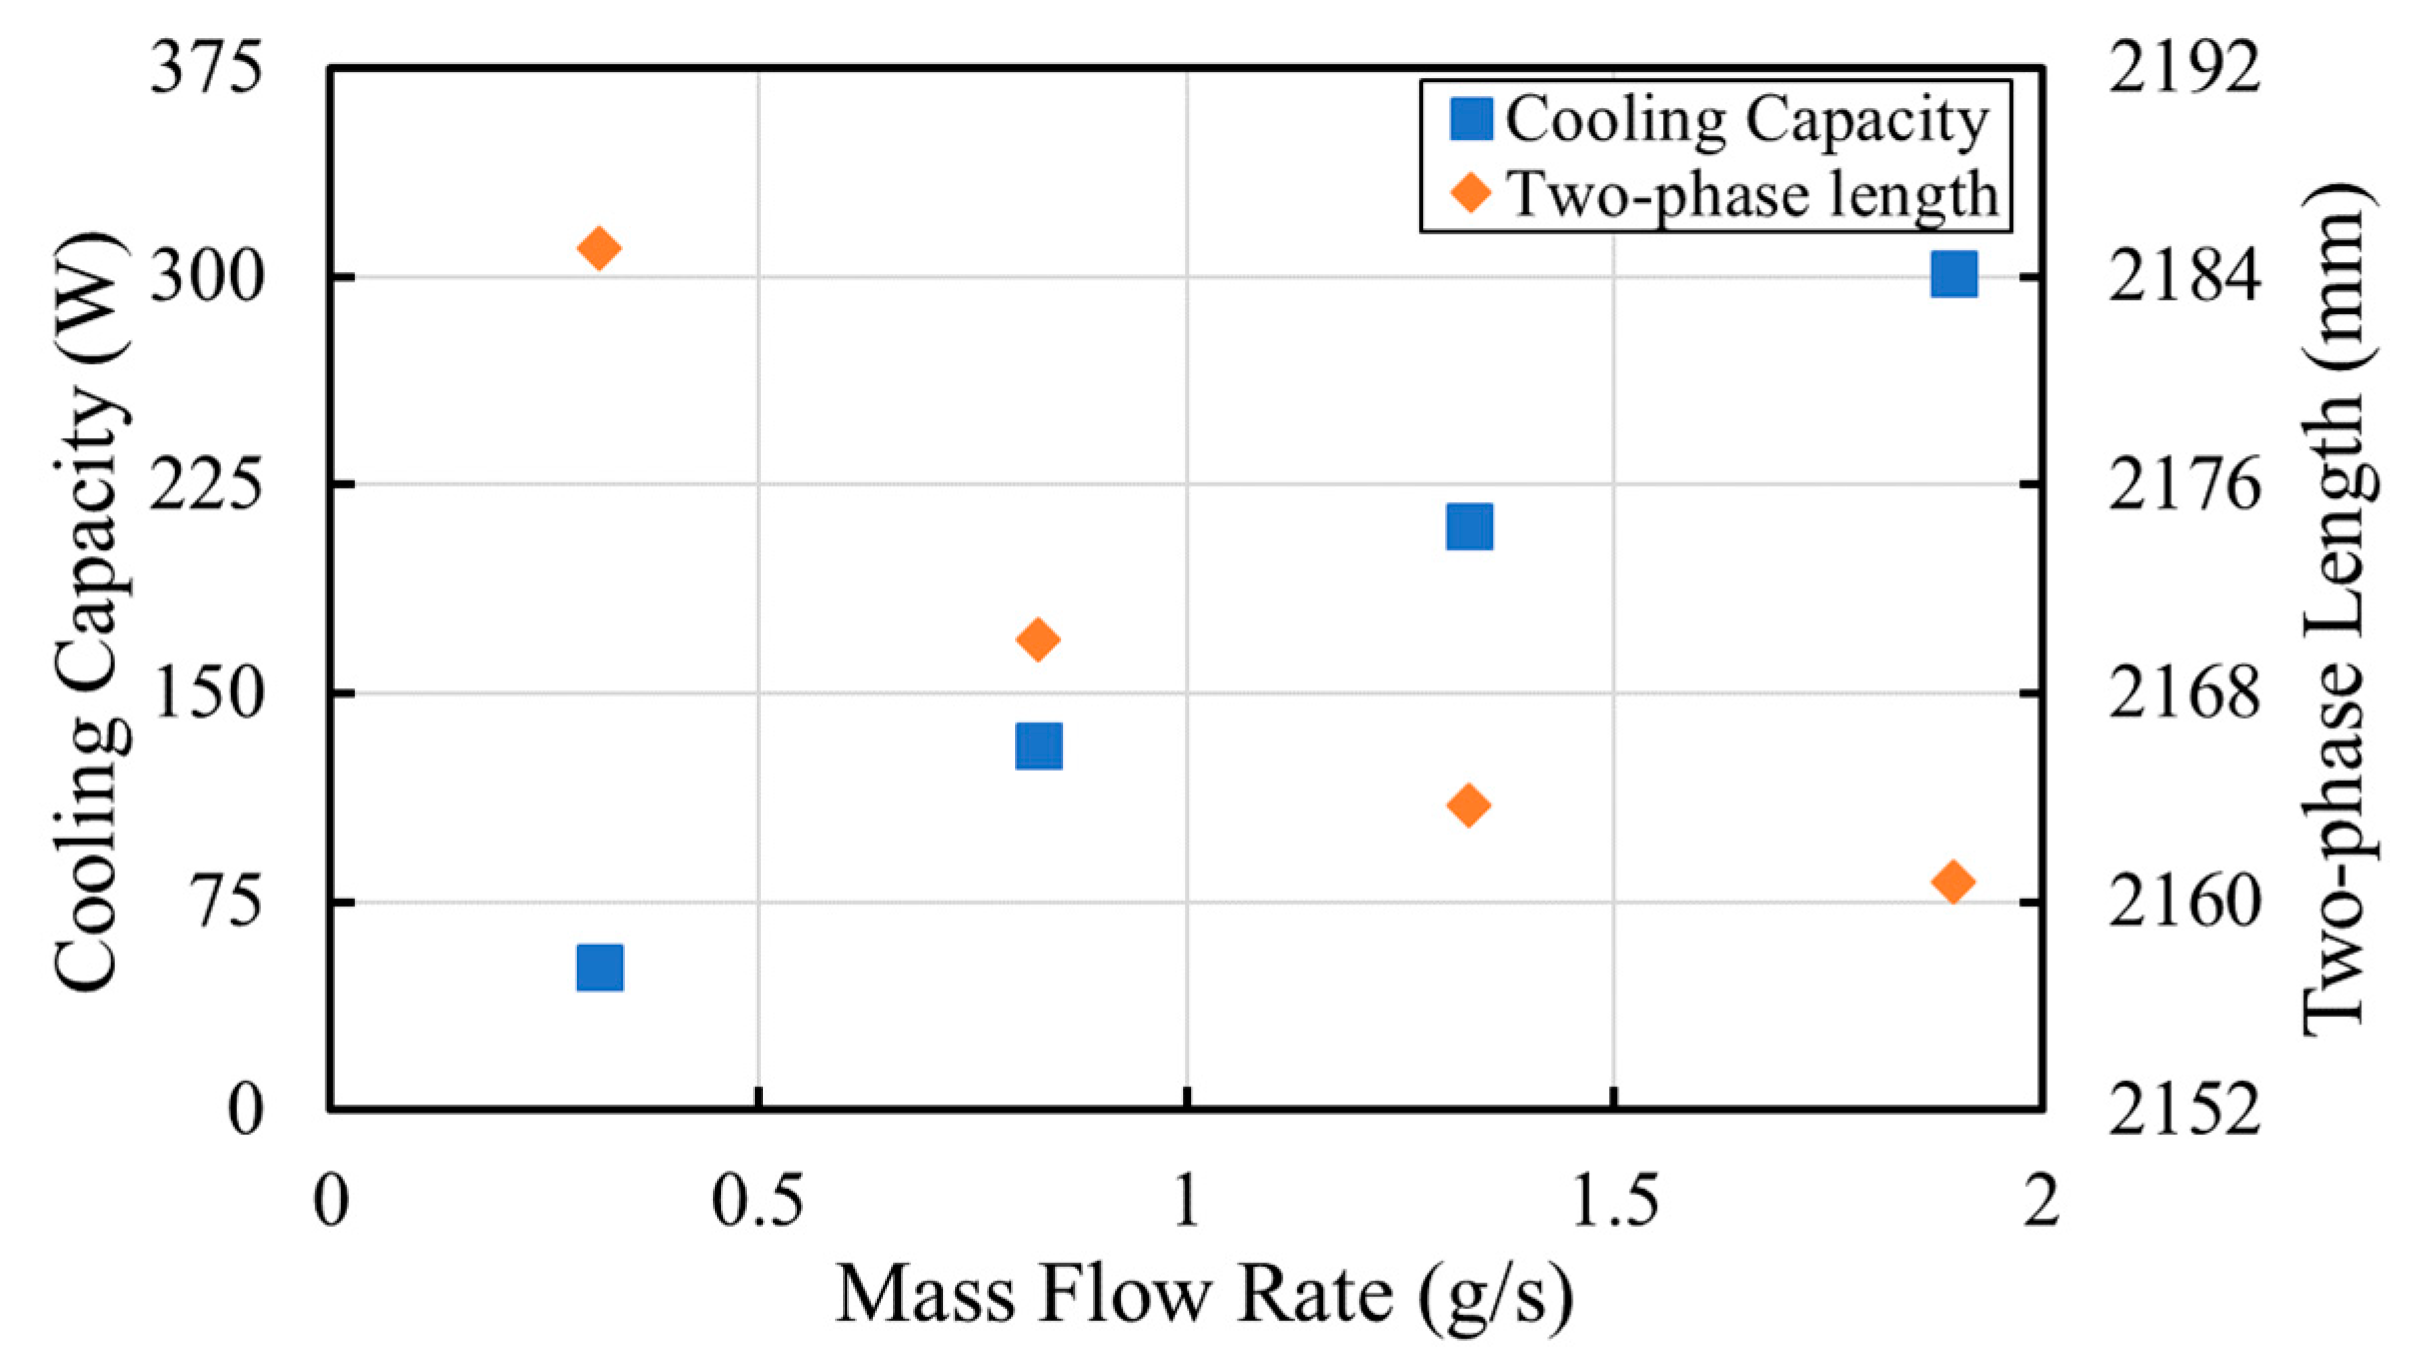
Figure 11 shows the system cooling capacity and two-phase length in the condenser against mass flow rate at a pressure ratio of 2.5 at a refrigerant charge of 0.28 kg. The condenser two-phase length decreases with the increase of mass flow rate, which leads to the increase of the refrigerant circulating in the system resulting in an increase of cooling capacity. The oil-free refrigeration unit can achieve a mass flow rate of 0.00189 kg/s and a cooling capacity of 301.3 W for a pressure ratio of 2.5.
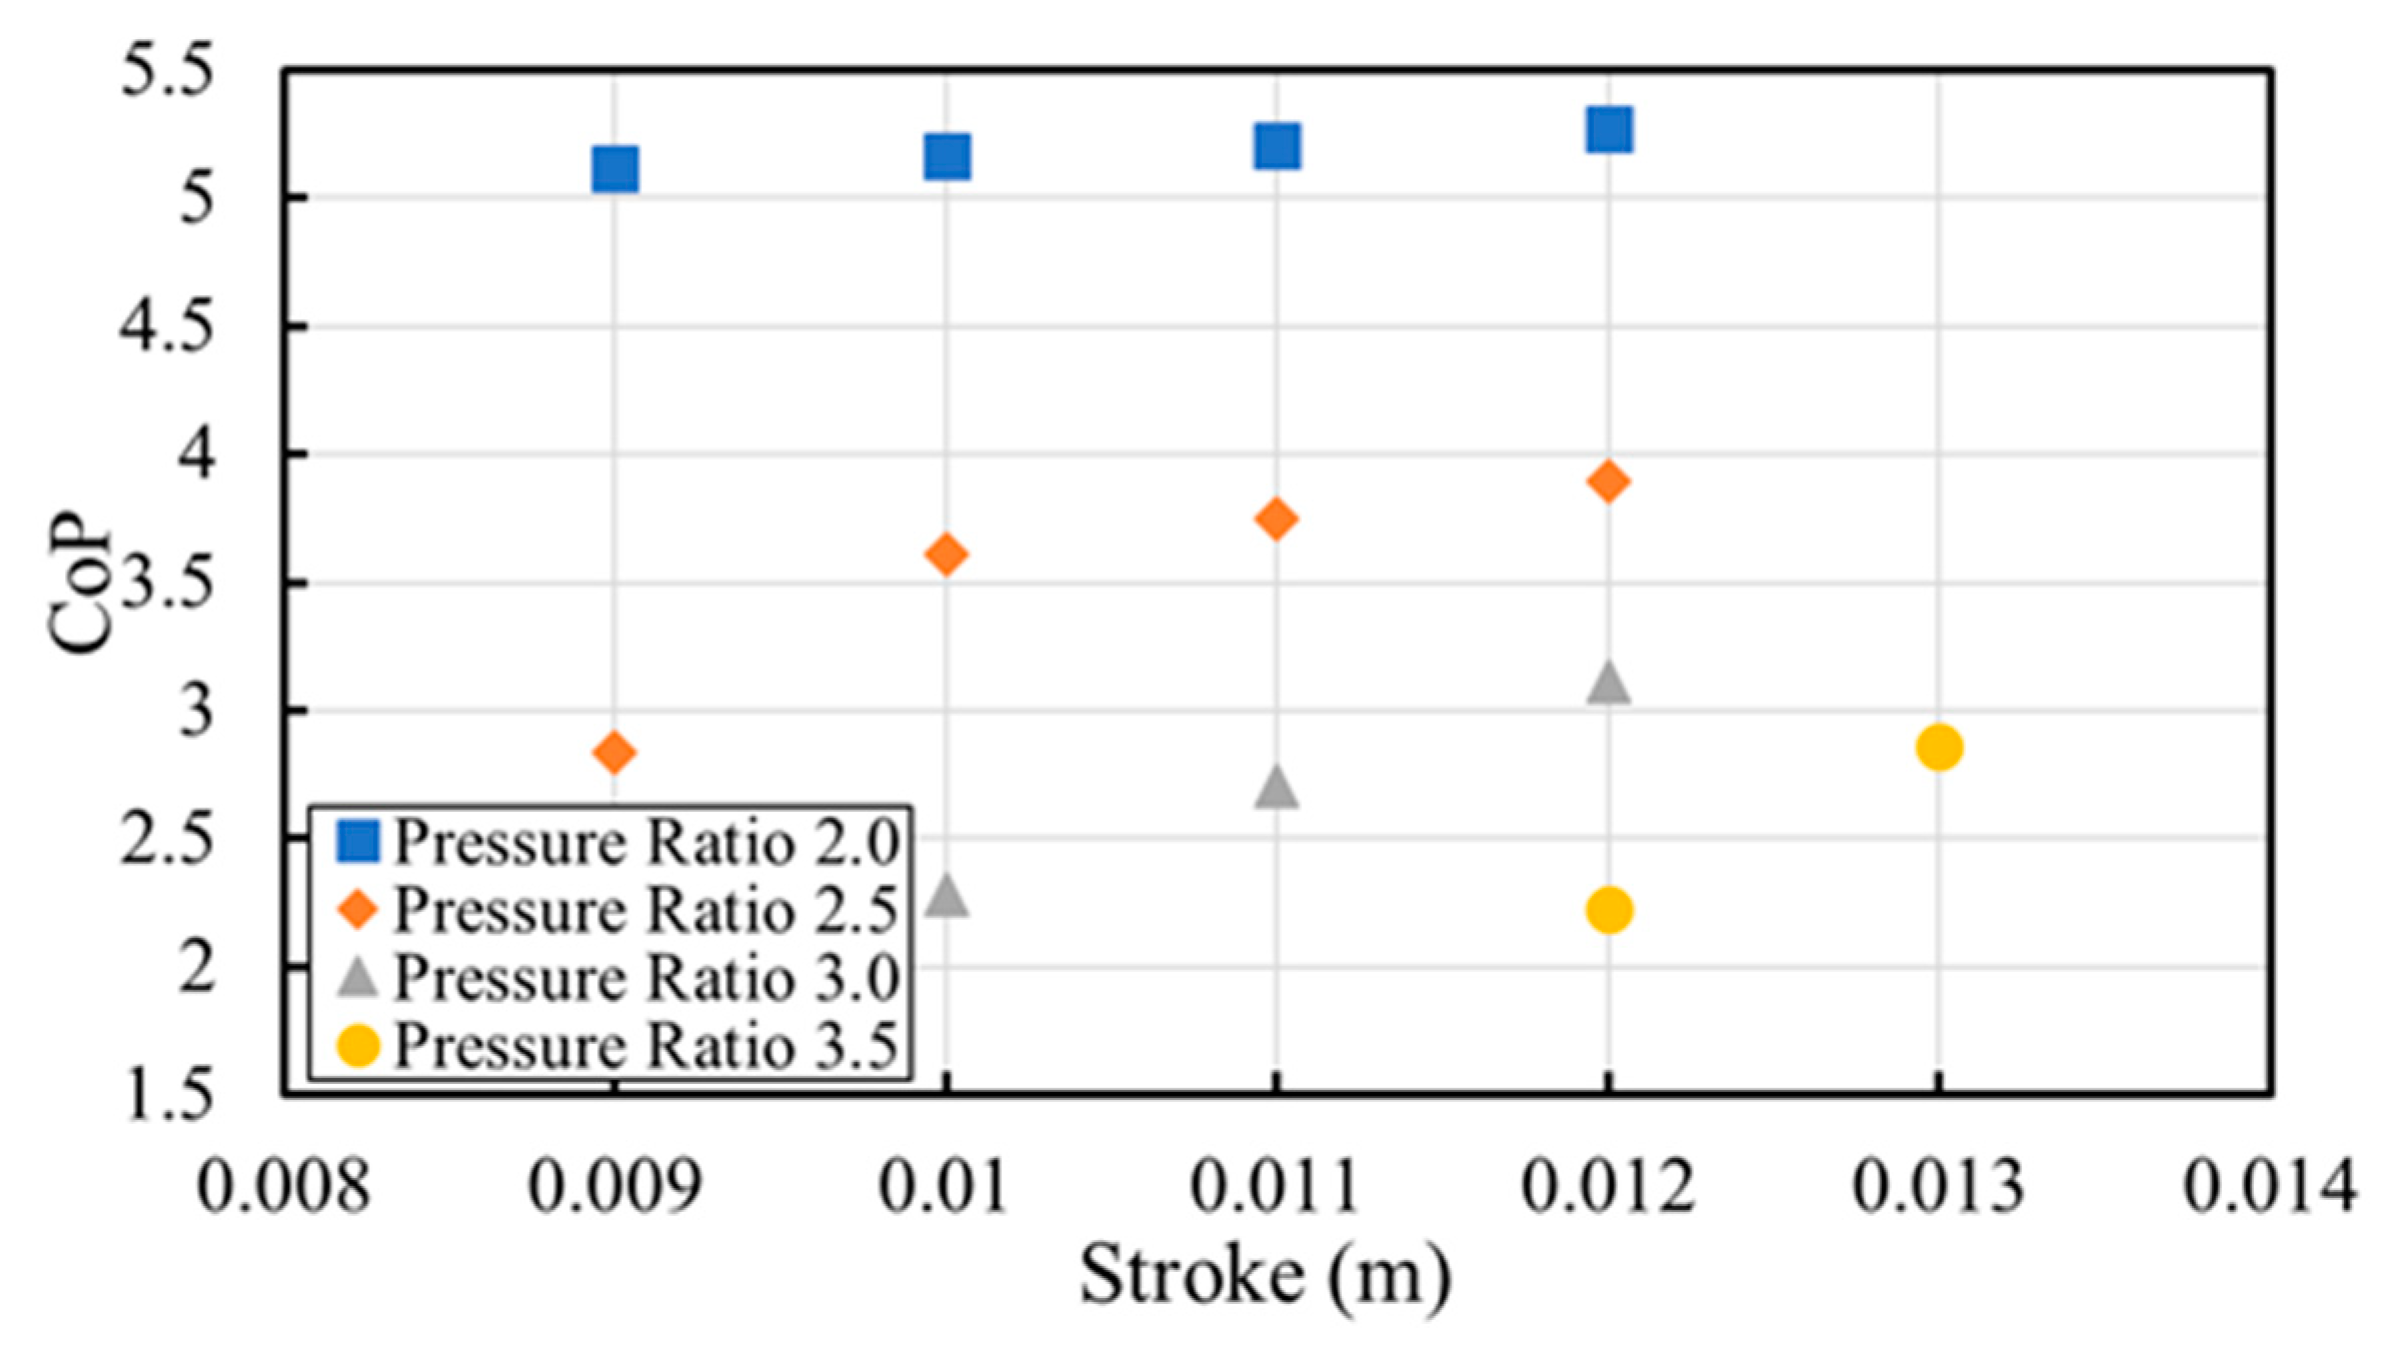
Figure 12 shows the system coefficient of performance (CoP) against stroke with various pressure ratios at a refrigerant charge of 0.28 g. The CoP increases with the increase of the compressor stroke due to the refrigerant accumulated in the condenser decreasing, resulting in more refrigerant circulating in the system, and thus, an increase of the mass flow rate. For a fixed compressor stroke, the CoP decreases with the increase of the pressure ratio, which leads to more refrigerant accumulating in the condenser. Thus, the evaporator heat transfer coefficient decreases due to the decrease in the mass flow rate. The oil-free refrigeration unit achieves a CoP of 5.3 for a pressure ratio of 2.0 and a stroke of 0.012 m.
Table 3 shows the refrigerant distribution comparison between related literature [
6,
9,
16,
17] and the current study. As can be seen from
Table 3, the mass of the refrigerant inventory in the condenser and evaporator are roughly the same as the present study. Only a few studies considered the refrigerant distribution involving the refrigerant dissolving in the oil lubricant. Harms et al. [
18] developed a model to calculate the charge inventory for a split system. The modelling results show that at a cooling power of 8.8 kW, 44% of the refrigerant concentrates in the condenser, and 17% of the refrigerant concentrate in the evaporator while 5% of the refrigerant dissolved in the oil lubricant. In addition, Youbi-Idrissi et al. [
19] reported that over 20% refrigerant could be dissolved in the oil lubricant at low superheat conditions. As for the system performance, Jain et al. [
20] tested the performance of R134a in a VCR system using a conventional compressor. At a condenser temperature of 40 °C, the system can achieve a CoP of 2.31 and a heat transfer rate of 94.36 kW using R134a. Sanchez et al. [
21] tested the system performance using R134a in a conventional VCR system. The results show that the system achieves a CoP of 2.15 at a condenser temperature of 45 °C and an evaporator temperature of 0 °C. For the present study, the system using R134a can achieve a CoP of 2.9 at a condenser of 40 °C and an evaporator temperature of 4 °C. The CoP in this study is higher than that of the other two literature at similar operating conditions. However, the refrigerant distribution and performance can change with different operating conditions, working fluids, and system dimensions. The investigation of the oil lubricant impact on refrigerant distribution and system performance should be carried out in the same system and operating conditions to enable comparable conditions. This could be one of the future works.


