Article

Optimization of Programmed Temperature Vaporization Injection for Determination of Polycyclic Aromatic Hydrocarbons from Diesel Combustion Process

1
State Key Laboratory of Engines, Tianjin University, Tianjin 300072, China
2
School of Mechanical Engineering, North China University of Water Resources and Electric Power, Zhengzhou 450045, China
3
Institute of High Energy Physics Chinese Academy of Science, Beijing 100049, China
*
Author to whom correspondence should be addressed.
Energies 2019, 12(24), 4791; https://doi.org/10.3390/en12244791
Submission received: 11 November 2019 / Revised: 12 December 2019 / Accepted: 12 December 2019 / Published: 16 December 2019
(This article belongs to the Section B: Energy and Environment)

Abstract

:
In this study, programmed temperature vaporization in the solvent vent mode (PTV-SV) of gas chromatography-mass spectrometry was optimized and validated for the analysis of particle-phase and gas-phase polycyclic aromatic hydrocarbons from diesel engine combustion. Because of the large number of experimental and response variables to be studied, central composite inscribed design was used to optimize the PTV-SV injection factors, including initial inlet temperature, vaporization flow and time. The optimized PTV-SV method was validated by linearity, accuracy and sensitivity. For the 16 Polycyclic aromatic hydrocarbons (PAHs) studied, the correlation coefficients for the calibration plots of peak areas versus concentrations (0.5–300 ng mL−1) ranged from 0.9812–0.9998. Limits of detection ranged from 0.016–20,130.375 ng mL−1, and limits of quantification ranged from 0.055–1.25 ng mL−1. The optimized method was used for the analysis of real samples collected from a diesel engine, which included particle-phase and gas-phase PAHs. The results showed that the improved PTV-SV method was satisfying for simultaneously identifying and quantifying PAHs produced during diesel combustion.

Graphical Abstract

1. Introduction

Polycyclic aromatic hydrocarbons (PAHs) are organic compounds which contain two or more aromatic rings. Due to their known or potential mutagenic and carcinogenic properties, PAHs have received more attention. Diesel engines are one of the contributors to the PAHs in atmospheric environment. The diesel-generated PAHs mainly originate from the incomplete combustion of fuel [1,2], and the variety and quantity of PAHs are affected by engine working conditions and fuel properties [3,4]. In addition, they also play important roles in the formation of soot, another undesirable combustion byproduct [3,4,5,6,7,8]. Therefore, the identification of PAHs is essential for studies on the formation and evolution of diesel pollutants.
Combustion-generated PAHs are generally measured by gas chromatography-mass spectrometry (GC-MS) [2,9,10]. Diesel engine combustion involves complicated physical and chemical processes accompanied by high temperature and pressure. In such processes, the quantity of PAHs is usually a few micrograms [11]. Wide varieties of intermediate products are also formed during the combustion process and interfere with the analysis of PAHs, complicating PAH identification and quantification. Therefore, using GC-MS to identify most of the PAHs in diesel combustion samples, with low detection and quantification limits, is challenging.
The programmed temperature vaporization (PTV) technique can be widely applied to improve sensitivities for GC-MS identification of trace analytes. PTV not only increases the method sensitivity through the larger volume injection of the final extract, it also simplifies and/or improves offline sample pretreatment procedures, reducing sample loss [12,13]. There are several other advantages to using the PTV technique, such as a decrease in analyte discrimination, improved transfer of thermodegradable compounds and better adaptability to relatively dirty samples [14].
The PTV injector on the GC-MS can be used in several different modes, including splitless injection, pulsed splitless, solvent vent, vapor overflow and solid-phase extraction-thermal desorption [15]. In the classical injection modes, such as split, splitless and pulsed splitless, the maximum injection volume is only approximately 2 μL [16,17]. By contrast, the programmed temperature vaporization in the solvent vent mode (PTV-SV) significantly increases the sample volume to several hundred μL and simultaneously improves sensitivity by controlling the time when the split exit is open, as well as the temperature of the inlet port [18]. Because of the numerous experimental variables in the PTV system, an experimental optimization of parameters is needed for different analysis types.
To date, PTV-GC-MS has been successfully applied to the quantitative analysis of PAHs in gasoline samples [19], ambient aerosol samples [20,21], foodstuffs [13] and marine sediments [22]. Literatures on the PAH analysis using PTV-SV-GC-MS is limited in number. The PTV injection system involves many parameters that have complex effects on analyte responses [16]. To improve sensitivity, it is necessary to identify the optimum combination of parameters. The primary aim of this study was to optimize and validate the PTV-SV injection method for the analysis of 16 PAHs produced from diesel engine combustion. Based on literature reviews [21] and our previous experience, three parameters were investigated, including initial inlet temperature (TA), vaporization flow (FB) and time (tC). Optimizations of these three factors for PTV-SV injection were performed using the central composite inscribed (CCI) design. Different performance parameters of the PTV-SV-GC-MS method, such as the linearity, accuracy and sensitivity, were calculated. Analyses of samples from the diesel combustion process were conducted using the optimized method.

2. Materials and Methods

2.1. Preparation of the Real Sample

A real sample was used for validating the optimized programmed temperature vaporization in the solvent vent mode-gas chromatography-mass spectrometry-selected ion monitoring mode (PTV-SV-GC-MS-SIM) method. This real sample was obtained from a total cylinder sampling system of a diesel engine. The diesel engine was operated at an engine speed of 1000 rpm and a fuel-air equivalence ratio of 0.41. A detailed description of the total cylinder sampling system has been reported in the literature [23]. During sampling procedure, an aluminum alloy diaphragm was used to seal the engine cylinder head, making it a sampling valve. At a pre-set crank angle during the sampling cycle, the aluminum alloy diaphragm was instantly cut using an electromagnetic actuated tube-cutter. The cylinder contents rapidly exited from the cylinder into a sampling bag. Simultaneously, the samples were quenched and diluted by mixing with high-pressure nitrogen to achieve a temperature below 52 °C. The cylinder contents collected in the sampling bag were forced to flow through a Teflon® (Polytetrafluoroethylene (PTFE))-coated glass fiber filter (Pall, Ann Arbor MI, USA) inserted into the gas pipe. Particulates deposited on the filter were used for the analysis of particle-phase PAHs. A polyurethane foam (PUF)/XAD/PUF “sandwich” cartridge (SUPELCO, Bellefonte, PA, USA) was placed behind the Teflon®-coated glass fiber filter for sampling gas-phase PAHs. After sampling, the filter and PUF/XAD/PUF cartridge used were immediately Soxhlet extracted using 60 and 120 mL dichloromethane (DCM), respectively, for 24 h. The DCM used was HPLC-MS grade from Dikma (Beijing, China). By rotary film and vortex evaporation, the resulting extract from the particle-phase sample was concentrated to 10 mL, and the one from the gas-phase was concentrated to 100 mL. The concentration process was performed under nitrogen. The concentrated extracts were stored in sealed bottles at −20 °C in the dark.

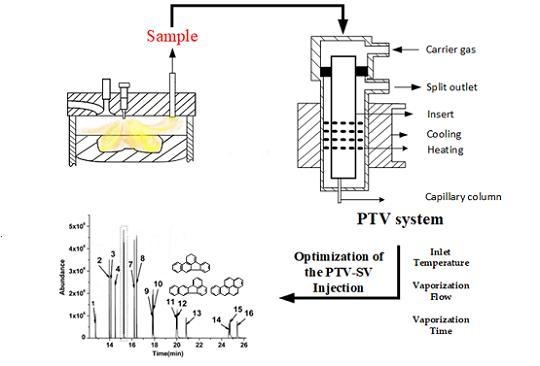
2.2. GC-MS Conditions

PAH analyses were performed on an Agilent 7890A gas chromatograph (Agilent Technologies, Santa Clara, California, USA) interfaced to a 5975C mass spectrometer detector (Agilent Technologies, Santa Clara, California, USA) operated in the electron ionization mode. This system was equipped with a PTV injector (Option 130, Agilent Technologies, Santa Clara, California, USA), and the injections were automatically carried out using an ALS 7683B autosampler (Agilent Technologies, Beijing, China). In this study, the maximum volume for the inlet liner is 50 μL. In addition, too much injection will result in a contamination of the chromatographic column. Therefore, the injection volume was chosen as 25 μL. The 25 μL total injection volumes were achieved by five separate injections of 5 μL at a maximum injection speed of 100 μL s−1. The GC oven temperature program used for the PTV injection was: The initial temperature of 30 °C was held for 7.5 min, the temperature was increased at a rate of 30 °C min−1 to 280 °C, where it was held for 8 min, and then the temperature was increased at a rate of 60 °C min−1 to 300 °C, where it was held for 6 min. Identification of the target compounds was based on the detection of the corresponding molecular ion and comparisons of retention times with those of relevant PAH standards. Quantification of the PAHs was performed using the SIM mode. The ionization voltage, transfer line temperature and ion source temperature were 70 eV, 280 °C and 280 °C, respectively. All analyses were performed using a capillary column (Agilent HP-5ms, 5% phenyl methyl siloxane, 30 m × 250 μm × 0.25 μm film thickness) and helium (99.9995 %) was employed as the carrier gas.

2.3. Calibration

A United States Environmental Protection Agency (USEPA) 16-PAH mixed standard solution (AccuStandard, New Haven, Connecticut, USA), including naphthalene (Nap), acenaphthylene (AcPY), acenaphthene (AcP), fluorene (Flu), phenanthrene (Phe), anthracene (Ant), fluoranthene (FL), pyrene (Pyr), benzo(a)anthracene (BaA), chrysene (Chr), benzo(b)fluoranthene (BbFL), benzo(k)fluoranthene (BkFL), benzo(a)pyrene (BaP), indeno(1,2,3-cd)pyrene (InP), dibenzo(a,h)anthracene (DBA) and benzo (g,h,i)perylene (BghiP), was used for calibration. Standard working solutions for calibration plots were freshly prepared by diluting the stock standard solution in DCM. The 16-PAH mixed standard solution, with an initial concentration of 200 × 103 ng mL−1, was diluted to 300, 200, 50, 10, 5 and 0.5 ng mL−1. All solutions were stored in capped amber vials at −20 °C. The gas chromatography analysis was carried out for these diluted standard solutions using the optimized PTV-SV-GC-MS-SIM method. Calibration curves were prepared using the PAH concentrations and corresponding peak areas. PAH quantification for the real samples could then be performed using the calibration curves.

2.4. Method Validation

The PTV-SV-GC-MS method was validated using linearity, accuracy and sensitivity. The linearity of the method was determined using calibration plots obtained from three replicate analyses of standard solutions with concentrations of 0.5, 5, 10, 50, 200 and 300 ng mL−1. The accuracy of the method was expressed as the ratio of the theoretical value to the average measured value for three concentrations of authentic standards added to the samples. The average recovery of the PAHs was calculated using calibration plots. The limits of detection (LODs) and quantification (LOQs) were calculated based on signal-to-noise ratios of 3:1 and 10:1, respectively, for both the PTV-GC-MS and conventional splitless GC-MS methods. To evaluate the precision of the method, mixed standard solutions (100 ng mL−1) were added to blank samples and extracted using the sample preparation procedure described in Section 2.1.

3. Results and Discussion

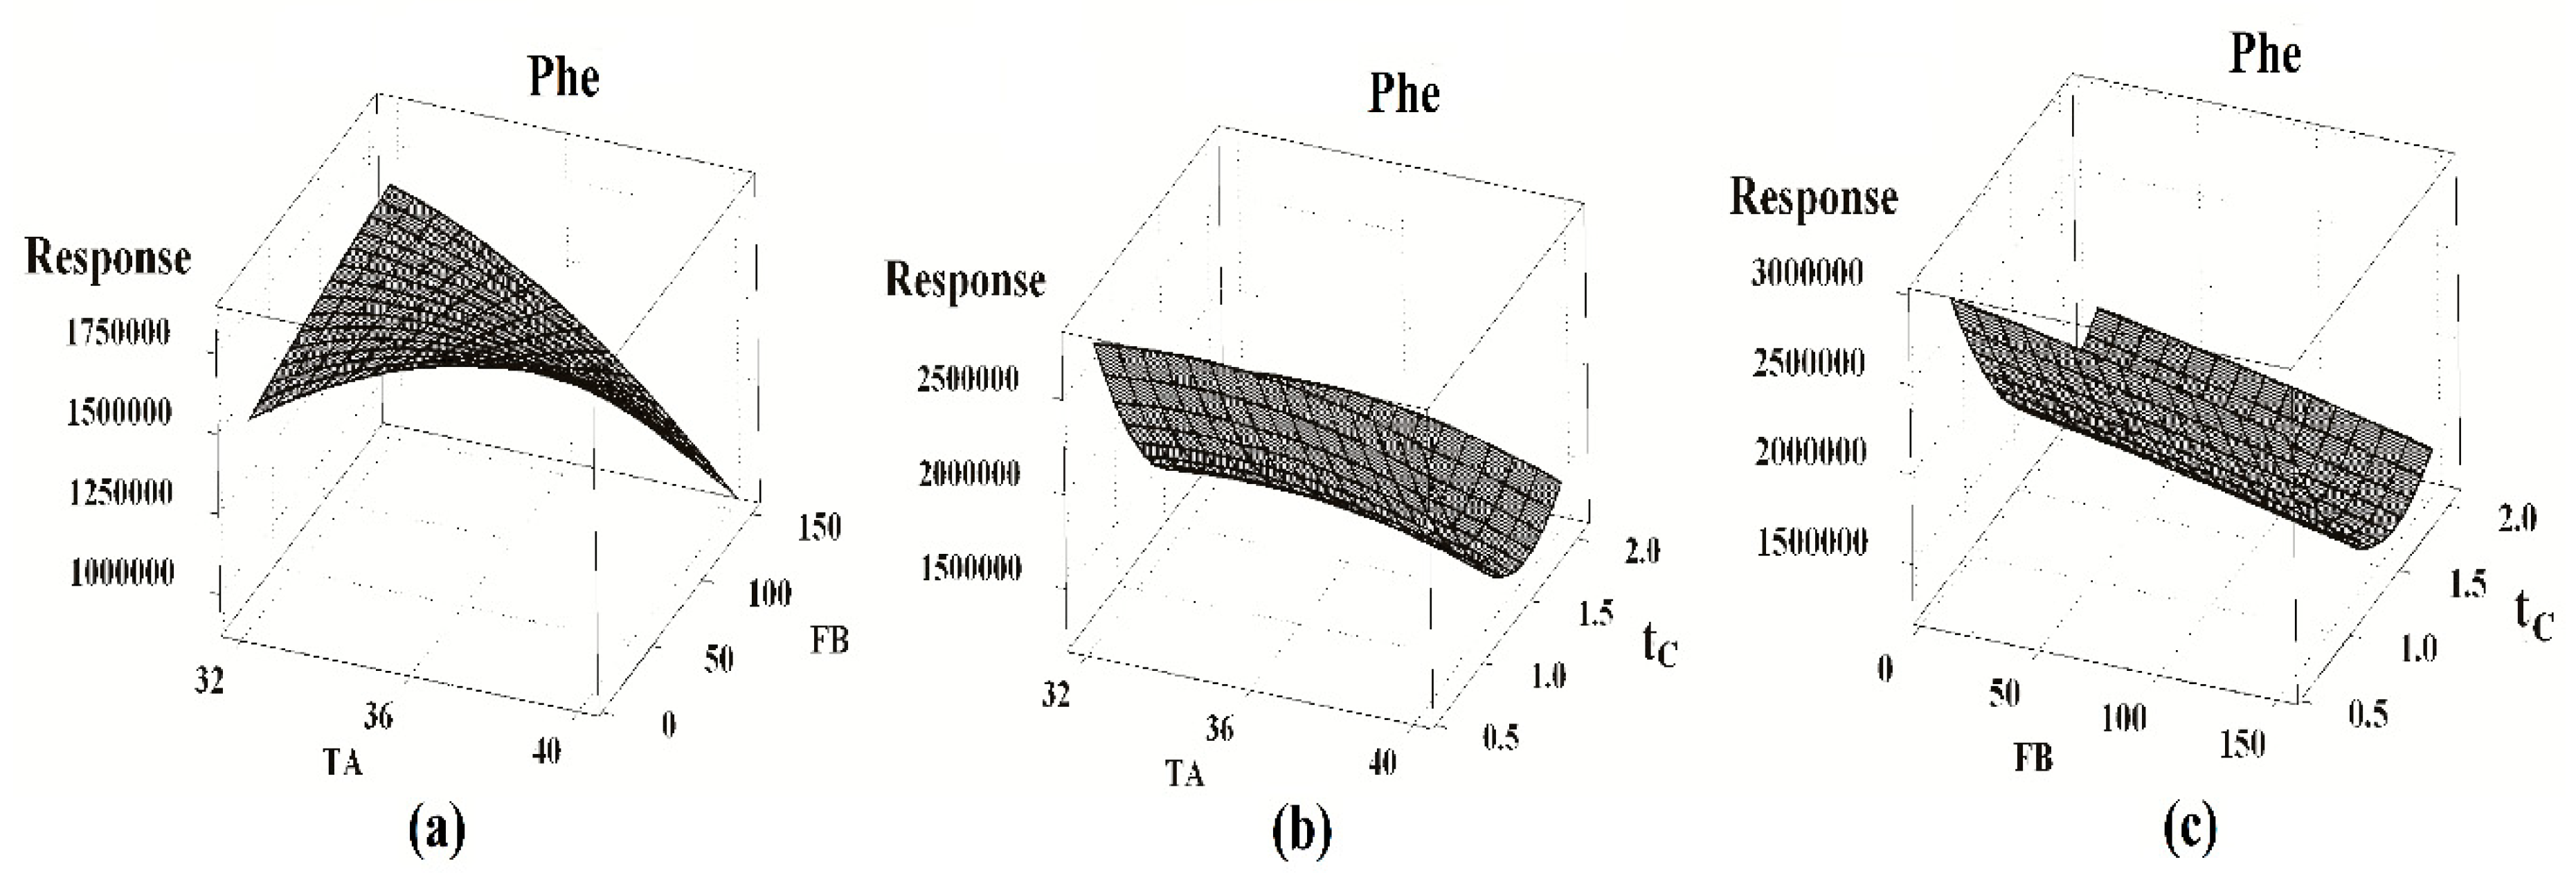
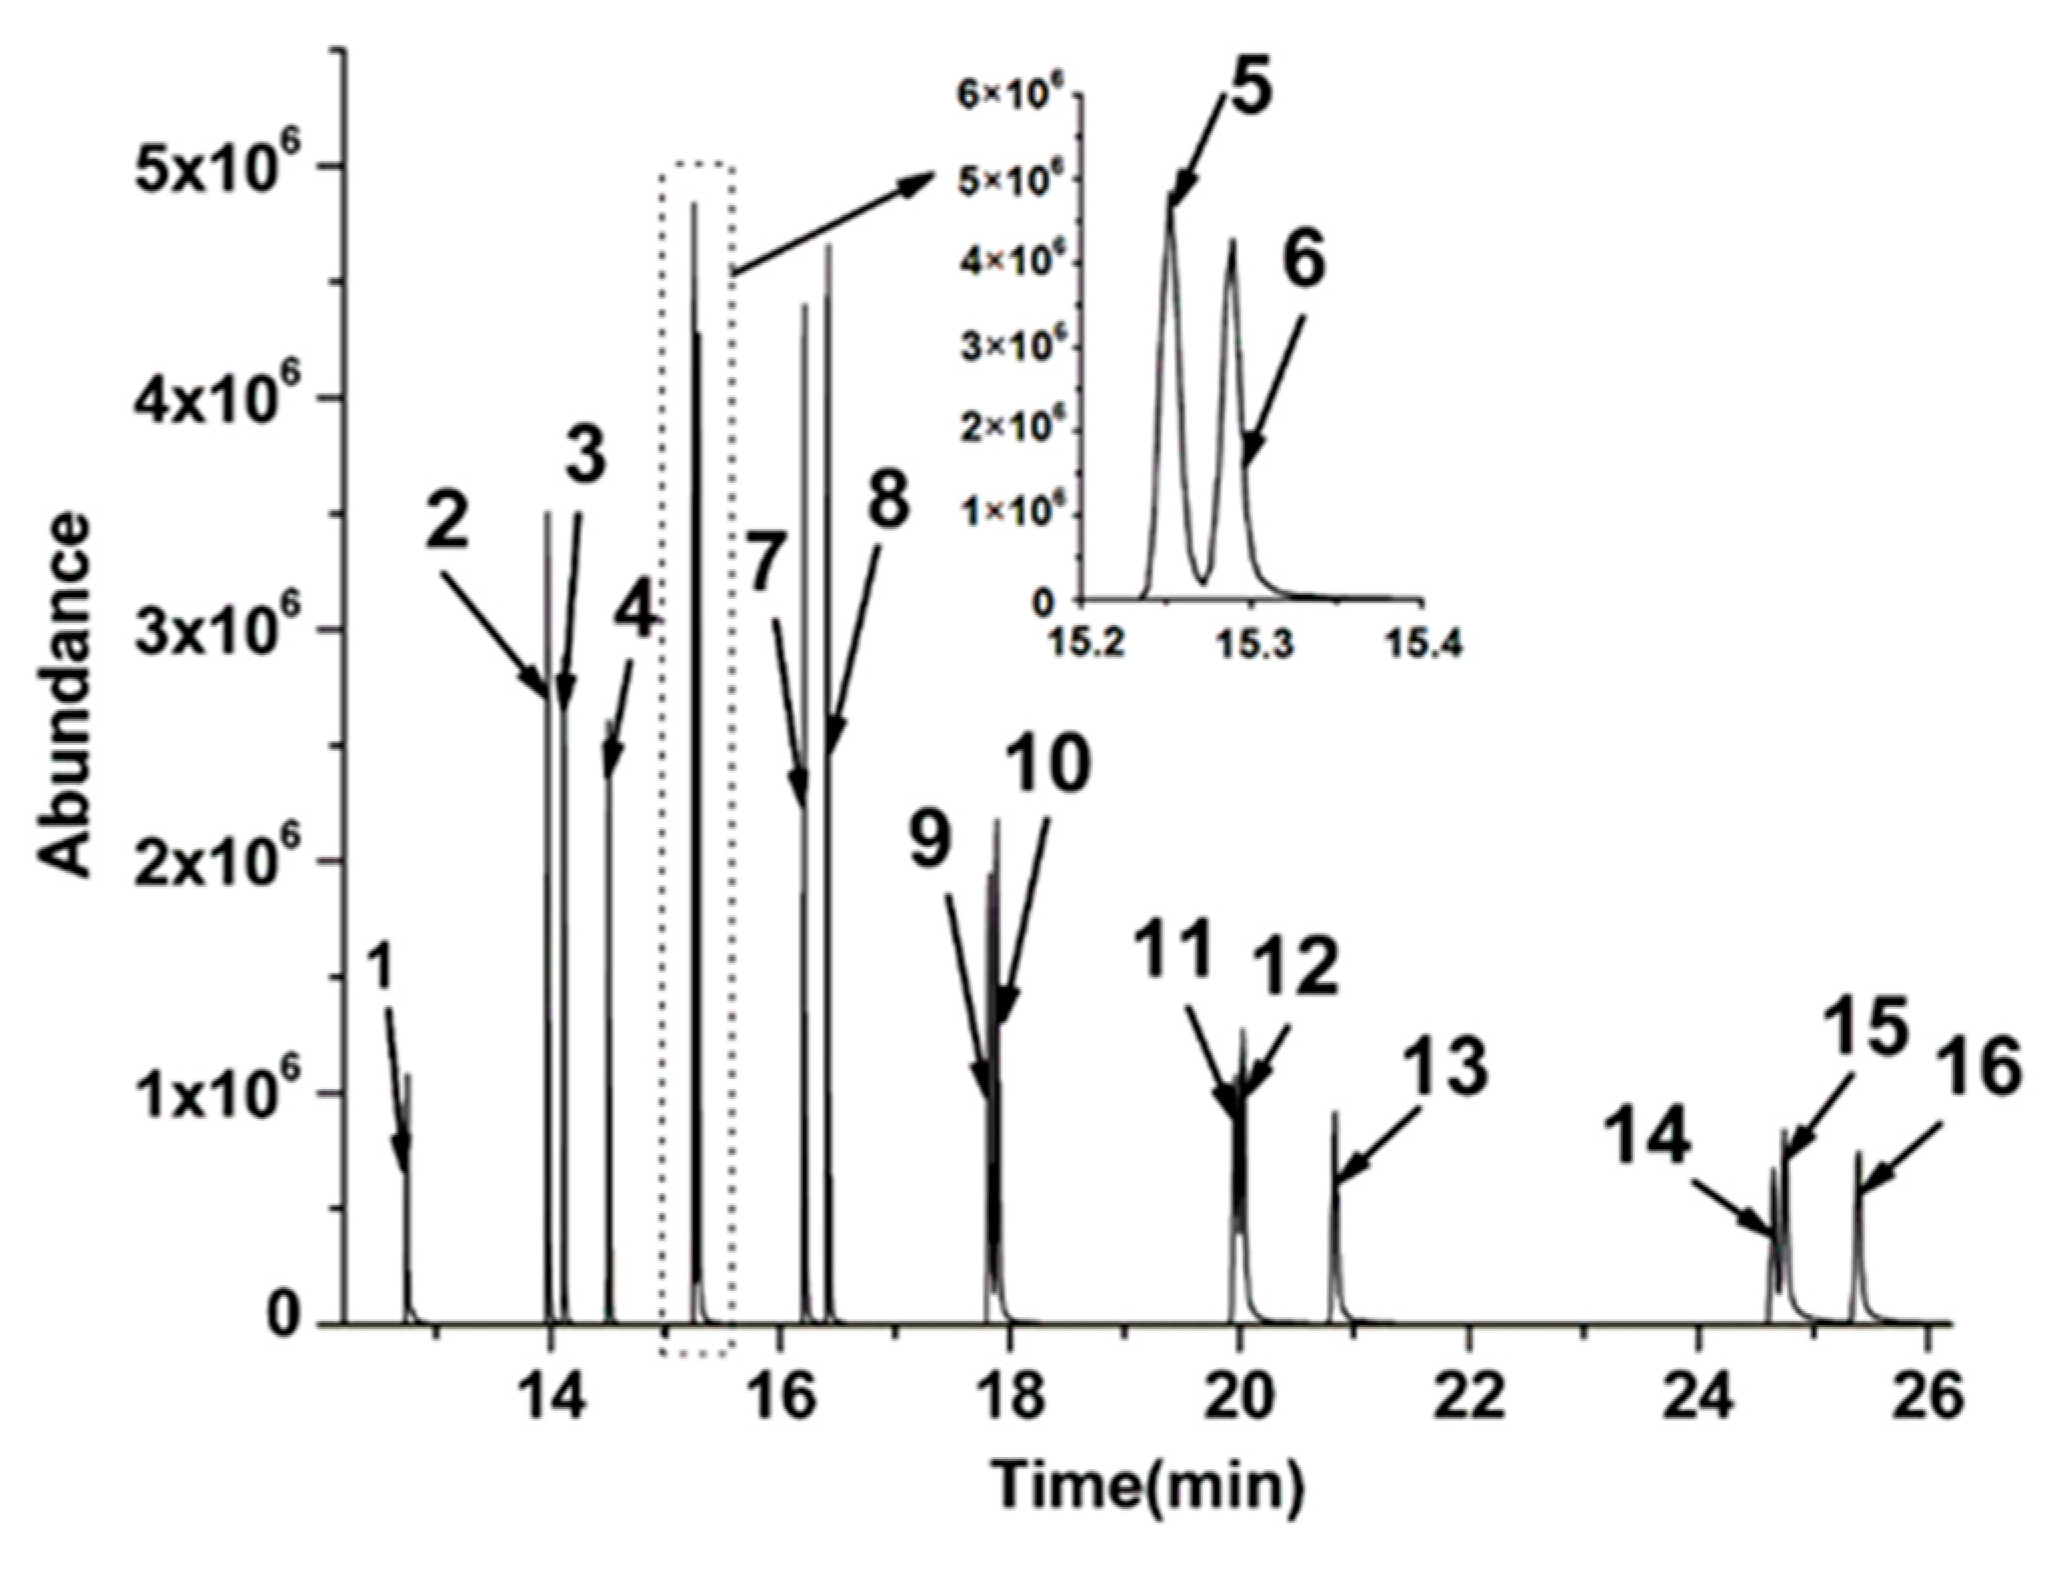
3.1. Optimization of the PTV-SV Injection

To determine the maximum values for the PTV-SV factors, CCI design was performed to estimate the response surfaces. This design used factor settings as the starting points and created factorial or fractional factorial design within the limits. Based upon the previous study [21] and our experience, TA, FB and tC were evaluated for their effects on PTV-SV injection. In this study, each CCI design model selected was composed of a two-cubed full factorial design that included eight cubed points, where six axial and six central points were added, for a total of 20 runs. The 16 PAH peak areas were set to be dependent variables and the three factors were used as input variables. The three factors and their levels are listed in Table 1. A 16-PAH mixed standard solution at a concentration of 100 ng mL−1 was used for these experiments. The experimental conditions designed and responses (chromatographic peak areas) obtained are presented in Table 2. As an example, Figure 1 shows the influence of TA, FB and tC on response surfaces for Phe (25 μL PTV-SV injection). It is obvious that the Phe response areas increase with an increase of TA, and decrease with decreases of FB and tC. Close inspections of Figure 1 and Table 2, however, show that the quantity of experimental data to be analyzed is considerably large when three parameters are optimized simultaneously. Thus, a statistical analysis method is used in the data process to improve the reliability of these results.
The data from the 25 μL injection volume are fitted to Equation (1) using a second-degree polynomial equation based on the least squares statistical method.
Y = b 0 + b A T A + b B F B + b C t C + b A B T A F B + b A C T A t C + b B C F B t C + b A A T A 2 + b B B F B 2 + b C C t C 2
where TA, FB and tC are the initial inlet temperature, the vaporization flow and the vaporization time, respectively, and bi, bij and bii are the fitting parameters.
The statistical significances of the regression coefficients were determined using the t-test (only significant coefficients with p-value< 0.05 were included). Statistical analysis of the fitted model equation above was checked using analysis of variance (ANOVA) at the 5% significance level. The ANOVA, regression coefficients and their significances in the fitted model are listed in Table 3.
The response optimizer in Minitab 15 (Minitab Inc., USA) was applied to maximize the composite desirability for the 16 PAHs. The optimization of composite desirability was performed using the Derringer’s desirability function in the Minitab optimizer [21]. The desirability was set to 0.0 and 1.0 for the lowest and highest responses, respectively, from the CCI designs. Because all the responses had the same importance, a composite desirability was obtained by calculating the geometric average desirability values for the 16 PAHs. The final optimized factors, results from individual desirability for the PAHs and the composite desirability, are provided in Table 4. The samples are introduced into the liner at an initial temperature of 38 °C for the 25 μL injection. The solvent is then vaporized for 0.6 min with the PTV injector temperature raised to 300 °C at a rate of 600 °C min−1 and vented through the split valve at a flow rate of 10 mL min−1. During the cleaning phase, the split valve keeps open for 5 min (50 mL min1) at a temperature of 300 °C for all the experiments. As an example, Figure 2 shows a PAH standard chromatogram at a concentration of 100 ng mL−1, where the separation of the 16 PAHs is achieved in a total analysis time of 30 min under the optimized PTV-SV injection conditions. The selected conditions for GC-MS in SIM mode are presented in Table 5. Validation of the optimum method from response surface design experiments was determined from six replicate measurements of the 100 ng mL1 standard solution under the final optimized conditions. The values of relative standard deviation (RSD) for the 16 PAHs range from 1.12%−6.07%, as listed in Table 6.

3.2. Method Validation

Using the SIM mode, the linearity of the injection method was determined from calibration plots obtained for three replicate analyses with standard solutions of 0.5, 5, 10, 50, 200 and 300 ng mL−1. The coefficient of determination (R2) for the 16 PAHs were obtained using linear least-squares regression. The correlation coefficients of the calibration plots for the 16 PAHs range from 0.9812–0.9998. The ANOVA of the calibration plots shows that there are no significant differences between the slopes of standard plots (p-value > 0.05). The results in Table 6 indicate that there are good linear relationships between peak areas and concentrations in the 0.5–300 ng mL−1 concentration range.
To evaluate the LOD and LOQ, the 0.5 ng mL−1 standard solution was injected and measured. The results in Table 7 show that for the 25 μL PTV injection, the LODs and LOQs range from 0.016–0.375 ng mL−1 and 0.055−1.25 ng mL−1, respectively. Under the same GC and MS conditions, 2 µL standard solution (0.5 ng mL−1) was analyzed using the conventional splitless-GC-MS-SIM method. From Table 7, it can be seen that the LODs and LOQs of the splitless-SIM method range from 0.256–11.811 ng mL−1 and 0.853–39.370 ng mL−1, respectively, much higher than those of the PTV-SIM method.
In this study, the recoveries associated with the pre-treatment procedure of the samples were evaluated. A known amount of the analyses at each of three concentrations (100, 50 and 4 ng mL−1) were added to the Teflon®-coated glass fiber filters and the PUF/XAD/PUF cartridges, respectively. The sample preparation procedure was described in Section 2.1, and three samples were prepared at each concentration. Figure 3 shows that the average recoveries range from 86.28%–108.35% for particle-phase PAHs and 71.83%–108.60% for gas-phase PAHs.

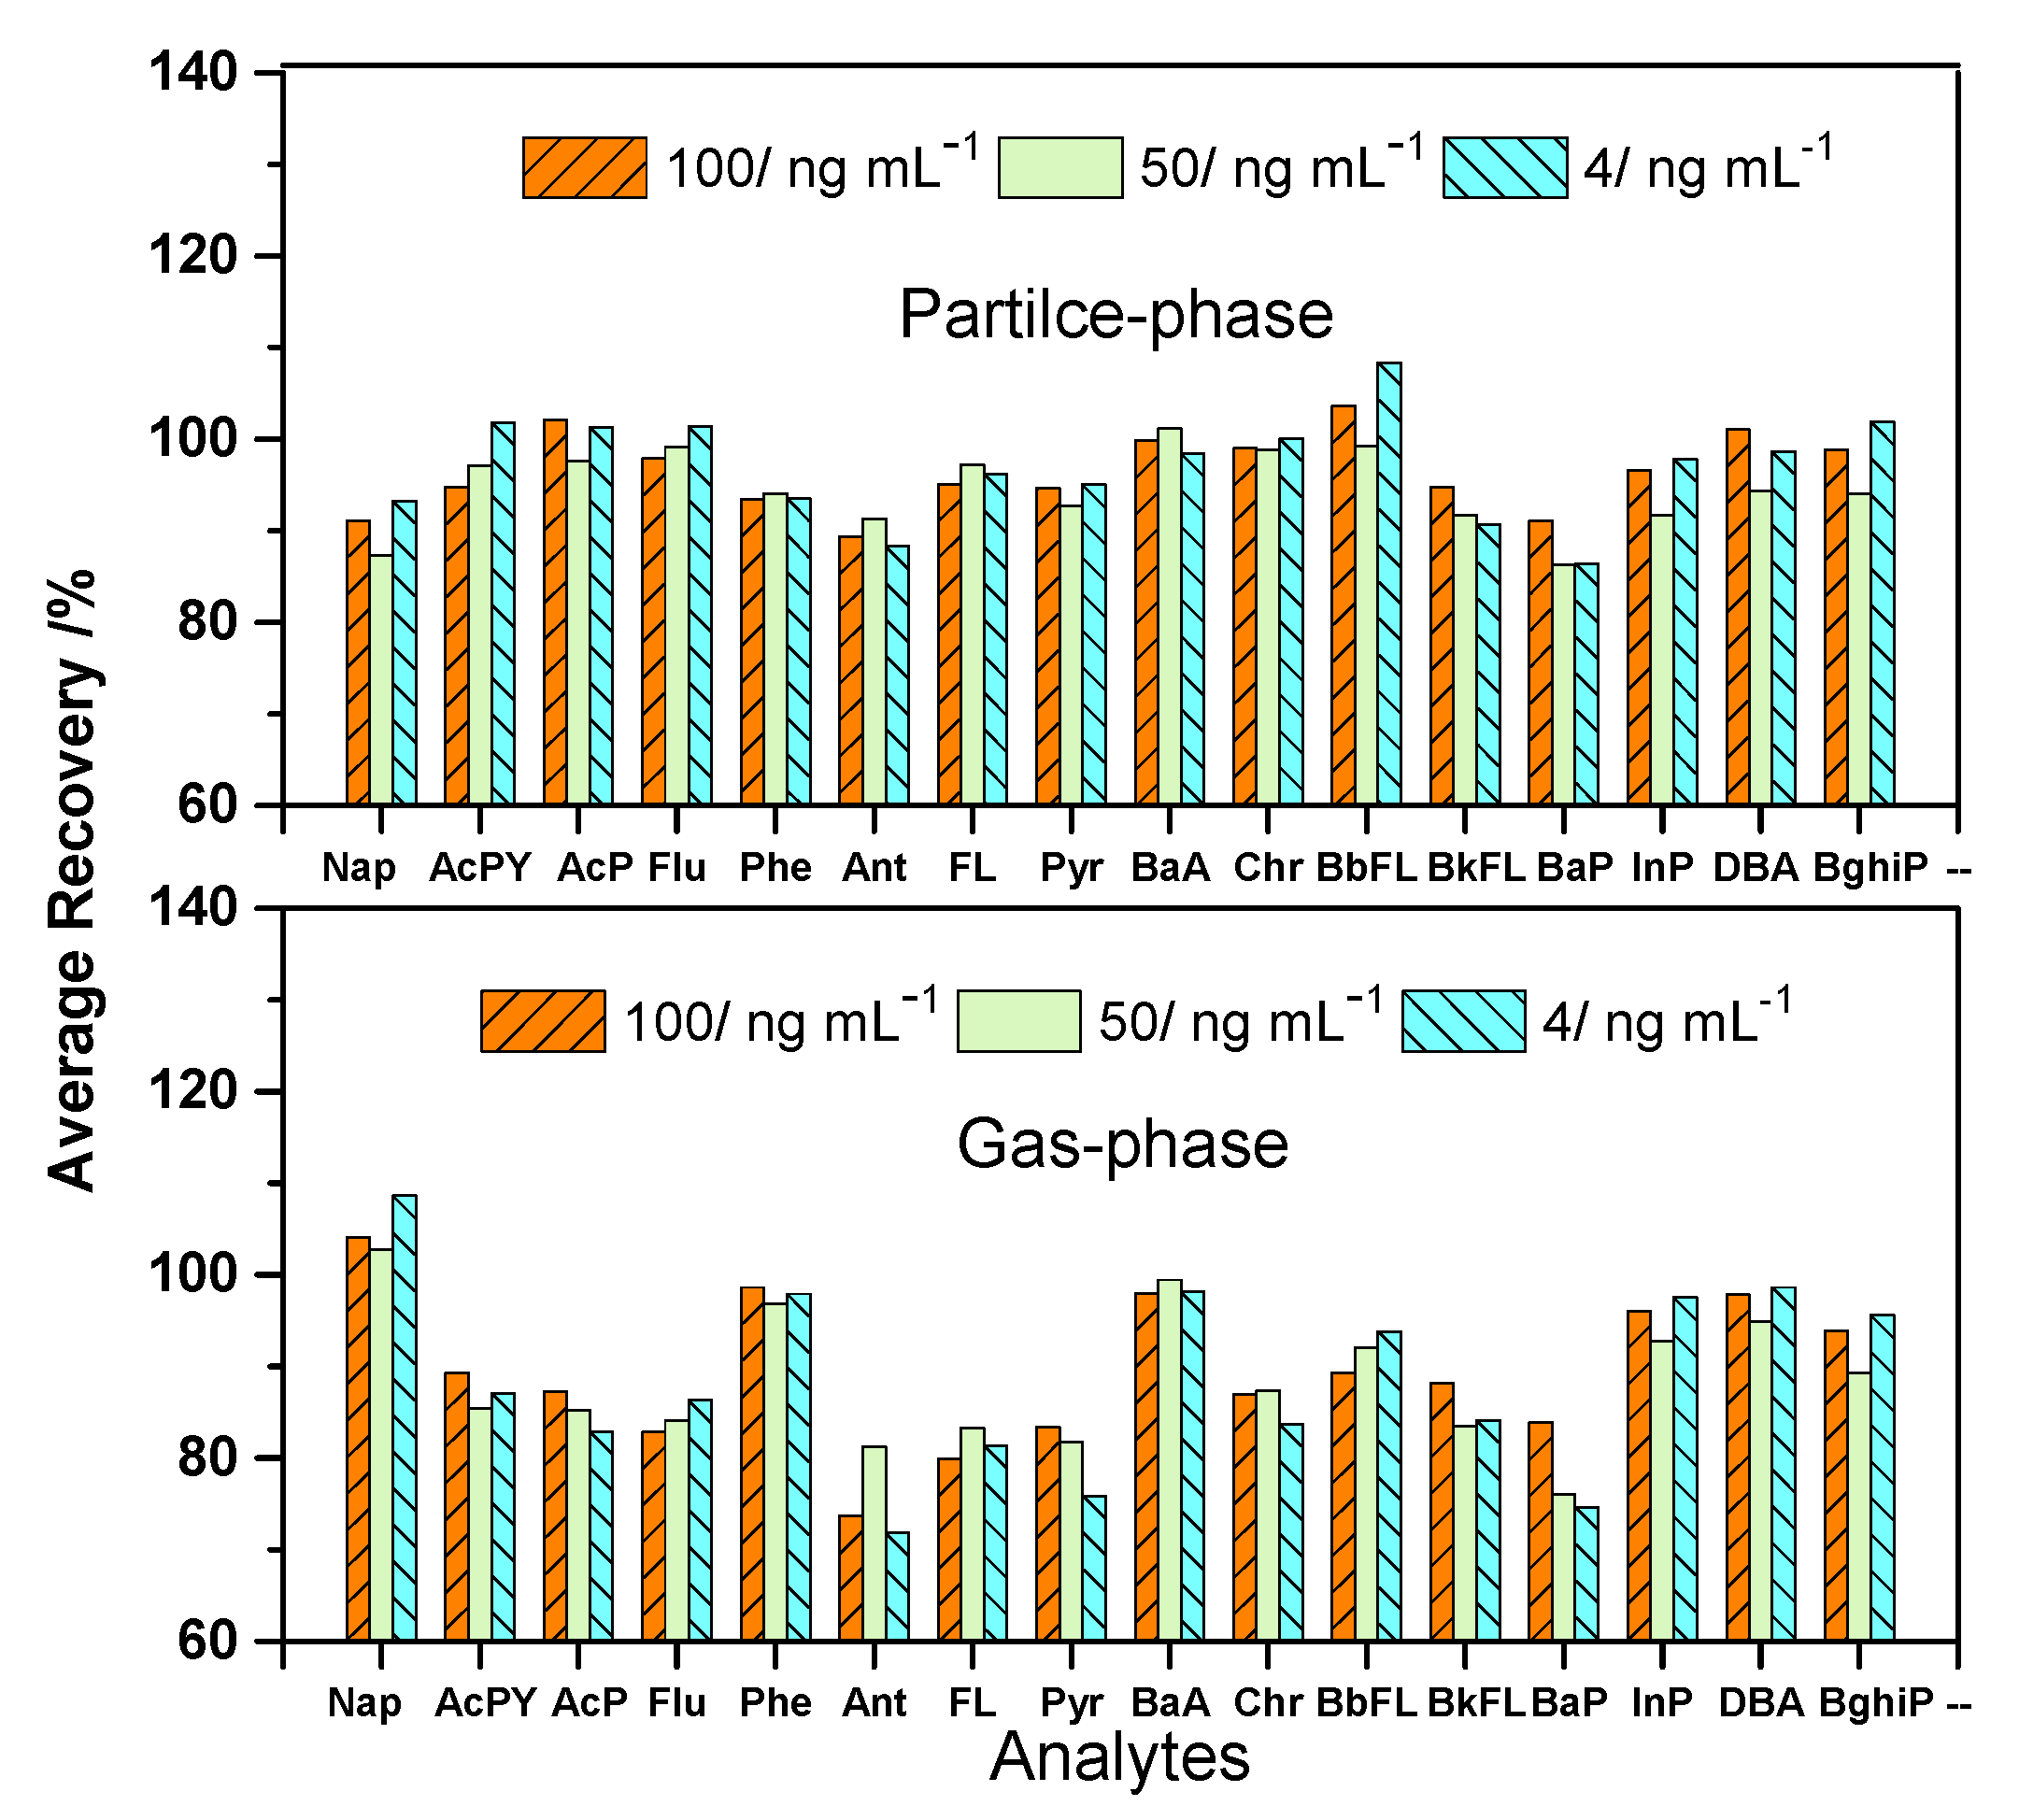
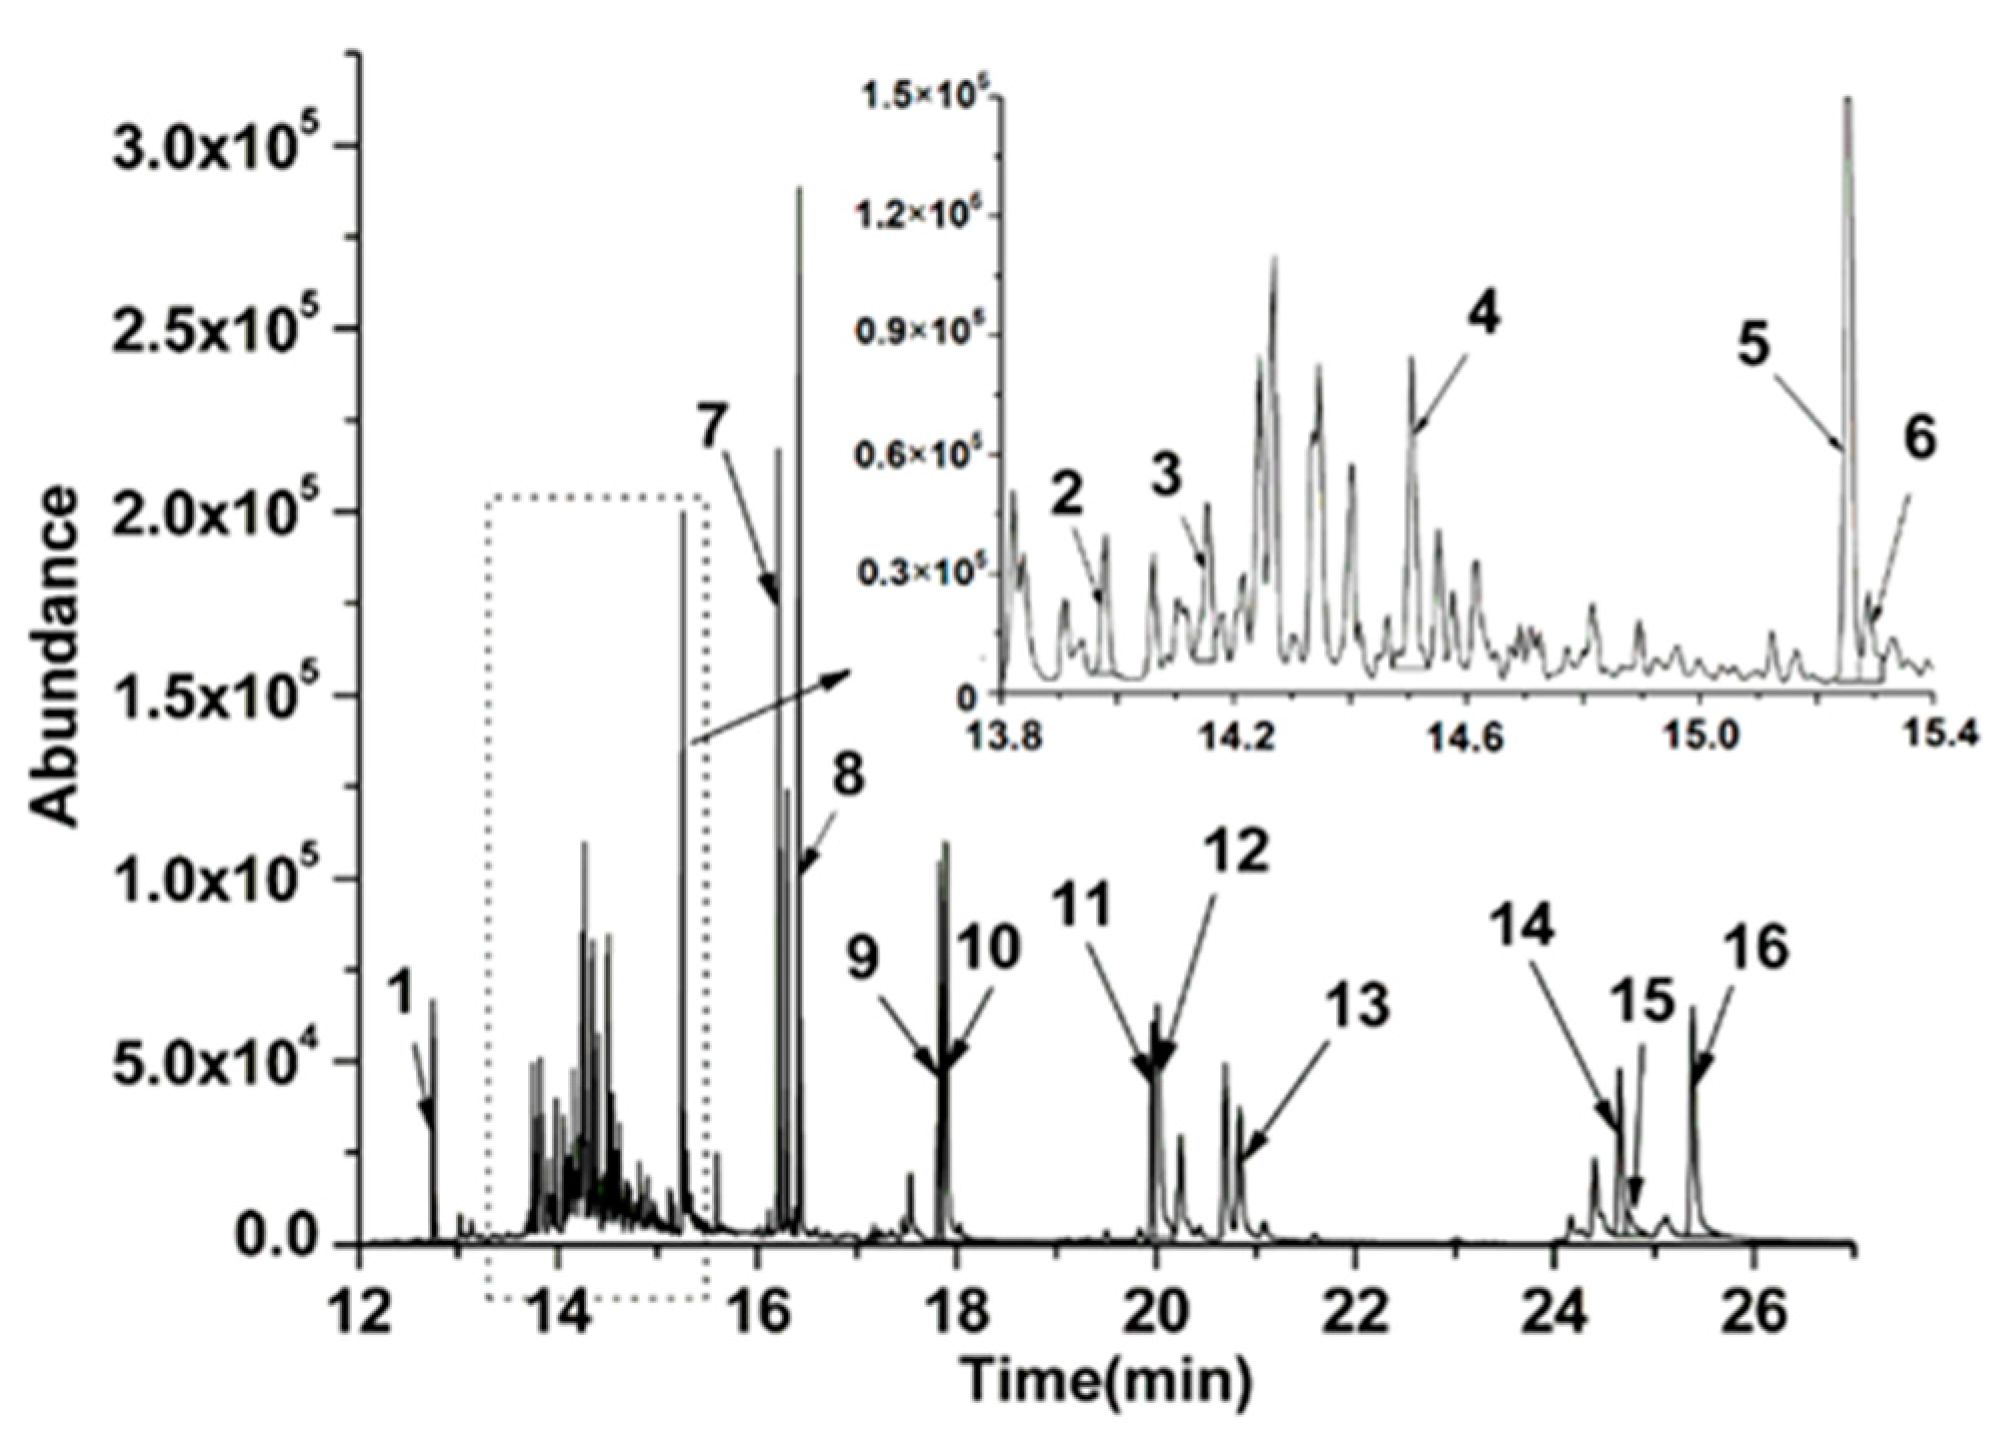
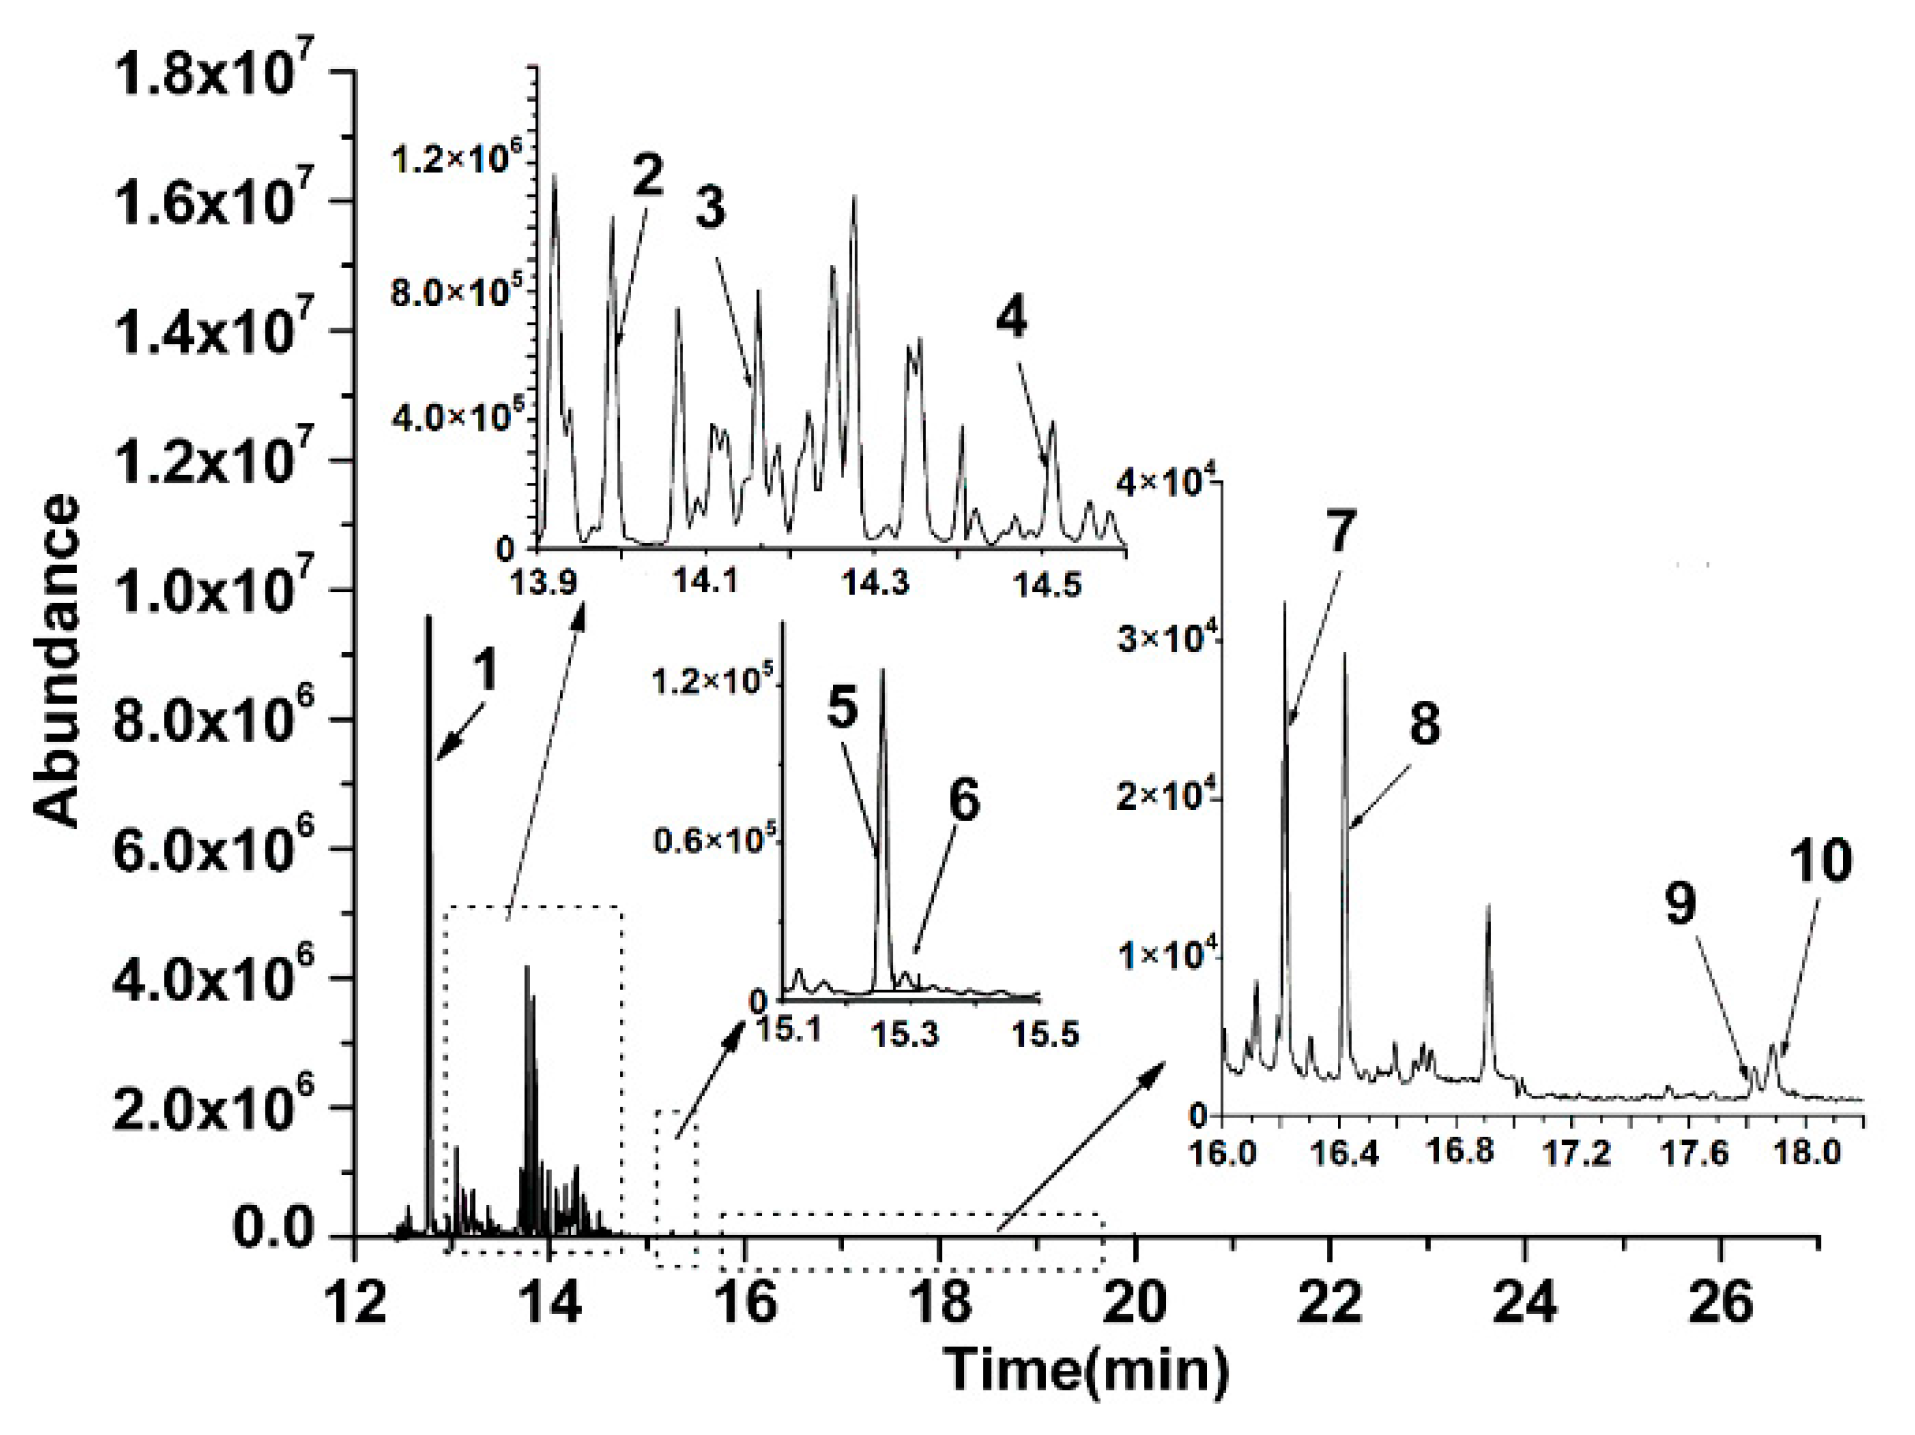
3.3. Analysis of the Real Sample

The optimized method with a PTV injection volume of 25 μL was used for the analysis of the real sample obtained by the total cylinder sampling system of the diesel engine. Figure 4 and Figure 5 show the total ion chromatograms in the SIM mode for the real particle-phase and gas-phase extracts, respectively. The 16 PAH peaks in the particle-phase extract are detected simultaneously and are well-separated, as shown in Figure 4. In the gas-phase extract, 10 PAHs are detected and separated. These phenomena indicate that the PTV-SV method can be used for the simultaneous identification and quantification of PAHs present in diesel combustion. Results obtained from the particle-phase and gas-phase extracts are listed in Table 8. The concentrations of the 16 PAHs in the particle-phase extracts range from 2.46−28.53 ng mL−1. The concentrations of the 10 PAHs in the gas-phase extracts range from 0.23−156.71 ng mL−1, while the concentrations of BbFL, BkFL, BaP, InP, DBA and BghiP are below their LOQs in the gas-phase sample.

4. Conclusions

The PTV-SV-GC-MS-SIM injection method has been optimized for the analysis of 16 PAHs using CCI design. The initial inlet temperature, vaporization flow and vaporization time are found to be statistically significant for the 25 μL PTV injection volume. After the optimization of the PTV injection factors, the initial temperature, vaporization flow and vaporization time are determined to be 38 °C, 10 mL min−1 and 0.6 min, respectively. Validation parameters for the optimized method, such as linearity, accuracy, LODs and LOQs, are satisfactory for the identification of the 16 PAHs. The PTV-SV method in the SIM mode is reliable for the simultaneous identification and quantification of particle-phase and gas-phase samples from diesel combustion.

Author Contributions

Conceptualization, Y.Q. and C.S.; methodology, Y.Q., C.S. and G.L.; software, Y.Q. and D.D.; validation, G.L.; formal analysis, Y.Q.; investigation, Y.Q. and X.L.; writing—original draft preparation, H.Z.; writing—review and editing, C.S. and G.L; supervision, C.S.

Funding

This research was funded by the National Natural Science Foundation of China (No. 91741127 and No.11575215) and the Program of Tianjin Science and Technology Plan (18PTZWHZ00170).

Conflicts of Interest

The authors declare no conflict of interest.

References

  1. Ballesteros, R.; Hernández, J.J.; Lyons, L.L. An experimental study of the influence of biofuel origin on particle-associated PAH emissions. Atmos. Environ. 2010, 44, 930–938. [Google Scholar] [CrossRef]
  2. Dobbins, R.A.; Fletcher, R.A.; Benner, B.A.; Hoeft, S. Polycyclic aromatic hydrocarbons in flames, in diesel fuels, and in diesel emissions. Combust. Flame 2006, 144, 773–781. [Google Scholar] [CrossRef]
  3. Yilmaz, N.; Davis, S.M. Polycyclic aromatic hydrocarbon (PAH) formation in a diesel engine fueled with diesel, biodiesel and biodiesel/n-butanol blends. Fuel 2016, 181, 729–740. [Google Scholar] [CrossRef]
  4. Ge, J.C.; Kim, H.Y.; Yoon, S.K.; Choi, N.J. Reducing volatile organic compound emissions from diesel engines using canola oil biodiesel fuel and blends. Fuel 2018, 218, 266–274. [Google Scholar] [CrossRef]
  5. Furuhata, T.; Kobayashi, Y.; Hayashida, K.; Arai, M. Behavior of PAHs and PM in a Diffusion Flame of Paraffin Fuels. Fuel 2012, 91, 16–25. [Google Scholar] [CrossRef]
  6. Ying, Y.Y.; Xu, C.X.; Liu, D.; Jiang, B.; Wang, P.F.; Wang, W. Nanostructure and Oxidation Reactivity of Nascent. Energies Soot Particles in Ethylene/Pentanol Flames. Energies 2017, 10, 122. [Google Scholar] [CrossRef] [Green Version]
  7. Meng, Z.M.; Li, J.S.; Fang, J.; Tan, J.; Qin, Y.; Jiang, Y.; Qin, Z.; Bai, W.L.; Liang, K. Experimental study on regeneration performance and particle emission characteristics of DPF with different inlet transition sections lengths. Fuel 2019, 262, 116487. [Google Scholar] [CrossRef]
  8. Meng, Z.M.; Chen, C.; Li, J.S.; Fang, J.; Tan, J.; Qin, Y.; Jiang, Y.; Qin, Z.; Bai, W.L.; Liang, K. Particle emission characteristics of DPF regeneration from DPF regeneration bench and diesel engine bench measurements. Fuel 2019, 262, 116589. [Google Scholar] [CrossRef]
  9. Sánchez, N.E.; Salafranca, J.; Callejas, A.; Millera, Á.; Bilbao, R.; Alzueta, M.U. Quantification of polycyclic aromatic hydrocarbons (PAHs) found in gas and particle phases from pyrolytic processes using gas chromatography–mass spectrometry (GC–MS). Fuel 2013, 107, 246–253. [Google Scholar] [CrossRef] [Green Version]
  10. Dandajeh, H.A.; Talibi, M.; Ladommatos, N.; Hellier, P. Influence of combustion characteristics and fuel composition on exhaust PAHs in a compression ignition engine. Energies 2019, 12, 2575. [Google Scholar] [CrossRef] [Green Version]
  11. Wang, X.W.; Song, C.L.; Lv, G.; Song, J.O.; Li, H.; Li, B. Evolution of in-cylinder polycyclic aromatic hydrocarbons in a diesel engine fueled with n-heptane and n-heptane/toluene. Fuel 2015, 158, 322–329. [Google Scholar] [CrossRef]
  12. Patel, K.; Fussell, R.J.; Goodall, D.M.; Keely, B.J. Application of programmable temperature vaporisation injection with resistive heating-gas chromatography flame photometric detection for the determination of organophosphorus pesticides. J. Sep. Sci. 2006, 29, 90–95. [Google Scholar] [CrossRef] [PubMed]
  13. Combs, M.T.; Noe, O. Use of a PTV injector to achieve inverse-large volume injection: Injection of volatile analytes in a semi-volatile solvent. J. Sep. Sci. 2001, 24, 291–296. [Google Scholar] [CrossRef]
  14. Bordajandi, L.R.; Dabrio, M.; Ulberth, F.; Emons, H. Optimisation of the GC-MS conditions for the determination of the 15 EU foodstuff priority pollycyclic aromatic hydrocarbons. J. Sep. Sci. 2008, 31, 1769–1778. [Google Scholar] [CrossRef] [PubMed]
  15. Lin, S.L.; Lee, W.J.; Lee, C.F.F.; Wu, Y.P. Reduction in emissions of nitrogen oxides, particulate matter, and polycyclic aromatic hydrocarbon by adding water-containing butanol into a diesel-fueled engine generator. Fuel 2012, 93, 364–372. [Google Scholar] [CrossRef]
  16. Maricq, M.M. Chemical characterization of particulate emissions from diesel engines: A review. J. Aerosol Sci. 2007, 38, 1079–1118. [Google Scholar] [CrossRef]
  17. Poster, D.L.; Schantz, M.M.; Sander, L.C.; Wise, S.A. Analysis of polycyclic aromatic hydrocarbons (PAHs) in environmental samples: A critical review of gas chromatographic (GC) methods. Anal. Bioanal. Chem. 2006, 386, 859–881. [Google Scholar] [CrossRef]
  18. Hoh, E.; Mastovska, K. Large volume injection techniques in capillary gas chromatography. J. Chromatogr. A 2008, 1186, 2–15. [Google Scholar] [CrossRef]
  19. Pérez Pavón, J.L.; del Nogal Sánchez, M.; Fernández Laespada, M.E.; Moreno Cordero, B. Determination of aromatic and polycyclic aromatic hydrocarbons in gasoline using programmed temperature vaporization-gas chromatography–mass spectrometry. J. Chromatogr. A 2008, 1202, 196–202. [Google Scholar] [CrossRef]
  20. Bruno, P.; Caselli, M.; de Gennaro, G.; Tutino, M. Determination of polycyclic aromatic hydrocarbons (PAHs) in particulate matter collected with low volume samplers. Talanta 2007, 72, 1357–1361. [Google Scholar] [CrossRef]
  21. Crimmins, B.S.; Baker, J.E. Improved GC/MS methods for measuring hourly PAH and nitro-PAH concentrations in urban particulate matter. Atmos. Environ. 2006, 40, 6764–6779. [Google Scholar] [CrossRef]
  22. Drabova, L.; Pulkrabova, J.; Kalachova, K.; Tomaniova, M.; Kocourek, V.; Hajslova, J. Rapid determination of polycyclic aromatic hydrocarbons (PAHs) in tea using two-dimensional gas chromatography coupled with time of flight mass spectrometry. Talanta 2012, 100, 207–216. [Google Scholar] [CrossRef] [PubMed]
  23. Song, J.O.; Song, C.L.; Tao, Y.; Lv, G.; Dong, S.R. Diesel soot oxidation during the late combustion phase. Combust. Flame 2011, 158, 446–451. [Google Scholar] [CrossRef]
Figure 1. Influence of initial inlet temperature (TA), vaporization flow (FB) and vaporization time (tC) on response surfaces for 25 µL Phe injection: (a) Influence of TA and FB on response surfaces at tC = 1.32 min; (b) Influence of TA and tC on response surfaces at FB = 80 mL min−1; (c) Influence of FB and tC on response surfaces at TA = 36 °C.
Energies 12 04791 g001
Figure 2. Gas chromatograph mass spectrometry (GC-MS) chromatogram of a 100 ng mL−1 polycyclic aromatic hydrocarbon (PAH) standard sample after optimization. 1. Nap; 2. AcPY; 3. AcP; 4. Flu; 5. Phe; 6. Ant; 7. FL; 8. Pyr; 9. BaA; 10. Chr; 11. BbFL; 12. BkFL; 13. BaP; 14. InP; 15. DBA; 16. BghiP.
Energies 12 04791 g002
Figure 3. Average recoveries for particle-phase PAHs and gas-phase PAHs.
Energies 12 04791 g003
Figure 4. Chromatogram of the particle-phase extracts in SIM mode. 1. Nap; 2. AcPY; 3. AcP; 4. Flu; 5. Phe; 6. Ant; 7. FL; 8. Pyr; 9. BaA; 10. Chr; 11. BbFL; 12. BkFL; 13. BaP; 14. InP; 15. DBA; 16. BghiP.
Energies 12 04791 g004
Figure 5. Chromatogram of the gas-phase extracts in SIM mode. 1. Nap; 2. AcPY; 3. AcP; 4. Flu; 5. Phe; 6. Ant; 7. FL; 8. Pyr; 9. BaA; 10. Chr.
Energies 12 04791 g005
Table 1. Factors and corresponding levels for the programmed temperature vaporization (PTV) injection systems.
FactorLevels 1
−1−1/α0+1/α+1
Inlet Temperature (°C)3234363840
Vaporization Flow (mL min−1)103880122150
Vaporization Time (min)0.60.891.321.752.04
1 The α value is 1.68.
Table 2. Experimental conditions designed and responses (chromatographic peak areas × 106) obtained using the CCI design.
TA (°C)3438343834383438324036363636363636363636
FB (mL min−1)383812212238381221228080101508080808080808080
tC (min)0.890.890.890.891.751.751.751.751.321.321.321.320.62.041.321.321.321.321.321.32
Analytesm/zResponses (chromatographic peak areas × 106)
Nap1280.440.400.420.330.410.340.420.360.390.450.570.451.070.360.420.360.510.310.530.36
AcPY1520.810.540.460.400.570.320.350.350.50.401.060.391.510.370.510.430.490.250.510.41
AcP1530.720.480.380.320.480.260.280.270.410.300.940.301.390.290.420.350.390.210.390.33
Flu1661.080.980.890.630.860.650.610.490.770.651.200.651.820.550.790.650.810.510.830.64
Phe1781.942.021.971.421.781.591.541.231.571.661.821.593.291.331.721.371.851.291.911.42
Ant1782.382.382.421.952.271.992.051.772.052.152.212.043.711.872.241.842.311.672.381.95
FL2022.502.692.742.242.462.302.552.142.212.652.162.504.112.142.521.972.711.972.832.18
Pyr2022.712.922.922.402.662.482.712.252.392.842.352.694.422.292.692.132.922.113.032.35
BaA2281.111.331.451.191.171.151.521.291.051.550.881.392.341.171.320.891.440.971.581.08
Chr2282.332.893.072.632.632.603.212.612.363.252.093.014.282.612.641.923.092.063.222.25
BbFL2520.941.211.300.980.971.071.391.090.861.390.711.252.070.981.110.741.300.931.420.91
BkFL2522.082.402.572.172.132.102.722.331.912.711.622.483.952.212.351.662.571.812.771.95
BaP2520.891.151.231.071.001.091.311.030.941.30.751.292.051.041.020.761.210.851.490.96
InP2760.540.780.840.560.570.680.910.660.480.880.390.791.400.550.650.400.810.570.890.5
DBA2781.271.481.591.251.311.271.651.531.091.680.861.622.471.171.370.861.531.051.651.09
BghiP2761.211.541.591.271.251.341.781.311.081.510.901.542.541.251.460.881.571.061.741.14
Table 3. Analysis of Variance (ANOVA), regression coefficients and their significances in the fitted model of the 16 PAH peak areas.
TermsNapAcPYAcPFluPheAntFLPyr
EstimatePEstimatePEstimatePEstimatePEstimatePEstimatePEstimatePEstimateP
Intercept429023<0.01500533<0.01358092<0.01699564<0.011597255<0.012114094<0.012428690<0.012622292<0.01
TA−113700.792−709790.046−522800.022−651250.029−602250.05−623070.441−101330.916−139370.893
FB−202220.64−1328990.013−129867<0.001−139076<0.001−1135850.016−817490.318221980.81762840.951
tC−916610.053−1854950.006−180795<0.001−227695<0.001−3302100.001−3047920.003−2953290.01−3249280.009
FB×FB−34210.935498390.444499610.05397630.034-50030.199−217320.820−726580.444−792670.437
tC×tC684480.1241270190.1421262110.0221324530.026168360.6142131580.0262288800.0452167560.051
TA×FB−45720.914430700.277484270.164−76680.886−982240.047−584930.577−1183890.356−1243370.367
ANOVA of ModelFPFPFPFPFPFPFPFP
5.940.0259.780.0014.840.0256.070.0136.000.02711.200.0043.890.0656.250.023
TermsBaAChrBbFLBkFLBaPInPDBABghiP
EstimatePEstimatePEstimatePEstimatePEstimatePEstimatePEstimatePEstimateP
Intercept1313721<0.012811816<0.011123014<0.012316300<0.011119073<0.01684561<0.011385816<0.011295837<0.01
TA404450.556711990.505459820.487631930.542375830.534362770.477503300.529256310.723
FB1142360.1161917300.0921094450.1161854560.0941047200.103786000.1411447400.091236000.109
tC−1400960.061−1952450.087−1282970.072−2106110.062−1182430.07−971840.076−1471870.085−1547540.052
FB×FB−875260.205−1317220.218−691400.291−1292540.214−616060.303−446880.372−665940.396-412460.56
tC×tC1314320.0691844270.0951221860.0772339960.0371232150.055908840.0861405010.0911978520.016
TA×FB−852100.349−1968200.174−1244870.166−1333860.332−995420.221−1085600.122−778060.458−1505450.132
ANOVA of ModelFPFPFPFPFPFPFPFP
5.070.0382.830.1124.420.0515.130.0384.130.0584.090.0595.170.0379.010.008
Table 4. Optimized factor, individual and composite desirability for the 16 PAHs.
FactorInlet Temperature (°C)Optimum
38
Vaporization Flow (mL min−1)10
Vaporization Time (min)0.6
AnalytesNapAcPYAcPFluPheAntFLPyr
Desirability (%)0.600.770.890.9710.910.990.85
AnalytesBaAChrBbFLBkFLBaPInPDBABghiP
Desirability0.690.880.830.870.770.890.740.97
Composite Desirability0.85
Table 5. GC-MS-SIM mode conditions for the studied PAHs.
AnalytesQuantification ion (m/z)Retention Time (min)AnalytesQuantification ion (m/z)Retention Time (min)
Nap12812.75BaA22817.87
AcPY15213.98Chr22817.92
AcP15314.16BbFL25219.96
Flu16614.51BkFL25220.05
Phe17815.24BaP25220.68
Ant17815.29InP27624.66
FL20216.23DBA27824.75
Pyr20216.41BghiP27625.40
Table 6. Repeatabilities for the PTV method.
NO.AnalytesRSD (%)NO.AnalytesRSD (%)
1Nap6.079BaA1.8
2AcPY2.8510Chr1.22
3AcP2.9911BbFL1.35
4Flu2.0812BkFL1.64
5Phe1.3413BaP2.11
6Ant1.2214InP1.93
7FL1.1915DBA3.77
8Pyr1.1216BghiP3.89
Table 7. Calibration plot regression equations, LODs and LOQs for the PTV and splitless methods.
PTV-SV-GC-MS-SIM MethodSplitless-GC-MS-SIM Method
AnalytesRegression Equation
y = ax + b
Coefficient of Determination (R2)Linear Range (ng mL−1)LOD
(ng mL−1)
LOQ
(ng mL−1)
LOD
(ng mL−1)
LOQ
(ng mL−1 )
Napy = 27455340x − 2884800.99490.5–3000.0820.2720.5921.974
AcPYy = 47113309x − 6178050.99230.5–3000.0380.1260.3441.148
AcPy = 39117183x − 3554520.99570.5–3000.0490.1621.3224.405
Fluy = 37767418x − 3357430.99750.5–3000.0720.2421.9486.494
Phey = 60532000x − 6964910.99640.5–3000.0230.0760.5961.988
Anty = 61253701x − 3570540.99870.5–3000.0380.1261.0203.401
FLy = 64609682x − 5473000.99760.5–3000.0160.0550.2560.853
Pyry = 68056260x − 5189690.9980.5–3000.0320.1060.5871.957
BaAy = 47673273x − 8222500.99250.5–3000.0670.2231.0353.448
Chry = 57229694x − 2508600.99980.5–3000.0660.2210.9593.195
BbFLy = 40717605x − 7835540.98950.5–3000.3751.251.6765.587
BkFLy = 59435860x + 4446870.99930.5–3000.3261.0871.2554.184
BaPy = 45868925x − 7787090.99290.5–3000.2880.9625.88219.608
InPy = 31717730x − 7417310.98120.5–3000.2630.8777.16023.866
DBAy = 63091354x − 11336270.99260.5–3000.3131.04211.81139.370
BghiPy = 50702721x − 7427590.99640.5–3000.1830.6110.83036.101
Table 8. Concentrations of PAHs in the real sample.
AnalytesSample (ng mL−1)
Particle-phaseRSD (%)Gas-phaseRSD (%)
Nap19.774.33156.713.55
AcPY5.115.7723.424.84
AcP5.363.5721.555.54
Flu11.1811.4715.311.48
Phe18.2912.295.792.79
Ant2.4613.440.5812.76
FL16.663.270.979.77
Pyr21.384.130.748.98
BaA23.5812.060.2313.41
Chr21.4211.730.4110.97
BbFL22.148.03--
BkFL18.9811.53--
BaP16.5710.12--
InP27.135.39--
DBA3.1512.74--
BghiP28.533.72--

