Article

A Review on the Meandering of Wind Turbine Wakes

by
Xiaolei Yang
1,2 and
Fotis Sotiropoulos
1,*
1
Department of Civil Engineering, College of Engineering and Applied Sciences, Stony Brook University, Stony Brook, NY 11790, USA
2
The State Key Laboratory of Nonlinear Mechanics, Institute of Mechanics, Chinese Academy of Sciences, Beijing 100190, China
*
Author to whom correspondence should be addressed.
Energies 2019, 12(24), 4725; https://doi.org/10.3390/en12244725
Submission received: 3 November 2019 / Revised: 27 November 2019 / Accepted: 5 December 2019 / Published: 11 December 2019
(This article belongs to the Section A3: Wind, Wave and Tidal Energy)

Abstract

:
Meandering describes the large-scale, low frequency motions of wind turbine wakes, which could determine wake recovery rates, impact the loads exerted on turbine structures, and play a critical role in the design and optimal control of wind farms. This paper presents a comprehensive review of previous work related to wake meandering. Emphasis is placed on the origin and characteristics of wake meandering and computational models, including both the dynamic wake meandering models and large-eddy simulation approaches. Future research directions in the field are also discussed.

Graphical Abstract

1. Introduction

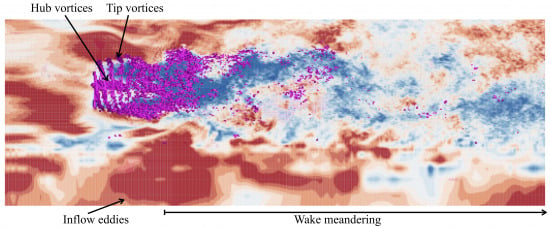
Meandering is a natural phenomenon, which manifests itself in both erosional and depositional systems, in the form of slow lateral motions of river beds, as well as in the atmospheric boundary layer, in the form of low frequency, large-scale, energetic motions of wind turbine wakes (see Figure 1). Because of wake meandering, downwind turbines in a wind farm will encounter the wake of upwind turbines aperiodically in time. Such large-scale coherent fluctuations could cause increased turbulence levels and impart structural loads that could impact turbine structural integrity and increase the levelized cost of energy. Wake meandering can be influenced by, among others, large-scale eddies in the atmosphere, site-specific effects, turbine-induced turbulence coherent structures, and flow instabilities. The specific roles and interactions among these different factors and their combined effect in giving rise to the phenomenon of wake meandering are not yet fully understood. In this paper, we review current knowledge of and ongoing research on wake meandering, focusing on the computational models for wake meandering and the physics of this phenomenon as derived from recent computational and experimental studies. For a general review on turbulent flows in wind farms, readers can refer to the paper by Stevens and Meneveau [1].
Wake meandering was observed in early studies because the time-averaged wake velocity deficits observed in the field were often smaller than the corresponding instantaneous centerline velocity values, as documented in theoretical predictions [4] and wind tunnel experiments [5]. In [4,5,6], wake meandering was attributed to the temporal variation of the freestream wind direction. To account for the effects of wake meandering, wake deficit corrections were proposed, such as the relation employed by Ainslie [5], i.e., Δ U = Δ U 0 1 + 7.12 σ θ x / r w 1 / 2 , where Δ U 0 is the centerline velocity deficit without correction, r w is the wake width, σ θ is the standard deviation of wind direction fluctuations, and x is the downwind distance from the turbine, and the relation proposed by Hogstrom et al. [7], i.e., Δ U = Δ U 0 σ r / σ r 2 + σ c 2 , where σ r is the standard deviation of velocity deficit Δ U / U ( U is the free stream incoming velocity) and σ c is the standard deviation of wake centerline fluctuations. In the relation proposed by Hogstrom et al. [7], it was assumed that the velocity deficit distribution without wake meandering is Gaussian and the distribution of wake centerline fluctuations is Gaussian. In the work by Baker and Walker [8], the standard deviation of wake centerline fluctuations was assumed to grow linearly with downstream distance x and in proportion to the standard deviation of the wind direction. Hogstrom et al. [7] also assumed a linear relationship between the standard deviation of wake centerline fluctuations and the turbine downwind distance x, but argued that the coefficient should be determined by eddies larger than the width (or diameter) of the wake. Furthermore, Zambrano and Gyatt [4] assumed that eddies larger than the wake diameter cause the wake to meander, while eddies smaller than the wake diameter are only responsible for augumenting mixing of the wake with the ambient flow. This assumption forms the basis for the so-called dynamic wake meandering (DWM) model developed by researchers at the Technical University of Denmark [9], which is widely used today and is described in great detail in Section 2.1. Medici and Alfredsson [10], on the other hand, hypothesized that wake meandering in wind turbines is similar in nature to the large-scale fluctuations observed in wakes shed from bluff bodies. They based their hypothesis on results obtained from a wind tunnel experiment with a two-bladed wind turbine model (diameter D = 0.18 m) for different tip–speed ratios and different yaw conditions, in which the Strouhal number of the low frequency wake motion was observed to be independent of the freestream velocity and the turbulence level. Effects of wake meandering on the time-averaged wake were examined in [11]. Development of control strategies for mitigating the negative effect of wake meandering can be found in [12].
This review is organized as follows. In Section 2, we first present existing wake meandering models emphasizing the DWM model, large-eddy simulation (LES) approaches, and inflow turbulence generation methods. In Section 3, we review current knowledge about the physics of wake meandering derived from experimental and numerical models. Finally, in Section 4, we summarize the key findings of this review and discuss future research directions.

2. Wake Meandering Models

Types of models have been used thus far to study wake meandering: (1) reduced-order models that are based on empirical knowledge and/or solve simplified equations; and (2) high-fidelity models that solve numerically the Navier–Stokes equations for turbulent flows. The aforementioned DWM model belongs in the former category and is being used extensively in practice. Large-eddy simulation (LES), solving the filtered Navier–Stokes equations closed with a subgrid-scale model, belongs in the latter category and is, at least in principle, able to capture the energetic flow structures in wind farms and predict the unsteadiness of atmospheric turbulence and turbine wakes. We briefly describe both modeling strategies, in Section 2.1 and Section 2.2, respectively. For both the DWM model and LES, the velocity field of the incoming atmospheric turbulence needs to be prescribed as inlet condition. For that, in Section 2.3, we review two popular techniques used in the literature for generating the incoming atmospheric turbulence. The Reynolds-Averaged Navier–Stokes (RANS) method, which cannot accurately predict the flow unsteadiness and thus is not suitable for wake meandering simulations, is not discussed in this review.

2.1. The Dynamic Wake Meandering Model

The basic assumption of the DWM model [9] is that the meandering of turbines wakes is driven by the large-scale eddies in the atmospheric boundary layer, which are assumed to be advected as passive scalars. Using this assumption, the DWM model consists of three building-blocks: the model for wake meandering, the model for the wake velocity deficit, and the model for turbine-added turbulence.
In the model for wake meandering, it is assumed that the atmospheric turbulence can be decomposed into large-scale eddies, which are solely responsible for wake meandering, and small-scale eddies, which affect turbulence mixing and impact wake recovery [13]. To obtain the large-scale velocity fluctuations, a low-pass filter is applied to a prescribed incoming turbulence field (see Section 2.3 for a method to obtain such inflow velocity fields). A sequence of wake deficit profiles is then released at the turbine location and superimposed on the incoming turbulent flow at consecutive time instants. These wake deficits are assumed to be advected as passive scalars with downwind advection velocity prescribed by the user (set equal to the ambient velocity in [14] and 80% of the ambient velocity in [15]) and transverse and vertical advection velocities specified by the respective velocity components of the incoming large-scale eddies. Taylor’s frozen flow hypothesis is employed for the downwind advection of the wake assuming that the downwind variation of the large-scale eddies is negligible [16]. In the model for the velocity deficit, the velocity in the wake is computed by solving the simplified thin shear layer Navier–Stokes equation as follows:
U U x + V U r = 1 r r u v ¯ r ,
U x + 1 r ( r V ) r = 0 ,
where U and V are the time-averaged velocity in the axial and radial directions, respectively, and the Reynolds shear stress u v ¯ can be modeled using an eddy viscosity concept as follows:
u v ¯ = ν t U r ,
where the eddy viscosity ν t is modeled in two parts, one caused by the ambient turbulence and the other one added by the turbine, which is caused by the wake shear layer as well as the blade shed trailing vortices.
Several improvements on the DWM model have been proposed in the literature. In the original formulation of the model, the turbine-added turbulence was modeled using the difference between the minimal velocity in the wake and the ambient velocity, so that the eddy viscosity is constant for different radial locations. In [17], the turbine-added eddy viscosity is calculated based on a mixing length formulation using the radial gradient of the downwind velocity U and the so-determined radial distribution of the eddy viscosity is incorporated into the DWM model. In [18], approaches for considering the effect of the atmospheric shear and the turbine-added turbulence for a row of turbines were developed for the DWM model. In [15], the effects of non-neutral atmospheric stability on the velocity and length scales in the atmospheric turbulence were taken into account in the DWM model by adjusting parameters in the formulation for determining inflow conditions, which was based on Mann’s method [19,20]. A method for handling multiple wake interaction in the DWM model was developed in [21].
The DWM model was validated using field and LES data. Calibration and validation of different parts of the DWM model were carried out in [13] by comparing LES with the turbines parameterized as actuator disks and actuator lines. Bingol, Larsen, and Mann [22] employed the wind directions measured at the reference mast as inputs for the DWM model to predict the wake position of a Tellus 95 kW turbine and found a convincing correlation between the predicted wake movement and the actual wake movement measured using LiDAR. The DWM model was validated for loads and power production using the data in the Egmond aan Zee wind farm for two conditions, one under free-stream wind condition and the other under the conditions created by wakes from upwind turbines [21]. Validation of the DWM model without an aeroelastic model for power production was carried out in [23] by comparing with the data measured in Horns Rev, Lillgrund, Nysted, and Weingermeer wind farms. Validation of the DWM model for tower load prediction was carried out in [24] using the measurements in the Nysted II wind farm.
Different types of wake meandering models have been developed in the literature. Towards building a real-time dynamic wake meandering model, Muller et al. [25] found that the lateral force fluctuations on a wind turbine can be used as the indicator to predict the real-time meandering of its generated wake. Their work also demonstrated strong correlations between the incoming transverse velocity fluctuations and the lateral wake positions for wavelength larger than three disk diameters. In [26], a simplified dynamic wake model was developed based on the proper orthogonal decomposition (POD) modes. A computationally efficient approach using the database created using the DWM model was proposed in [27] for computing the wind farm power production. Thogersen et al. [28] developed a so-called statistical meandering wake model, which assigns random directional deflections to the Jensen’s wake model [29] (with a small entrainment constant) for the wake meandering effect. The wind speed and wind direction changes due to the incoming large-scale eddies may also be included in other analytical wind farm models [30,31,32] to account for the wake meandering driven by large-scale eddies.

2.2. Large-Eddy Simulation of Wind Farm Turbulence

LES, which resolves the energetic turbulence scales and models sub-grid scales using a sub-grid-scale model, is capable of simulating the coherent flow structures (e.g., tip vortices and wake meandering) in wind farms and has been widely used in the wind energy community [33,34,35,36,37,38,39]. In this section, we briefly describe LES models for wind farm simulations.

2.2.1. Governing Equations

In wind energy application, the air is usually considered as an incompressible Newtonian fluid. The governing equations for LES of wind farms are the spatially filtered continuity, momentum, and temperature equations written in a non-dimensional form as follows:
u ¯ i x i = 0 ,
u ¯ i t + u ¯ i u ¯ j x j = p ¯ x i + R e 1 2 u ¯ i x j x j R i ( T ¯ T ¯ b ) δ 3 i + f i τ i j x j ,
T ¯ t + T ¯ u ¯ j x j = R e 1 P r 1 2 T ¯ x j x j λ j x j
where u ¯ i , p ¯ , and T ¯ are the filtered velocity, pressure, and temperature, respectively; R e is the Reynolds number, R e = U r e f L r e f / ν (where ν is the kinematic viscosity, U r e f is the reference velocity, and L r e f is the reference length); R i is the Richardson number, R i = Δ T g L r e f / T 0 U r e f 2 (where g is the gravitational acceleration, Δ T is the scale for normalizing the temperature difference in the buoyancy term, and T 0 is the reference temperature); P r is the Prandtl number, P r = ν / k (where k is the thermal diffusivity); f i is the body force term introduced by the wind turbine; τ i j = u i u j ¯ u ¯ i u ¯ j is the sub-grid scale stress tensor; and λ j = T u j ¯ T ¯ u ¯ j is the sub-grid temperature flux. The sub-grid scale stress can be modeled as
τ i j = 2 ν t S ¯ i j
where ν t = C Δ ¯ 2 | S ¯ | ( Δ ¯ is a length scale proportional to a measure of the grid spacing), S ¯ i j = u ¯ i / x j + u ¯ j / x i / 2 is the strain rate tensor, | S ¯ | = 2 S ¯ i j S ¯ i j , and the model coefficient C can be determined using a dynamic procedure [40,41,42]. The sub-grid temperature flux λ j can be modeled as
λ j = k t T ¯ x j
where k t = C T Δ ¯ 2 | S ¯ | , and the model coefficient C T can be calculated using a dynamic procedure [43].
The employed grids in wind farm scale simulations are often not fine enough to resolve the viscosity-dominated regions near the ground and turbine structures. A wall model has to be employed to provide correct effects of the wall on the outer flows. Several wall models have been employed in wind energy applications, such as the wall model based on simplified thin boundary layer equations [44], the wall model based on the logarithmic law [45] and the wall model based on power law [46]. For non-neutral atmospheric flow, a wall model for temperature needs to be employed, e.g., the one employed in [47]. For simulating wind farms in complex terrain, immersed boundary methods can be employed [39].

2.2.2. Turbine Parameterizations

Turbulent flows in the wind energy applications occur across a large range of scales, ranging from the thickness of the boundary layer over the blade (∼0.01 m) to the thickness of the atmospheric boundary layer (∼1000 m) [3]. Resolving the spatial and temporal structures of the blade boundary layer flow in wind farm scale simulations is thus extremely expensive. To overcome this difficulty, turbine parameterization methods of different fidelity have been developed in the literature.
The most simple parameterization is to represent the turbine rotor as a permeable disk with distributed forces. The forces can be computed from the one-dimensional momentum method [34,36,48], in which the axial component of the force is computed by F a = 1 2 C T π R 2 U i n 2 (where C T = 4 a ( 1 a ) , a is the axial induction factor, R is the rotor radius, and U i n is the incoming wind speed), and the tangential and radial components of the force are zero. The forces on the disk can also be computed using the blade element method [35,48]. In this approach, the axial and tangential components of the forces are computed using the blade geometry and aerodynamic information. The effect of the rotor rotation can also be considered.
To more accurately account for the effects of the individual blade, actuator line models [33] and actuator surface models [3,49] were developed. In the actuator line model, the blade is represented using a straight line rotating about the turbine axis with forces distributed along the rotating line determined using the blade element method. The drag and lift coefficients from simulations and experiments are often based on two-dimensional geometry without considering three-dimensional effects and the effects of rotor rotation. To address these issues, corrections for three-dimensional effects [50] and the tip loss [51] need to be applied. In the actuator surface model, the blade is represented using the surface formed by the chord at different radial locations. The forces on the blade actuator surface are determined by the distributions of pressure coefficient in [49], which enables the model to capture the chordwise variation of the forces exerted on the blade. Such approach, however, is computationally more expensive for wind farm scale simulations because of the resolution requirement in the chordwise direction. In [3], on the other hand, the forces are determined using the blade element method and uniformly distributed in the chordwise direction. The method of Yang and Sotiropoulos [3] is not as accurate as that of Shen et al. [49], but is computationally more affordable for wind farm scale simulations. In the work of Yang and Sotiropoulos [3], an actuator surface model for the nacelle was also proposed, in which the nacelle is represented using the actual surface. The tangential component of the force on the nacelle can be prescribed by empirical relations or obtained a priori by simulations or from experiments. The normal component of the force is computed by satisfying the non-penetration boundary condition at the wall. Using grids of resolution similar to actuator line models, the actuator surface models for blades and nacelle [3] were shown to be able to predict the wake meandering and the effect of hub vortex instability on wake meandering successfully. We note that the effect of the dynamics or the hub vortex and its effects on wake meandering cannot be captured with standard actuator line models or simple representations of the turbine nacelle [52].

2.3. Generation of Inflow Turbulence

For both DWM model and LES, the characteristics of the turbulence in the incoming wind plays an important role on the wake recovery and the meandering of turbine wakes. In general, there are two approaches for generating the incoming turbulence numerically, i.e., the one based on the energy spectrum and the one solving the Navier–Stokes equations in precursory simulations. Several synthetic turbulence technique available in the literature (e.g., [19,53]). In this paper, we present Mann’s method as an example. In Mann’s method [19], the velocity fluctuations are computed based on the von Kármán spectral tensor considering the effect of shear, which is in the following form
Φ i j ( k ) = E ( k ) 2 π k 4 ( δ i j k 2 k i k j ) ,
where the von Kármán energy spectrum is given as follows:
E ( k ) = α ϵ 2 / 3 L 5 / 3 L 4 k 4 1 + L 2 k 2 17 / 6 ,
where α is the Kolmogorov constant, ϵ is the rate of viscous dissipation of the specific turbulence kinetic energy, and L is a length scale. Based on the rapid distortion theory [54], the shear effect is taken into account using the wave vector at the equilibrium state in the following form,
k ( τ ) = k 1 , k 2 , k 3 , 0 β k 1
where β d U d z τ = Γ d U d z ( k L ) 2 / 3 is the dimensionless eddy lifetime ( τ is proportional to k 2 / 3 , and Γ is a parameter) [19]. To compute the velocity fluctuations using Mann’s method, the values of the three parameters, i.e., Γ , L, and ϵ 2 / 3 , need to be specified. Mann’s method was developed for neutral atmospheric turbulence. To include the buoyancy effect, the atmospheric stability effect was considered by adjusting the model parameters in [20] and applied to the DWM model in [15]. In [55], two additional parameters for the thermal stability and the rate of destruction of temperature variance were introduced to the spectral tensor by Larsen et al. The synthetic turbulence technique has advantages in terms of computing time and the ability to specify exactly the required incoming turbulence. It also has disadvantages regarding to its accuracy because of the simplifications and assumptions employed in the model.
The other approach for generating the incoming turbulence is by solving the Navier–Stokes equations in LES form in a precursory simulation by applying periodic boundary conditions in the horizontal directions. After the flow reaches the statistically steady state, the instantaneous velocity field at a cross section perpendicular to the downwind direction is saved at every time step and fed as input to the inlet of the domain of the wind farm simulation. To generate large-scale eddies in the inflow, an inflow turbulence generation technique using spires at the inlet (inflow–outflow boundary condition in the downwind direction) was developed in [56]. In general, a precursory simulation can generate a physical incoming turbulence but at a relatively high computational cost. Besides of the computational cost, such approach also has difficulty in providing time-varying wind fields. A final note is that neither of the inflow turbulence generation techniques can be directly applied to wind farms in complex terrain.

3. The Physics of Wake Meandering

Two mechanisms have been proposed in the literature as the possible origin for the onset of wake meandering, i.e., large-scale eddies in the atmosphere and shear layer instability similar to the vortex shedding of bluff bodies. The notion that incoming large-scale eddies are considered to be the cause for wake meandering can be traced back to studies in the 1980s (e.g., [4]). Recently, the shear layer instability was also considered as the origin for wake meandering (e.g., [10] for wind tunnel experiment and [52] for numerical simulations). In this section, we discuss recent advance regarding our understanding of the origin for wake meandering as well as the characteristics of wake meandering.

3.1. The Origin of Wake Meandering

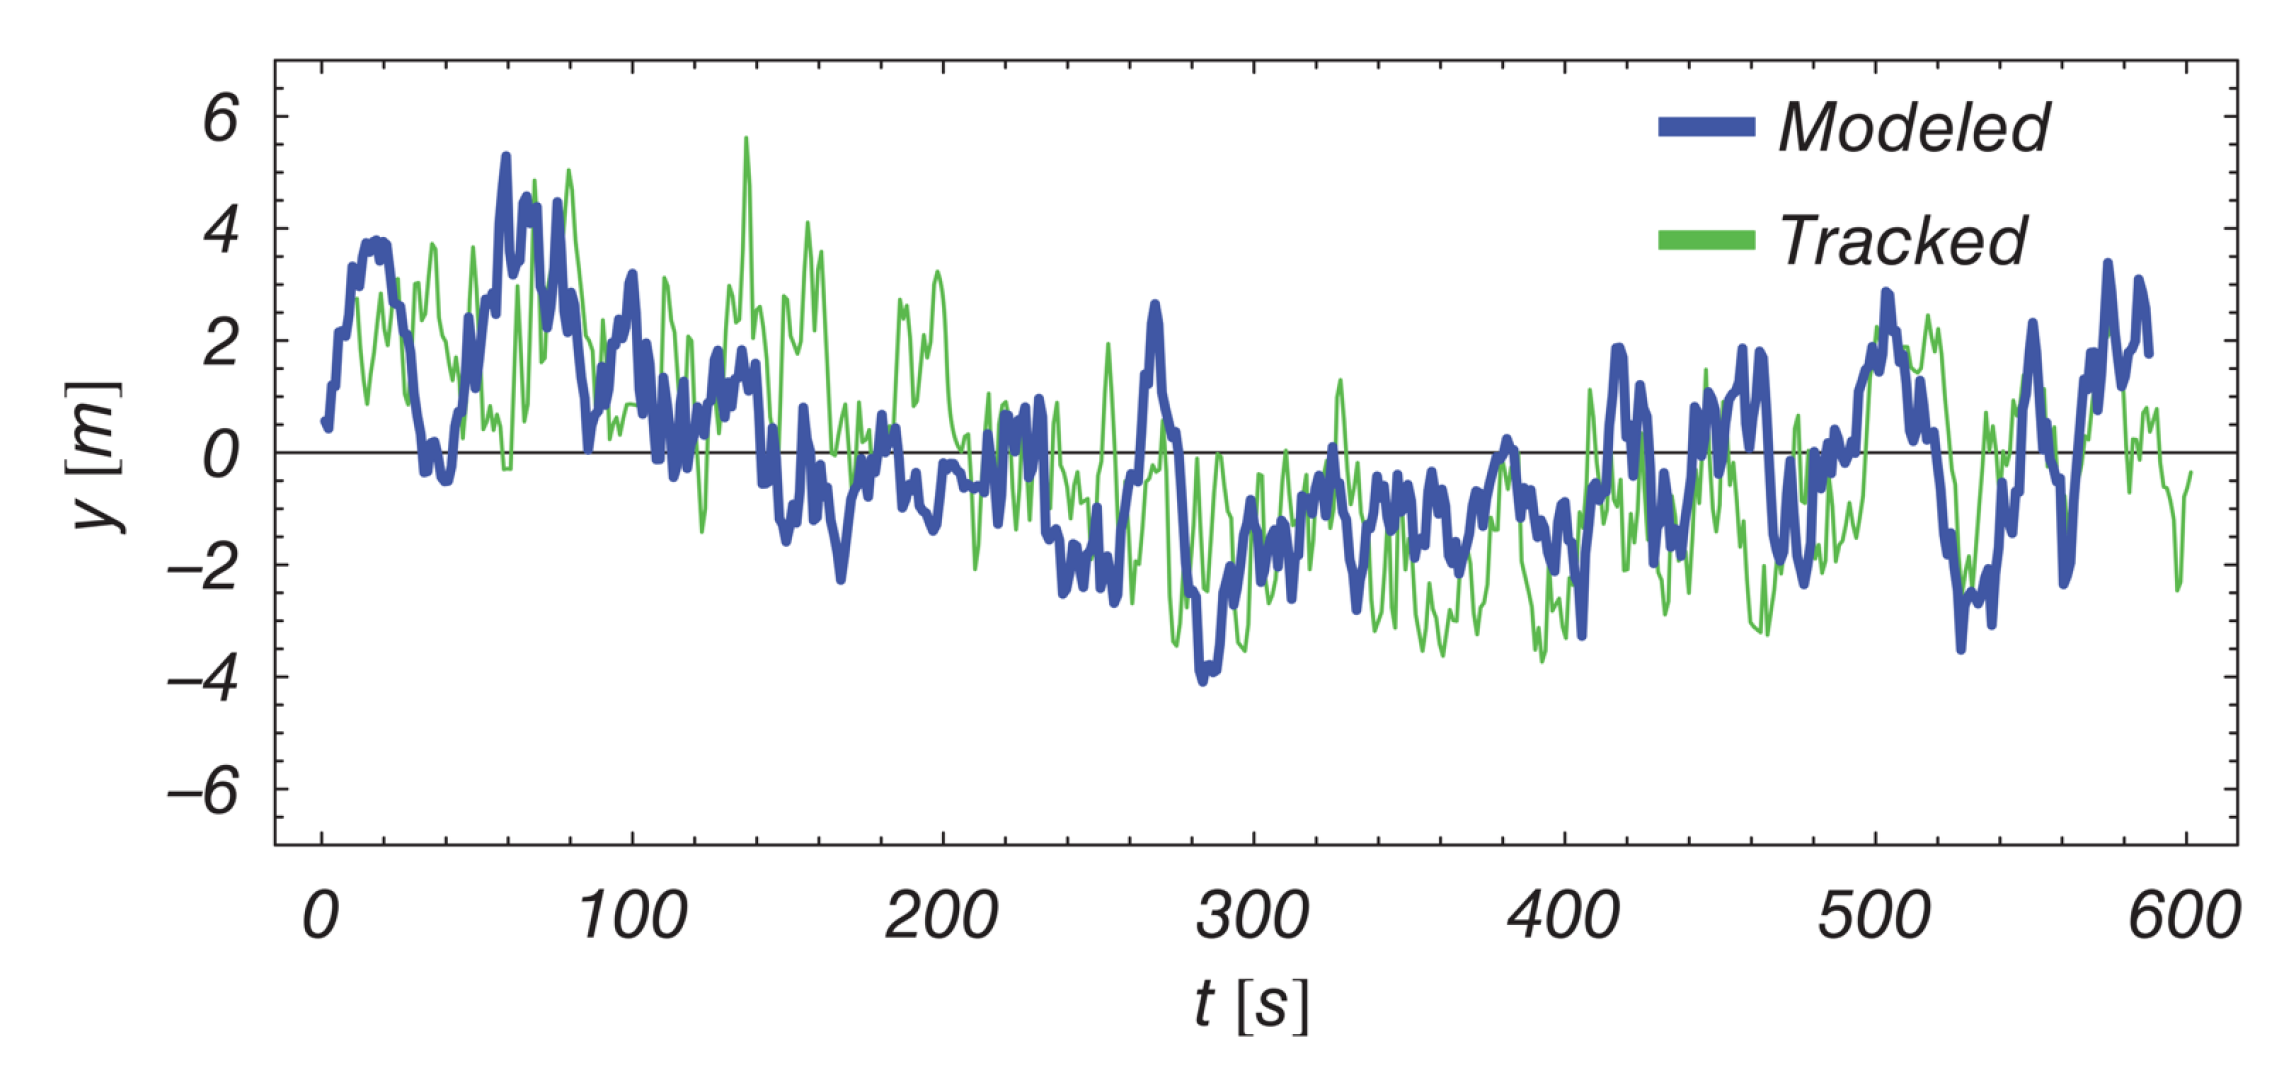
Incoming large-scale eddies, which advect the wake deficits as passive scalars, have been proposed to be the origin for wake meandering. To verify this hypothesis, Trujillo et al. [14] compared the wake position predicted by the DWM model with that measured in the wake of a 95 kW wind turbine (with a hub height of 29.3 m and a rotor diameter of 19.0 m). A fair agreement (with a maximum cross-covariance of 0.58) between the prediction and the measurements was obtained, as shown in Figure 2. Madsen et al. [13] observed a significant contribution from the wake meandering to the increased turbulence while the contributions from breakdown of tip vortices and from the shear layer are minor. España et al. [57] studied the wake meandering process by modeling the wind turbine as a porous disk for two wind tunnel setups, i.e., one having atmospheric incoming turbulence with the integral length scale significantly greater than the disk diameter, and the other one having isotropic incoming turbulence with the integral length scale significantly smaller than the disk diameter. As shown in Figure 3, more significant wake meandering was observed for the inflow with large-scale eddies compared with the inflow with small scale isotropic turbulence. It was also shown that the extent of the wake meandering in the transverse direction is higher than that in the vertical direction with the ratio similar to that of the turbulence intensities of the corresponding components. España et al. [58] further compared the wake from a porous disk with that from a solid disk for the two inflows. At the 3D downwind location, the Strouhal number of the vortex shedding frequency of the solid disk was observed to be about 0.1 for both inflows, which is between 0.1 and 1 for the porous disk under the inflow with small scale isotropic turbulence and close to the dominant frequency of the inflow for the porous disk under the inflow with large-scale eddies, respectively.
Shear layer instability similar to the vortex shedding of bluff bodies has also been considered to be the cause of wake meandering. Medici and Alfredsson [10] studied the wake meandering of a turbine model ( D = 0.18 m). They observed a low frequency motion overlaid on the periodic variation caused by the tip vortices (shown in Figure 4a), and hypothesized that this low frequency motion is generated in the same way as for a solid disk [10]. Figure 4b shows the Strouhal number of the low frequency motion as a function of the tip speed ratio. Medici and Alfredsson [59] further investigated the frequency of wind turbine wake meandering for wind turbine models with one, two, and three blades but did not observe meandering motion for the one-bladed turbine. It was found that both the thrust of the turbine and the tip speed ratio influence the meandering of turbine wakes, as shown in Figure 4c. Barlas et al. [60] studied the turbine wake meandering for rough and smooth surfaces in an atmospheric turbulent boundary layer wind tunnel and observed wake meandering of Strouhal number in the order of 0.25, typical for a bluff body.
The precessing hub vortex downwind of the turbine nacelle has also been proposed as a mechanism for triggering or enhancing the meandering of turbine wakes. Chamorro et al. [61] observed low frequency motion of Strouhal number 0.28 at distances greater than three rotor diameters downstream of a axial-flow hydrokinetic turbine (which has a rotor of diameter 0.5 m placed in flume of 1.8 m deep and 2.75 m wide). Using geometry-resolving large-eddy simulation, Kang et al. [52] simulated the same turbine as in [61] and observed that the precessing hub vortex interacts with the tip shear layer at around three rotor diameters downstream of the turbine, which coincides with the location where wake meandering originates. Using LES with the turbine parameterized as actuator disk and actuator lines (approaches which cannot predict the correct dynamics of the hub vortex), Kang et al. [52] showed that, while the precessing instability of the hub vortex does not cause wake meandering, it energizes large-scale motions and leads to a larger and more energetic wake meandering region several rotor diameters downwind. Iungo et al. [62] found the presence of a helicoidal unstable mode of the hub vortex, similar to the precessing vortex mechanism identified by Kang et al. [52], through linear stability analysis of the turbine wake data from wind tunnel measurements. A hub vortex instability analysis taking into account the Reynolds stresses was further carried out by Viola et al. [63]. Howard et al. [64] investigated the wake meandering of a model turbine (D = 0.13 m) for four different conditions, i.e., free-rotating without applied load, optimal condition, with a turbine in its downwind and in the wake of an upwind turbine. Their analysis showed that the small scale vortices in the hub shear layer and in the wake shear layer interact with the hub vortex and evolve into large-scale wake meandering. The large-scale instability of the hub vortex and its impact on the intensity of far wake meandering was further demonstrated by Foti et al. [65] using geometry-resolving large-eddy simulation of the same model turbine as in [64]. The hub vortex visualized using the low-velocity core is shown in Figure 5a. It was shown in [3,52] that actuator models for the blades but without a nacelle model cannot capture the hub vortex and its effect on the wake meandering (Figure 5b). An actuator surface model for the nacelle was then developed in [3], which can predict the interaction of the nacelle-induced hub vortex with the tip shear layer on relatively coarse grids, as shown in Figure 5c. The effect of nacelle on wake meandering for different operational regimes was also examined [66]. It was found that the amplitudes of wake meanders are underpredicted for the simulation without a nacelle model. In the numerical study of the wake meandering in the Horns Rev wind farm [67], the nacelle was found to have a significant effect on the wake meandering in the wind farm, enhancing the meandering amplitudes especially for the turbines in the first several rows.
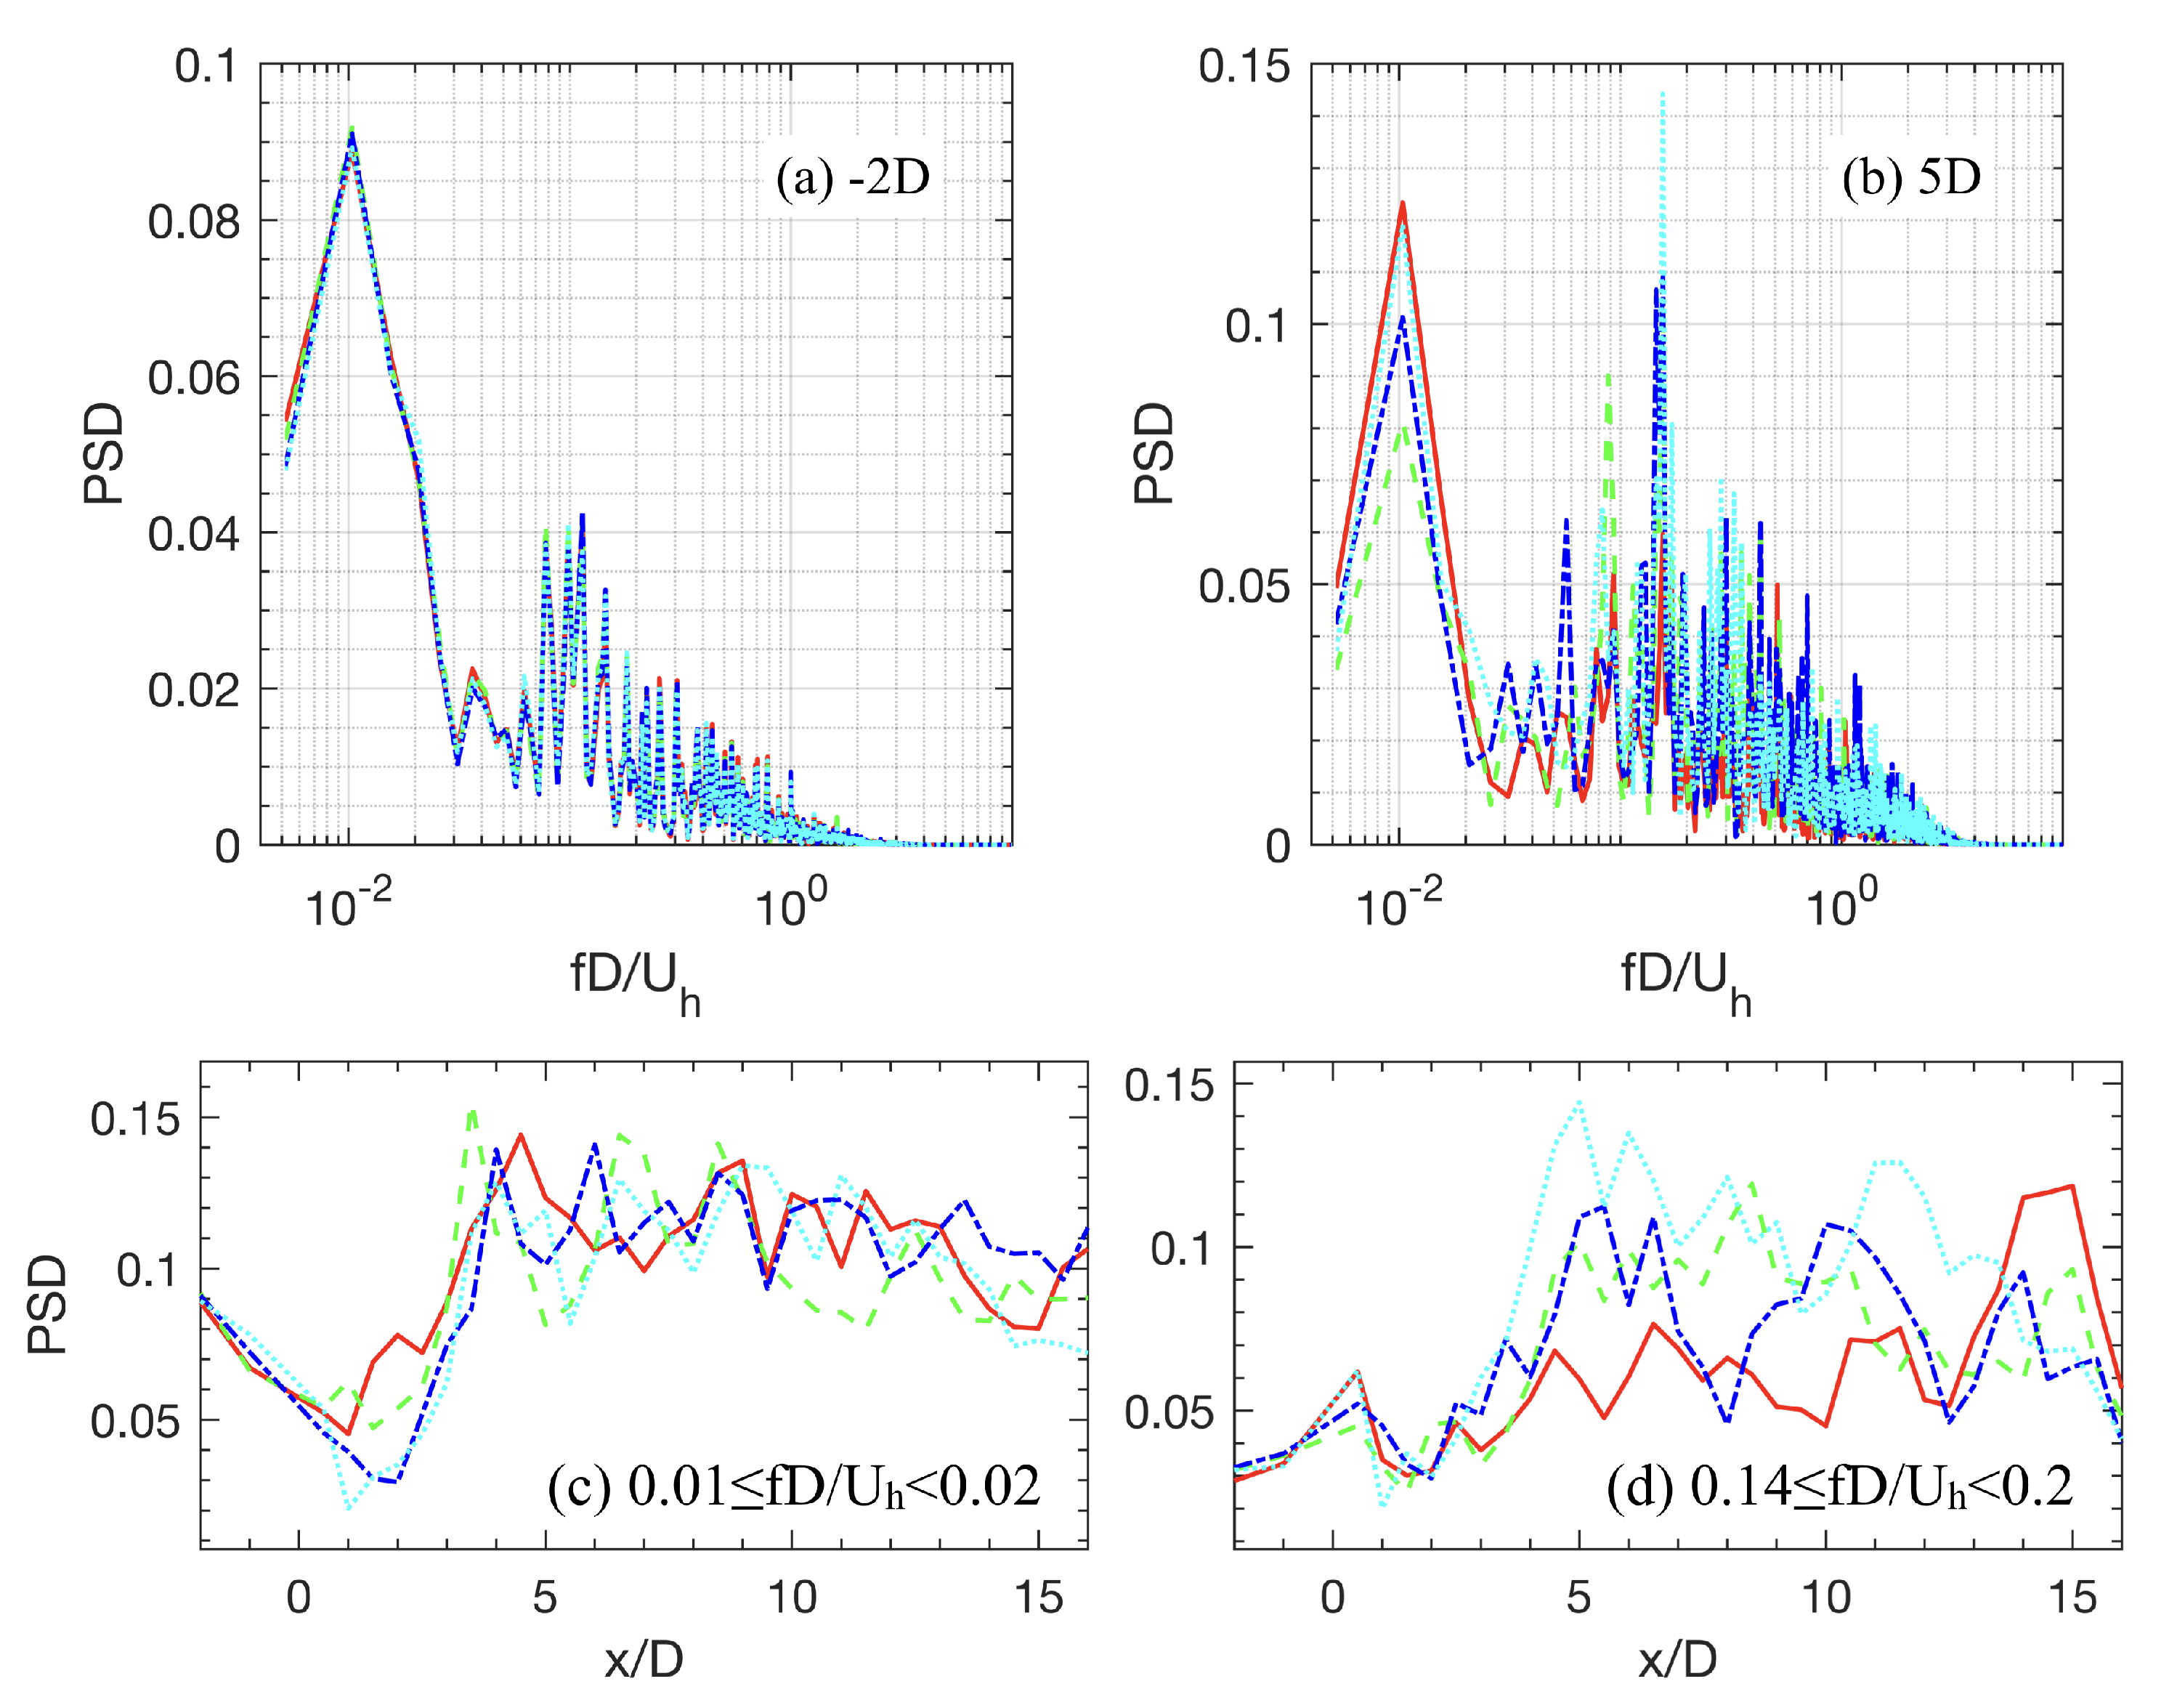
Okulov et al. [68] discussed that the most likely cause for the wake meandering in wind and water tunnel experiments is vortex shedding as large-scale eddies do not appear in these experiments. To verify this assumption, water flume experiments of using a rotor of diameter 0.376 m were performed. They observed low frequency motions associated with the precession of a helical vortex of Strouhal number 0.23 for different tip speed ratios and different incoming flow speeds, and suggested that both effects from the large-scale atmospheric turbulence and the bluff body vortex shedding should be taken into account for wind turbines under atmospheric turbulence conditions. In the study of the wake meandering phenomenon within a 3 × 3 scaled wind farm [69], the authors hypothesized that “the formation of wake meandering appears, therefore, to be caused by the amplification of the intrinsic instabilities of the wake by large-scale turbulent eddies within the ABL” based on the observation that the observed Strouhal number is in favor of the intrinsic shear layer instability of the wake, and that meandering does not appear for the inflow with integral length scales smaller than the rotor diameter, as shown in [57]. The effect of incoming large-scale eddies on the meandering of the 2.5 MW EOLOS turbine was studied numerically using large-eddy simulation with the actuator surface models for blades and nacelle in [70]. The large-scale turbulent structures of the inflow were generated using a precursory simulation on a very large computational domain (more than four times larger in the transverse direction). Two distinct peak frequencies, one for the meandering frequency caused by the shear layer instability of Strouhal number about 0.15 and the other of a much lower Strouhal number of 0.01 corresponding to the large-scale eddies of the inflow, are observed, as shown in Figure 6. This observation adds significant credence to the assertion that both the incoming large-scale eddies and the shear layer instability affect the low frequency motion of the wake. The dominant frequency of the wake meandering caused by the shear layer instability barely influence the dominant frequency of the inflow for the present cases, in which the peak frequency of the incoming large-scale eddies is almost one order of magnitude larger than that caused by the shear layer instability. However, the magnitude of the PSD at the peak frequency of the inflow is significantly reduced by the turbine until about 3D downwind of the turbine, where the peak PSD of the inflow large eddies recover to values slightly lower than that upwind of the turbine. This observation is consistent with the field measurement of full-scale wind turbines and was termed as a sheltering effect of the turbine in [71], as shown in Figure 7. In [71], Heisel et al. studied the spectral characteristics of wake meandering using both wind tunnel and field-scale measurements. It is noted that, in this review, we refer to turbines such as the EOLOS turbine of 96 m rotor diameter as utility scale, the SWiFT turbine of 27 m rotor diameter and above as field scale, and turbines employed in wind tunnels (e.g., the G-1 wind turbine model of rotor diameter 1.1 m [66] and the miniature model turbine of rotor diameter 0.13 m [64]) as laboratory scale. A deficit of the energy of the large-scale eddies (as shown in Figure 7a,b for the field-scale measurements) is observed in both measurements, which is caused by the transfer of energy from the large-scale eddies to the small scales in the turbine wake, which was also observed in numerical simulations, as shown in Figure 6. Heisel et al. [71] postulated that the wake meandering is driven by two different mechanisms, i.e., one by the large-scale eddies and the other by the shear layer instability as bluff bodies, at two separate scales, which is consistent with and demonstrated by the LES results of Yang and Sotiropoulos [70], as shown in Figure 6. In the study of wake meandering of an infinitely long row of wind turbines, Andersen et al. [72] observed three distinct peak frequencies and claimed that the two lower frequencies are related to turbine spacing, and the third one is related to the vortex shedding of the wind turbine as a bluff body with a Strouhal number of 0.19. Andersen et al. concluded that the low frequency dynamics of turbine wakes deep within a wind farm are related to not only the large-scale eddies of the atmospheric turbulence but also those caused by turbine wakes and wake interactions.

3.2. The Characteristics of Wake Meandering

3.2.1. The Frequency of Wake Meandering

Chamorro and Porte-Agel [73] observed the wake meandering of a model turbine for both neutral ( S t = 0.40 ) and stable ( S t = 0.33 ) stratification conditions but with a lower predominant frequency for the stable condition. In [74], a Strouhal number of 0.35 was observed at 1D and 2D downwind locations of a model turbine ( D = 13 cm). Howard et al. [64] systematically investigated the characteristics of the wake meandering of a model turbine ( D = 0.13 m) and found that the Strouhal number of the hub vortex is about 0.7 and the Strouhal number of the large-scale oscillations is about 0.3. With the data of their own measurements and those in the literature, Heisel et al. [71] found that the values of the Strouhal number from laboratory-scale and field-scale experiments are in the same range independent of Reynolds number. Foti et al. [67] investigated the characteristics of wake meandering in the Horns Rev wind farm using LES with actuator surface models for the turbine blades and nacelle. Figure 8 shows the contours of row-averaged power spectral density at a function of x / D and Strouhal number. The Strouhal number for peak power spectral density is about 0.3 for the turbines in the first two rows and about 0.2 for all the following rows. In the study of wake meandering within a 3 × 3 scaled wind farm placed in the neutral boundary layer of a wind tunnel with the turbulence intensity at hub height 10.5%, and the integral length scale at hub height 3D, Coudou et al. [69] observed wake meandering of Strouhal number 0.20–0.22 for all the turbines at different downwind locations.

3.2.2. The Amplitude, Wavelength, and Downwind Convection Velocity of Wake Meandering

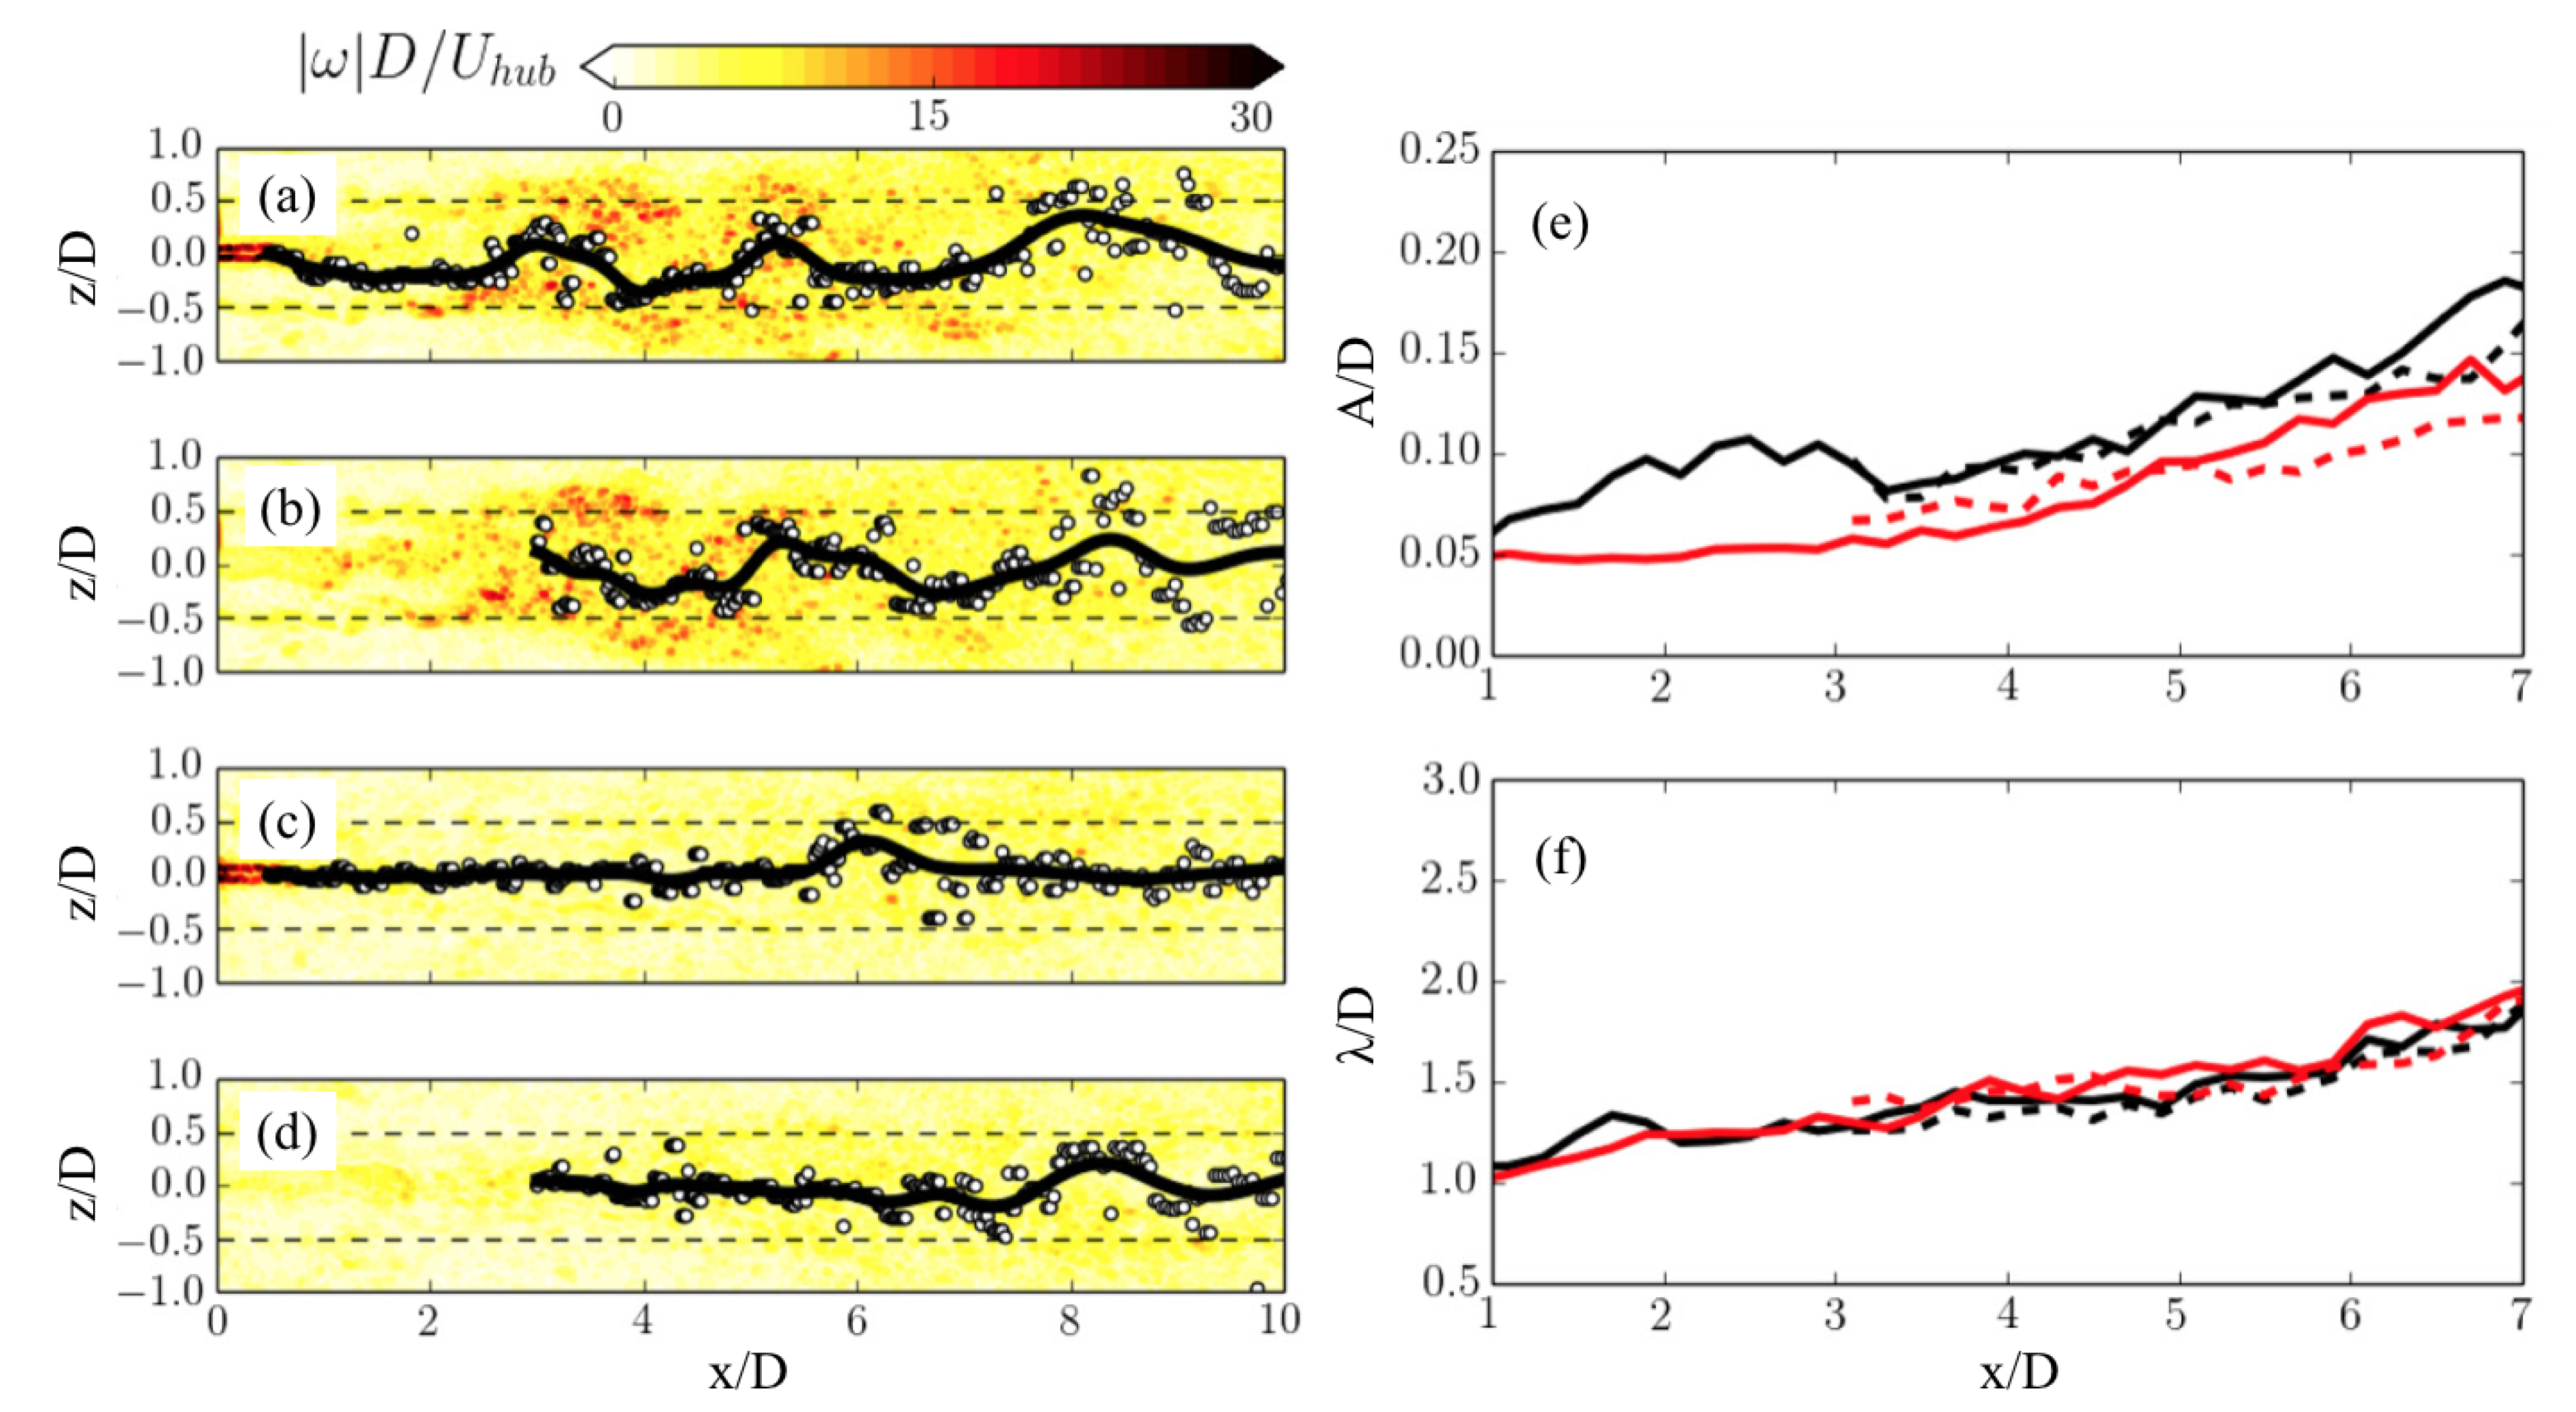
Howard et al. [64] found that the amplitude of wake meander is about 0.1D–0.2D, the wavelength of wake meander is about 1D, the downwind convection velocity of the wake meandering is about 0.5 U h to 0.7 U h for wake meandering of a model wind turbine ( D = 0.13 m). Garcia et al. [75] investigated the statistics of wake meandering using seven-month measurement of two aligned wind turbines (the distance between the two turbines is about 3D in the downwind direction depending on the wind direction) in a full-scale wind farm. The standard deviation of the wake center positions of the upwind turbine increases from 0.1D at 1D turbine downwind to about 0.2D at 3D turbine downwind, and increases further to about 0.3D at 4D turbine downwind and gradually decreases at further downwind locations when the second turbine is not directly in its downwind. The downwind variations of the standard deviations of the wake center positions for the downwind turbine, which are in the range of 0.2D–0.4D, are more complex than that of the upwind turbine. The wake meandering behind the G-1 wind turbine model of rotor diameter 1.1 m operating in Regime 2 and 3 was investigated using wind tunnel experiment and LES [66]. The wake meanders, as shown in Figure 9a–d, are identified using a spatiotemporal filtering technique developed in [64,66]. Wake meandering of frequency around 0.3 is observed for both operational regimes. The amplitudes of wake meanders gradually increase in the downwind direction and are observed to be larger for the turbine operating in Regime 2, as shown in Figure 9e. The wavelengths of wake meanders are observed to be similar for the two regimes and gradually increase from 1D at 1D turbine downwind to 2D at 7D turbine downwind, as shown in Figure 9f. The dynamics of wake meandering for different turbine designs was investigated in [76]. Four different turbine designs including a model wind turbine ( D = 0.128 m), the G1 turbine ( D = 0.11 m) designed by Campagnolo [77], the SWiFT turbine (D = 27 m) [78], and the EOLOS turbine (D = 96 m) at University of Minnesota [79,80] were considered. Similarities regarding the wake meander statistics were observed. Figure 10 shows the downwind variations of the amplitudes and wavelengths of wake meanders. As shown in Figure 10b, the differences of meandering amplitudes from different turbine designs become smaller and close to that of bluff bodies when normalized using the length scale defined as i.e., L T = U T / f m , where U T = T / ρ π R 2 (T is the thrust, ρ is the density, and R is the rotor radius) and f m is the wake meandering frequency. The wavelengths ranging from 1D to 2D are also similar to each other for all the considered turbine designs, as shown in Figure 10c. The velocity scale U T was used earlier in [81] for scaling the turbine-added turbulence kinetic energy for cases with a three-dimensional hill located at different distances upwind of the turbine. It was found that the profiles of turbine-added turbulence kinetic energy at far wake locations collapse with each other when normalized by the velocity scale U T . In the numerical study of the wake meandering in the Horns Rev wind farm [67], the wake meandering amplitudes normalized by L T were found to be similar with each other for turbines in different rows. Higher wavelengths were observed in the very deep of the wind farm. Characterization of wake meandering has been focused on spectral analysis, meandering amplitude and meandering wavelength as discussed in this section. Analysis of wake meandering using dynamic mode decomposition (DMD) [82] was carried out in [65]. It was shown that the fundamental features of wake meandering can be reasonably captured using the hub vortex mode and wake meandering mode. Further studies on the characteristics of wake meandering using the DMD or POD [83] method are needed, which can be used to develop machine learning based wake meandering models.

4. Summary

The dynamics of wake meandering is complex and its emergence can be attributed to two mechanisms: (1) forcing by large eddies in the atmospheric turbulence advected downwind as passive scalars; and (2) shear layer instability similar to the vortex shedding behind bluff bodies. The first mechanism seems to be more prevalent at field scale [14], while the second mechanism is often observed at laboratory scale [59]. Recent experimental and computational studies [70,71], on the other hand, suggest the coexistence of the two mechanisms at utility scale. Wake meandering is characterized by, among others, its frequency, amplitudes, and wavelength. The Strouhal number of the meandering frequency is found to be in a range (about 0.1–0.4) independent of the Reynolds number [71]. The amplitudes of meandering are found to grow in the downwind direction [76]. In wind farms, the meandering amplitudes are found to be larger for the turbines at downwind locations [67,75]. The wavelength is in the order of rotor diameter, as shown in [64,65,66].
We review different wake meandering models including the DWM model and LES with different turbine parameterizations. The DWM model is the most computationally efficient one but the accuracy of its predictions relies on the thin-shear layer simplification and Taylor’s frozen flow hypothesis. To apply the DWM model to actual wind farm designs, the eddy viscosity employed in the thin-shear layer equation and other model parameters should be carefully calibrated using measurements and high-fidelity simulations to account for the site-specific effects. Compared with the DWM model, LES requires much more computational resources but can predict wake meandering at higher-order accuracy. In the existing actuator type models, the actuator surface model taking into account the effects of the nacelle geometry and the chordwise geometry of turbine blade is preferred. However, the actuator surface model requires spatial resolutions higher than that in the actuator disk/line simulations, for instance at least 4–5 cells per nacelle diameter are recommended in actuator surface simulations [3]. For utility-scale wind farm simulations, LES with actuator disk/line models, which can capture the effect of incoming large eddies and the interaction between incoming turbulence and turbine wakes, can be employed to reduce the computational cost, even though they cannot accurately predict the nacelle effects and the hub vortex and may underpredict the intensity of wake meandering [52].
As we can notice from this review, most of the work on wake meandering has focused on relatively simple conditions. To achieve site-specific optimal wind farm design and operation [86,87], further research from both fundamental and applied points of view needs to be carried out. Such work should focus, among others, on: (1) the role and interaction of the two wake meandering mechanisms for different turbine operational and atmospheric conditions; (2) the physics and models for wake meandering in complex terrain, under offshore conditions with breaking waves [88] and in coastal areas [89]; and (3) extension of the meandering models to the wake of marine and hydrokinetic energy devices (may be of complex configuration [90]) interacting with sediment transport [91,92] and different types of turbulent eddies [93,94].

Author Contributions

X.Y. drafted the manuscript. F.S. revised and discussed the manuscript.

Funding

This research was funded by Xcel Energy through the Renewable Development Fund (Grant RD4-13).

Conflicts of Interest

The authors declare no conflict of interest.

Abbreviations

The following abbreviations are used in this manuscript:
ABLAtmospheric boundary layer
DWMDynamic wake meandering
DMDDynamic mode decomposition
LESLarge-eddy simulation
PODProper orthogonal decomposition
PSDPower spectral density
RANSReynolds-Averaged Navier–Stokes

References

  1. Stevens, R.J.; Meneveau, C. Flow structure and turbulence in wind farms. Annu. Rev. Fluid Mech. 2017, 49, 311–339. [Google Scholar] [CrossRef]
  2. Yang, X.; Boomsma, A.; Barone, M.; Sotiropoulos, F. Wind turbine wake interactions at field scale: An LES study of the SWiFT facility. J. Phys. Conf. Ser. 2014, 524, 012139. [Google Scholar] [CrossRef] [Green Version]
  3. Yang, X.; Sotiropoulos, F. A new class of actuator surface models for wind turbines. Wind Energy 2018, 21, 285–302. [Google Scholar] [CrossRef] [Green Version]
  4. Zambrano, T.G.; Gyatt, G.W. Wake Structure Measurements at the Mod-2 Cluster Test Facility at Goodnoe-Hills, Washington. IEE Proc. A Meas. Technol. 1983, 130, 562–565. [Google Scholar] [CrossRef]
  5. Ainslie, J.F. Calculating the flowfield in the wake of wind turbines. J. Wind Eng. Ind. Aerodyn. 1988, 27, 12. [Google Scholar] [CrossRef]
  6. Whale, J.; Papadopoulos, K.H.; Anderson, C.G.; Helmis, C.G.; Skyner, D.J. A study of the near wake structure of a wind turbine comparing measurements from laboratory and full-scale experiments. Sol. Energy 1996, 56, 621–633. [Google Scholar] [CrossRef] [Green Version]
  7. Hogstrom, U.; Asimakopoulos, D.N.; Kambezidis, H.; Helmis, C.G.; Smedman, A. A Field-Study of the Wake Behind a 2 MW Wind Turbine. Atmos. Environ. 1988, 22, 803–820. [Google Scholar] [CrossRef]
  8. Baker, R.W.; Walker, S.N. Wake Velocity Deficit Measurements at the Goodnoe Hills MOD-2 Site: A Summary of the 1982 and 1984 Findings; Report bpa 84-15, doe/bp/29182, 15; United States Department of Energy: Washington, WA, USA, 1985.
  9. Larsen, G.C.; Madsen, H.A.; Bingöl, F.; Mann, J.; Ott, S.; Sørensen, J.N.; Okulov, V.; Troldborg, N.; Nielsen, M.; Thomsen, K.; et al. Dynamic Wake Meandering Modeling; Risø-R-1607; Risø National Laboratory: Roskilde, Denmark, 2007. [Google Scholar]
  10. Medici, D.; Alfredsson, P.H. Measurements on a wind turbine wake: 3D effects and bluff body vortex shedding. Wind Energy 2006, 9, 219–236. [Google Scholar] [CrossRef]
  11. Bastankhah, M.; Porté-Agel, F. A new miniature wind turbine for wind tunnel experiments. Part ii: Wake structure and flow dynamics. Energies 2017, 10, 923. [Google Scholar] [CrossRef] [Green Version]
  12. Munters, W.; Meyers, J. Dynamic strategies for yaw and induction control of wind farms based on large-eddy simulation and optimization. Energies 2018, 11, 177. [Google Scholar] [CrossRef] [Green Version]
  13. Madsen, H.A.; Larsen, G.C.; Larsen, T.J.; Troldborg, N.; Mikkelsen, R. Calibration and Validation of the Dynamic Wake Meandering Model for Implementation in an Aeroelastic Code. J. Sol. Energy Eng.-Trans. ASME 2010, 132, 041014. [Google Scholar] [CrossRef]
  14. Trujillo, J.J.; Bingol, F.; Larsen, G.C.; Mann, J.; Kuhn, M. Light detection and ranging measurements of wake dynamics. Part II: two-dimensional scanning. Wind Energy 2011, 14, 61–75. [Google Scholar] [CrossRef]
  15. Keck, R.E.; de Mare, M.; Churchfield, M.J.; Lee, S.; Larsen, G.; Aagaard Madsen, H. On atmospheric stability in the dynamic wake meandering model. Wind Energy 2014, 17, 1689–1710. [Google Scholar] [CrossRef]
  16. Larsen, G.C.; Madsen, H.A.; Thomsen, K.; Larsen, T.J. Wake meandering: A pragmatic approach. Wind Energy 2008, 11, 377–395. [Google Scholar] [CrossRef]
  17. Keck, R.E.; Veldkamp, D.; Madsen, H.A.; Larsen, G. Implementation of a Mixing Length Turbulence Formulation Into the Dynamic Wake Meandering Model. J. Sol. Energy Eng.-Trans. ASME 2012, 134, 021012. [Google Scholar] [CrossRef]
  18. Keck, R.E.; de Mare, M.; Churchfield, M.J.; Lee, S.; Larsen, G.; Madsen, H.A. Two improvements to the dynamic wake meandering model: Including the effects of atmospheric shear on wake turbulence and incorporating turbulence build-up in a row of wind turbines. Wind Energy 2015, 18, 111–132. [Google Scholar] [CrossRef]
  19. Mann, J. Wind field simulation. Probabilistic Eng. Mech. 1998, 13, 269–282. [Google Scholar] [CrossRef]
  20. Pena, A.; Gryning, E.S.; Mann, J. On the length-scale of the wind profile. Q. J. R. Meteorol. Soc. 2010, 136, 2119–2131. [Google Scholar] [CrossRef]
  21. Larsen, T.J.; Madsen, H.A.; Larsen, G.C.; Hansen, K.S. Validation of the dynamic wake meander model for loads and power production in the Egmond aan Zee wind farm. Wind Energy 2013, 16, 605–624. [Google Scholar] [CrossRef] [Green Version]
  22. Bingol, F.; Larsen, G.C.; Mann, J. Wake meandering—An analysis of instantaneous 2d laser measurements. J. Phys. Conf. Ser. 2007, 75, 012059. [Google Scholar] [CrossRef]
  23. Keck, R.E. Validation of the standalone implementation of the dynamic wake meandering model for power production. Wind Energy 2015, 18, 1579–1591. [Google Scholar] [CrossRef]
  24. Larsen, T.J.; Larsen, G.C.; Pedersen, M.M.; Enevoldsen, K.; Madsen, H.A. Validation of the Dynamic Wake Meander model with focus on tower loads. J. Phys. Conf. Ser. 2017, 854, 012027. [Google Scholar] [CrossRef]
  25. Muller, Y.A.; Aubrun, S.; Masson, C. Determination of real-time predictors of the wind turbine wake meandering. Exp. Fluids 2015, 56, 53. [Google Scholar] [CrossRef]
  26. Bastine, D.; Witha, B.; Wächter, M.; Peinke, J. Towards a simplified dynamicwake model using POD analysis. Energies 2015, 8, 895–920. [Google Scholar] [CrossRef] [Green Version]
  27. Keck, R.E.; Undheim, O. A pragmatic approach to wind farm simulations using the dynamic wake meandering model. Wind Energy 2015, 18, 1671–1682. [Google Scholar] [CrossRef]
  28. Thogersen, E.; Tranberg, B.; Herp, J.; Greiner, M. Statistical meandering wake model and its application to yaw-angle optimisation of wind farms. J. Phys. Conf. Ser. 2017, 854, 012017. [Google Scholar] [CrossRef] [Green Version]
  29. Jensen, N.O. A Note on Wind Generator Interaction; Risø-M-2411; Risø National Laboratory: Roskilde, Denmark, 1983. [Google Scholar]
  30. Stevens, R.J.; Gayme, D.F.; Meneveau, C. Coupled wake boundary layer model of wind-farms. J. Renew. Sustain. Energy 2015, 7, 023115. [Google Scholar] [CrossRef] [Green Version]
  31. Yang, X.; Sotiropoulos, F. Analytical model for predicting the performance of arbitrary size and layout wind farms. Wind Energy 2016, 19, 1239–1248. [Google Scholar] [CrossRef]
  32. Ge, M.; Wu, Y.; Liu, Y.; Li, Q. A two-dimensional model based on the expansion of physical wake boundary for wind-turbine wakes. Appl. Energy 2019, 233, 975–984. [Google Scholar] [CrossRef]
  33. Sørensen, J.N.; Shen, W.Z. Numerical modeling of wind turbine wakes. J. Fluids Eng. 2002, 124, 393–399. [Google Scholar] [CrossRef]
  34. Calaf, M.; Meneveau, C.; Meyers, J. Large eddy simulation study of fully developed wind-turbine array boundary layers. Phys. Fluids 2010, 22, 015110. [Google Scholar] [CrossRef] [Green Version]
  35. Wu, Y.T.; Porté-Agel, F. Large-eddy simulation of wind-turbine wakes: Evaluation of turbine parametrisations. Bound.-Layer Meteorol. 2011, 138, 345–366. [Google Scholar] [CrossRef]
  36. Yang, X.; Kang, S.; Sotiropoulos, F. Computational study and modeling of turbine spacing effects in infinite aligned wind farms. Phys. Fluids 2012, 24, 115107. [Google Scholar] [CrossRef]
  37. Churchfield, M.; Lee, S. NWTC dEsign Codes-SOWFA. 2012. Available online: http://wind.nrel.gov/designcodes/simulators/SOWFA (accessed on 9 December 2019).
  38. Bhaganagar, K.; Debnath, M. Implications of stably stratified atmospheric boundary layer turbulence on the near-wake structure of wind turbines. Energies 2014, 7, 5740–5763. [Google Scholar] [CrossRef] [Green Version]
  39. Yang, X.; Sotiropoulos, F.; Conzemius, R.J.; Wachtler, J.N.; Strong, M.B. Large-eddy simulation of turbulent flow past wind turbines/farms: The Virtual Wind Simulator (VWiS). Wind Energy 2015, 18, 2025–2045. [Google Scholar] [CrossRef]
  40. Germano, M.; Piomelli, U.; Moin, P.; Cabot, W.H. A dynamic subgrid-scale eddy viscosity model. Phys. Fluids A Fluid Dyn. 1991, 3, 1760–1765. [Google Scholar] [CrossRef] [Green Version]
  41. Porté-Agel, F.; Meneveau, C.; Parlange, M.B. A scale-dependent dynamic model for large-eddy simulation: Application to a neutral atmospheric boundary layer. J. Fluid Mech. 2000, 415, 261–284. [Google Scholar] [CrossRef] [Green Version]
  42. Bou-Zeid, E.; Meneveau, C.; Parlange, M. A scale-dependent Lagrangian dynamic model for large eddy simulation of complex turbulent flows. Phys. Fluids 2005, 17, 025105. [Google Scholar] [CrossRef] [Green Version]
  43. Armenio, V.; Sarkar, S. An investigation of stably stratified turbulent channel flow using large-eddy simulation. J. Fluid Mech. 2002, 459, 1–42. [Google Scholar] [CrossRef] [Green Version]
  44. Wang, M.; Moin, P. Dynamic wall modeling for large-eddy simulation of complex turbulent flows. Phys. Fluids 2002, 14, 2043–2051. [Google Scholar] [CrossRef] [Green Version]
  45. Jiménez, J. Turbulent flows over rough walls. Annu. Rev. Fluid Mech. 2004, 36, 173–196. [Google Scholar] [CrossRef]
  46. Werner, H.; Wengle, H. Large-eddy simulation of turbulent flow over and around a cube in a plate channel. In Turbulent Shear Flows 8; Springer: Berlin/Heidelberg, Germany, 1993; pp. 155–168. [Google Scholar]
  47. Calaf, M.; Parlange, M.B.; Meneveau, C. Large eddy simulation study of scalar transport in fully developed wind-turbine array boundary layers. Phys. Fluids 2011, 23, 126603. [Google Scholar] [CrossRef] [Green Version]
  48. Hansen, M.O. Aerodynamics of Wind Turbines; Routledge: Abingdon, England, 2015. [Google Scholar]
  49. Shen, W.Z.; Zhang, J.H.; Sørensen, J.N. The actuator surface model: A new Navier–Stokes based model for rotor computations. J. Sol. Energy Eng. 2009, 131, 011002. [Google Scholar] [CrossRef]
  50. Du, Z.; Selig, M. A 3-D stall-delay model for horizontal axis wind turbine performance prediction. In Proceedings of the 1998 ASME Wind Energy Symposium, Reno, NV, USA, 12–15 January 1998; p. 21. [Google Scholar]
  51. Shen, W.Z.; Sørensen, J.N.; Mikkelsen, R. Tip loss correction for actuator/Navier–Stokes computations. J. Sol. Energy Eng. 2005, 127, 209–213. [Google Scholar] [CrossRef]
  52. Kang, S.; Yang, X.L.; Sotiropoulos, F. On the onset of wake meandering for an axial flow turbine in a turbulent open channel flow. J. Fluid Mech. 2014, 744, 376–403. [Google Scholar] [CrossRef]
  53. Veers, P.S. Three-Dimensional Wind Simulation; Technical Report; Sandia National Labs.: Albuquerque, NM, USA, 1988.
  54. Hunt, J.C.; Carruthers, D.J. Rapid distortion theory and the ‘problems’ of turbulence. J. Fluid Mech. 1990, 212, 497–532. [Google Scholar] [CrossRef] [Green Version]
  55. Larsen, G.C.; Machefaux, E.; Chougule, A. Wake meandering under non-neutral atmospheric stability conditions - Theory and facts. J. Phys. Conf. Ser. 2015, 625, 012036. [Google Scholar] [CrossRef] [Green Version]
  56. Foti, D.; Yang, X.; Campagnolo, F.; Maniaci, D.; Sotiropoulos, F. On the use of spires for generating inflow conditions with energetic coherent structures in large eddy simulation. J. Turbul. 2017, 18, 611–633. [Google Scholar] [CrossRef]
  57. Espana, G.; Aubrun, S.; Loyer, S.; Devinant, P. Spatial study of the wake meandering using modelled wind turbines in a wind tunnel. Wind Energy 2011, 14, 923–937. [Google Scholar] [CrossRef]
  58. Espana, G.; Aubrun, S.; Loyer, S.; Devinant, P. Wind tunnel study of the wake meandering downstream of a modelled wind turbine as an effect of large scale turbulent eddies. J. Wind Eng. Ind. Aerodyn. 2012, 101, 24–33. [Google Scholar] [CrossRef]
  59. Medici, D.; Alfredsson, P.H. Measurements behind model wind turbines: Further evidence of wake meandering. Wind Energy 2008, 11, 211–217. [Google Scholar] [CrossRef]
  60. Barlas, E.; Buckingham, S.; van Beeck, J. Roughness effects on wind-turbine wake dynamics in a boundary-layer wind tunnel. Bound.-Layer Meteorol. 2016, 158, 27–42. [Google Scholar] [CrossRef] [Green Version]
  61. Chamorro, L.P.; Hill, C.; Morton, S.; Ellis, C.; Arndt, R.E.A.; Sotiropoulos, F. On the interaction between a turbulent open channel flow and an axial-flow turbine. J. Fluid Mech. 2013, 716, 658–670. [Google Scholar] [CrossRef]
  62. Iungo, G.V.; Viola, F.; Camarri, S.; Porte-Agel, F.; Gallaire, F. Linear stability analysis of wind turbine wakes performed on wind tunnel measurements. J. Fluid Mech. 2013, 737, 499–526. [Google Scholar] [CrossRef] [Green Version]
  63. Viola, F.; Iungo, G.V.; Camarri, S.; Porte-Agel, F.; Gallaire, F. Prediction of the hub vortex instability in a wind turbine wake: stability analysis with eddy-viscosity models calibrated on wind tunnel data. J. Fluid Mech. 2014, 750. [Google Scholar] [CrossRef] [Green Version]
  64. Howard, K.B.; Singh, A.; Sotiropoulos, F.; Guala, M. On the statistics of wind turbine wake meandering: An experimental investigation. Phys. Fluids 2015, 27, 075103. [Google Scholar] [CrossRef]
  65. Foti, D.; Yang, X.; Guala, M.; Sotiropoulos, F. Wake meandering statistics of a model wind turbine: Insights gained by large eddy simulations. Phys. Rev. Fluids 2016, 1, 044407. [Google Scholar] [CrossRef]
  66. Foti, D.; Yang, X.; Campagnolo, F.; Maniaci, D.; Sotiropoulos, F. Wake meandering of a model wind turbine operating in two different regimes. Phys. Rev. Fluids 2018, 3, 054607. [Google Scholar] [CrossRef]
  67. Foti, D.; Yang, X.; Shen, L.; Sotiropoulos, F. Effect of wind turbine nacelle on turbine wake dynamics in large wind farms. J. Fluid Mech. 2019, 869, 1–26. [Google Scholar] [CrossRef]
  68. Okulov, V.L.; Naumov, I.V.; Mikkelsen, R.F.; Kabardin, I.K.; Sørensen, J.N. A regular Strouhal number for large-scale instability in the far wake of a rotor. J. Fluid Mech. 2014, 747, 369–380. [Google Scholar] [CrossRef]
  69. Coudou, N.; Buckingham, S.; Bricteux, L.; van Beeck, J. Experimental Study on the Wake Meandering Within a Scale Model Wind Farm Subject to a Wind-Tunnel Flow Simulating an Atmospheric Boundary Layer. Bound.-Layer Meteorol. 2018, 167, 77–98. [Google Scholar] [CrossRef]
  70. Yang, X.; Sotiropoulos, F. Wake characteristics of a utility-scale wind turbine under coherent inflow structures and different operating conditions. Phys. Rev. Fluids 2019, 4, 024604. [Google Scholar] [CrossRef]
  71. Heisel, M.; Hong, J.R.; Guala, M. The spectral signature of wind turbine wake meandering: A wind tunnel and field-scale study. Wind Energy 2018, 21, 715–731. [Google Scholar] [CrossRef]
  72. Andersen, S.J.; Sørensen, J.N.; Mikkelsen, R. Simulation of the inherent turbulence and wake interaction inside an infinitely long row of wind turbines. J. Turbul. 2013, 14, 1–24. [Google Scholar] [CrossRef]
  73. Chamorro, L.P.; Porte-Agel, F. Effects of Thermal Stability and Incoming Boundary-Layer Flow Characteristics on Wind-Turbine Wakes: A Wind-Tunnel Study. Bound.-Layer Meteorol. 2010, 136, 515–533. [Google Scholar] [CrossRef] [Green Version]
  74. Zhang, W.; Markfort, C.D.; Porte-Agel, F. Near-wake flow structure downwind of a wind turbine in a turbulent boundary layer. Exp. Fluids 2012, 52, 1219–1235. [Google Scholar] [CrossRef] [Green Version]
  75. Garcia, E.T.; Aubrun, S.; Boquet, M.; Royer, P.; Coupiac, O.; Girard, N. Wake meandering and its relationship with the incoming wind characteristics: A statistical approach applied to long-term on field observations. J. Phys. Conf. Ser. 2017, 854. [Google Scholar] [CrossRef] [Green Version]
  76. Foti, D.; Yang, X.; Sotiropoulos, F. Similarity of wake meandering for different wind turbine designs for different scales. J. Fluid Mech. 2018, 842, 5–25. [Google Scholar] [CrossRef]
  77. Campagnolo, F. Wind Tunnel Testing of Scaled Wind Turbine Models: Aerodynamics and Beyond. Ph.D. Thesis, Politecnico Di Milano, Milan, Italy, 2013. [Google Scholar]
  78. Berg, J.; Bryant, J.; LeBlanc, B.; Maniaci, D.C.; Naughton, B.; Paquette, J.A.; Resor, B.R.; White, J.; Kroeker, D. Scaled wind farm technology facility overview. In Proceedings of the 32nd ASME Wind Energy Symposium, National Harbor, MD, USA, 13–17 January 2014; p. 1088. [Google Scholar]
  79. Hong, J.; Toloui, M.; Chamorro, L.P.; Guala, M.; Howard, K.; Riley, S.; Tucker, J.; Sotiropoulos, F. Natural snowfall reveals large-scale flow structures in the wake of a 2.5-MW wind turbine. Nat. Commun. 2014, 5, 4216. [Google Scholar] [CrossRef]
  80. Yang, X.; Hong, J.; Barone, M.; Sotiropoulos, F. Coherent dynamics in the rotor tip shear layer of utility-scale wind turbines. J. Fluid Mech. 2016, 804, 90–115. [Google Scholar] [CrossRef] [Green Version]
  81. Yang, X.; Howard, K.B.; Guala, M.; Sotiropoulos, F. Effects of a three-dimensional hill on the wake characteristics of a model wind turbine. Phys. Fluids 2015, 27, 025103. [Google Scholar] [CrossRef]
  82. Schmid, P.J. Dynamic mode decomposition of numerical and experimental data. J. Fluid Mech. 2010, 656, 5–28. [Google Scholar] [CrossRef] [Green Version]
  83. Berkooz, G.; Holmes, P.; Lumley, J.L. The proper orthogonal decomposition in the analysis of turbulent flows. Annu. Rev. Fluid Mech. 1993, 25, 539–575. [Google Scholar] [CrossRef]
  84. Davies, M. A comparison of the wake structure of a stationary and oscillating bluff body, using a conditional averaging technique. J. Fluid Mech. 1976, 75, 209–231. [Google Scholar] [CrossRef]
  85. Bisset, D.; Antonia, R.; Browne, L. Spatial organization of large structures in the turbulent far wake of a cylinder. J. Fluid Mech. 1990, 218, 439–461. [Google Scholar] [CrossRef]
  86. Bayo, R.T.; Parro, G. Site suitability assessment with dynamic wake meandering model. A certification point of view. Energy Procedia 2015, 76, 177–186. [Google Scholar] [CrossRef] [Green Version]
  87. Yang, X.; Pakula, M.; Sotiropoulos, F. Large-eddy simulation of a utility-scale wind farm in complex terrain. Appl. Energy 2018, 229, 767–777. [Google Scholar] [CrossRef]
  88. Yang, Z.; Deng, B.Q.; Shen, L. Direct numerical simulation of wind turbulence over breaking waves. J. Fluid Mech. 2018, 850, 120–155. [Google Scholar] [CrossRef]
  89. Yang, Z.; Calderer, A.; He, S.; Sotiropoulos, F.; Krishnamurthy, R.; Leo, L.S.; Fernando, H.J.; Hocut, C.M.; Shen, L. Measurement-Based Numerical Study of the Effects of Realistic Land Topography and Stratification on the Coastal Marine Atmospheric Surface Layer. Bound.-Layer Meteorol. 2019, 171, 289–314. [Google Scholar] [CrossRef]
  90. Chawdhary, S.; Hill, C.; Yang, X.; Guala, M.; Corren, D.; Colby, J.; Sotiropoulos, F. Wake characteristics of a TriFrame of axial-flow hydrokinetic turbines. Renew. Energy 2017, 109, 332–345. [Google Scholar] [CrossRef] [Green Version]
  91. Yang, X.; Khosronejad, A.; Sotiropoulos, F. Large-eddy simulation of a hydrokinetic turbine mounted on an erodible bed. Renew. Energy 2017, 113, 1419–1433. [Google Scholar] [CrossRef]
  92. Musa, M.; Hill, C.; Sotiropoulos, F.; Guala, M. Performance and resilience of hydrokinetic turbine arrays under large migrating fluvial bedforms. Nat. Energy 2018, 3, 839. [Google Scholar] [CrossRef]
  93. Alexander, S.R.; Hamlington, P.E. Analysis of turbulent bending moments in tidal current boundary layers. J. Renew. Sustain. Energy 2015, 7, 063118. [Google Scholar] [CrossRef] [Green Version]
  94. Deng, B.Q.; Yang, Z.; Xuan, A.; Shen, L. Influence of Langmuir circulations on turbulence in the bottom boundary layer of shallow water. J. Fluid Mech. 2019, 861, 275–308. [Google Scholar] [CrossRef] [Green Version]
Figure 1. Schematic of wake meandering. Close to the turbine, the wake is dominated by the tip and hub vortices. Meandering occurs in the far wake, starting few rotor diameters (typically 3–5 rotor diameters) downwind and influenced by large-scale eddies in the atmosphere and shear-layer instabilities. Such instabilities can be triggered or enhanced by the interaction between the precessing hub vortex and the wake shear layer. This figure shows the isosurface of the vorticity magnitude and the contours of downwind velocity on a horizontal plane located at turbine hub height from a large-eddy simulation of the SWiFT turbine [2] with turbine blades and nacelle parameterized using the actuator surface model [3]. Red and blue colors represent high and low wind speed, respectively.
Energies 12 04725 g001
Figure 2. Comparison that examines the first origin of wake meandering, i.e., large-scale eddies, which drive the wake deficits as passive scalars. Comparison of the wake position predicted by the DWM model with the measurements for a 95 kW wind turbine. The measurement was taken using a nacelle-mounted LiDAR system. The wind direction data from the sonic anemometers were employed as input for the DWM model. A running average using a window size of two diameters was applied to the wind direction data to remove the variations due to small scale eddies. Reproduced from [14]. Reprinted with permission.
Energies 12 04725 g002
Figure 3. Wind tunnel experiments that examine the effects of large-scale eddies on wake meandering. The figure shows the wake centerline paths in the wake of a porous disk (axial induction factor α = 0.19 ): (a,b) under atmospheric turbulence with the integral length scale 7.5–10 times greater than the disk diameter; and (c,d) under isotropic turbulence with the integral length scale 3–10 times smaller than the disk diameter. The hub heights corresponding to the full scale are 40 m and 140 m for (a,b), respectively. The turbulence intensity of the downwind component is 3% and 12% for (c,d), respectively. Reproduced from [57]. Reprinted with permission.
Energies 12 04725 g003
Figure 4. Wind tunnel experiments that support the hypothesis that wake meandering is caused by shear layer instability similar to the vortex shedding of bluff bodies. (a) Time signal of the downwind velocity close to the centre of the tip vortices at 1D turbine downwind. (b) Strouhal number as a function of the tip speed ratio λ . ∘: U h = 8.3 m/s, no turbulence; □: U h = 8.5 m/s, 4.5% grid turbulence; ▵: U h = 5.5 m/s, no turbulence. (c) Thrust coefficient as function of the tip–speed ratio. +: 1 blade, pitch = 8 ; ×: 1 blade, pitch = 11 ; ◽, ◾: 2 blade, pitch = 8 ; , ⬥: 2 blade, pitch = 11 ; , : 3 blade, pitch = 11 . Meandering was not observed for the turbines with one blade. Filled symbols indicate the existence of wake meandering. Reproduced from [10,59]. Reprinted with permission.
Energies 12 04725 g004
Figure 5. Effects of hub vortex on wake meandering. (a) Hub vortex at two time instants visualized using a low-velocity core computed using geometry-resolving large-eddy simulation. T is the rotor rotating period. (bd) Time-averaged spanwise vorticity on the vertical plane passing through the rotor center for simulations using the actuator surface blade model only, the actuator surface models for blades and nacelle, and the immersed boundary geometry-resolving model, respectively. (a) is reproduced from [52]. (bd) are reproduced from [3]. Reprinted with permission.
Energies 12 04725 g005
Figure 6. The coexistence of the two mechanisms for the low frequency motions of turbine wakes. The figure shows the results from LES of a utility-scale turbine under the inflow with large-scale eddies. (a,b) Power spectral density (PSD) profiles from cases of different tip–speed ratios at different downwind locations. (c,d) Downwind variations of the maximum PSD and the corresponding frequency in two regions of different ranges of frequency for: (c) 0.01 f D / U h < 0.02 ; and (d) 0.14 f D / U h < 0.2 . The PSD is computed using the spanwise velocity fluctuations at different downwind locations along the rotor centerline. Red solid line: λ = 6.8 ; green dashed line: λ = 7.8 ; blue dash-dot line: λ = 8.8 ; and cyan dotted line: λ = 9.3 . Reproduced from [70]. Reprinted with permission.
Energies 12 04725 g006
Figure 7. Effects of turbines on the incoming large-scale eddies based on the measurements in a full-scale wind farm. The figure shows the premultiplied velocity spectra as a function of the Strouhal number for different deployments at different downwind locations. The shaded areas in (b) show the wake energy excess or wake energy deficit compared with that of inflow. Reproduced from [71]. Reprinted with permission.
Energies 12 04725 g007
Figure 8. The existence of similar wake meandering frequency in a wind farm. Large-eddy simulation of the Horns Rev wind farm. The figure shows the contours of the row-averaged pre-multiplied power spectral density as a function of the downwind distance and Strouhal number. Vertical blue lines delineate the axial location of each wind turbine. Annotations refer to the region of high PSD that is associated with wake meandering and the circles mark the maximum PSD in the wake meandering region in each corresponding turbine. Reproduced from [67]. Reprinted with permission.
Energies 12 04725 g008
Figure 9. Wake meandering characteristics for different turbine operational regimes. Instantaneous vorticity magnitude, ω D / U h , with velocity minima (dot) and meander profile (line) for: (a) Region 2, actuator surfaces models for both blades and nacelle (R2-BN); (b) Region 2, actuator surfaces models for blades only (R2-B); (c) Region 3, actuator surfaces models for both blades and nacelle (R3-BN); and (d) Region 3, actuator surfaces models for blades only (R3-B). Average meander profile (e) amplitude (A) and (f) wavelength ( λ ) with respect to distance from rotor plane, x/D, nondimensionalized by the diameter D. Black solid lines: R2-BN; black dashed line: R2-B; red solid lines: R3-BN; and red dashed line: R3-B. Reproduced from [66]. Reprinted with permission.
Energies 12 04725 g009
Figure 10. Similarity of wake meandering for different turbine designs: (a) amplitude of wake meanders scaled by rotor diameter; (b) amplitude of wake meanders scaled by the length scale L T , with squares [84] and circles [85] for the meandering amplitudes of bluff bodies; and (c) wavelength scaled by rotor diameter. Large-eddy simulation with actuator surface models for turbine blades and nacelle is employed for all the turbine simulations. Black lines: the model wind turbine; red lines: the G1 turbine; blue lines: the SWiFT turbine; and green lines: the EOLOS turbine. Reproduced from [76]. Reprinted with permission.
Energies 12 04725 g010