Article

Implementation and Assessment of a Model-Based Controller of Torque and Nitrogen Oxide Emissions in an 11 L Heavy-Duty Diesel Engine

1
FPT Motorenforschung AG, Schlossgasse 2, 9320 Arbon, Switzerland
2
Department of Energy, Politecnico di Torino, Corso Duca degli Abruzzi 24, 10129 Torino, Italy
*
Author to whom correspondence should be addressed.
Energies 2019, 12(24), 4704; https://doi.org/10.3390/en12244704
Submission received: 31 October 2019 / Revised: 4 December 2019 / Accepted: 6 December 2019 / Published: 10 December 2019

Abstract

:
A previously developed model-based controller of torque and nitrogen oxides emissions has been implemented and assessed on a heavy-duty 11 L FPT prototype Cursor 11 diesel engine. The implementation has been realized by means of a rapid prototyping device, which has allowed the standard functions of the engine control unit to be by-passed. The activity was carried out within the IMPERIUM H2020 EU Project, which is aimed at reducing the consumption of fuel and urea in heavy-duty trucks up to 20%, while maintaining the compliance with the legal emission limits. In particular, the developed controller is able to achieve desired targets of brake mean effective pressure (BMEP) (or brake torque) and engine-out nitrogen oxides emissions. To this aim, the controller adjusts the fuel quantity and the start of injection of the main pulse in real-time. The controller is based on a previously developed low-throughput combustion model, which estimates the heat release rate, the in-cylinder pressure, the BMEP (or torque) and the engine-out nitrogen oxide emissions. The controller has been assessed at both steady-state and transient operations, through rapid prototyping tests at the engine test bench and on the road.

Graphical Abstract

1. Introduction

Fuel consumption reduction has become a key aspect in the mobility sector, in order to reduce operating costs and face the impact of global warming. This is especially true for heavy-duty trucks, which typically perform long haul driving missions.
Recent technologies have been developed to reduce fuel consumption and include engine downsizing [1], alternative fuels [2], innovative combustion concepts [3,4], advanced high-pressure injection systems [5,6,7,8,9,10], model-based control [11,12,13,14,15], advanced aftertreatment systems [16], kinetic and thermal energy recovery [17], vehicle lightweight [18], electrification of the powertrain [19], and vehicle connectivity [20].
With reference to the previous solutions, model-based control will be a key-technology in the near future. In fact, this technology is suitable to be coupled with the emerging V2X systems, and will also be supported by the implementation of more and more powerful engine control units, as well as by the installation of new sensors on the vehicle.
The V2X communication technology is particularly attractive since it will allow the realization of intelligent transport systems, in order to reduce fuel consumption also on the basis of real traffic information. For example, in [21], the authors proposed a dynamic programming-based optimal speed planning algorithm for heavy-duty vehicles, which embeds a look-ahead function using traffic information. In that study, the authors showed that a significant decrease in fuel consumption can be obtained.
With reference to combustion control, model-based algorithms are attractive since they can be used to realize a real-time optimization of the engine performance. In addition, it should be noted that model-based controllers require a lower calibration effort than standard map-based systems. Model-based combustion control is expected to provide significant advantages for diesel engines, which are typically managed by a large number of control parameters.
Although the market share of diesel vehicles is decreasing in the last year for passenger car applications, it is expected that light-duty and heavy-duty vehicles will still be equipped with diesel engines in the next decades. With reference to the latter aspect, a three-year EU H2020 collaborative research project (IMPERIUM) started in 2016, with the aim of achieving fuel consumption and urea reduction of about 20% in heavy-duty trucks, while guaranteeing the fulfillment of the legal emission limits at the same time. Within the Euro VI regulation, heavy-duty engines are tested on the dynamometer over the WHSC (worldwide harmonized steady cycle) and the WHTC (worldwide harmonized transient cycle). The current legal limits for tailpipe NOx (nitrogen oxide) emissions are equal to 0.40 g/kWh over the WHSC and of 0.46 g/kWh over the WHTC. In addition, vehicle emissions are also measured directly on the road, by means of PEMS (portable emissions measurement system). The conformity factor concerning tailpipe NOx emissions is currently equal to 1.5.
The IMPERIUM consortium includes several partners from the academia and industry (see [13,14,15,16,17,18,19,20,21,22]). At the end of the project, three heavy-duty demonstrators were realized, in order to show the benefits achieved by means of the developed technologies. These benefits are realized through:
-
The direct optimization of the control strategy for the main powertrain components (e.g., engine, transmission), in order to maximize their performance.
-
The development of a model-based global powertrain energy manager supervisor, which optimizes the utilization of the different energy sources depending on the current driving situation.
-
The implementation and use of “look-ahead” systems, such as eHorizon, in order to realize long-term optimization strategies.
Within the IMPERIUM project, a real-time model-based controller of BMEP (Brake Mean Effective Pressure) and engine-out NOx emissions was realized by the authors and applied to an 11 L FPT prototype Cursor 11 heavy-duty diesel engine. The controller is capable of controlling BMEP (brake mean effective pressure), or torque, and NOx emissions by acting on the quantity of fuel injected in the combustion chamber and on the start of injection of the main pulse. The baseline version of the controller was presented and tested offline in a previous paper [13].
The present investigation is focused on the implementation of the controller on the same engine through rapid prototyping, and on the subsequent assessment at steady-state conditions and in transient operation by means of tests carried out at the engine test bench and on the road.

2. Experimental Setup and Engine Conditions

The engine adopted for the present activity is an FPT prototype 6-cylinder Cursor 11 diesel engine. The engine features a displacement of 11.1 dm3 and 4 valves per cylinder. Moreover, it is equipped with a VGT (Variable Geometry Turbine) turbine and a high pressure common rail injection system. The maximum power and torque of the engine are 353 kW and 2300 Nm, respectively.
The rapid prototyping tests on the engine were realized at a highly dynamic test bench in FPT Motorenforschung AG, Arbon.
The schemes and detailed description of the engine and of the test bench, including the main measurement sensors and related accuracy, are reported in [13] and have not been shown here for the sake of brevity.
The developed controller was tested on the engine by using the ETAS ES910 (ETAS, Stuttgart, Germany) rapid prototyping device, which is equipped with a Freescale PowerQUICC™ III MPC8548 processor with 800 MHz clock (double precision floating point unit), and features 512 Mbyte of DDR2 RAM (400 MHz clock) and 64 Mbyte of Flash Memory.
With reference to the development and calibration of the real-time combustion model that is used in the model-based controller, a set of about 2200 steady-state points was used (see [13]), which includes a full engine map carried out with or without pilot injection/EGR (Exhaust Gas Recirculation), sweeps of SOImain (main injection timing) and pf (injection pressure) at fixed key-points, and sweeps of EGR and VGT position. The details of these tests and of the model calibration can be found in [13]. With reference to the input variables used to assess the combustion model, three cases were considered in that study:
  • Case 1: All the input variables were derived from test bench sensors (best case).
  • Case 2: The available ECU (Engine Control Unit) variables were used as model inputs, except for the intake O2 concentration, which was obtained from test bench sensors.
  • Case 3: Only the available ECU variables were used as model inputs.
It should be noted that Case 3 is the most significant one, when the controller is implemented onboard.
The experimental tests which are considered in this paper, instead, have been used for the assessment and validation of the controller, and include:
  • Selected steady-state points on the engine map (Figure 1). These tests were used to perform a preliminary check of the controller functionality when implemented in the engine through rapid prototyping. In particular, for these tests, targets of BMEP and NOx for the controller were set according to the baseline engine map. The steady-state points were chosen in order to explore a wide range of the engine map, but keeping at the same time a safety margin from the full-load curve.
  • Load ramp tests carried out at several engine speed conditions, with and without EGR, in which the controller was activated or deactivated. The EGR valve position was controlled in the engine to realize the nominal EGR levels according to a look-up table. For a given ramp test, different NOx targets (nominal, ±20%, −40%) were set when the controller was activated, in order to fully assess its functionality. The summary of the ramp tests is reported in Table 1, while Figure 2 reports the time histories of the accelerator pedal position for the ramp tests carried out under baseline engine operating conditions (i.e., without controller active). As can be seen, two types of load ramp tests were considered, i.e., variations from 0% to 60%–70% of maximum load with intermediate steps, and variations from 0% to 60% of maximum load with different ramp durations.
Conventional diesel fuel (according to EN 590 regulations) was used, which is characterized by a cetane number equal to 54 and a lower heating value of 43 MJ/kg.

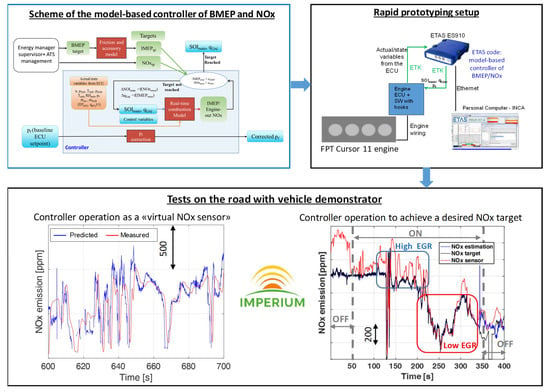
3. Description of the Model-Based Controller of BMEP and NOx

The controller is based on a previously developed real-time combustion model, whose scheme is reported in Figure 3.
The combustion model is capable of simulating the following quantities:
  • Released chemical energy (Qch): The model is based on an improved version of the accumulated fuel mass approach [23,24,25,26,27,28].
  • Net energy of the charge (Qnet): It is calculated as the difference between the released chemical energy and the heat exchanged by the charge with the walls.
  • In-cylinder pressure: A single-zone thermodynamic model [29] is applied, in which the net energy of the charge is used as input in order to calculate the in-cylinder pressure during the combustion phase. The in-cylinder pressure during the compression and expansion phases is obtained assuming polytropic processes. The PFP (peak firing pressure) and IMEPg (gross indicated mean effective pressure) metrics are then evaluated on the basis of the in-cylinder pressure [25].
  • Pumping and friction losses: A pumping model, which is based on the intake and exhaust manifold pressure levels, is used to estimate PMEP (pumping mean effective pressure), while FMEP (friction mean effective pressure) is evaluated by adopting the Chen–Flynn model [30]. The evaluation of PMEP and FMEP allows IMEPn (net indicated mean effective pressure) and BMEP (brake mean effective pressure) to be estimated.
  • Engine-out NOx emissions: The approach described in [13,31] was adopted. In particular, NOx emissions are estimated as the sum of two terms, i.e., the nominal NOx level, which is emitted by the engine when it operates with the baseline calibration map, and a NOx deviation term. The latter term is a function of the deviations of the intake oxygen concentration (δO2) and MFB50 (δMFB50) with respect to the values that occur with the baseline engine calibration map.
The previously described model has been used to develop the model-based controller of BMEP and engine-out NOx emissions. The scheme of the controller is provided in Figure 4.
The controller is included in a more comprehensive energy manager supervisor of the vehicle, which optimizes the operation of the different energy sources on the basis of the current driving conditions. This supervisor includes a look-ahead function, which exploits a dynamic eHorizon system, in order to realize a long-term optimization strategy. From the scheme reported in Figure 4, it can be seen that the BMEP/NOx controller receives from the vehicle energy supervisor the targets of engine-out NOx emissions (NOxtgt) and indicated mean effective pressure (IMEPtgt), and corrects the injected fuel quantity (qf,inj) and the start of injection of the main pulse (SOImain) in order to achieve the desired targets. To this aim, an iterative procedure is implemented, in which the correction of SOImain is based on the NOx error, while the correction of qf,inj is based on the IMEP error. The iterative procedure is completed within a single engine firing (120 degrees of crank angle), so that a cycle-by-cycle control is realized. A correction of the injection pressure pf, with respect to the baseline value which derives from the ECU maps, is also implemented. This correction has been adopted in order to reduce the soot penalties which occur when SOImain is delayed, as a consequence of a low NOx target request.
The core of the controller is a real-time mean value combustion model, that was presented and assessed in [13] for the same engine considered in the present study.
The controller structure is described in detail in [13], in which the correction schemes for SOImain and qf,inj are reported.
Finally, several features were implemented in the controller in order to improve its robustness, safety sensitivity in case of failure in the estimation of the input variables. These features include:
  • the adoption of upper/lower saturation for all the input quantities;
  • the adoption of upper/lower saturation of SOImain and qf,inj, in order to avoid the exceeding of the peak firing pressure and exhaust gas temperature limits, as well as to avoid excessive penalizations in terms of BSFC;
  • the adoption of an output buffer for SOImain and qf,inj, in order to remove high frequency oscillations deriving from input variable noise.
Moreover, the controller is deactivated when the values of engine speed and injected fuel quantity are below a user-defined threshold. This feature was added in order to improve functionality robustness during the engine start and when a transition occurs from positive torque to cut-off conditions and vice versa.
The developed controller has been implemented on the real engine through rapid prototyping (RP).
The rapid prototyping setup is shown in Figure 5.
It can be seen in the figure that the ETAS RP device receives the needed input signals for the BMEP/NOx controller (i.e., the actual/state variables) from the ECU via ETK, which is an ethernet-based communication interface. The algorithm then evaluates the values of qf,inj and SOImain that allow the desired targets of BMEP and NOx to be achieved (see Figure 3), and writes these values in the ECU via ETK. Therefore, the standard values which derive from the engine maps are by-passed. This has been made possible by the implementation of a modified ECU software, which includes several hooks for the variables to be by-passed. The injection pressure pf is also sent to the ECU in by-pass, since a correction with respect to the baseline ECU value is applied, in order to compensate for the soot increase that would occur when delaying the start of injection.

4. Results and Discussion

4.1. Real-Time Combustion Model

A detailed analysis of the accuracy of the real-time combustion model which was used in the controller was reported in [13]. Table 2 reports the RMSE (root mean square error) for the prediction of BMEP and NOx at steady-state conditions.
It can be seen in the table that the BMEP prediction is not affected significantly by the type of input signals, while the NOx prediction accuracy deteriorates when using the ECU signals, as a consequence of a less precise estimation of the EGR rate than that obtained using test bench sensors.

4.2. Controller of BMEP and NOx: Assessment at Steady-State Operation

The controller was first tested at steady-state conditions for the engine points reported in Figure 1. The input variables derived from the engine sensors were used in the controller.
Figure 6 shows, for the different operating conditions, a comparison between the target values (blue bars) and the measured values (orange bars) of NOx emissions (Figure 6a) and BMEP (Figure 6b). The NOx emissions were measured using the test bench gas analyzer. The absolute values of NOx emissions were not reported for confidentiality reasons. The reported points are ordered from low power to high power.
It can be seen that the errors are in line with the combustion model accuracy shown in Table 2.
The root mean square error of the relative NOx error is of the order of 7.8%. With reference to the operation of the controller, it was verified that the average number of required iterations to achieve convergence is of the order of 6. It should also be noted that a maximum number of 8 iterations is set in the controller, in order to improve robustness and avoid time overrun.

4.3. Controller of BMEP and NOx, Assessment in Transient Operation: NOx Control

The controller has then been assessed over the transient tests reported in Table 1. With reference to the NOx control, considering that several conditions were investigated for each single ramp test (controller ‘ON’ with nominal target, controller ‘ON’ with NOx target deviations of ±20% and −40%), the detailed results of only two ramp tests (i.e., ramp test 3 and ramp test 4 in Table 1) have been reported in this section for the sake of brevity. These two ramp tests have been selected since they are characterized by different time histories of the engine load. In particular, with reference to ramp test 3, a load variation from 0% to 75% of the maximum torque was realized at N = 1900 rpm, with intermediate load steps. With reference to ramp test 4, instead, ramp load variations from 0% to 60% of the maximum torque (and vice-versa) were realized at N = 1100 rpm, considering different ramp durations. The time histories of the load are reported in Figure 2.
With reference to ramp test 3, Figure 7 reports the time histories of the measured NOx emissions (Figure 7a,c) and of SOImain (Figure 7b,d) for the cases in which EGR is closed and with nominal EGR level, considering different NOx targets. The absolute values of NOx emissions and of SOImain were not reported for confidentiality reasons. The nominal NOx target levels were identified on the basis of a look-up table, function of engine speed and load, which was derived on the basis of the measured NOx emissions at steady-state operation over the full engine map, with the baseline configuration of the ECU variables. In particular, in each chart four different cases were considered, i.e.:
  • Engine operation with controller enabled and nominal NOx target (blue lines).
  • Engine operation with controller enabled and NOx target increased of 20% with respect to the nominal one (magenta lines).
  • Engine operation with controller enabled and NOx target decreased of 20% with respect to the nominal one (green lines).
  • Engine operation with controller enabled and NOx target decreased of 40% with respect to the nominal one (black lines).
For the cases in which NOx target deviations of +20% and −20%/−40% were set, the percentage difference of the measured cumulative NOx emissions (ppm), with respect to the baseline case with nominal NOx target have also been reported. The NOx trends shown in the charts were measured by means of the engine NOx sensor. In all the charts, the origin of the y-axis is the same for all the related figures.
In general, it can be seen from the charts how the controller progressively advances/delays the values of SOImain in order to increase/decrease the engine-out NOx levels.
It can also be noted that the percentage differences of the cumulative NOx emissions, with respect to the baseline case with nominal NOx target, are in line with the targets, except for the case in which a NOx target of −40% is requested when EGR is closed (Figure 7a). In this case, in fact, the percentage difference of the cumulative NOx emissions is of the order of −28.2%. The main reason for this behavior is due to the fact that, for the considered case, the lower SOImain safety boundary is often achieved. This can be seen in Figure 8, which shows the time histories of SOImain for the ramp test 3 without EGR (a) and with EGR (b). In the figure, the actuated SOImain is indicated with black lines, the reference SOImain from ECU is reported with red lines, and the safety SOImain boundaries are reported with green lines.
It can be seen from Figure 8 that the lower SOImain safety boundary is often achieved, especially for the case in which EGR is not used (Figure 9a). As a consequence, in these conditions, the desired NOx target cannot be achieved.
The results concerning the ramp test 4 are instead reported in Figure 9. Similarly to Figure 7 and Figure 9 reports the time histories of the measured NOx levels (Figure 9a,c) and of SOImain (Figure 9b,d) for the condition in which EGR is closed (Figure 9a,b) or with nominal EGR level (Figure 9c,d), considering different NOx targets. For the cases in which NOx target deviations of +20% and −20%/−40% were set, the percentage difference of the cumulative NOx emissions (ppm), with respect to the baseline case with nominal NOx target have also been reported.
Also, in this case, it can be seen how the controller progressively advances/delays the values of SOImain in order to increase/decrease the engine-out NOx levels.
The percentage differences of the cumulative NOx emissions, with respect to the baseline case with nominal NOx target, are in line with the target requests also for this ramp test, except for the case in which a NOx target of −40% with respect to the nominal one, is requested. With reference to the case without EGR, similarly to the previous case, the main reason of this behavior is due to the fact that the lower SOImain safety boundary is sometimes achieved when a very low NOx target is requested. With reference to the case with EGR, the lower SOImain safety boundaries are not achieved. Therefore, the error is due to inaccuracies in the model. However, a significant contribution to these inaccuracies may be related to a difficult estimation of EGR in transient operation. This effect will be discussed in Section 4.5.
A summary is finally reported of the performance of the controller over the entire set of transient conditions, with specific reference to the NOx control. In particular, a cumulative NOx index was estimated by integrating the instantaneous NOx concentration for all the investigated tests, and the relative differences in the values of the cumulative NOx index, with respect to the baseline case in which the controller is activated with nominal NOx target, were calculated. The results are reported in Table 3. The values indicated with bold underlined text in Table 3 refer to test conditions in which the boundaries of SOImain are achieved for a significant portion of the test, while the values indicated with underlined text indicate the test conditions in which the boundaries of SOImain are achieved, but for a limited portion of the test.
It can be noted in the table how, in general, the controller is effective in reducing/increasing the cumulative NOx emissions, with respect to the reference case, even for the conditions in which EGR is enabled. It was in fact observed, for these cases, that larger deviations occur between the instantaneous NOx target levels and the measured NOx emissions, as a consequence of a difficult EGR estimation in dynamic condition that is given to the controller as input.

4.4. Controller of BMEP and NOx, Assessment in Transient Operation: BMEP Control

In this section, the performance of the controller has been investigated concerning the BMEP control. In particular, Figure 10 and Figure 11 report a comparison of the target and measured BMEP levels for all the transient tests reported in Table 1.
In general, the performance of the controller is very good for all the investigated tests. It can, in fact, be seen that the desired targets of BMEP are in general achieved, regardless of the NOx target and of the activation/deactivation of EGR.
Some deviations can sometimes be detected, such as those shown in Figure 10e,f during the time interval between 60 and 90 s. It was verified that these deviations derive from a combination of several effects, such as inaccuracy of the combustion model, inaccuracy of the injector maps embedded in the ECU, and inaccuracy of the EGR rate estimated by the ECU.
It can also be observed in Figure 11b that lower BMEP values are realized, with respect to the target, for the ramp test 4 with EGR at the end of the increasing load ramps. This behavior is likely to be due to a too low level of the intake O2 concentration, which leads to a non-optimal combustion.
The general behavior of the controller, however, is acceptable, since the injected fuel quantity is increased/decreased, with respect to the baseline level, in order to compensate for the different engine thermal efficiency when SOImain is delayed/anticipated in order to achieve the desired NOx targets. This can be seen in Figure 12a, which reports, as an example, the time histories of the measured injected fuel quantity for the ramp test 5 without EGR. It can be seen in the figure how the injected quantities are different for the different cases, and the realized BMEP levels are in line with the targets (see Figure 11c). For the sake of completeness, Figure 12b reports the time histories of the measured NOx levels, as well as the percentage difference of the cumulative NOx emissions (ppm), with respect to the baseline case with nominal NOx target.

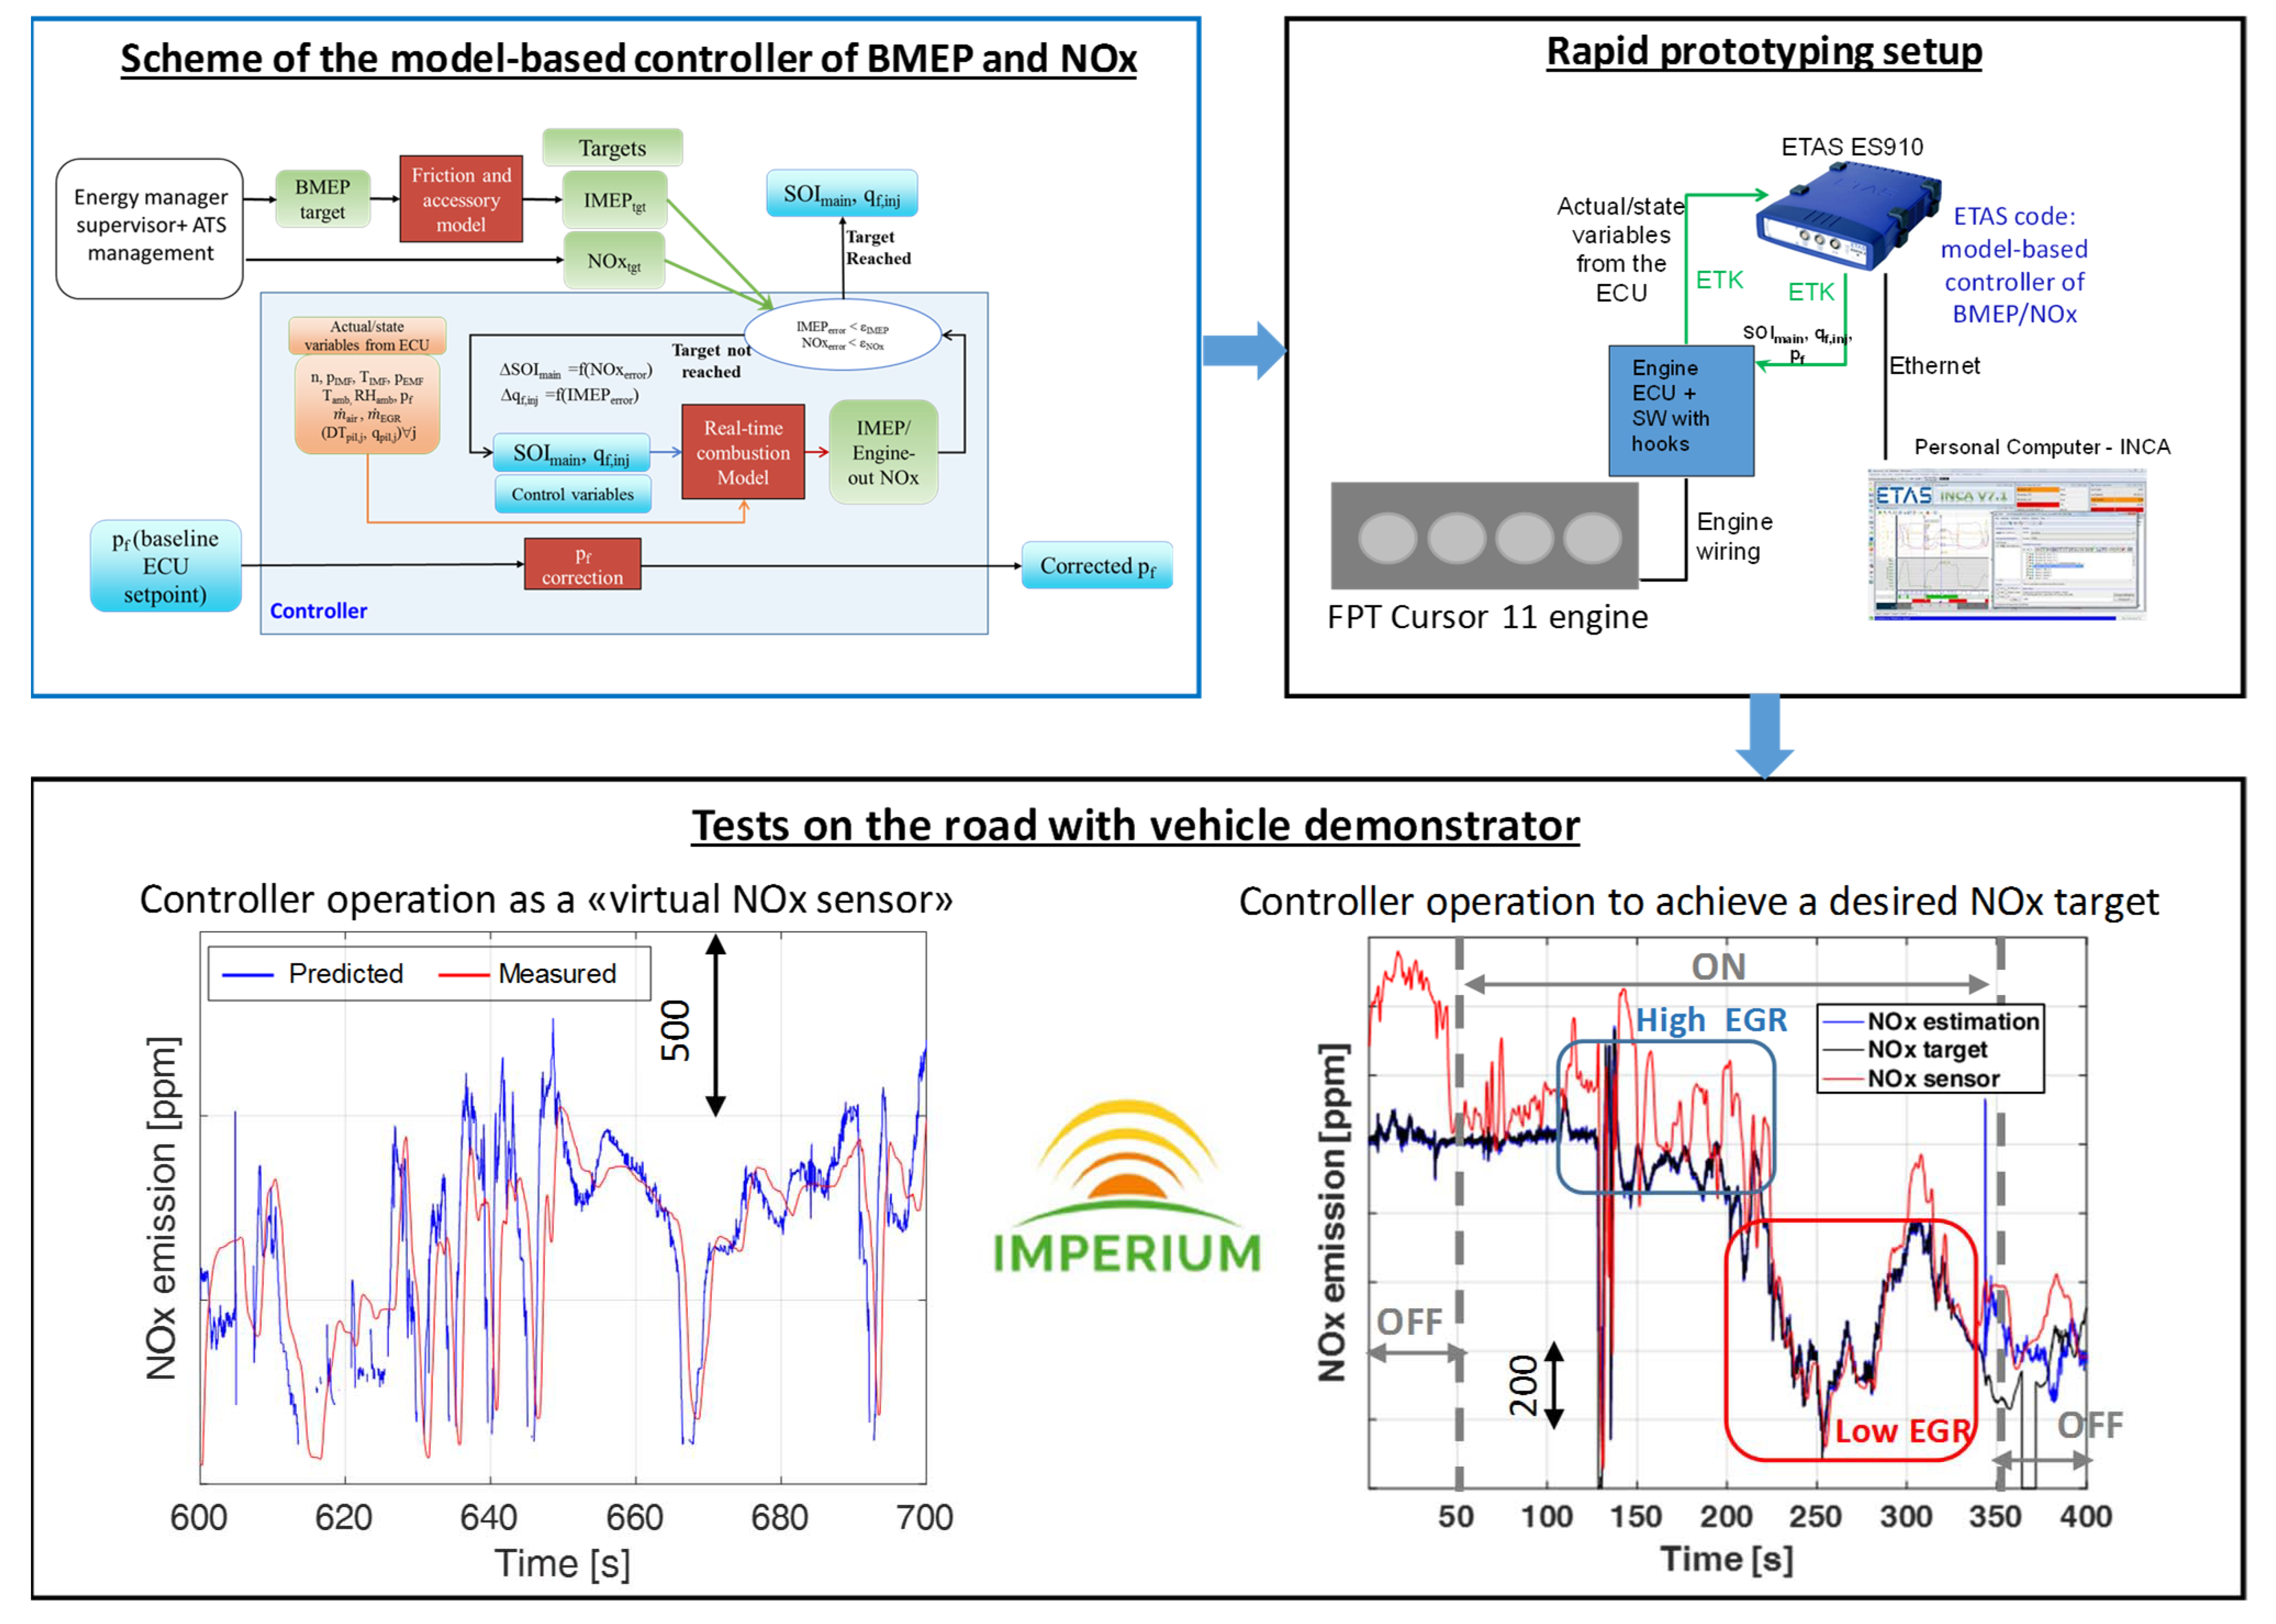
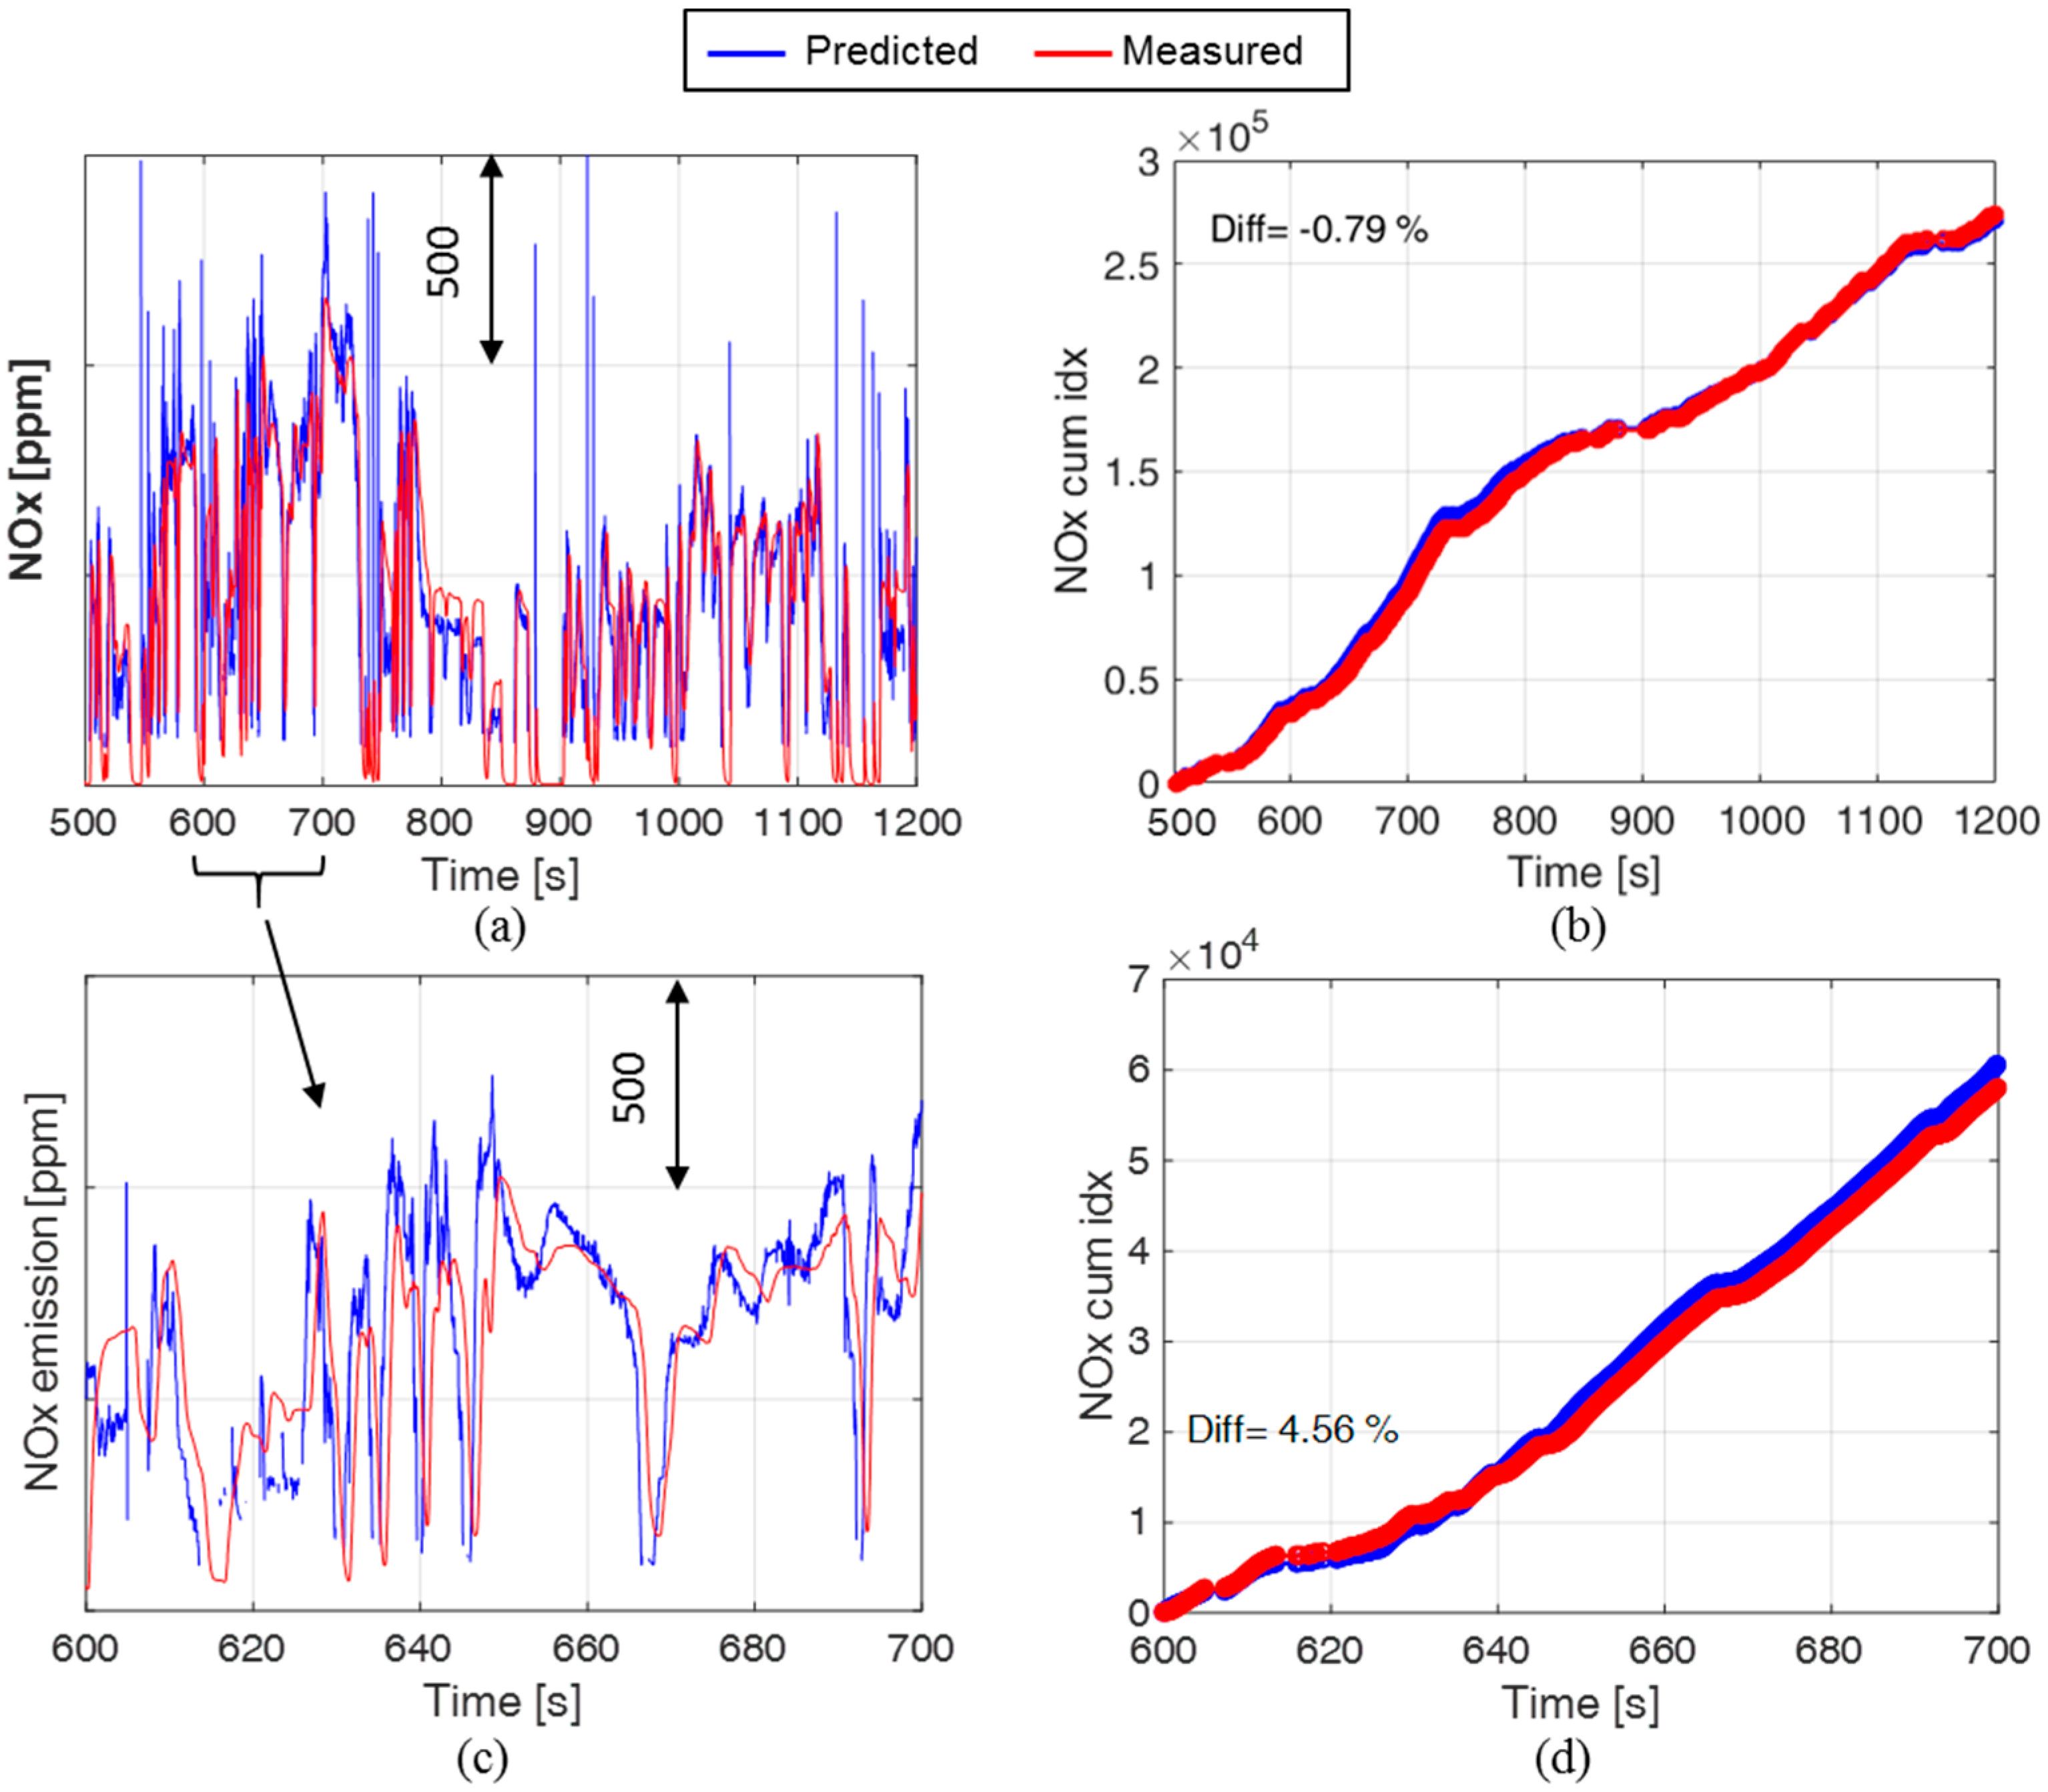
4.5. Preliminary Tests on the Road: NOx Control

Preliminary tests of the controller of BMEP and NOx have also been carried out on the road after the engine installation on the vehicle demonstrator, in view of the final assessment of the IMPERIUM project. These tests covered a run from the city of Genova to the city of Asti (and vice-versa), and have demonstrated the basic functionality of the controller, since no crashes occurred in the software. Some preliminary results are shown in this section.
During the tests, the controller was de-activated when the engine ran in warm-up mode. However, the combustion model was running in background in these cases, and it was able to simulate the NOx emissions (thus working as a virtual sensor) using, as input, the control variables which were set by the ECU. Some results are shown in Figure 13, which reports the predicted (blue line) and measured (red line) engine-out NOx emissions along a time interval between t = 500 s and t = 1200 s over the Genova–Asti run, when the engine was operating in warm up mode. Figure 13a shows the instantaneous emissions, while Figure 13b shows the cumulative NOx index. Figure 13c,d report a detail of the results in the time interval between t = 500 s and t = 600 s. It can be seen that the accuracy of the model is very high, also considering that it was not calibrated in this working mode. It should also be remarked that the mission had a duration of 1.5 h and the reported time interval is representative of the accuracy of the model over the whole mission. Moreover, in general, the trend of the NOx emissions measured by the engine sensor shows a smoother and little delayed behavior with respect to the trend calculated by the combustion model. This could be due to the fact that controller estimates a “cylinder out” NOx concentration for each combustion firing, while the engine sensor measures the concentration in the exhaust manifold, after that mixing phenomena occur.
Figure 14 shows a time interval of the Asti–Genova run, in which the controller was activated (at t = 50 s) and the engine operated in normal mode.
Figure 14a reports the time histories of the requested NOx emissions (black line), of the measured NOx emissions (red line) and of the NOx emissions estimated by the controller (blue line). The NOx emissions estimated by the controller should always be coincident with the requested levels, except for the cases in which the safety boundary level of SOImain is achieved. Figure 14b, instead, reports the time history of the EGR valve position.
In the first part of the trace reported in Figure 14a, (indicated with ‘OFF’), the by-pass hooks were disabled and therefore NOx target was not realized, since the values of SOImain and qf,inj elaborated by the controller were not sent to the ECU. Subsequently, the by-pass hooks were enabled and NOx concentration quickly achieved the target. Moreover, considering the part of mission in which the optimizer is working, the results indicate that when the EGR valve tends to be closed, the accuracy in the instantaneous control of NOx emissions is very high, while it deteriorates when the EGR valve is activated.
This deviation is likely to be due to the fact that the controller requires the intake oxygen concentration as input, and in the present application this quantity was estimated on the basis of the EGR and air mass levels that are estimated by the air path sub-models embedded in the ECU. These models are accurate at steady-state operation, but were not yet calibrated in transient operation, and therefore, they cannot capture the highly transient phenomena which occur in the intake manifold in these conditions. A suitable calibration of the air path sub-models embedded in the ECU in dynamic conditions, or the installation of an intake O2 sensor may lead to a significant improvement in the performance of the controller when EGR is adopted.
However, by calculating the cumulative emissions, a relatively small error between the desired and measured NOx levels is detected, even considering the interval in which EGR is activated.

5. Conclusions

In this paper, a previously developed model-based controller of BMEP (brake mean effective pressure), or torque, and nitrogen oxides emissions (NOx) has been implemented and assessed on an 11 L FPT prototype heavy-duty Cursor 11 diesel engine. The controller acts on the injected fuel quantity (qf,inj) and on the start of injection of the main pulse (SOImain) in order to achieve the desired targets.
The activity was carried out within the IMPERIUM H2020 EU Project.
The controller has been assessed at both steady-state and transient operations, through rapid prototyping tests carried out at the engine test bench. Moreover, preliminary tests were carried out on the road using the vehicle demonstrator.
The main results can be summarized as follows:
  • Concerning the steady-state tests acquired at the engine test bench, the average values of the root mean square error (RMSE) are of the order of 100 ppm with reference to the control of NOx emissions, and of the order of 0.3 bar with reference to the control of BMEP. The root mean square error of the relative NOx error is of the order of 7.8%.
  • Concerning the transient tests acquired at the engine test bench, it was found that the control of BMEP is very accurate for all the investigated tests. With reference to the control of NOx emissions, it was verified that the cumulative NOx emissions are in line with the target levels when different NOx targets are set, and this confirms the effectiveness of the proposed approach.
  • By analyzing the data acquired at the engine test bench, it was verified that if a too low or too high target of NOx emissions is requested, the limitation in the actuated value of SOImain is realized correctly. This limitation is designed for safety reasons (e.g., in order to avoid too high exhaust temperatures/peak firing pressure levels, or to avoid an excessive penalization in terms of engine thermal efficiency), so that the target cannot be achieved but the engine integrity is guaranteed.
  • Concerning the road tests, the basic functionality of the controller and the NOx control accuracy observed at the engine test bench were confirmed. It was also verified that, when the EGR valve tends to be closed, the accuracy in the instantaneous control of NOx emissions is very high, while it deteriorates when the EGR valve is activated. This deviation is likely to be due to inaccuracies in the estimation of the intake oxygen concentration on the basis of the air-path models of EGR and air mass embedded in the ECU.
  • The installation of an intake O2 sensor may lead to a significant improvement in the performance of the controller, concerning the instantaneous control of NOx emissions, when EGR is adopted.
  • During the on-road tests, it was verified that the controller could be used as an accurate virtual NOx sensor even when it was disabled over specific engine modes. This functionality can be very useful, especially in case the engine NOx sensor has not yet achieved warm-up conditions and cannot provide reliable measurements.

Author Contributions

The authors equally contributed to the deployment of the paper. Conceptualization, R.F., O.M. and E.S.; Methodology, R.F. and O.M.; Software, O.M.; Formal Analysis, R.F. and O.M; Data Curation, R.F. and O.M.; Writing—Original Draft Preparation, R.F. and O.M.; Writing—Review and Editing, R.F., O.M. and G.H.; Supervision, E.S.; Resources; F.C. and G.H.

Funding

The research leading to these results received funding from the European Union’s Horizon 2020 research and innovation programme under grant agreement n°713,783 (IMPERIUM) and from the Swiss State Secretariat for Education, Research and Innovation (SERI) under contract n°16.0063 for the Swiss consortium members.

Conflicts of Interest

The authors declare no conflict of interest.

Abbreviations

ATSafter-treatment system
BMEPBrake Mean Effective Pressure (bar)
CAcrank angle (deg)
DTdwell-time
ECUEngine Control Unit
EGRExhaust Gas Recirculation
FMEPFriction Mean Effective Pressure (bar)
FPTFPT Industrial
HCCIHomogeneous Charge Compression Ignition
IMEPIndicated Mean Effective Pressure (bar)
IMEPggross Indicated Mean Effective Pressure (bar)
IMEPnnet Indicated Mean Effective Pressure (bar)
IMPERIUMIMplementation of Powertrain Control for Economic and Clean Real driving emIssion and fuel ConsUMption
mmass
m ˙ a i r mass flow rate of fresh air
m ˙ E G R mass flow rate of EGR
MFB50crank angle at which 50% of the fuel mass fraction has burned (deg)
Nengine rotational speed (1/min)
O2intake charge oxygen concentration (%)
ppressure (bar)
PCCIPremixed Charge Compression Ignition
pEMFexhaust manifold pressure (bar abs)
PEMSPortable Emissions Measurement System
pfinjection pressure (bar)
PFPpeak firing pressure
pIMFintake manifold pressure (bar abs)
PMEPPumping Mean Effective Pressure (bar)
qinjected fuel volume quantity (mm3)
Qchchemical heat release
qf,injtotal injected fuel volume quantity per cycle/cylinder
Qnetnet heat release
Rhambambient relative humidity
RMSEroot mean square error
SOIelectric start of injection
SOImainelectric start of injection of the main pulse
ttime
Ttemperature (K)
Tambambient temperature
TIMFintake manifold temperature
V2Xvehicle-to-everything technology
VGTVariable Geometry Turbine
VPMVirtual Pressure Model
WHSCWorldwide Harmonized Steady Cycle
WHTCWorldwide Harmonized Transient Cycle

References

  1. Xue, X.; Rutledge, J. Potentials of Electrical Assist and Variable Geometry Turbocharging System for Heavy-Duty Diesel Engine Downsizing; SAE Technical Paper 2017-01-1035; SAE International: Warrendale, PA, USA, 2017. [Google Scholar] [CrossRef]
  2. Di Iorio, S.; Beatrice, C.; Guido, C.; Napolitano, P.; Vassallo, A.; Ciaravino, C. Impact of Biodiesel on Particle Emissions and DPF Regeneration Management in a Euro5 Automotive Diesel Engine; SAE Technical Paper 2012-01-0839; SAE International: Warrendale, PA, USA, 2012. [Google Scholar] [CrossRef]
  3. D’Ambrosio, S.; Gaia, F.; Iemmolo, D.; Mancarella, A.; Salamone, N.; Vitolo, R.; Hardy, G. Performance and Emission Comparison between a Conventional Euro VI Diesel Engine and an Optimized PCCI Version and Effect of EGR Cooler Fouling on PCCI Combustion; SAE Technical Paper 2018-01-0221; SAE International: Warrendale, PA, USA, 2018. [Google Scholar] [CrossRef]
  4. Andert, J.; Wick, M.; Lehrheuer, B.; Sohn, C.; Albin, T.; Pischinger, S. Autoregressive modeling of cycle-to-cycle correlations in homogeneous charge compression ignition combustion. Int. J. Engine Res. 2017, 19, 790–802. [Google Scholar] [CrossRef]
  5. Ferrari, A.; Mittica, A.; Pizzo, P.; Jin, Z. PID Controller Modelling and Optimization in Cr Systems with Standard and Reduced Accumulators. Int. J. Automot. Technol. 2018, 19, 771–781. [Google Scholar] [CrossRef]
  6. Catania, A.E.; Ferrari, A.; Mittica, A.; Spessa, E. Common Rail without Accumulator: Development, Theoretical-Experimental Analysis and Performance Enhancement at DI-HCCI Level of a New Generation FIS; SAE Technical Paper 2007-01-1258; SAE International: Warrendale, PA, USA, 2007. [Google Scholar] [CrossRef]
  7. Ferrari, A.; Mittica, A.; Pizzo, P.; Wu, X.; Zhou, H. New methodology for the identification of the leakage paths and guidelines for the design of common rail injectors with reduced leakage. J. Eng. Gas Turbines Power 2018, 140, 022801. [Google Scholar] [CrossRef]
  8. Ferrari, A.; Mittica, A.; Paolicelli, F.; Pizzo, P. Hydraulic Characterization of Solenoid-actuated Injectors for Diesel Engine Common Rail Systems. Energy Procedia 2016, 101, 878–885. [Google Scholar] [CrossRef]
  9. Ferrari, A.; Manno, M.; Mittica, A. Cavitation analogy to gasdynamic shocks: Model conservativeness effects on the simulation of transient flows in high-pressure pipelines. J. Fluids Eng. 2008, 130, 031304. [Google Scholar] [CrossRef]
  10. Catania, A.; Ferrari, A.; Mittica, A. High-pressure rotary pump performance in multi-jet common rail systems. ESDA2006, Engineering Systems Design and Analysis, Fatigue and Fracture, Heat Transfer, Internal Combustion Engines, Manufacturing and Technology and Society. In Proceedings of the 8th Biennial ASME Conference on Engineering Systems Design and Analysis, Torino, Italy, 4–7 July 2006; Volume 4, pp. 557–565. [Google Scholar] [CrossRef]
  11. Finesso, R.; Marello, O.; Misul, D.; Spessa, E.; Violante, M.; Yang, Y.; Hardy, G.; Maier, C. Development and Assessment of Pressure-Based and Model-Based Techniques for the MFB50 Control of a Euro VI 3.0L Diesel Engine. SAE Int. J. Engines 2017, 10, 1538–1555. [Google Scholar] [CrossRef]
  12. Finesso, R.; Marello, O.; Spessa, E.; Yang, Y.; Hardy, G. Model-Based Control of BMEP and NOx Emissions in a Euro VI 3.0L Diesel Engine. SAE Int. J. Engines 2017, 10, 2288–2304. [Google Scholar] [CrossRef]
  13. Finesso, R.; Hardy, G.; Mancarella, A.; Marello, O.; Mittica, A.; Spessa, E. Real-Time Simulation of Torque and Nitrogen Oxide Emissions in an 11.0 L Heavy-Duty Diesel Engine for Model-Based Combustion Control. Energies 2019, 12, 460. [Google Scholar] [CrossRef] [Green Version]
  14. Hu, S.; d’Ambrosio, S.; Finesso, R.; Manelli, A.; Marzano, M.R.; Mittica, A.; Ventura, L.; Wang, H.; Wang, Y. Comparison of Physics-Based, Semi-Empirical and Neural Network-Based Models for Model-Based Combustion Control in a 3.0 L Diesel Engine. Energies 2019, 12, 3423. [Google Scholar] [CrossRef] [Green Version]
  15. Nuss, E.; Wick, M.; Andert, J.; De Schutter, J.; Diehl, M.; Abel, D.; Albin, T. Nonlinear model predictive control of a discrete-cycle gasoline-controlled auto ignition engine model: Simulative analysis. Int. J. Engine Res. 2019, 20, 1025–1036. [Google Scholar] [CrossRef]
  16. Meda, L.; Shu, Y.; Romzek, M. Heavy Duty Diesel After-Treatment System Analysis Based Design: Fluid, Thermal and Structural Considerations; SAE Technical Paper 2009-01-0624; SAE International: Warrendale, PA, USA, 2009. [Google Scholar] [CrossRef]
  17. Yamaguchi, T.; Aoyagi, Y.; Uchida, N.; Fukunaga, A.; Kobayashi, M.; Adachi, T.; Hashimoto, M. Fundamental Study of Waste Heat Recovery in the High Boosted 6-cylinder Heavy Duty Diesel Engine. SAE Int. J. Mater. Manf. 2015, 8, 209–226. [Google Scholar] [CrossRef]
  18. Delogu, M.; Zanchi, L.; Dattilo, C.; Maltese, S.; Riccomagno, R.; Pierini, M. Take-Home Messages from the Applications of Life Cycle Assessment on Lightweight Automotive Components; SAE Technical Paper 2018-37-0029; SAE International: Warrendale, PA, USA, 2018. [Google Scholar] [CrossRef]
  19. Finesso, R.; Misul, D.; Spessa, E.; Venditti, M. Optimal Design of Power-Split HEVs Based on Total Cost of Ownership and CO2 Emission Minimization. Energies 2018, 11, 1705. [Google Scholar] [CrossRef] [Green Version]
  20. Talavera, E.; Díaz-Álvarez, A.; Jiménez, F.; Naranjo, J.E. Impact on Congestion and Fuel Consumption of a Cooperative Adaptive Cruise Control System with Lane-Level Position Estimation. Energies 2018, 11, 194. [Google Scholar] [CrossRef] [Green Version]
  21. Johansson, I.; Jin, J.; Ma, X.; Pettersson, H. Look-ahead speed planning for heavy-duty vehicle platoons using traffic information. Transp. Res. Procedia 2017, 22, 561–569. [Google Scholar] [CrossRef]
  22. Danninger, A.; Armengauda, E.; Milton, G.; Lützner, J.; Hakstege, B.; Zurlo, G.; Schöni, A.; Lindberg, J.; Krainer, F. IMplementation of Powertrain Control for Economic and Clean Real driving emIssion and fuel ConsUMption. In Proceedings of the 7th Transport Research Arena TRA 2018, Vienna, Austria, 16–19 April 2018. [Google Scholar]
  23. Finesso, R.; Spessa, E.; Yang, Y.; Alfieri, V.; Conte, G. HRR and MFB50 Estimation in a Euro 6 Diesel Engine by Means of Control-Oriented Predictive Models. SAE Int. J. Engines 2015, 8, 1055–1068. [Google Scholar] [CrossRef]
  24. Finesso, R.; Spessa, E.; Yang, Y. Development and Validation of a Real-Time Model for the Simulation of the Heat Release Rate, In-Cylinder Pressure and Pollutant Emissions in Diesel Engines. SAE Int. J. Engines 2016, 9, 322–341. [Google Scholar] [CrossRef]
  25. Catania, A.E.; Finesso, R.; Spessa, E. Predictive zero-dimensional combustion model for DI diesel engine feed-forward control. Energy Convers. Manag. 2011, 52, 3159–3175. [Google Scholar] [CrossRef]
  26. Orthaber, G.C.; Chmela, F.G. Rate of Heat Release Prediction for Direct Injection Diesel Engines Based on Purely Mixing Controlled Combustion; SAE Technical Paper 1999-01-0186; SAE International: Warrendale, PA, USA, 2018. [Google Scholar] [CrossRef]
  27. Egnell, R. A Simple Approach to Studying the Relation between Fuel Rate Heat Release Rate and NO Formation in Diesel Engines; SAE Technical Paper 1999-01-3548; SAE International: Warrendale, PA, USA, 2018. [Google Scholar] [CrossRef]
  28. Ericson, C.; Westerberg, B. Modelling Diesel Engine Combustion and NOx Formation for Model Based Control and Simulation of Engine and Exhaust Aftertreatment Systems; SAE Technical Paper 2006-01-0687; SAE International: Warrendale, PA, USA, 2018. [Google Scholar] [CrossRef]
  29. Heywood, J. Internal Combustion Engine Fundamentals; McGraw-Hill Intern: Columbus, OH, USA, 1988. [Google Scholar]
  30. Chen, S.K.; Flynn, P.F. Development of a Single Cylinder Compression Ignition Research Engine; SAE Technical SAE Technical Paper 650733; SAE International: Warrendale, PA, USA, 2018. [Google Scholar] [CrossRef]
  31. Finesso, R.; Hardy, G.; Maino, C.; Marello, O.; Spessa, E. A New Control-Oriented Semi-Empirical Approach to Predict Engine-Out NOx Emissions in a Euro VI 3.0 L Diesel Engine. Energies 2017, 10, 1978. [Google Scholar] [CrossRef] [Green Version]
Figure 1. Summary of the steady-state tests used for the preliminary assessment of the model-based controller of BMEP (Brake Mean Effective Pressure) and engine-out NOx (nitrogen oxide) emissions on the engine.
Energies 12 04704 g001
Figure 2. Accelerator pedal position vs. time for the baseline load ramp tests.
Energies 12 04704 g002
Figure 3. Scheme of the real-time combustion model.
Energies 12 04704 g003
Figure 4. Scheme of the model-based controller of BMEP and engine-out NOx emissions.
Energies 12 04704 g004
Figure 5. Scheme of the rapid prototyping setup for the BMEP/NOx controller.
Energies 12 04704 g005
Figure 6. Comparison between the target values and the measured values of NOx emissions (a) and BMEP (b) for the rapid prototyping tests at steady-state operation. The absolute errors are also reported above each bar.
Energies 12 04704 g006
Figure 7. Comparison of the time histories of the measured NOx emissions (a,c) and of SOImain (b,d) for the ramp test 3 without EGR (Exhaust Gas Recirculation) (a,b) and with EGR (c,d). The origin of the y-axis is the same for all the related figures.
Energies 12 04704 g007
Figure 8. Time histories of SOImain for the ramp test 3 without EGR (a) and with EGR (b).
Energies 12 04704 g008
Figure 9. Comparison of the time histories of the measured NOx emissions (a,c) and of SOImain (b,d) for the ramp test 4 without EGR (a,b) and with EGR (c,d). The origin of the y-axis is the same for all the related figures.
Energies 12 04704 g009
Figure 10. Time histories of the target and measured levels of BMEP for the ramp tests 1 (a,b), 2 (c,d) and 3 (e,f).
Energies 12 04704 g010
Figure 11. Time histories of the target and measured levels of BMEP for the ramp tests 4 (a,b) and 5 (c,d).
Energies 12 04704 g011
Figure 12. Time histories of the measured injected fuel quantity (a) and NOx emissions (b) for the ramp test 5 without EGR.
Energies 12 04704 g012
Figure 13. Predicted and measured engine-out NOx emissions along an interval of the Genova–Asti run, when the engine run in warm up mode and the controller operated as virtual NOx sensor. (a,c) instantaneous NOx emissions; (b,d) NOx cumulative index.
Energies 12 04704 g013
Figure 14. (a) Predicted, measured, and target engine-out NOx emissions along an interval of the Asti–Genova run, when the engine ran in normal mode and the controller was activated; (b) time history of the EGR valve position.
Energies 12 04704 g014
Table 1. Summary of the load ramp tests.
Ramp Test Engine SpeedLoad (Accelerator Pedal Position)EGRController ActivationNOx Target When Controller ON
Ramp test 1N = 800 rpm0%–60% with intermediate stepsON/OFFON/OFFNominal/+20% − 20%/−40%
Ramp test 2N = 1300 rpm0%–60% with intermediate stepsON/OFFON/OFFNominal/+20% − 20%/−40%
Ramp test 3N = 1900 rpm0%–60% with intermediate stepsON/OFFON/OFFNominal/+20% − 20%/−40%
Ramp test 4N = 1100 rpm0%–60% with different ramp durationsON/OFFON/OFFNominal/+20% − 20%/−40%
Ramp test 5N = 1500 rpm0%–60% with different ramp durationsON/OFFON/OFFNominal/+20% − 20%/−40%
Table 2. Values of RMSE (Root Means Square Error) of BMEP and NOx for the real-time combustion model at steady-state conditions [13].
Input TypeRMSE NOxRMSE BMEP
Test bench sensors80 ppm0.28 bar
Engine sensors except for intake O280 ppm0.32 bar
Engine sensors111 ppm0.32 bar
Table 3. Relative differences in the values of the cumulative NOx index, with respect to the baseline case in which the controller is activated with nominal NOx target.
Input TypeController ON, Nominal NOx TargetController ON, NOx Target +20%Controller ON, NOx Target −20%Controller ON, NOx Target −40%
Ramp test 1, EGR OFFReference+17.44−15.77−26.62
Ramp test 1, EGR ONReference+13.29%−19.48%−30.53%
Ramp test 2, EGR OFFReference+21.33%−16.26−24.25%
Ramp test 2, EGR ONReference+13.28%−21.31%−31.83%
Ramp test 3, EGR OFFReference+21.17%−18.86%−28.24%
Ramp test 3, EGR ONReference+19.85%−22.71%−35.81%
Ramp test 4, EGR OFFReference+18.99%−17.89%−26.41%
Ramp test 4, EGR ONReference+14.03−14.56%−28.35%
Ramp test 5, EGR OFFReference+20.44%−18.51%−25.44%
Ramp test 5, EGR ONReference+16.39%−22.07%−33.62%

