1. Introduction
With the rapid increase in the number of wind power installations in China, the capacity of wind power units has been gradually increasing. Therefore, the probability of wind power units being hit by lightning is increasing. According to the data from 2015 from the wind energy equipment branch of the China Association of Agricultural Machinery Manufacturers, the damage rate of wind blades caused by lightning in China’s wind fields is as high as 1%, and up to 5% in some areas with high occurrences of thunderstorms [
1]. Blade damage accidents will bring about a huge loss of power, and at the same time generate large maintenance costs [
2]. Most wind turbines are rotating when they are struck by lightning. Therefore, the lightning connection and flash discharge characteristics of wind turbines in the rotational state must be studied as a matter of urgency. Wang and Wilson et al. [
3,
4,
5] have conducted long-term natural observations of lightning contact on wind turbines and have suggested that rotary fans have stronger lightning triggering ability than static towers of the same height. Owing to the small number of effective samples and the lack of comparisons with static fans having the same structure, it has been difficult to support the above inference.
The lightning strike process of wind turbines with rotary blades is similar to that of a tall building under strong wind conditions. Many researchers have studied the effect of wind on discharge. Diaz et al. [
6] used a wind tunnel to study the influence of wind speed on the corona current of positive and negative discharge. Their results showed that with an increase in wind speed, the corona current peak value for both positive and negative cases increased. In particular, that for positive discharge increased faster. Chaves et al. [
7] studied the influence of different needle electrode materials on the corona current generated under windy conditions and found that different materials had similar influences on the corona current of a needle electrode. Based on existing studies on the influence of wind speed on discharge, most researchers have conducted simulation studies through experiments and considered the influence of airflow on corona current under short gaps. However, differences exist between the development process of experimental short gap discharges and an actual lightning strike. To study the lightning discharge process of wind turbines, we designed a 1:30 scale model with an adjustable rotation speed, typical of the typical 2 MW wind turbine the has been examined in previous research [
8,
9,
10,
11]. We conducted discharge tests with 1 m, 2 m, 4 m, and 6 m gaps under the arc electrode, using a -250/2500 μs negative switching impulse wave. In the experiment, the arc electrode was made of a steel tube with a diameter of 0.03 m to simulate the corona diameter of the downward leader head. Two kinds of receptors with typical curvature radii were selected in the experiment, including the receptor cap and the receptor disc. The receptor disc was embedded with an isolated metal point in the blade tip. A circular copper disc with a diameter of 3 mm was arranged 1 cm away from the tip of the blade. The receptor cap was the metal conductor layer, used to cover the blade tip completely. Copper foil was used to wrap within 5 cm of the blade tip. Both of these receptors were connected to the hub with a 3 mm in diameter copper wire. Our results show that under the conditions of 1 m and 2 m gaps, the breakdown voltage between the electrode and blade tip increases with the increase of blade speed. Under the conditions of 4 m and 6m gaps, the breakdown voltage between electrode and blade tip decreases with the increase of blade speed. In the common theories, the rotation of the wind turbine will change the space charge distribution, which will facilitate the initiation of an upward leader [
4], so the breakdown voltage will decrease with the increase of blade speed. However, it presently cannot be explained why the effect of rotation speed on the breakdown voltage under different gap conditions is opposite. As such, it is necessary to carry out simulation research to study the discharge development process under the condition of blade rotation.
As for the simulation of the lightning discharge process, numerous researchers have simulated the lightning protection of tall buildings based on the corona model. Aleksandrov et al. [
12,
13,
14] established a one-dimensional corona model of a hemispherical lightning rod to simulate the diffusion and migration processes of a corona starting from the surface of the lightning rod. The distribution of ions after migration and diffusion was approximately hemispherical. However, simulation with a one-dimensional model involves many approximations, and, therefore, Becerra [
15] extended the model from one to two dimensions on the basis of Aleksandrov’s research, more accurately analyzing the developmental process of the lightning rod surface corona after its initiation. The simulation results obtained using the two-dimensional model showed that ion migration presents different trends in the horizontal and vertical directions. Compared with the one-dimensional model, the two-dimensional model can reflect the ion migration process more accurately. However, as lightning rods were being investigated, these studies only considered the thundercloud electric field’s influence on migration features. Their results did not consider the influence of wind, and they cannot be compared with the corona of the rotary blade receptor under the background of an actual thundercloud. Yanhui Zou [
16] established a time domain numerical calculation model of a corona space charge distribution model in DC transmission lines considering wind speed, and the results showed that with the increase of wind speed, the peak value of corona current of ground wires above the negative pole linearly increased. However, there are lots of differences between the process of corona discharge in wires and wind turbine blades, and this result cannot reflect the corona initiation process of an actual wind turbine.
Overall, previous observation studies on wind turbine lightning strikes and the influence of wind speed on discharge have concluded that wind turbine rotation leads to lightning strike characteristics that differ from those of common ground buildings. This requires further discussion. In this study, the COMSOL Multiphysics software was used to establish a corona discharge model of the receptor on the tip of a blade under negative thundercloud conditions. The distribution of spatial ions under different wind speeds were studied from the perspective of ion diffusion and migration. The simulation results can be compared with the influence of actual blade rotation on the ion distribution and corona current in the blade tip region under negative thunderclouds, and they can provide a basis for discussing the lightning strike development process under blade rotation.
2. Numerical Simulation Model Based on Fluid Dynamics
2.1. Governing Equation of Fluid Dynamics Numerical Simulation Model
Under negative thundercloud conditions, when the receptor surface reaches the initial corona field intensity, corona discharge will occur. Corona discharge will ionize to produce electrons and positive ions, electrons will quickly enter the receptor, and positive ions will migrate toward the thundercloud. In the simulation, the process of electron collapse in space was not considered. To bring the simulation results closer to the development process after actual corona initiation, the process of positive ions constantly adhering to and colliding with other ions and then reacting to form other charged particles during the generation and outward diffusion of positive ions was fully considered in this model. Accordingly, this model considers three types of particles in the background space of thundercloud, namely, positive ions,
n+, aerosol ions,
N+, and neutral particles,
Na. Physical processes such as adhesion and collision between the three types of particles can be expressed by multicomponent transport equations which are coupled with each other, which are shown as follows [
15].
Here,
μn+ [1.5 × 10
−4 m
2/(V·s)] is the electrical mobility of positive ions,
μN+ [1.5×10
−4 m
2/(V·s)] is the electrical mobility of aerosol ions,
W is the wind speed, set as going horizontally to the right on the vertical plane and set to different values depending on the requirements,
knN (2.9 × 10
−12 m
3/s) is the adhesion coefficient, and
D (1 m
2/s) is the diffusion coefficient. Furthermore,
e and
ε0 denote the elementary charge and vacuum dielectric constant, respectively [
17].
In addition, the electric field distribution in the ionization region can be expressed by the electric field Poisson equation:
By normalizing the above equation and solving it using discrete numerical differences, the ion migration characteristics under thunderclouds and different wind speeds can be solved.
This model must consider corona characteristics under negative thunderclouds as well as the migration of charged particles influenced by the electric field and wind. Therefore, the electrostatic module and convection/diffusion module in COMSOL Multiphysics were used to simulate the influence of wind speed on ion migration through mutual coupling between the two modules. The transient solver PARDISO in COMSOL Multiphysics was used to solve the problem, and the time stepping method was implicit. If the explicit scheme is adopted, the time step shall meet the Courant stability condition, that is, the selection of the time step must ensure that the transfer speed of the node charge density information is less than the charge transfer speed, otherwise the solution of the particle transport equation will diverge with time, and the number of calculation time steps will be very large, which makes the calculation time difficult to accept. Therefore, this paper adopts implicit discrete equations to overcome this problem and improve the computational efficiency [
16]. Here, the time step used is (0,0.2,25) and the relative tolerance is 0.001.
2.2. Basic Parameters and Geometric Model Settings
In a thundercloud, the background electric field,
E0, keeps increasing within a certain duration
τ. After it reaches the maximum value,
E0max, the thundercloud electric field remains unchanged until it decreases sharply after a lightning strike. The simulation in this paper focus on the initial stage of the corona on the wind turbine blade before a lightning strike. Researchers have noted that an electric field can be expressed by a piecewise function that increases linearly within time
τ, where
E0max remains unchanged until a lightning strike occurs [
18,
19]. The background electric field
E0 is expressed as follows:
Extensive measurements have shown that about 90% of cloud-to-ground lighting strikes are of the negative lightning type, so the study of lightning is mainly focused on negative polarity. Consequently, the thundercloud electric field was set to a negative polarity.
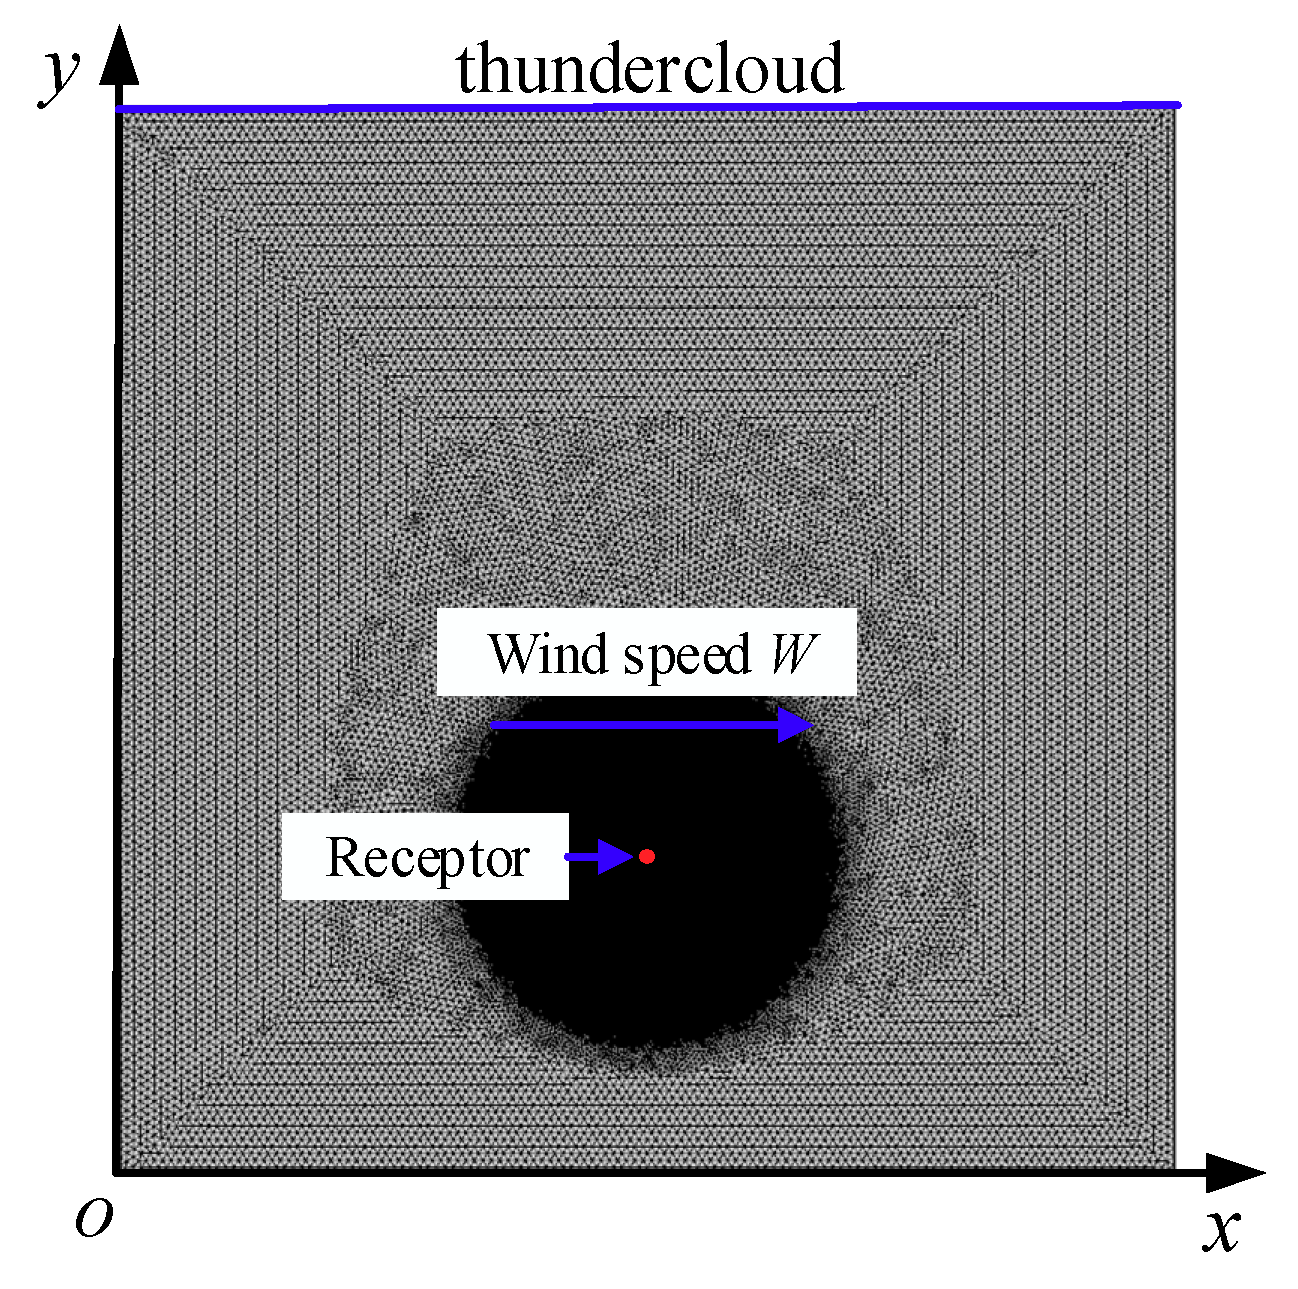
In the simulation considering the influence of wind speed on ion migration, the receptor is equivalent to a cylindrical model with ground clearance height
h and bottom surface radius
r0. To simplify the simulation calculation, a section parallel to the base of the cylinder was made and the three-dimensional model of the flash connector was simplified into a two-dimensional model in the
x-y plane. The receptor can be equivalent to a circle on the
x-y plane.
Figure 1 shows the geometric model and mesh subdivision.
To reduce the number of subdivision cells and the calculation time, the height
h was set to 15 m, the receptor radius
r0 was set to 0.5 cm, the maximum electric field of thundercloud
E0max was set to 40 kV/m, and the lift time
τ was set to 20 s [
20].
As the computational model mainly focuses on the electrical parameters of the space near the receptor, considering the large gap between the receptor and the geometric size of the whole computational space, the grid density of the receptor and the space nearby should be increased during the generation. Making concentric circles with the center of the receptor as the center of the circle with radii of 50 cm and 500 cm respectively, the outermost boundary is a square with a length of 5000 cm and the grid size increases successively from the receptor outward. Mesh generation of the model adopts free mesh generation for a triangular mesh and the minimum unit size is shown in
Table 1.
Under the action of the thundercloud electric field, the receptor surface induces an electric field that will gradually increase with the background electric field. When it reaches the initial corona field
Ei, the receptor surface starts to generate positive ions that spread outward from the surface. The corona initial field strength can be calculated using Peek’s formula [
21]:
2.3. Setting of Boundary Conditions and Simulation Parameters
In the simulation calculations, the boundary conditions in each module must be set. The modules selected for this simulation were the electrostatic and convection/diffusion modules. The boundary conditions were set as follows.
In the electrostatic module, the background potential value V = −E0H was applied at the upper boundary. It should be ensured that the entire simulation area is in the background electric field of thundercloud E0. The left and right boundaries were set to zero charge, and the receptor and lower boundary were set to ground.
In the convection/diffusion module, the outer boundary was set to zero flux and the concentration boundary of positive ion
n+ was set on the receptor surface to ensure that the generated positive ions could always maintain the motion field intensity
E on the receptor surface after the corona started [
12,
13,
14,
22]. In the simulation calculations, the initial concentrations of the pace positive ion
n+ and aerosol ion
N+ were set to 0, and that of the neutral particle
Na was set to 10
11/m
3 [
12].
3. Simulation Results
The spatiotemporal distribution of positive particles, aerosol particles, and neutral particles under different wind speeds were simulated according to the 2D corona simulation model of the receptor under negative thunderclouds.
3.1. Influence of Wind Speed on the Spatiotemporal Distribution of Positive Ions
3.1.1. Positive Ion Distribution When Wind Speed is 0
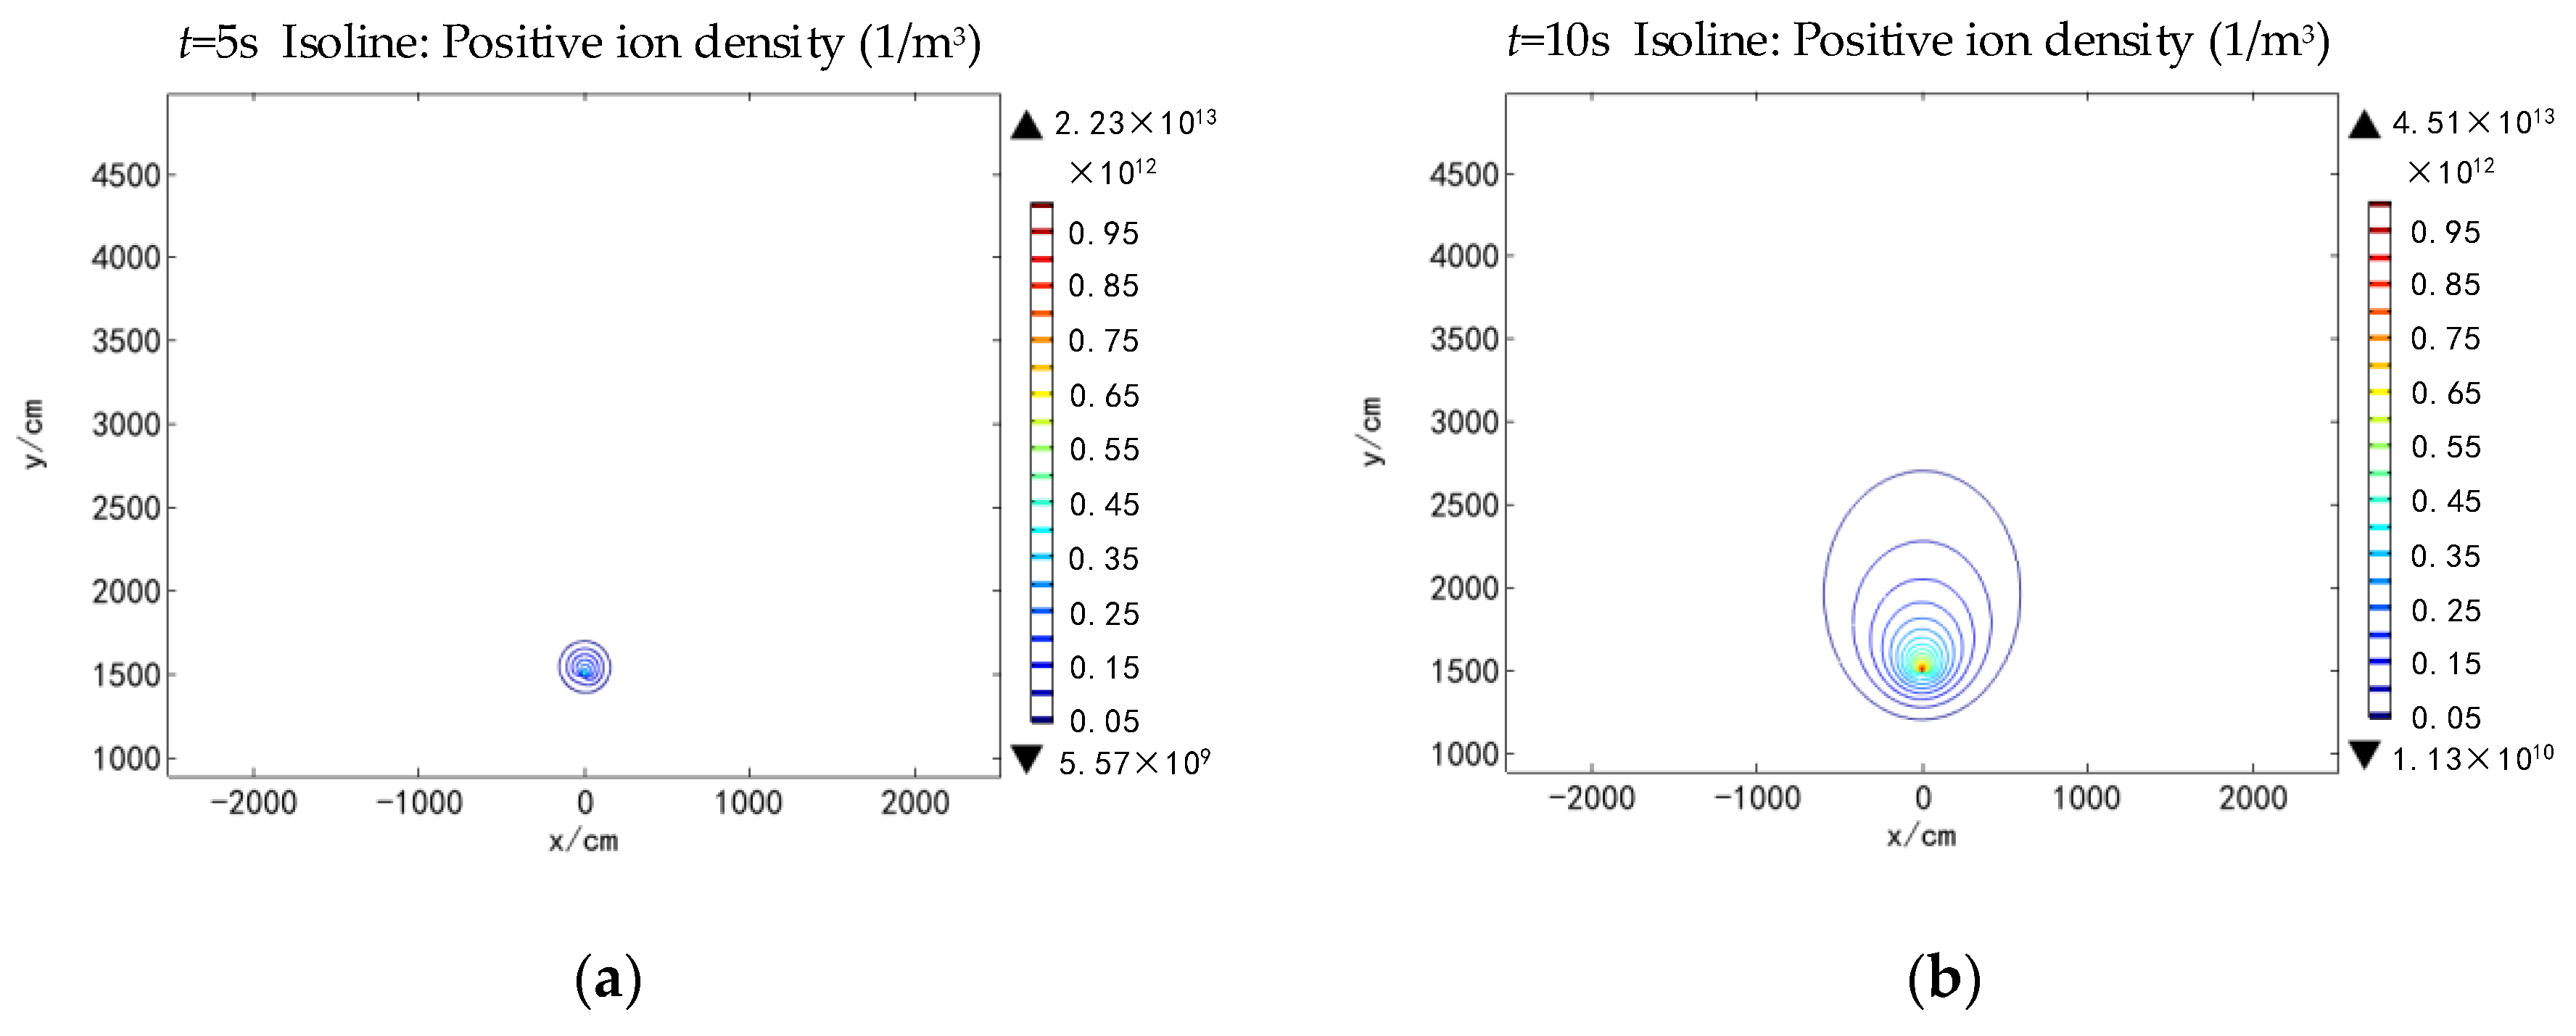
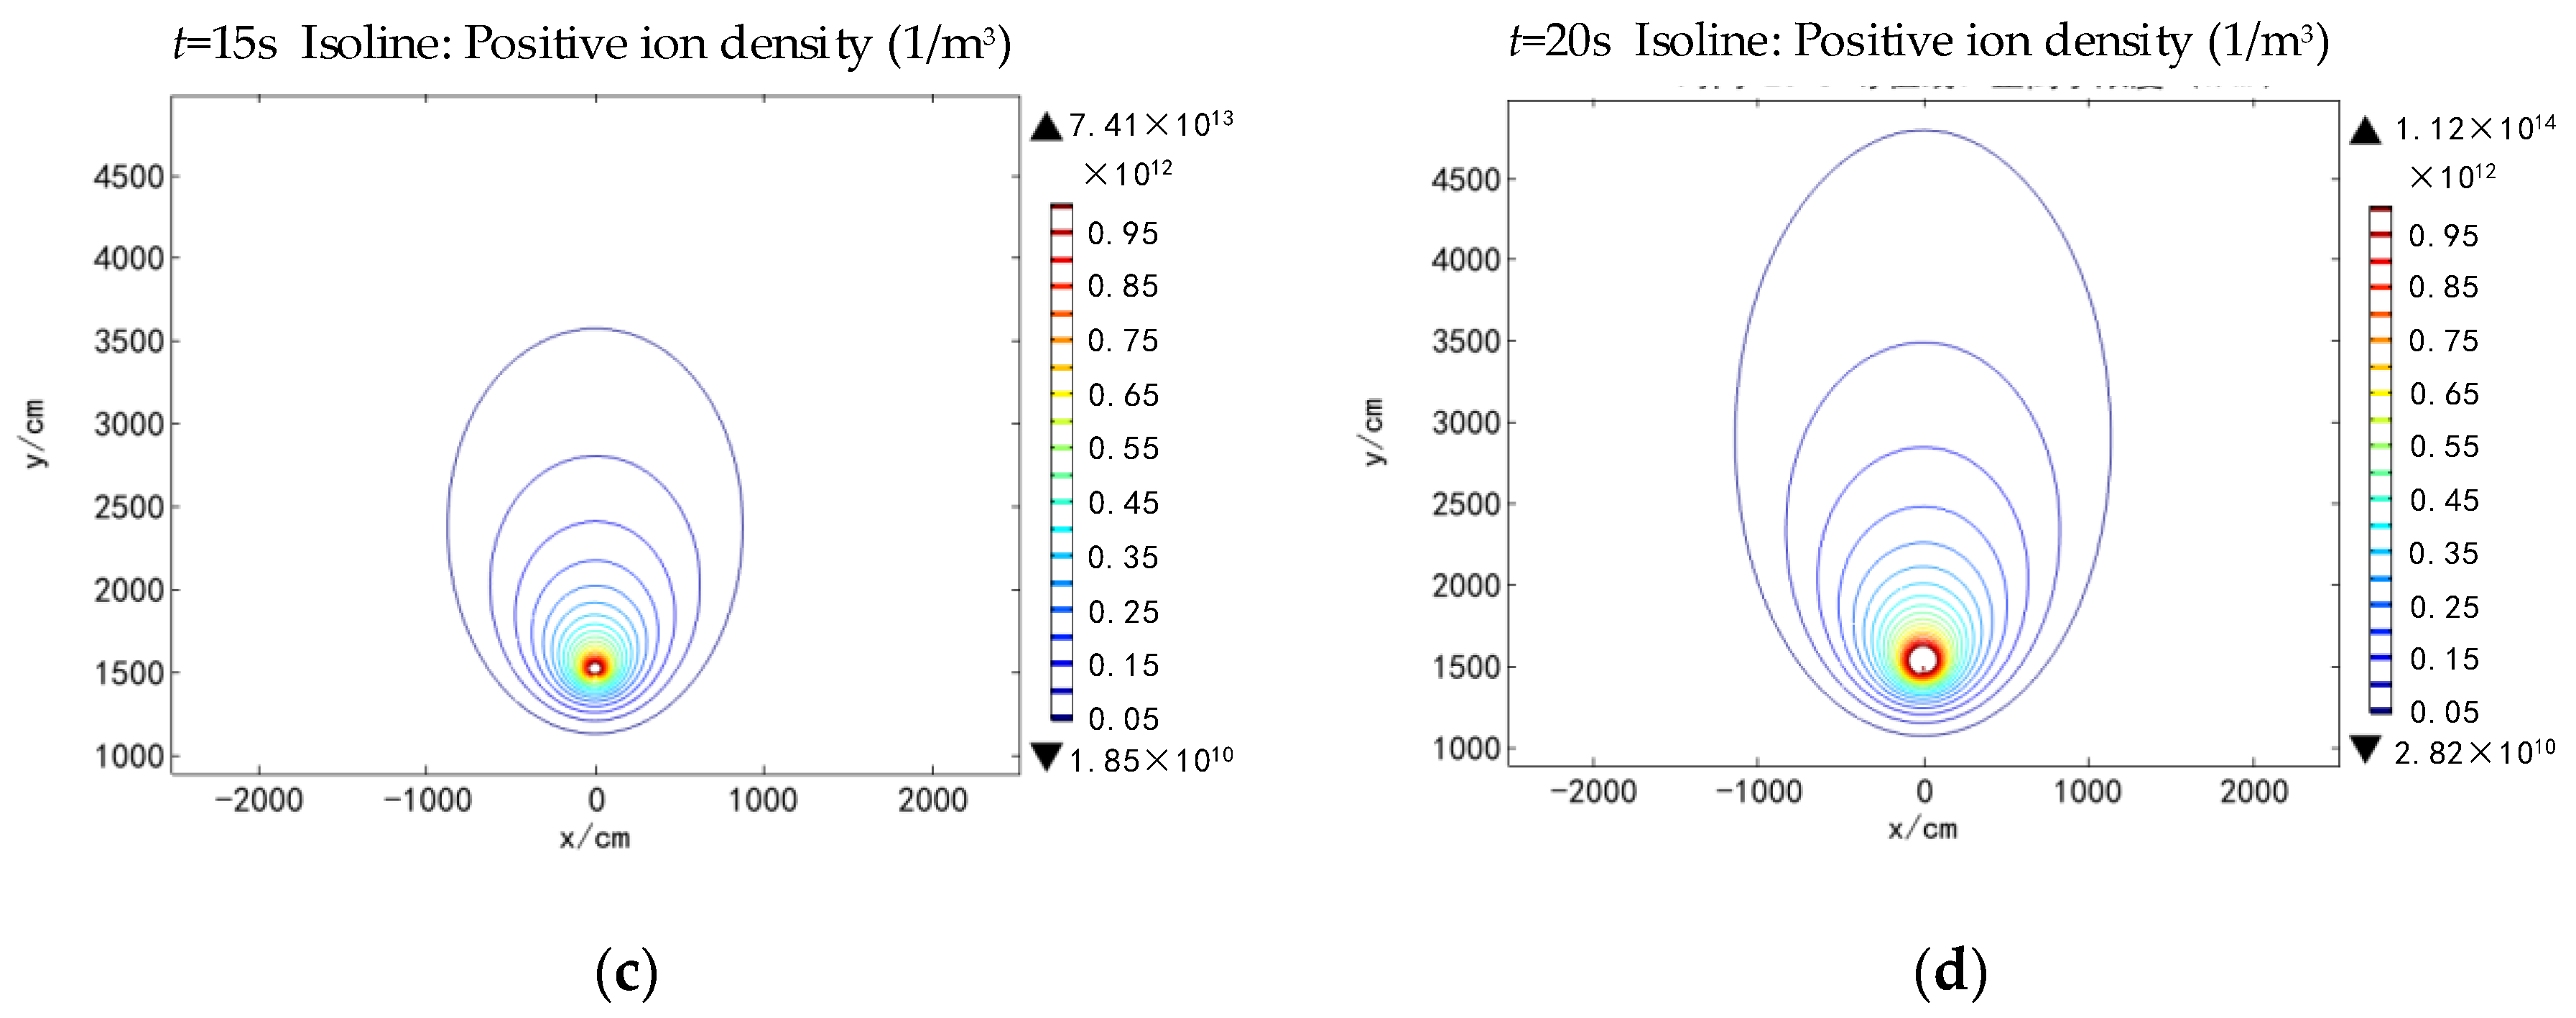
To study the law of positive ion migration under the thundercloud electric field, a contour map of the positive ions’ spatial density distribution at different times when the wind speed is zero was drawn, as shown in
Figure 2.
This map shows that when the surface corona starts on the receptor, positive ions near the receptor are evenly distributed and those in the upper and lower parts of the flash connector are approximately symmetrical. This is due to the presence of a large amount of space charge in the area near the receptor; this charge counteracts some of the effect of the thundercloud electric field. As time passes, the corona continues to develop, where ions migrate further outward and the space charge interaction gradually weakens. Then, the thundercloud electric field becomes the main factor affecting ion migration. Most positive ions migrate vertically to the ground, and their density isolines gradually show an elliptical distribution.
3.1.2. Influence of Different Wind Speeds on Positive Ion Migration
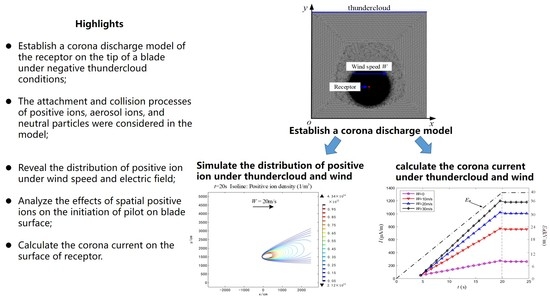
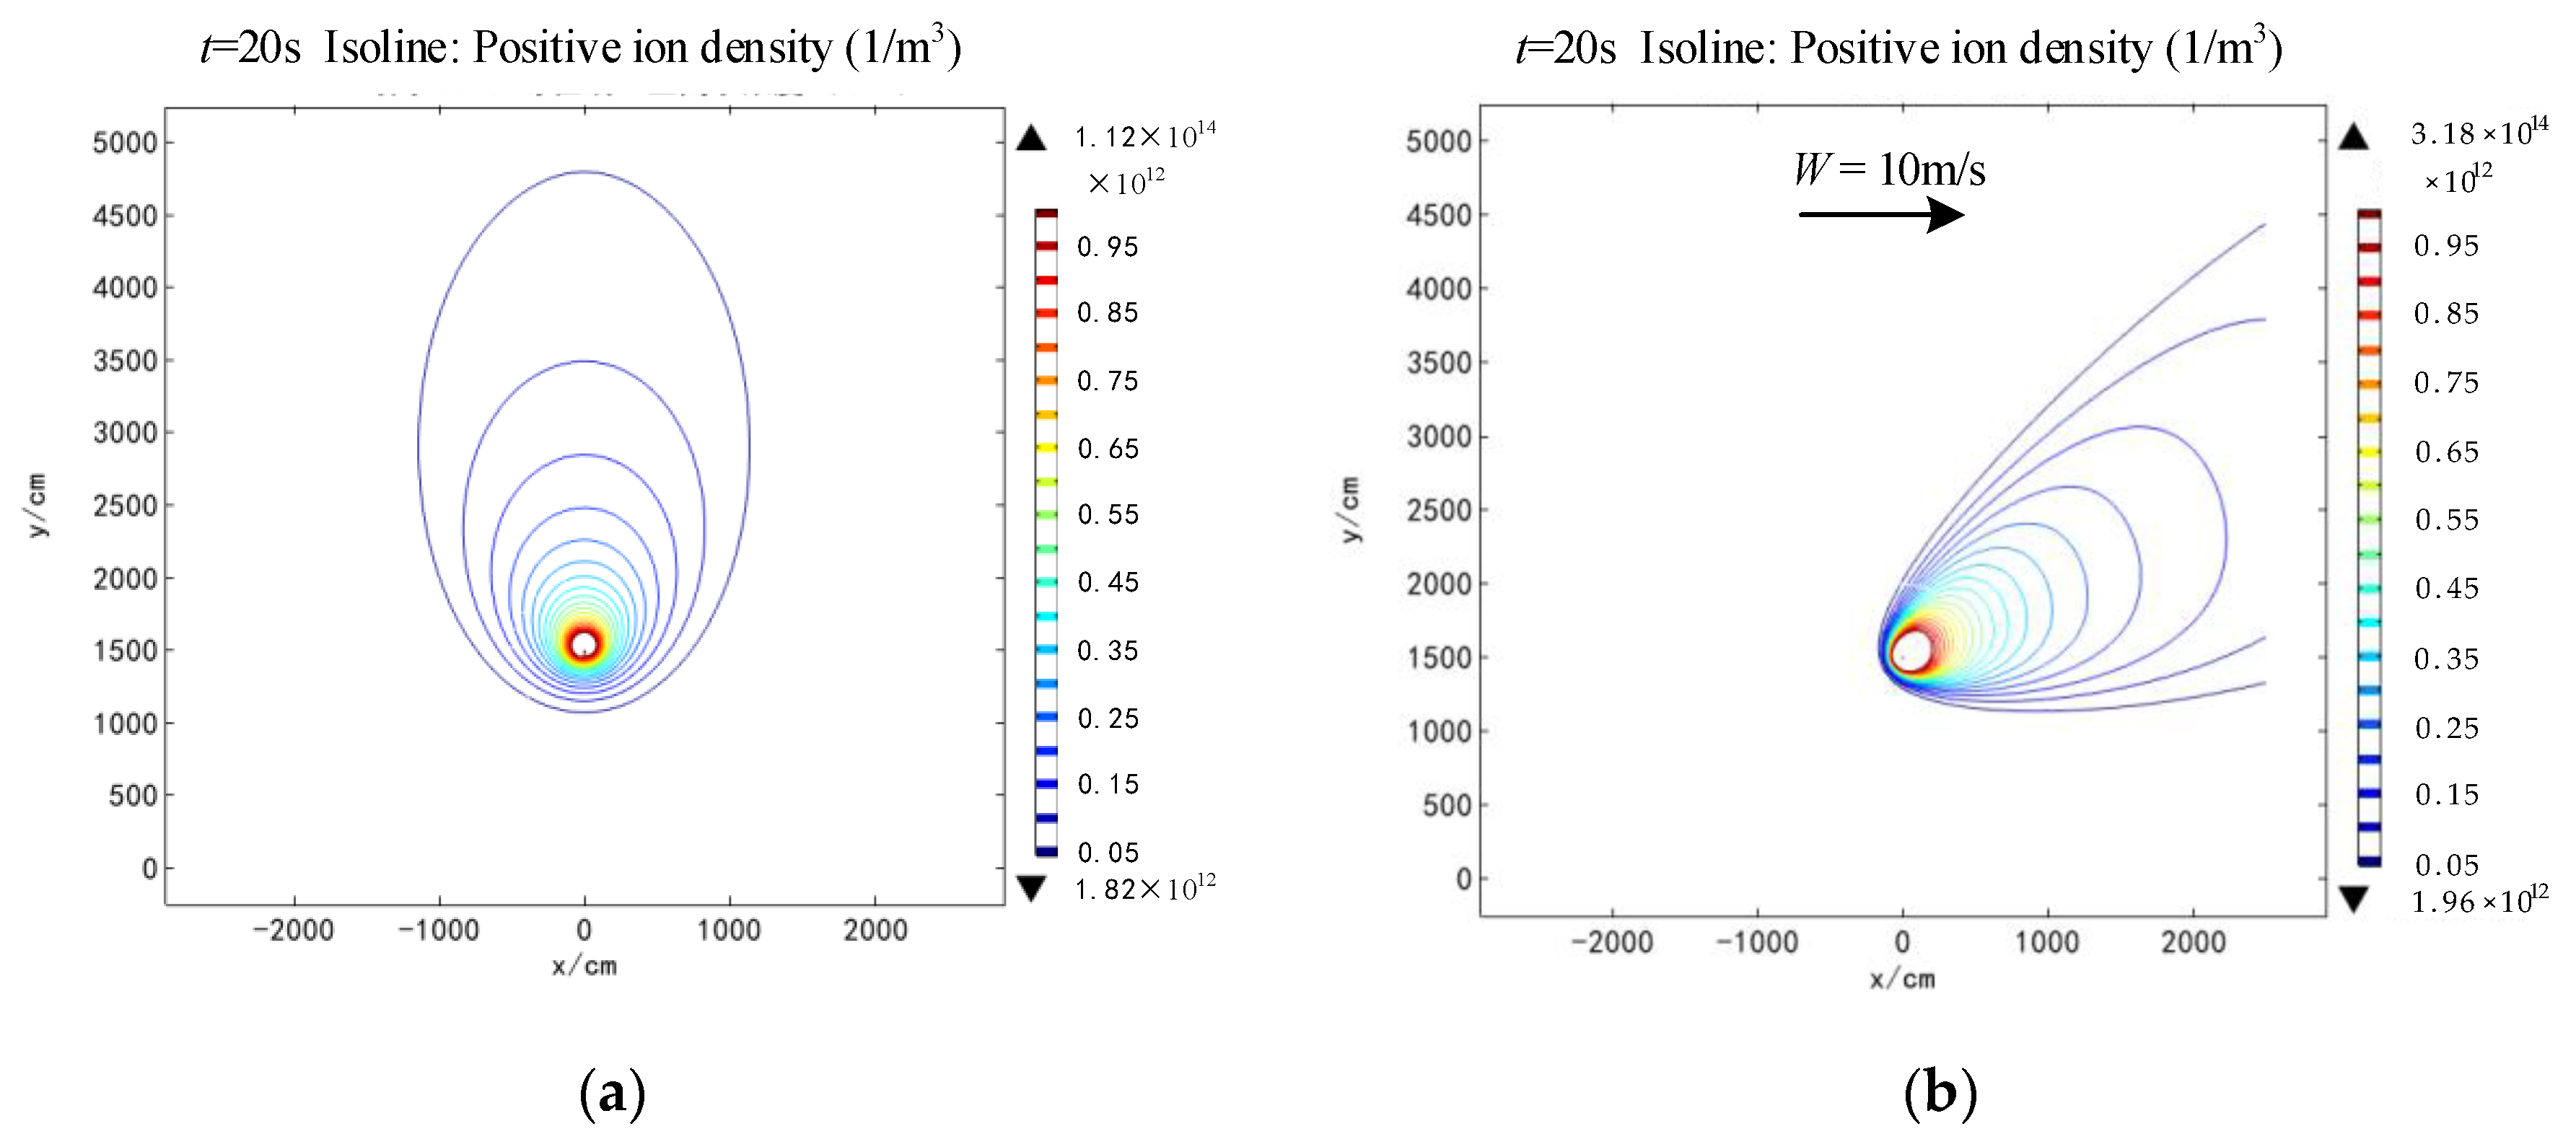
To study the influence of wind speed on the diffusion and migration of positive ions, at
t = 20 s, the contour map of the positive ions’ spatial density distribution at
W = 0, 10, 20, and 30 m/s was drawn, as shown in
Figure 3.
This map shows that differences exist in the migration and diffusion characteristics of positive ions under different wind speeds. The ion migration process is affected by both the electric field force and wind. In the area close to the receptor, ion migration is mainly affected by the induced electric field of the surface charge and corona charge of the receptor, and the ion distribution remains relatively uniform. As the ions spread outward from the receptor, the background electric field causes most ions to migrate toward the thundercloud, whereas horizontal wind causes particles to drift to the right during migration. Therefore, when there is wind in the space background, the ions present an elliptical distribution state with rightward deviation in the plane of the receptor, and the larger the wind speed, the larger the deviation amplitude.
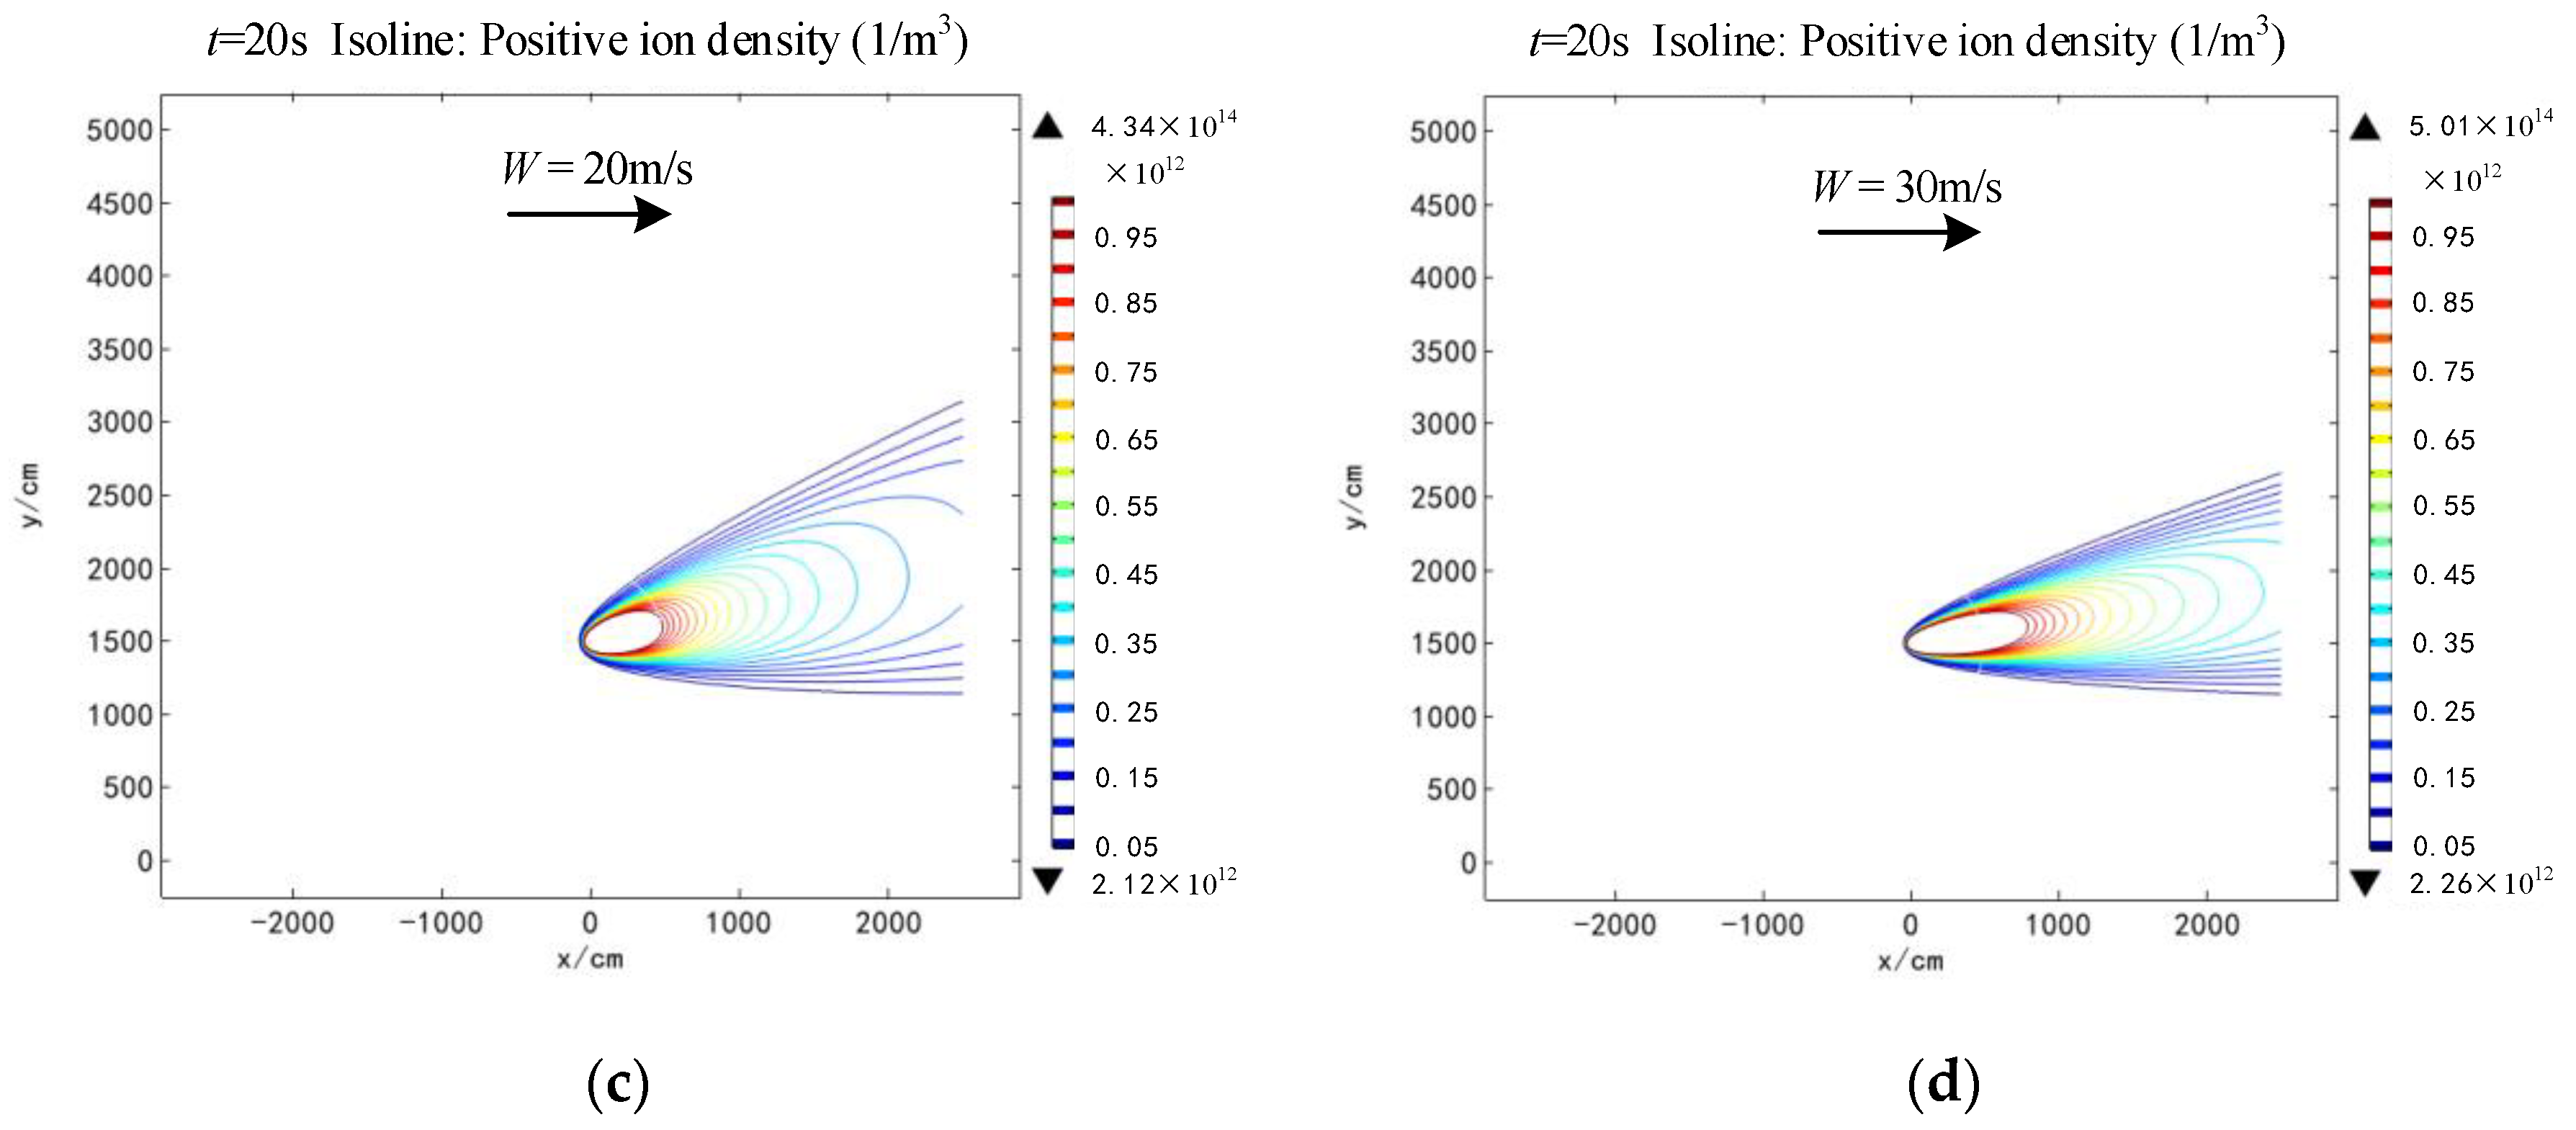
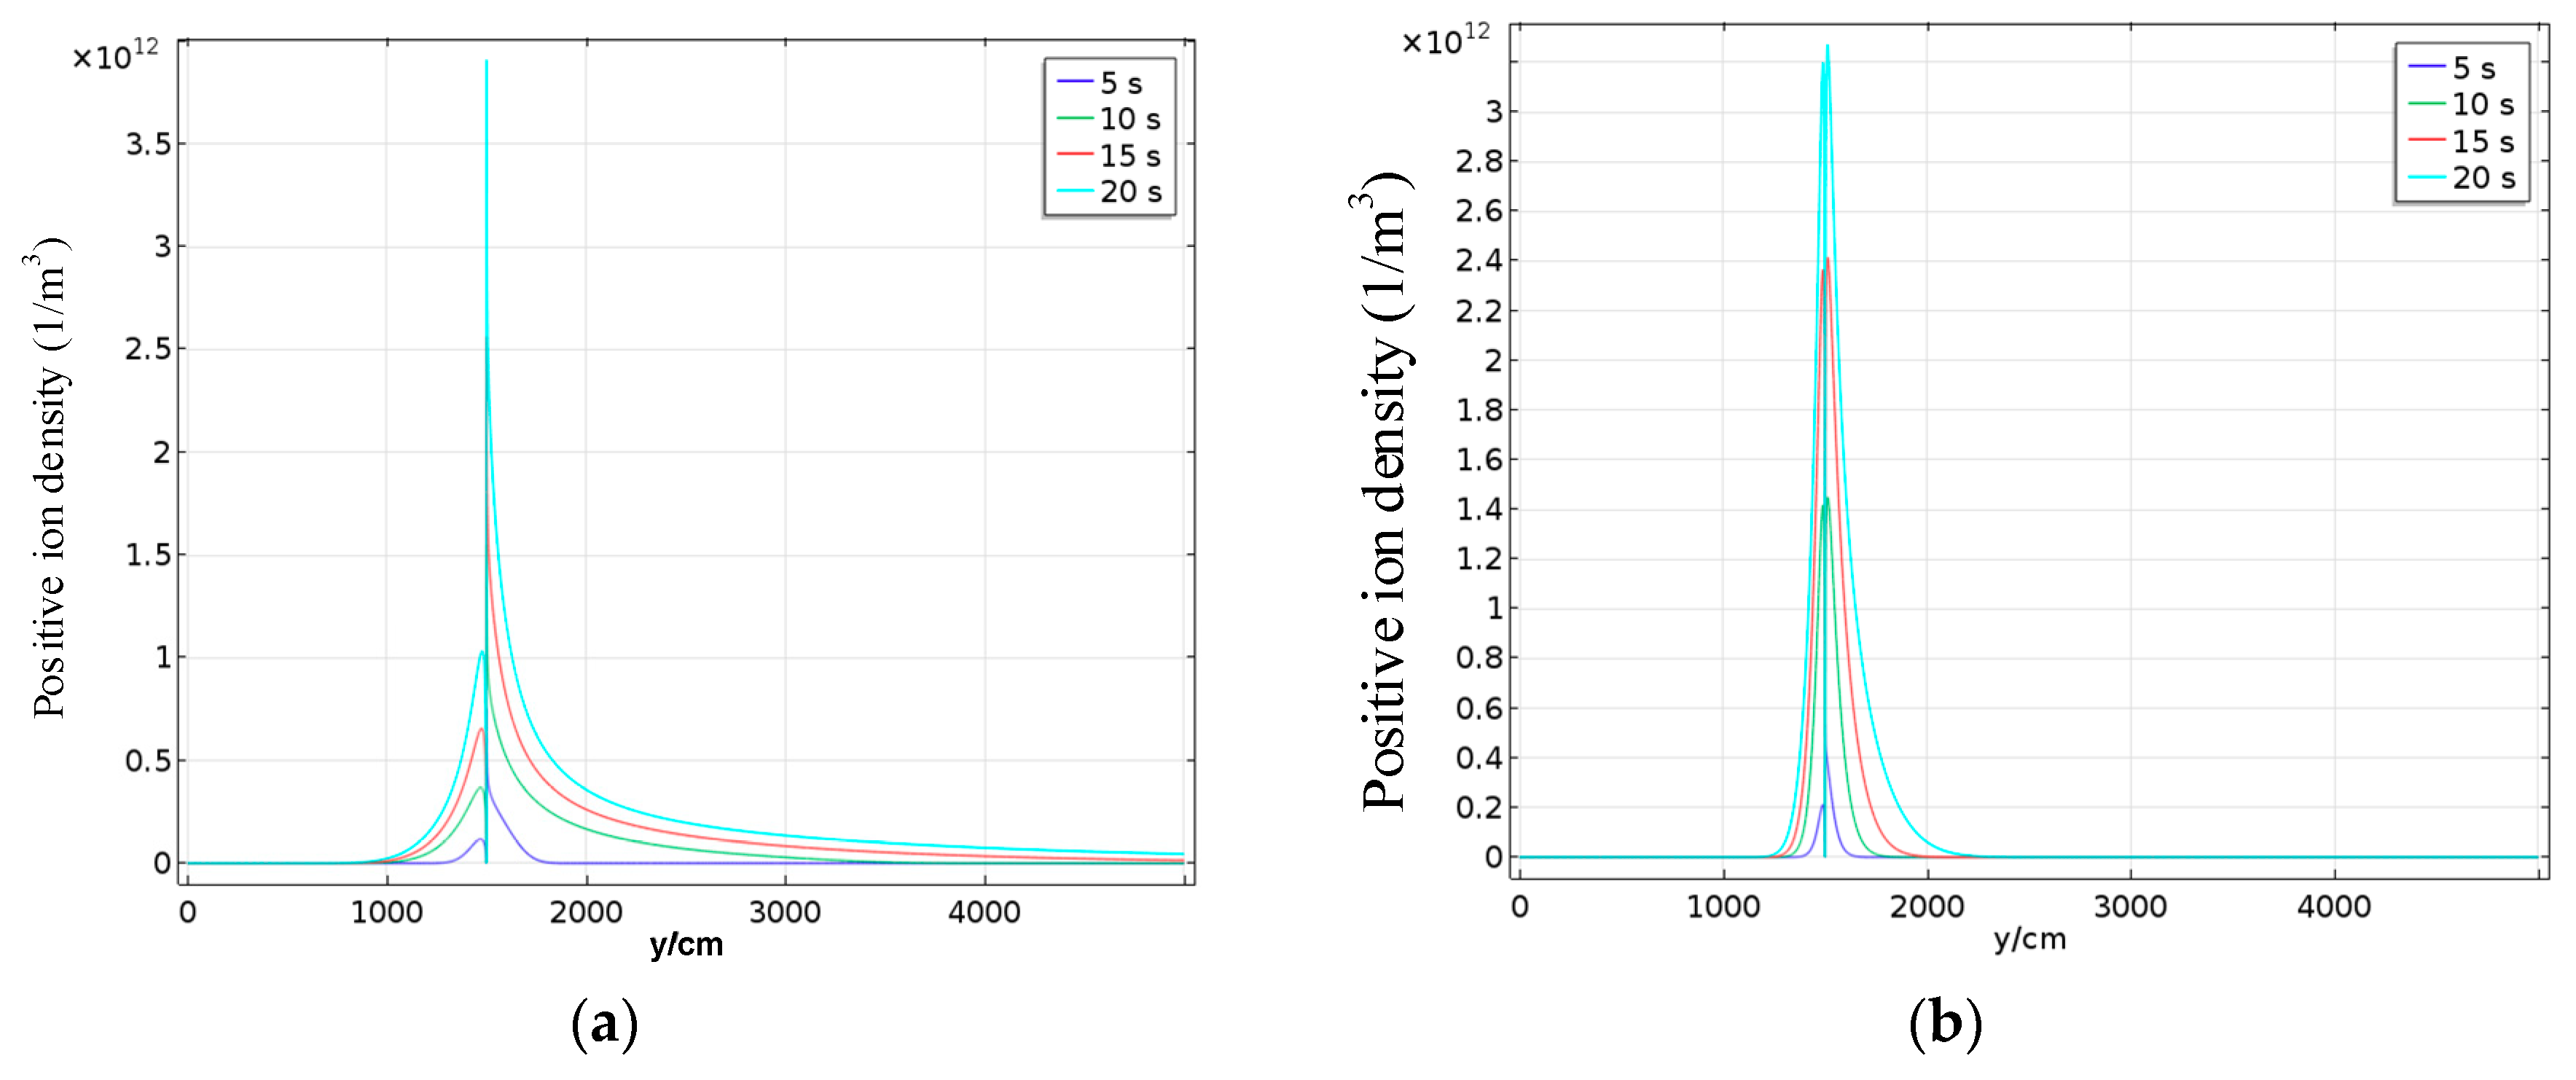
We took the transversal
X of the
x-axis when
x = 0 and drew a distribution diagram of positive ions at different times under different wind speed conditions along the transversal
X, as shown in
Figure 4.
Under different wind speed conditions, positive ions were mainly concentrated in the area near the receptor, and their concentration decreased when moving further away from the receptor. Under different wind speeds, the decay speed of positive ion density along the y-axis was different. The higher the wind speed, the faster the decay speed of positive ion density along the y-axis. For t = 20 s, when the wind speed was 0, the concentration of positive ions migrating upward and downward along the y-axis tended to 0 near y = 10 m and y = 45 m, respectively. For a wind speed of 30 m/s, positive ions distributed along the y-axis mostly existed in the area between y = 14 m and y = 16 m. This proved that wind had an important influence on the spatial positive ion migration.
To further analyze the influence of wind on ion migration, the transversal
X was divided into the upper (
Xup) and lower transversals (
Xdown) with a cut-off point at
y = 15 m, and the line integral of the charge density on the two sections of the line was obtained along
Xup and
Xdown.
Table 2 shows the calculation results for charges
Qup and
Qdown and the total charge (
Qall) on transversal
X.
Table 2 shows that when wind speed is constant,
Qdown is smaller than
Qup, and the proportion of
Qup in
Qall increases. Under the thundercloud electric field, most positive ions move toward the thundercloud above the receptor.
In addition, according to the charge distribution law under different wind speeds, as listed in
Table 2, both
Qup and
Qdown simultaneously decreased with an increase in wind speed. For
W = 30 m/s,
Qall is around half that in the case of no wind. This is because as wind speed increases, rightward positive ion migration gradually increases and the charge on transversal
X gradually decreases. The aforementioned charge distribution law indicates that the presence of wind affects positive ion migration in space.
3.2. Influence of Wind Speed on Corona Current Variation Rule
To study the influence of wind speed on the variation trend of the corona current on the receptor surface, the corona current curve over time at
W = 0, 10, 20, and 30 m/s was drawn according to Equation (7), shown in
Figure 5. The corona current on the receptor surface can be expressed as follows:
where
n(
r0,
t) is the positive ion density on the receptor surface as obtained through the simulation.
The corona current on the receptor surface exhibits the same trend under different wind speeds. As described in
Section 2.2, the thundercloud background electric field keeps increasing within a certain duration, namely,
τ(
τ = 20s). The corona current started from the time when the corona appeared on the receptor surface (
t = 4.6 s). For
t < 20 s, the corona current increased with time as the thundercloud electric field gradually increased. The corona current peaked at
t = 20 s. For
t > 20 s, the thundercloud electric field stopped increasing and the corona current amplitude decreased slightly and then stabilized. The simulation results of the corona current obtained in this section for
W = 0 were compared with the corona current of a 60 m tall rod with a 0.02 m cap radius, computed by means of Becerra’s corona model [
11], in which the corona current of a 1 m-tall pencil-shaped rod computed with the 2D model was compared with the measured result in [
23] to verify the accuracy of the model. The corona current variation trend of the two models were found to be consistent, and the order of magnitude were both in the 0.1 mA range, thus verifying the correctness of the proposed model.
3.3. Influence of Blade Rotation on Positive Upward Leader Initiation
As stated, a charged particle distribution model of the receptor on the blade tip, considering the wind speed and background of a negative thundercloud, has been established. The simulation results have revealed that positive ions diffuse outward in the direction of the electric field after the corona starts. In the initial stage, the positive ions were evenly distributed in the upper and lower regions of the receptor. However, as positive ions gradually moved away from the receptor, they migrated and spread toward the direction of the thundercloud. Because the migration speed of electrons is approximately two orders of magnitude higher than that of positive ions, newly ionized electrons will quickly enter the receptor, resulting in the formation of a positive ion space area above the receptor. The decrease in field intensity in the positive ion space region inhibits electron collapse near the receptor and impedes streamer development. Simultaneously, the existence of positive ions promotes an increase in the collision surface of the gas and increases the probability of electron recombination. These two factors jointly inhibit electron collapse and further streamer development, inhibiting the generation of the upward leader.
Simultaneously, the wind speed has an effect on the migration and diffusion of space ions. Under windy conditions, the charged particles deviate in the direction of wind. The higher the wind speed, the larger the deviation. Positive ions present an elliptical distribution with a rightward deviation, and this weakens the positive ion density in the area directly above the receptor. Simultaneously, the corona current increases with an increase in wind speed, indicating that the corona current flowing through the receptor surface has increased. Electron avalanche in the streamer area developed more violently in this case. This was more conducive to streamer development. Therefore, when the blade rotates, it is equivalent to the presence of wind around the receptor, and this changes the positive ion distribution nearby and facilitates the formation of the upward leader.
The variation of breakdown voltage with blade rotation in our previous experiment [
8,
9,
10,
11] can be explained as follows, where the experimental gap of 1–6 m is quite different from the actual height of the thundercloud. With such a gap length, the positive ion space area above the receptor not only weakens the upward leader on the surface of receptor, but also increases the field intensity between the area and the high-voltage electrode, which is conducive to the formation of secondary electron avalanche in the external area and promotes the upward leader to extend to the high-voltage electrode. When the gap is 1–2 m, the positive ion space area is close to the high-voltage electrode, and its promotion plays a major role in the upward leader development. Therefore, with the increase of wind speed, the positive ion offset increases and the breakdown voltage increases. When the gap length increases to 4–6 m, the positive ion space area has a weaker promoting effect on the upward leader development, and its weakened effect is dominant, so the breakdown voltage decreases with the increase of wind speed.
4. Conclusions
This paper focuses on the corona discharge process and explains the abnormal phenomena in the experiment. By using the COMSOL Multiphysics finite element software, this study established a distribution model of charged ions at the receptor on the blade tip, considering the wind speed and electric field strength of thunderclouds. The attachment and collision processes of positive ions, aerosol ions, and neutral particles were considered in the model. The model can reflect the migration and spatial distribution of these three types of particles on the receptor surface under thunderclouds. The main conclusions are as follows:
(1) Wind speed has an effect on the migration and diffusion of space ions. Under windy conditions, ion migration is affected by both the electric field force and wind. In the area near the receptor, ion migration is mainly affected by the thundercloud and the electric field induced by the electric charge, and the ion distribution is relatively uniform. As the charged particles gradually spread away from the receptor, the field intensity decreases, and the influence of wind speed on the particle distribution gradually increases. Charged particles are offset in the direction of the wind. The higher the wind speed, the larger the deviation amplitude.
(2) Under the action of an electric field, when the surface field intensity of the receptor reaches the initial corona field intensity, positive ions are generated on the receptor. As a result, positive ions gradually accumulate in the area near the receptor and a positive space charge region is formed, thereby inhibiting the movement of electrons and reducing the probability of an electron avalanche developing in the streamer. Under the action of wind, the positive charge space region is offset, and the concentration is reduced. This is conducive to electron collapse and the streamer-leader conversion process.
(3) Blade rotation weakens the accumulation of positive ions in the blade tip area. This is conducive to the generation and development of the upward leader and makes the wind turbine more vulnerable to lightning strikes. This study represents basic research on wind turbine lightning protection and provides some related reference calculation values.
Future research should focus on extending the simulation process to the whole process of long gap discharge, and then to the discharge process of natural lightning, so as to guide the transformation of lightning protection through the law of lightning simulation calculation.


