A Survey on Power Grid Faults and Their Origins: A Contribution to Improving Power Grid Resilience


1
Department of Electrical and Computer Engineering, NOVA School of Science and Technology, 2829-516 Caparica, Portugal
2
Center of Technology and Systems (CTS), Instituto Desenvolvimento de Novas Tecnologias (UNINOVA), 2829-517 Caparica, Portugal
*
Author to whom correspondence should be addressed.
Energies 2019, 12(24), 4667; https://doi.org/10.3390/en12244667
Submission received: 14 November 2019
/
Revised: 5 December 2019
/
Accepted: 6 December 2019
/
Published: 9 December 2019
Abstract
:One of the most critical infrastructures in the world is electrical power grids (EPGs). New threats affecting EPGs, and their different consequences, are analyzed in this survey along with different approaches that can be taken to prevent or minimize those consequences, thus improving EPG resilience. The necessity for electrical power systems to become resilient to such events is becoming compelling; indeed, it is important to understand the origins and consequences of faults. This survey provides an analysis of different types of faults and their respective causes, showing which ones are more reported in the literature. As a result of the analysis performed, it was possible to identify four clusters concerning mitigation approaches, as well as to correlate them with the four different states of the electrical power system resilience curve.
1. Introduction
An electrical power grid (EPG) is a dynamical system based on four main operations: generation, transport, distribution and control [1]. Technological development over the last decade, in particular with the increased use of information and communication technologies (ICTs), has exposed EPGs to an all-new set of threats [2]. Like any system, an EPG is not fully fault-proof. A fault can occur at any point of the grid, whether due to natural causes, operational errors, cyber attacks or physical attacks, among others causes [3,4].
Whenever there is a fault at any part of the EPG, different levels of consequences will be generated for the grid as a whole. Faults affecting only a small part of the EPG, and with easy and fast resolution, do not imply a redirection of the energy flow through other transmission lines. However, catastrophic events may imply the isolation or overloading of other sections of the EPG, due to load redistribution, which can lead to a cascade failure [5,6,7]. As an example, extreme weather conditions can affect the EPG at different levels: at system level, where loading on feeders and lines can be affected, or at component level, affecting their rate of failure [8]. The EPG is undoubtably one of the most critical infrastructures in any country. Therefore, it is crucial to prevent catastrophic events that can break it down as well as to improve its capability to recover after any abnormal event [9,10,11]. This last feature is known as system resilience.
From the resilience engineering point of view, as Hollnagel pointed out, it is important to predict when a system fails, and which are the causes that lead it to fail [12]. The trigger that causes a change in the system, identified as a stressor, is considered one of the resilience indicators [13]. In this work, stressors will be analyzed and identified, thus contributing to understanding faults and improving the system resilience: (i) Considering the EPG as the infrastructure under analysis, the main contribution of this paper is a detailed survey on causes and faults within the EPG, in order to address the knowledge gap regarding the mitigation of outages; (ii) The establishment of a fault table and a cause–effect graphic, providing an easier understanding of the different categories of causes and faults, and highlighting, in a seamless way, the ones most reported in the literature, along with a review of common approaches used to prevent or reduce outages, thus improving EPG resilience, are the other two contributions of this survey.
The remainder of this survey is organized as follows. The research method used to accomplish this survey is first presented. The definition of resilience and its application on electrical power systems are introduced in Section 2. Causes originating electric power grid faults, the main faults and their correspondent resolutions are analyzed in Section 3. Finally, conclusions and remarks are presented with the discussion of new research directions.
Research Method
In order to understand the main causes affecting the EPG that result in electrical faults that could lead to more severe events, a systematic mapping study approach was followed [14]. Following this approach, information concerning the topics that have been studied by other researchers were collected, aiming to identify research opportunities foreseeing the improvement of resilience within EPGs. This methodology aims to collect related information and to identify literature gaps, particularly on how to apply resilience to the EPG.
In the scope of this work, the following research questions (RQs) are addressed:
- RQ1.
- What are the main causes of EPG faults?
- RQ2.
- What are the most reported faults in the literature?
- RQ3.
- What strategies are used to improve the resilience of EPGs?
The research was conducted using Science Direct, IEEE Xplore repositorium and Google Scholar, having the above RQs in mind. A first survey showed several studies containing large amounts of information, but they mainly focused on natural causes-based fault events. On the other hand, causes such as attacks or human errors, and their faults, are seldom reported, and EPG resilience is not explored.
Over the past decade, due to the increased use of ICT tools, the term “resilience” has acquired different meanings when applied to EPGs. Thus, it is important to clarify and understand the resilience concept when applied to EPG analysis.
2. Resilience Concept under Electrical Power Grid Analysis
When discussing resilient systems and taking into account authors who use the term resilience in their research areas, there are different definitions used in the literature. In physical terms, resilience means “the capacity of a body to recover the original shape after suffering shock or deformation” or “the ability to overcome or recover from adversities”. Some authors argue that the widest definition of the resilience concept must be assumed, since it has become a term with different definitions over the years [15].
Different terms such as robustness, risk assessment, reliability, and adaptability, among others, are commonly used without differentiation, which may be misleading, since these concepts may be partial characteristics of a resilient system without replacing the concept of resilience itself [15,16,17,18,19,20,21]. Some of these terms are listed below:
- Robustness/Resistance refers to the ability of having strength in order to resist changes without losing stability, i.e., a robust system continues its operation during attacks or failure events, and can resist low-probability events, but with large consequences. In a robust system, if damage occurs the system will resist, but the damage will stay until it is repaired. Consequently, and from an engineering point of view, the robust system can be more fragile than others in terms of different features such as the capacity to recover after an event.
- Reliability refers to the system’s capacity to ensure components’ performance under specific conditions and over a specific period of time. Reliability is related to the accuracy of the system, and if the components are working in a range of conditions then the system security will be ensured.
- Adaptability of control systems is aimed at proper functioning by adjusting their control parameters and algorithms according to uncertain changes. These disturbances can be regarded as undesirable incidents at the process layer, and the system is supposed to adapt itself to those changes.
For some knowledge areas, such as scientific, social or physical fields, the integration of the aforementioned concepts is the criteria used to define a system regarding its resilience.
As mentioned before, resilience is the ability of a system to recover as fast as possible from an adversity; however, this could take different views and applications regarding the knowledge field where resilience is being considered.
2.1. Multidisciplinarity of Resilience
Resilience is a concept that could be applied to a wide range of disciplines, whether scientific, social, human or physical knowledge fields [22], with different approaches but with a common goal: “resilience is the ability to face adversity” [23]. Some views of resilience in different knowledge fields are described as follows.
2.1.1. Ecology
Holling, responsible for introducing the resilience concept into the ecology discipline, stated that resilience implies the capability of a system to preserve its behavior after some perturbation, i.e., the ability to withstand any change during a case of trouble and shift from one stability domain to another in order to maintain diversity [24]. Twenty years later, Holling stated that disturbances can see their magnitude absorbed before the system changes to another equilibrium state [25]. On the contrary, other authors argue that resilience represents the recovering process of a system after some disturbance [26,27]. On the other hand, Walker claims that a resilient system should be able to self-organize itself during a perturbation [28]. Ecological resilience can then be defined as a system’s ability to absorb changes during a perturbation, maintaining its own characteristics and functionalities.
2.1.2. Organizational
For business ecosystems, Shefii [29] defined organizational resilience as the capacity to keep or recover a steady state, allowing the continuation of normal operations. Also, Nemeth defined companies’ resilience as the speed at which companies can return to normal performance after a business change, such as a disruptive event like an inventory [30]. On the other hand, Patterson defends collaborative cross-checking as a strategy that would improve organizations’ resilience [31].
2.1.3. Engineering
Opposite to ecological resilience, which considers the unpredictability of hazards, engineering resilience considers that natural disasters can be predicted, and prediction systems are reliable enough to forecast those events.
Although all of them are addressing the engineering knowledge field, several authors consider different meanings for the resilience concept. Marjolein states that engineering resilience is focused on predictability and efficiency, saying that, considering engineering resilience, a system must have resistance to disturbance and have a high speed of return to the stable state [32]. However, for Sharifi, engineering resilience is based on risk assessment as well as on the management of systems, and intends to improve the robustness of critical infrastructures, providing a rapid recovery to the initial point [33]. The American Society of Mechanical Engineers (ASME) considers the resilience of a system as the ability to withstand internal and external disturbances without compromising its performance [34]. For the US National Infrastructure Advisory Council (NIAC), the ability of a system to predict, adapt and quickly recover from an unexpected event is what defines its resilience [35]. Youn defined the resilience of an engineering system as a result of the combination between the reliability and restoration of that system [36].
Summing up, a resilient engineering system is, on one hand, a system with the ability to maintain its performance during an outage, providing reliability and adaptability. On the other hand, it is a robust system with resistance to disturbances and with the ability to quickly recover after an outage.
2.2. Power Grid Resilience Framework
The electric power grid now faces greater and more frequent risks of interruption, owing to extreme weather events, human faults or attacks, aging, and the astonishing rate at which the electric grid is diversifying its energy resources and technology. Centralized power plants, transmission lines, substations and power transformers as well as distributed generation (DG) are considered potential weak points, since even a minor incident can cause a power outage.
As stated before, resilience can have different criteria and meanings. Its definition in each field is important, since the other actions to be considered can take different approaches from management through construction or other system recovery strategies.
Arghandeh attempted to clarify and standardize the definition of resilience within EPGs [18]. For this, the author carried out a study of the different terms used, and those often confused with resilience, in the literature. This study concluded that a resilient system should evaluate risks and perform a set of actions, over a period of time, to ensure its functionality against risks, attacks or faults. For the English Cabinet Office, infrastructure resilience is obtained from a good system and network design in order to ensure the needed resistance, reliability and the capability to switch or divide the system into other parts (redundancy), to maintain the continuity of services during an outage [37]. Also, to present a good resilience, the system should acquire the ability, capacity and capability to respond and recover. For Jufri, power grid resilience is assessed based on the amount of damage caused by an extreme event on the grid or by the capability that the grid has to keep functioning during the damaged state [38].
The power grid resilience framework presented above has two typical structures: assessment and improvement. On one hand, in the grid assessment, the conditions of the grid are studied and the risks are evaluated. On the other hand, the power grid system is improved in order to maintain the continuity of services during an outage and reduce the required time to return to its normal state.
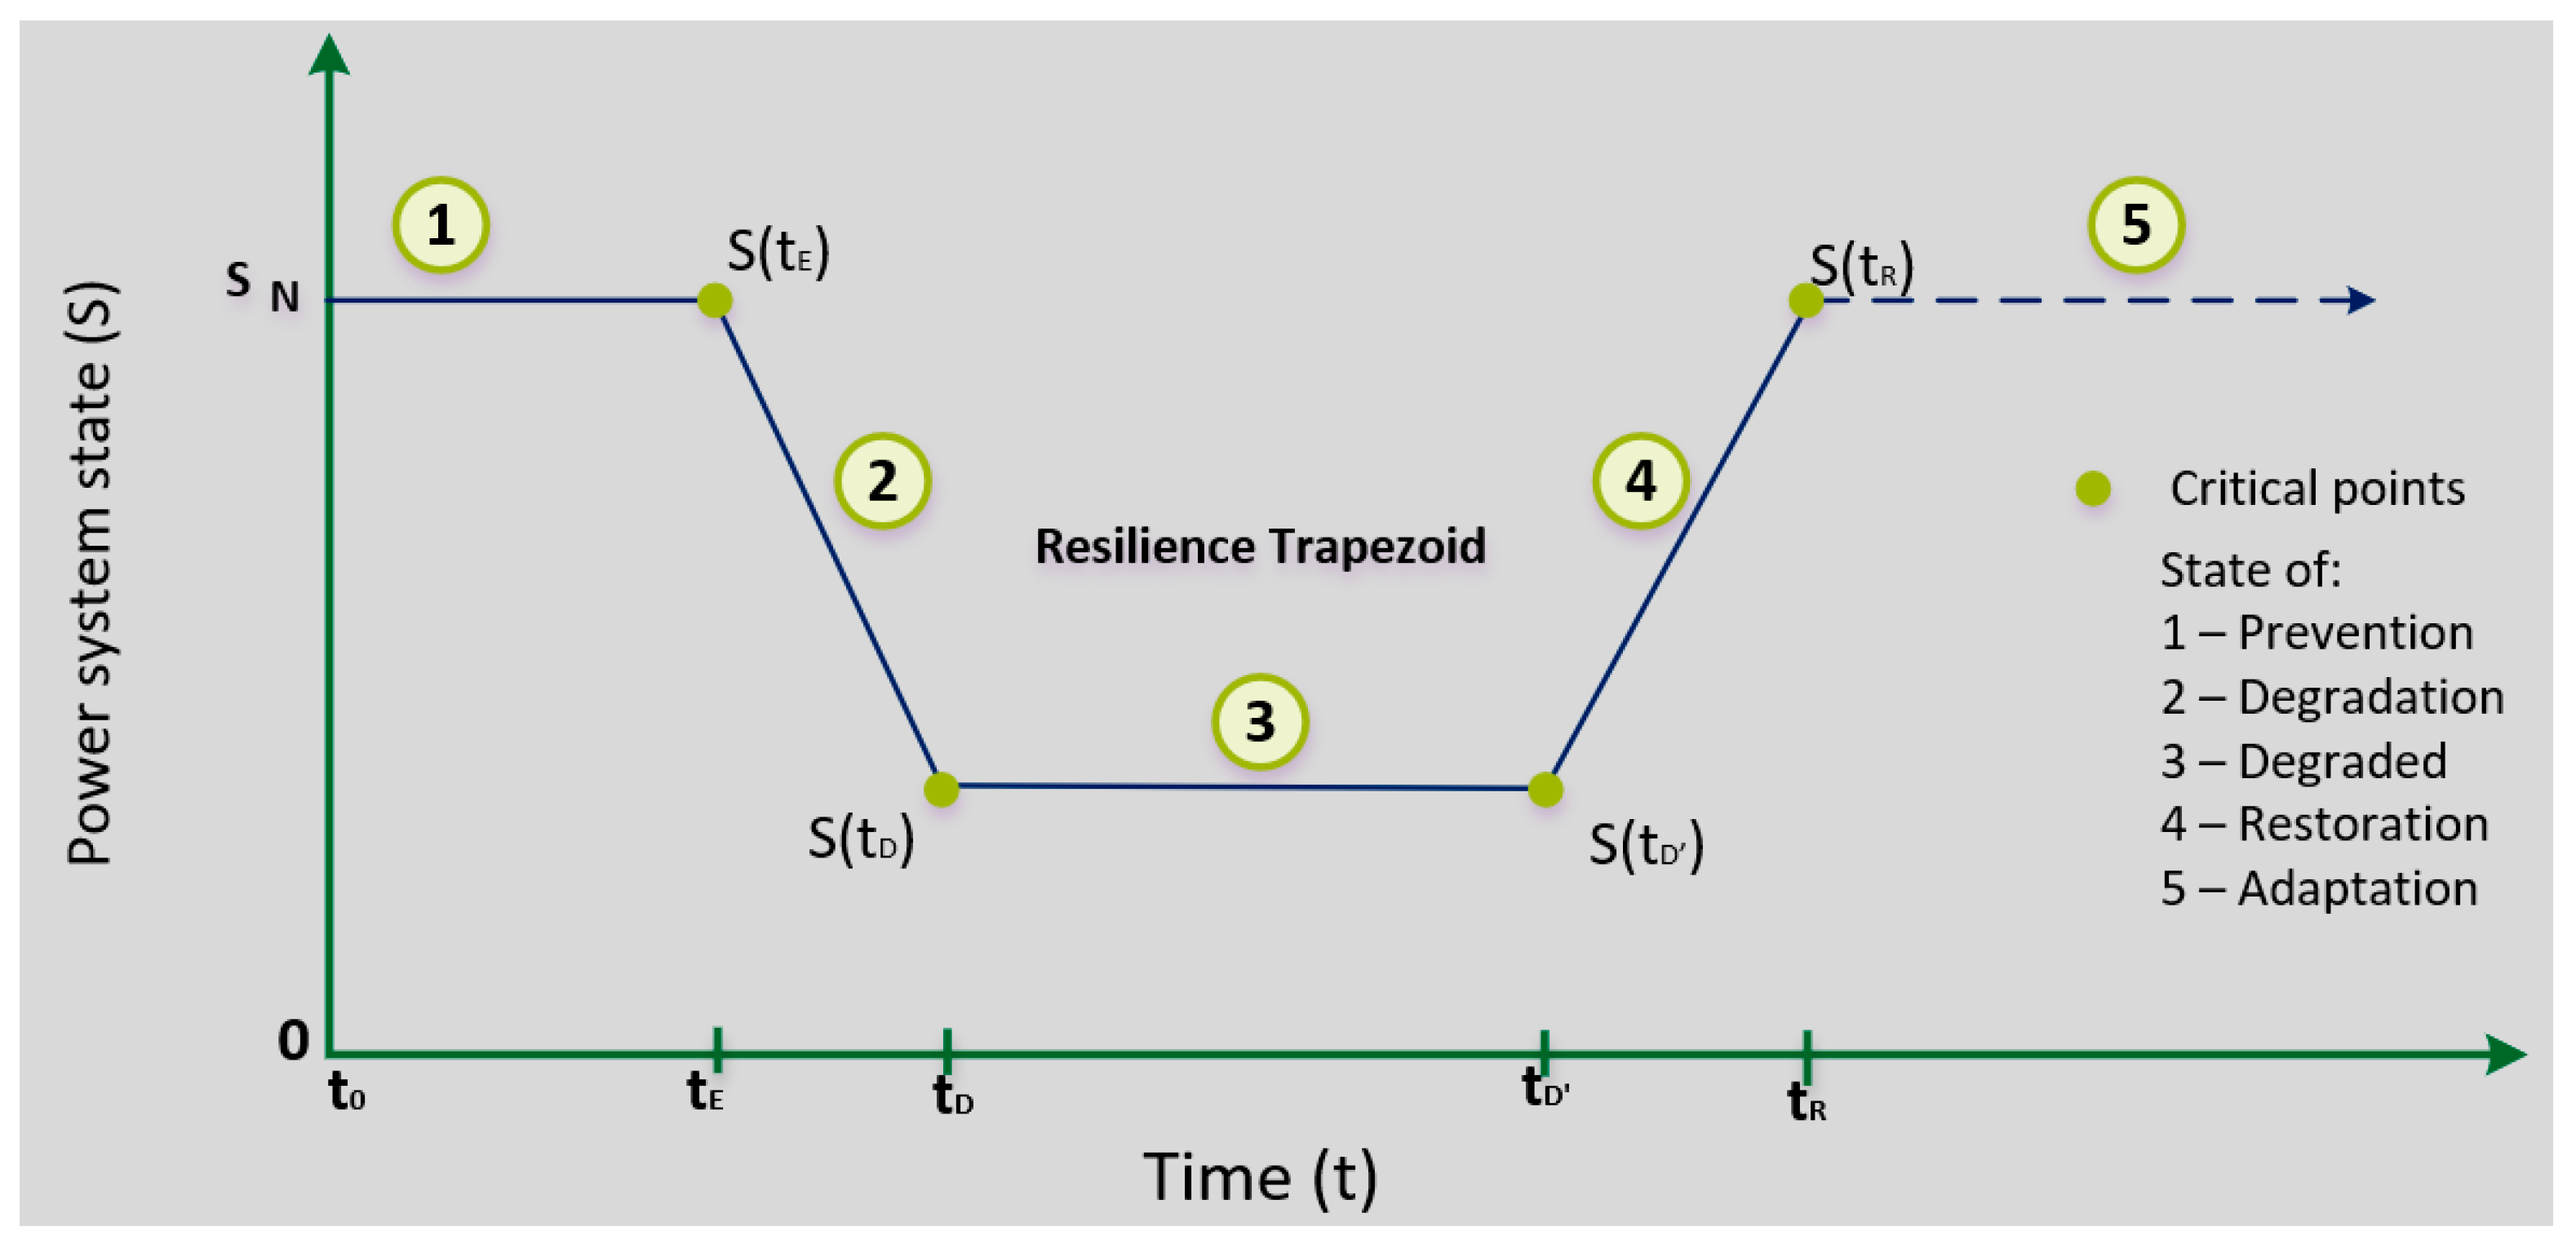
Several authors have tried to characterize system resilience in a temporal line. Figure 1 and Figure 2 present the so-called resilience triangle and trapezoid, respectively. The resilience triangle was introduced by Bruneau [39,40], considering that the system does not have a degraded state. This curve was first used to study system resilience considering the states presented in Figure 1. Panteli and Mancarella defended that the resilience triangle approach would not be able to capture some critical resilience dimensions experienced by power systems, for example how long the infrastructure remains in one post-degraded state before starting the restoration state [41].
In 2017, Panteli argued that for a system to be able to deal efficiently with the conditions associated with a fault, it must present the characteristics of the resilience trapezoid, presented in Figure 2. In this case, it is possible to represent the different states that electrical power systems experience during an event, as well as the transitions between them [42,43]. Considering this, the trapezoid resilience curve is the one that is normally considered to study and characterize system resilience.
Initially, the grid is under normal conditions, SN, until an extreme event occurs at time tE, as presented in Figure 2. When the extreme event occurs, the grid functionality goes to the degradation state until time tD, the worst condition of the system, S(tD). If no restoring actions are carried out, the system will remain in the degraded state until the implementation of restoring actions. At time tD’, the restoration process will start, and it continues until the system reaches the initial state of functionality, at time tR.
After clarifying the resilience concept with EPG systems, the next section will address the three RQs defined in this survey: the main causes of faults, the most reported faults and resilience strategies.
3. Weaknesses in Electric Power Grids
This section highlights the weaknesses in EPGs and reviews the related literature in order to understand which faults occur more often and what are their causes. The objective is to catalog the knowledge identified in those studies and to identify new research opportunities.
Faults and Related Causes
The scale of the cause will influence the respective consequences of the originated fault. If a small cause occurs, it will originate a small-scale fault that will only affect some residential houses and will be easy to repair, possibly being solved in a few hours. On the contrary, if it is a large-scale cause, like, for example, a hurricane or a terrorist attack, it can originate a large-scale fault, like a blackout or a cascading failure, affecting a large geographical area and possibly taking days or weeks to recover from. Large-scale outages also have serious economic and social consequences that will affect the consumer. In the case of a large-scale outage, a robust system is expected to recover, when compared to a non-robust system, and to have the capacity of restoring to its initial state.
In the literature, three main cause clusters are reported:
- Natural Causes: different types of natural disasters that could lead to a fault in the EPG, such as hurricanes, storms, flooding, earthquakes, tornados, heat waves or solar flares;
- Errors: causes related to human faults or equipment technical malfunction;
- Attacks: cyber-attacks such as denial of service (most common), or human attacks such as terrorism.
These causes, when they occur, can lead to a wide variety of faults in the EPG. In Table 1, different EPG faults are presented, separated into three clusters for each cause that originates the faults. First, there are natural causes, where extreme events like hurricanes, storms or flooding are considered. Second, there are errors, which can be due to human or equipment failure, and third, there are attacks, of cyber or physical origin. Table 1 shows the principal references where these causes/faults are reported.
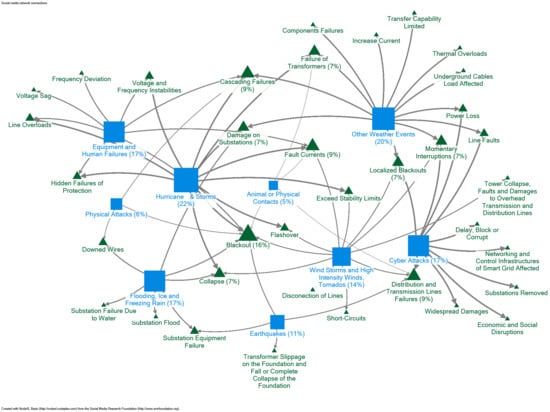
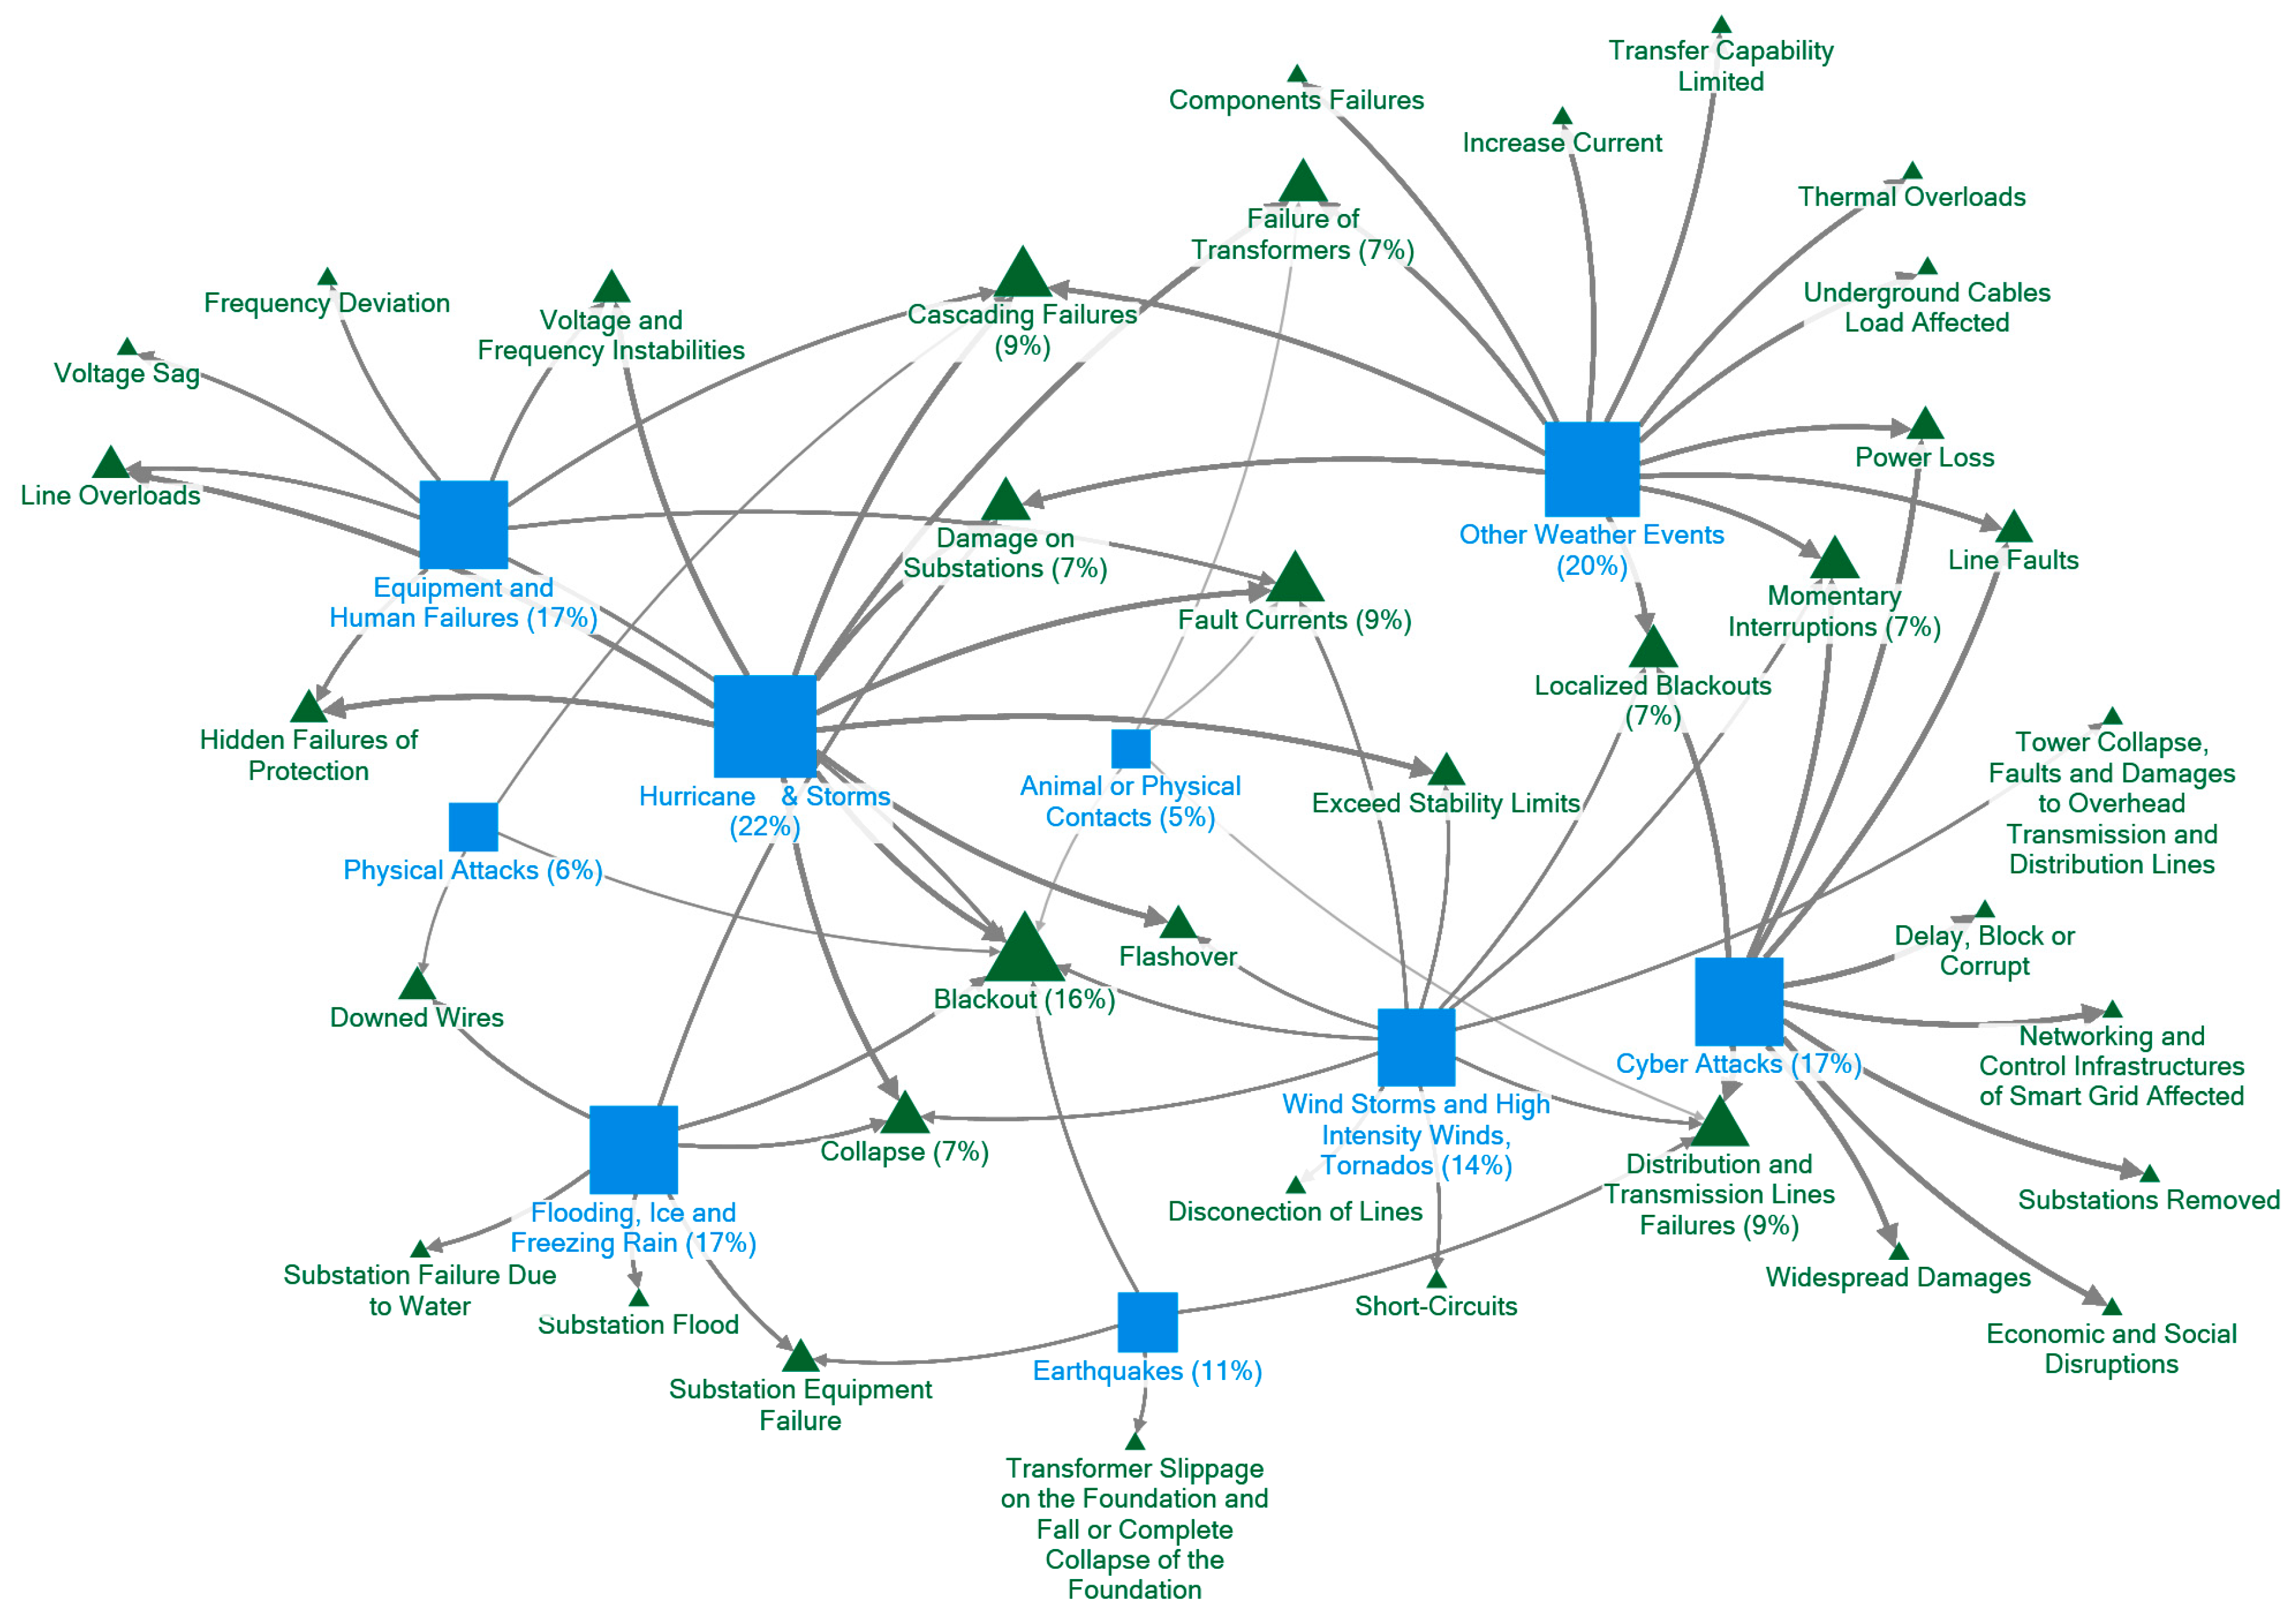
In order to analyze all the relations amongst causes and faults in EPGs, a graphical representation using visualization software NodeXL (Social Media Research Foundation, California, CA, USA) was performed, following the strategy adopted in [86,87]. With this analysis, it was possible to understand the importance of studying the cause/fault relations and identify less studied areas. For this analysis, a range of 65 articles was studied, and the same article can mention different faults regarding one cause or vice versa, i.e., the same fault can be instigated by different causes. The analysis performed is represented by the graph presented in Figure 3, created using the Force Atlas algorithm [88]. The blue squares denote causes, and the corresponding faults are denoted by green triangles. The size of the elements (squares and triangles) is proportional to the number of times they are discussed in the surveyed literature.
Analyzing Figure 3 and considering the abovementioned clusters, the literature review shows that 84% of articles mention faults due to natural causes. The most referenced natural causes are hurricanes and storms, with 22% of articles mentioning these causes, following by other natural events such as heat waves or thunderstorms, which were studied in 20% of all articles considered in this survey. Still in the natural causes cluster, windstorms and tornados represent a 14% percentage of articles, and earthquakes appear in 11% of the studied articles [54,66,67,68]. Continuing to the errors cluster, equipment errors and human failures were analyzed together and represent 17% of studied articles, while animal or physical contacts with lines represent only 5% of the articles considered for this survey. Finally, for the attacks cluster, cyber-attacks represent 17% of read articles, a huge percentage when compared with physical attacks, which represent only 6% of the studied literature for this survey [58,69].
The abovementioned causes are connected to the resulting faults, represented in Figure 3 by green triangles. As seen before in Table 1, the same fault can be originated by different causes. In Figure 3, the largest triangles represent faults that are mentioned more in the analyzed articles for this survey. Blackout, the fault represented by the largest triangle in Figure 3, was referenced in 16% of the 65 articles studied in this analysis. A detailed observation in Figure 4a, focusing on the blackout green triangle and its connecting lines from causes, shows that some of the lines are thicker than others. For example, the line that connects hurricanes and storms is denser than the line connecting physical attacks, meaning that blackout is more related with hurricanes and storms than with physical attacks.
Also, looking at Figure 4b, both “Hurricane and storms” and “Equipment and human failures”, despite being of different clusters, i.e., natural causes and errors, can originate the same type of faults such as cascading failures and fault currents, the second most referenced faults in studied articles, being mentioned in 9% of them.
4. EPG Resilience
Regarding the studied literature and causes/faults graph previously analyzed, the researchers considered some approaches. These strategies will improve the grid resilience, aiming to avoid some of the faults that occurred in other situations or decrease the magnitude of impact on the EPG. Figure 5 represents the relation between the studied faults, presented in Figure 3, and different solutions. Considering the literature review, these solutions were categorized into four clusters:
- Prevention and management;
- Monitoring and fault detection;
- Smart grid-based solutions;
- Modeling and simulation.
These four clusters are represented by blue squares and each of them has a set of solutions that different authors have presented in their studies.
Concerning the studied articles for this survey, 28% belong to “Prevention and management” solutions and are correlated with almost every fault represented in Figure 5. This type of solution is normally carried out to acquire the easiest knowledge of the power system as well as to increase the security of the grid before an outage. Also, “Smart grid-based solutions”, which are referenced in 33% of considered articles, had an increase in applications and many of the studied authors refer to them as a viable way to improve the quality of the EPG and decrease the consequences of a fault.
Monitoring the system and detecting faults as soon as possible is also an important approach to increase EPG resilience. From the studied literature, 20% of the authors use monitoring and fault detection methods in order to guarantee that issues are detected before an outage or in time to be solved without any extreme consequences.
Blackout and cascading failures, two of the most studied faults in articles considered for this survey, can have large consequences and lead to an outage that will affect a large number of people. As shown in Figure 5, modeling and simulation are used as a solution for 23% of the authors mentioned in this survey, and this is one of the considered methods to identify possible solutions and preventive actions to apply when a blackout or a cascading failure occurs.
4.1. Prevention and Management
As it is possible to observe in Figure 5, almost every fault, represented by green triangles, has as one of its possible solutions “Prevention and management”. Some of the most common actions of prevention are presented in this subchapter, keeping in mind that some events can be predicted and/or prevented and others cannot.
Physical changes in the infrastructure of an EPG can make it less susceptible to damage, so reinforcing the utility poles and overhead lines can be an option to prevent damage in case of extreme events [69,89]. Elevating substations, considering floods, is another possible construction approach to avoid damage in electrical grids. Also, the risk management of an EPG will help to understand what can be changed or improved in order to decrease the faults and susceptibilities of the system [73,90,91].
The technique of undergrounding the overhead distribution system is the most obvious solution and would prevent storms, lightning strikes or even trees from destroying lines and poles. However, this solution has high costs and it is not recommended since it does not guarantee the reliability of the system at 100% [89,92,93]. Another problem that this solution has is that when the distribution system is underground, the restoration time could increase due to the difficulty of accessing the cables. The most viable solution is to choose the distribution line areas where it could be more dangerous and more likely to affect the line and then only underground those portions.
On the other hand, for those portions that would not be underground, the structural reinforcement of the distribution system is another hardening solution used. Some of the suggested practices are to install guy wires or use steel or composite poles in order to reinforce the existent poles [92]. Also, to prevent and combat equipment water damage due to flooding or strong rains, the application of hydrophobic coatings or the application of grade B construction is mentioned, which is the stronger standard of construction [94].
Another physical hardiness technique consists in the relocation of substations and rerouting lines when it is possible to predict that a fault could occur. According to [44], if a substation normally supplies several critical consumers, it is likely to be affected by extreme weather, so relocating that substation as well as rerouting the power flow is a preventive measure that can assure the resilience of the EPG. This rerouting can also be done after the system detects an outage, redirecting the power flow to undamaged lines [92,95], a procedure that is usually performed remotely.
Also, an important topic related to prevention and management is risk analysis and the maintenance of EPG components, as seen in Figure 5. The EPG assessment evaluates the electrical and mechanical well-functioning of the distribution system as well as of the electrical equipment. This will allow the determination of the useful working life as initially designed and installed. Defects, deficiencies, hazards or weaknesses of the electrical power system are identified and solved in order to guarantee the performance of the system and so that they do not challenge the reliability of the system [33,92,96]. Also, by recording measured data from the circuits it is possible to monitor the power quality of the infrastructures in order to detect if any problem occurs, such as disruptive transients or voltage/frequency sags.
As part of their management duties, grid distribution system operators (DSOs) are responsible for supporting power flow and ensuring the quality of the supply, and for maintaining and reinforcing the reliability of the EPG as well as for a fast and secure grid restoration when a fault occurs [97,98]. The DSOs are able to interact with the distributed energy resources and coordinate the EPG depending on the actual needs. Procedures addressing EPG reconfiguration, monitoring and fault detection are also controlled by DSOs [99]. Nowadays, the role of grid operators is discussed more in relation to the huge deployment of renewable energy sources and consequent deployment of distributed energy technologies. Prostejovsky carried out a series of studies in order to understand how necessary and fundamental human work related to grid control is [100]. It was concluded that when dealing with extreme events and abnormal situations, which can occur in an EPG, human intuition is considered indispensable.
4.2. Monitoring and Fault Detection
Monitoring is a method that can be used to predict faults or to observe, in real time, the performance of the power grid [91]. In [93], a distributed computation method is used for near real-time monitoring of grid robustness in order to detect cascade failures. Moreover, in [92], the authors developed a system to detect fault locations and carry out fault monitoring in real time in order to be able to manage the EPG during faults. They created three different monitoring systems that only monitor the electric current but have different locations for the sensors used on the EPG.
These monitoring operations are supported by Supervisory Control and Data Acquisition (SCADA) systems, in order to monitor the state of the EPG as well as its components [101]. A SCADA system consists in a measurement system used to control and monitor the EPG and, normally, is constituted by the control network, communication infrastructure and process network. These systems are able to do manual or remote procedures through the control center, which provides real-time data about the EPG state [102,103].
Also, a solution that can be applied when the grid is being monitored is load shedding, which will help to avoid imbalances and variations on the EPG that can lead to a fault. In [104], Marzband et al. used load shedding in islanded microgrids to regulate the EPG frequency. Also, in [105], Golari et al. considered that load shedding is a measure that can be applied to measure the inability of the EPG to respond to disruption and extreme events.
Fault detection and its location also have an important role in the restoration of the system and will help to improve the resilience of the EPG, since the faster the fault is located, the faster it will be repaired. Fault location methods are applied to transmission and distribution systems and use different approaches, which typically fall into one of two categories: model-based and data-driven approaches [46,106].
SCADA systems have an important role in EPG fault detection by measuring and processing real-time data, which will allow us to understand in which branch of the grid, or distributed energy resource, the fault occurred. With a fault monitoring system associated with and considering data collected by a SCADA system, it is possible to detect imperfections created on the grid and collect the information necessary to deal with those faults [107,108]. Another application of SCADA systems is fault detection in renewable sources, for example in wind turbines [109]. In [110], a SCADA system was used to detect and classify faults in wind turbines by using high-frequency sampling from SCADA sensors. Also, using real-time SCADA data from two wind power plants, a fault prediction and diagnosis methodology for wind turbine-based generators was accomplished [111].
Relay protection can also be used as a preventive measure when a fault is detected [112]. Baran et al. [113] studied a protection method based on early overcurrent for DC relay protection. Zhu et al. [114] proposed a directional relay solution that can identify faults in both the negative and positive directions and will help to solve the adaptability problem as well as to identify current faults on the EPG.
4.3. Smart Grid-Based Solutions
A microgrid represents a small-scale EPG, low-voltage (LV) distribution systems, distributed energy resources (microturbines, photovoltaic systems (PV), fuel cells, etc.) together with storage devices (batteries, energy capacitors, etc.). This type of system can operate in a non-autonomous way, where it operates connected to the main grid, or in an autonomous way, the island mode, where the system is disconnected from the main grid and the system is able to work by itself [92,115].
The implementation of microgrids has multiple advantages from different points of view. From a utility standpoint, on one hand, a microgrid can improve available generation, providing more power to a larger area. On the other hand, the location being closed to loads has two effects: the reduction of losses and the ability to be a substitute for network resources, due to the reduction of power flows in transmission and distribution circuits [92,115]. Some advantages from the grid operator’s and the customers’ points of view are shown in Figure 6.
Creating a power grid formed only by interconnected microgrids, known as networked microgrids, is one approach that uses microgrids to improve the resilience of power systems. This method consists in a group of microgrids connected with each other and able to support each other with local generation capacity, and able to act to support an emergency microgrid. When in normal operation, microgrids are autonomous systems without power exchanges with the main grid or other microgrids. When in emergency mode, the microgrid in failure will be supplied by other microgrids, preventing the failure of the microgrid and the supply that customers are dependent on, during the reparation time [66].
Regarding the resilience of the power grid, in [116,117], microgrids are used to perform load control, and act as dispatchable and non-dispatchable units and energy storage units within the grid, as well as showing that integrating microgrids in an EPG will improve the resilience of the system as a whole. For the authors of [118], it is important conceptualize the frameworks that a microgrid can help in, thinking about the potential of microgrids, in order to understand how to use them in favor of the optimization of the operation of an EPG.
Intentional islanding consists in splitting the power grid into stable islands, defining, in real time, the branches that should be disconnected from the main grid, in order to isolate affected components whose failure would trigger cascading events [119,120]. Islanding schemes are delineated according to graph partitioning and should be used only as a last resort, after the failure has been detected but before the system becomes uncontrollable. To realize islanding, some constraints are important to take into account to guarantee the functionality of the island grid. These constraints are generators’ coherency, load generation balance, voltage, and frequency stability, among others [120,121,122].
This method, which helps to protect the power grid during an outage and consequently guarantee its functionality during the failure event, can also be used to improve the quality of supply indices, to reduce the amount of load scheduling, and to prevent large-scale blackouts, consequently improving the reliability of the grid [123]. The islanding approach can be solved using different methods and considering diverse constraints. Constrained spectral clustering [124], the multilevel kernel K [119], or the artificial bee colony algorithm [125] are examples of it.
Despite the fact that DG was mentioned in the beginning of this work as a possible weak point in the EPG, it brings many advantages to distribution networks and can be a usable source of power when the islanding method is applied to some branches of the grid [126]. Although there are some concerns such as the frequency of connection and disconnection from the EPG, concerns regarding renewable sources-based systems, or changes in the main aspects of the radial distribution network, DG presents a considerable number of advantages concerning its integration in the EPG [127,128]. Apart from being economically profitable, the installation of DG can improve the voltage and power quality of the EPG as well as the transmission system congestions that can occur [129,130]. Also, with the use of DG, the need to build new transmission lines decreases and it is possible to increase the flexibility of the grid.
4.4. Modeling and Simulation
Modeling the electrical grid and simulating events together with other types of simulation, such as weather forecasts, is an approach that helps to understand how the grid is affected in fault moments and will help to decrease the consequences. For instance, in 2012, Hurricane Sandy caused a catastrophic impact in New Jersey, with US $68 billion in damages, affecting the entire Atlantic coastline electrical infrastructure, with 69 and 102 electric substations damaged due to floods, 2500 transformers repaired, more than 4400 distribution poles replaced and 286 lives taken [47,131]. After this catastrophe, a control simulation and weather model were developed to try to understand the storm and future aspects to improve. With this model, it was possible to simulate what would happen if another similar storm happens, such as the estimated number of substations affected by flooding or the damage caused by winds to the electrical grid.
4.5. Summary of Power Grid Fault Resolutions vs. Resilience Curve
Different states of grid conditions presented by the trapezoid resilience curve in Figure 2 suggest different approaches in order to improve the resilience of EPGs. Considering the abovementioned fault resolution clusters, it is possible to correlate them with the states of the mentioned curve. This correlation is shown in Figure 7 and explained below.
- Prevention state: In this state, the grid is operating under normal conditions, and it is here that preventive and management actions are applied. This type of actions, showed in Figure 5, will help the system to deal successfully with future events. Also, monitoring actions as well as modeling and simulation can be applied at this stage, since this kind of actions can be helpful to understand how the system will react to an event or to take some pre-event actions [92].
- Degradation state: This state appears until the worst condition the grid will experience. As explained in Section 2.2, in this state, the magnitude of fault is represented and can be calculated with the evaluation of the failure state of grid components during the event. To do this, monitoring and fault detection actions will be taken into consideration so the faults can be located, and grid components can be monitored. If the intensity of the event exceeds the withstanding capability of the grid components, the damaged part could lead to a cascading failure event, and it is important to know where the faults have occurred [131,132].
- Restoration state: When a restoration action is taken, this state begins. Here, the transition between the damaged grid condition and its pre-event condition, i.e., the prevention state, occurs. Different types of actions can be applied to restore the grid to its initial state; however, the use of microgrids and demand response actions have been mentioned in a considerable number of reading articles for this survey. For instance, as mentioned above, microgrids can be used to isolate the affected area from the main grid and avoid a cascading failure event.
- Adaptation state: Finally, the adaptation state occurs when the grid is fully restored and the prevention state starts once more, with the application of the actions mentioned in this subchapter and represented in Figure 5.
5. Conclusions and Research Opportunities
This survey presents an analysis concerning faults and their causes affecting electric power grids, aiming to identify both: (i) strategies and approaches that are used to improve EPG resilience, and (ii) research opportunities in some areas that have not been explored so much yet. It starts with a clarification of the definition of EPG resilience and presents a state-of-the-art review of the causes, and consequent faults, that affect EPGs. A power system’s resilience is characterized by the capability to withstand an outage and keep functioning during the damage state, as well as the ability to respond and recover after the outage. Thus, resilience can be evaluated considering a resilience curve, widely adopted for power grids, which is divided into four stages, namely, prevention, degradation, restoration and adaptation.
At the beginning of this work, three RQs were proposed. Regarding the first one, with the analysis performed, based on the approach followed to conduct this survey, it was possible to identify three different types of causes, namely, natural causes, errors and attacks. Concerning the literature considered for this review of causes, 84% mentions natural causes, while 22% cites human or technical errors and 23% names physical or cyber-attacks. Natural causes can occur due to hurricanes, storms, earthquakes, tornados, lightning storms or heat waves, causing catastrophic outages. On the other hand, errors can originate from human failures or technical errors and equipment defects. Finally, attacks can have different origins, with physical attacks normally involving terrorist intentions or, the most common type of attacks nowadays, cyber-attacks. This type of attack was mentioned in 17% of read articles for this survey. They can affect the system operation of the EPG through data modification or sending false information to the system, causing delays or information corruption in the communication network.
In the literature, different types of strategies are considered to guarantee minor consequences for the EPG. If on one hand, some researchers defend the use of preventive strategies in order to maintain grid functioning and avoid faults, on the other hand, there are researchers that studied strategies to minimize the consequences after the faults. Improving the resolution time for the EPG using smart grid-based solutions such as the application of microgrids or intentional islanding, which will isolate the affected segment of the grid, are some of those approaches. Finally, these solutions are divided into four different clusters of actions and correlated with the resilience curve since, at different stages of the event, different types of actions can be applied to the EPG.
Research Opportunities
Based on the literature review presented in this survey, some on-going research opportunities were identified concerning power grids and the resilience of EPG areas.
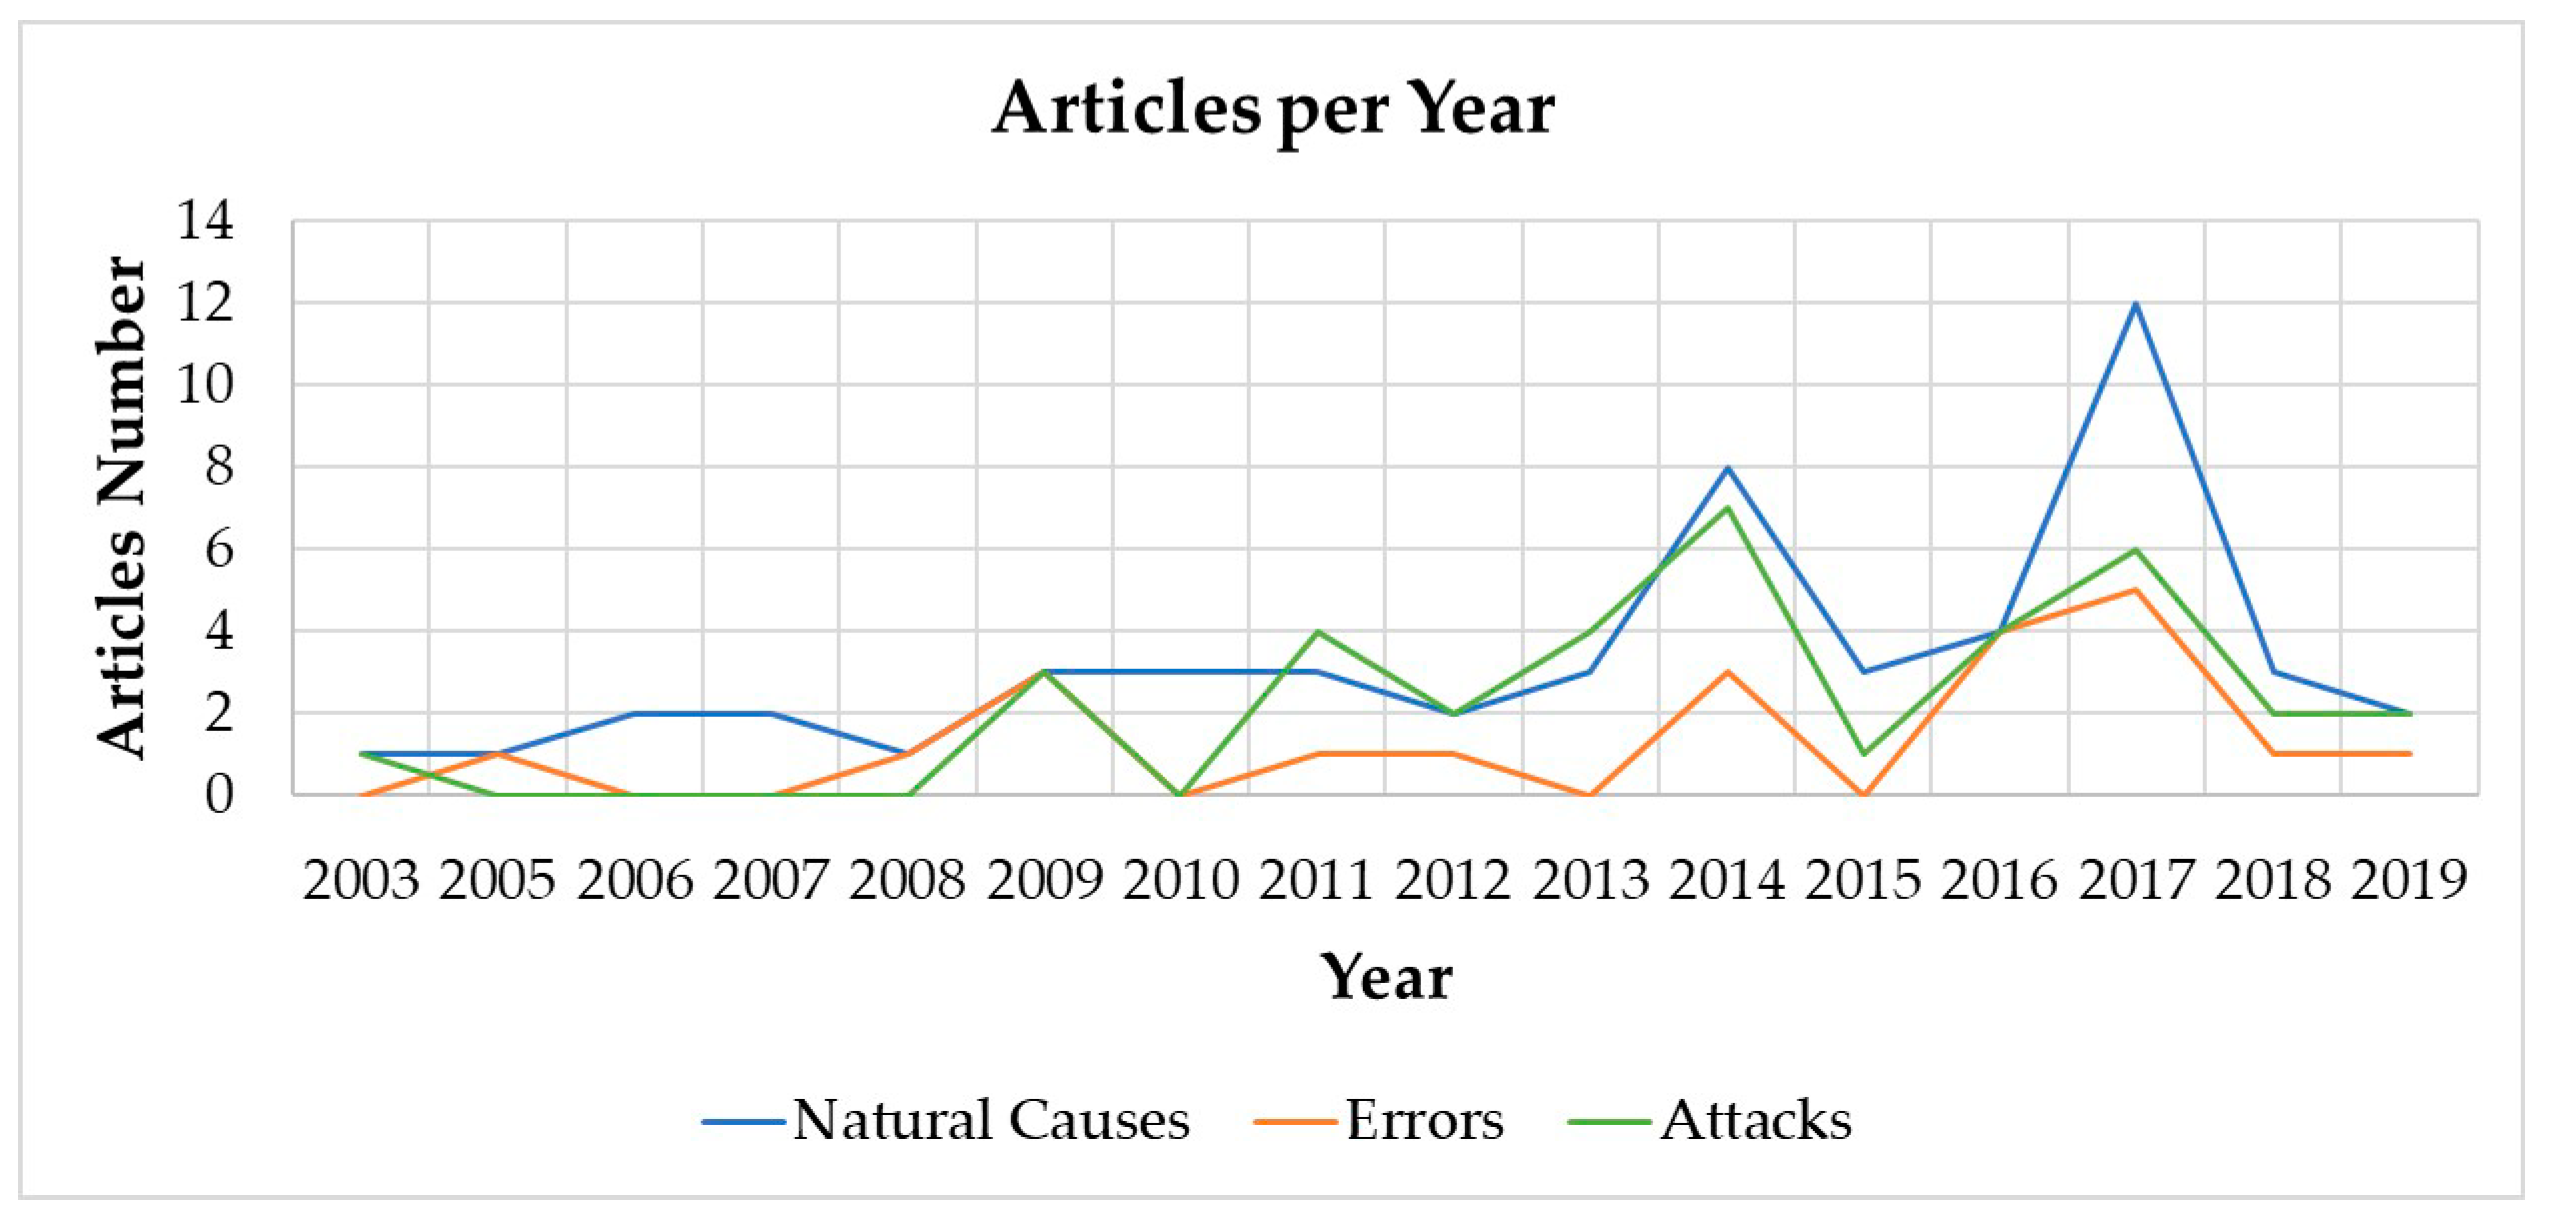
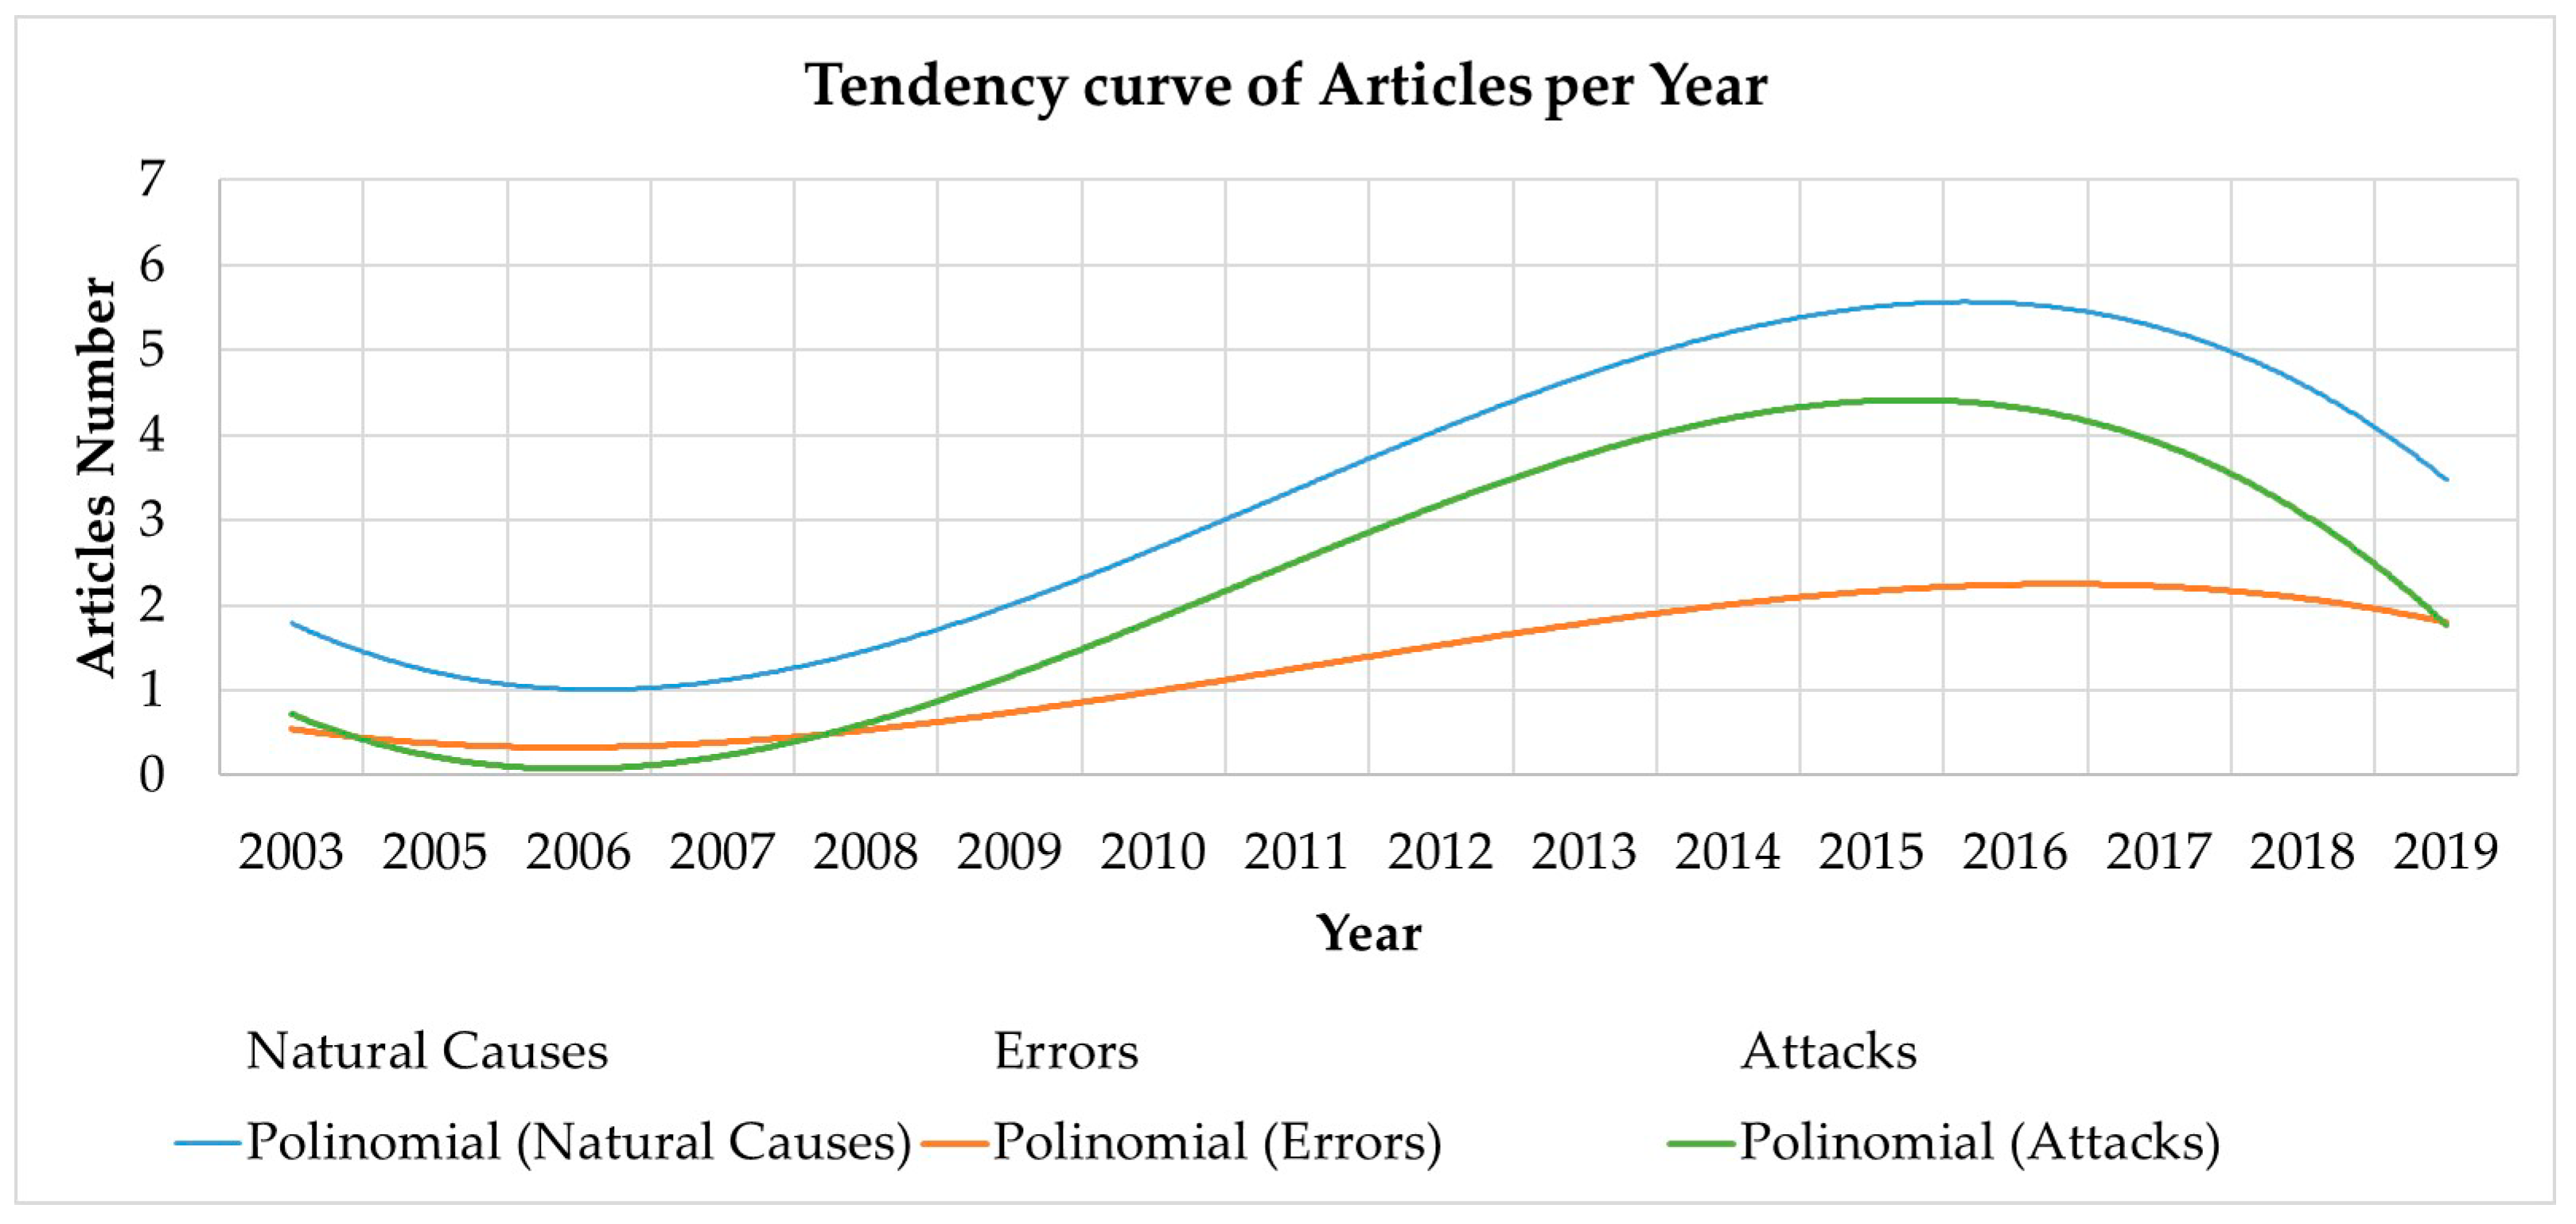
Regarding the study presented in Section 3 and collecting the publication data of the articles analyzed, it was possible to conclude that the most studied cause of faults is natural events. In Figure 8, a curve considering the publication year of all articles analyzed, correspondent to each cause, is represented. Also, the respective tendency curve of each cause is presented in Figure 9. Studying faults caused by human or equipment errors is one of the research opportunities since, as shown in Figure 9, natural causes and attacks are the most studied.
A grid connection with communities of net zero energy buildings is a research opportunity concerning the community load flexibility that can improve its resilience in case of a fault occurrence. Considering the cluster of smart grid-based solutions, which represents 33% of the articles considered with EPG resilience improvements, and the net zero energy building (NZEB) concept, a new solution to improve the resilience of a community when an outage occurs can be studied. The NZEB concept is based on the fact that a building produces the same amount of consumed energy during a certain time period (usually one year) [133]. Gathering prediction strategies with the idea mentioned above, the resilience of a community can be improved during an outage. Thus, in order to follow this research, it will be conductive to study the improvement of LV grid resilience, applying the NZEB community together with prediction systems as well as load flexibility. With this, it will be possible to study different scenarios and try to understand how different faults can influence the behavior of a community during an outage.
Author Contributions
All authors have worked on this manuscript together and all authors have read and approved the final manuscript. Conceptualization: A.M.; Investigation: A.M.; Supervision: P.P. and J.F.M.; Writing—original draft: A.M.; Writing—review: A.M., P.P. and J.F.M.
Funding
This research was funded in part by the Portuguese FCT Strategic program UID/EEA/00066/2019.
Conflicts of Interest
The authors declare no conflict of interest.
Abbreviations
The following abbreviations are used in this manuscript:
| DG | Distributed Generation |
| EPG | Electrical Power Grid |
| ICTs | Information and Communication Technologies |
| LV | Low-Voltage |
| NZEB | Net Zero Energy Building |
| PV | Photovoltaic System |
| SCADA | Supervisory Control and Data Acquisition |
References
- Fang, X.; Misra, S.; Xue, G.; Yang, D. Smart Grid—The New and Improved Power Grid: A Survey. IEEE Commun. Surv. Tutor. 2012, 14, 944–980. [Google Scholar] [CrossRef]
- Hare, J.; Shi, X.; Gupta, S.; Bazzi, A. Fault diagnostics in smart micro-grids: A survey. Renew. Sustain. Energy Rev. 2016, 60, 1114–1124. [Google Scholar] [CrossRef]
- Hosseini, S.; Barker, K.; Ramirez-Marquez, J.E. A review of definitions and measures of system resilience. Reliab. Eng. Syst. Saf. 2016, 145, 47–61. [Google Scholar] [CrossRef]
- Abi-Samra, N.C.; Malcolm, W.P. Extreme weather effects on power systems. In Proceedings of the IEEE Power and Energy Society General Meeting, Detroit, MI, USA, 24–28 July 2011; pp. 1–5. [Google Scholar]
- Albert, R.; Albert, I.; Nakarado, G.L. Structural vulnerability of the North American power grid. Phys. Rev. E-Stat. Nonlinear Soft Matter Phys. 2004, 69, 025103. [Google Scholar] [CrossRef] [Green Version]
- Crucitti, P.; Latora, V.; Marchiori, M. Model for cascading failures in complex networks. Phys. Rev. E-Stat. Phys. Plasmas Fluids Relat. Interdiscip. Top. 2004, 69, 4. [Google Scholar] [CrossRef] [Green Version]
- Hines, P.; Balasubramaniam, K.; Sanchez, E.C. Cascading failures in power grids. IEEE Potentials 2009, 28, 24–30. [Google Scholar] [CrossRef]
- Abi-Samra, N.C.; Forsten, K.R.; Entriken, R. Sample Effects of extreme weather on power systems and components, part I: Sample effects on distribution systems. In Proceedings of the 2010 IEEE Power and Energy Society General Meeting, Providence, RI, USA, 25–29 July 2010; Volume 34, pp. 1–34. [Google Scholar]
- Castillo, A. Risk analysis and management in power outage and restoration: A literature survey. Electr. Power Syst. Res. 2014, 107, 9–15. [Google Scholar] [CrossRef]
- Ouyang, M.; Wang, Z. Resilience assessment of interdependent infrastructure systems: With a focus on joint restoration modeling and analysis. Reliab. Eng. Syst. Saf. 2015, 141, 74–82. [Google Scholar] [CrossRef]
- Maliszewski, P.J.; Perrings, C. Factors in the resilience of electrical power distribution infrastructures. Appl. Geogr. 2012, 32, 668–679. [Google Scholar] [CrossRef]
- Hollnagel, E. Prologue: The Scope of Resilience Engineering. In Resilience Engineering in Practice: A Guidebook; CRC Press: Boca Raton, FL, USA, 2011; ISBN 9781409410355. [Google Scholar]
- Wang, J.; Zuo, W.; Rhode-Barbarigos, L.; Lu, X.; Wang, J.; Lin, Y. Literature review on modeling and simulation of energy infrastructures from a resilience perspective. Reliab. Eng. Syst. Saf. 2019, 183, 360–373. [Google Scholar] [CrossRef]
- Petersen, K.; Vakkalanka, S.; Kuzniarz, L. Guidelines for conducting systematic mapping studies in software engineering: An update. Inf. Softw. Technol. 2015, 64, 1–18. [Google Scholar] [CrossRef]
- Hodgson, D.; McDonald, J.L.; Hosken, D.J. What do you mean, “resilient”? Trends Ecol. Evol. 2015, 30, 503–506. [Google Scholar] [CrossRef]
- Madni, A.M.; Jackson, S. Towards a conceptual framework for resilience engineering. IEEE Syst. J. 2009, 3, 181–191. [Google Scholar] [CrossRef]
- Bishop, M.; Carvalho, M.; Ford, R.; Mayron, L.M. Resilience is More than Availability. In Proceedings of the New Security Paradigms Workshop, Marin County, CA, USA, 12–15 September 2011; pp. 95–104. [Google Scholar]
- Arghandeh, R.; von Meier, A.; Mehrmanesh, L.; Mili, L. On the definition of cyber-physical resilience in power systems. Renew. Sustain. Energy Rev. 2016, 58, 1060–1069. [Google Scholar] [CrossRef] [Green Version]
- Panteli, M.; Mancarella, P. Modeling and evaluating the resilience of critical electrical power infrastructure to extreme weather events. IEEE Syst. J. 2015, 11, 1–10. [Google Scholar] [CrossRef]
- Liu, X.; Shahidehpour, M.; Li, Z.; Liu, X.; Cao, Y.; Bie, Z. Microgrids for Enhancing the Power Grid Resilience in Extreme Conditions. IEEE Trans. Smart Grid 2017, 8, 589–597. [Google Scholar]
- Francis, R.; Bekera, B. A metric and frameworks for resilience analysis of engineered and infrastructure systems. Reliab. Eng. Syst. Saf. 2014, 121, 90–103. [Google Scholar] [CrossRef]
- Molyneaux, L.; Brown, C.; Wagner, L.; Foster, J. Measuring resilience in energy systems: Insights from a range of disciplines. Renew. Sustain. Energy Rev. 2016, 59, 1068–1079. [Google Scholar] [CrossRef] [Green Version]
- Southwick, S.; Charney, D. Resilience: The Science of Mastering Life’s Greatest Challenges; Cambridge University Press: Cambridge, UK, 2018; ISBN 9781108593465. [Google Scholar]
- Holling, C.S. Resilience and Stability of Ecological Systems. Annu. Rev. Ecol. Syst. 1973, 4, 1–23. [Google Scholar] [CrossRef] [Green Version]
- Holling, C.S. Cross-scale morphology, geometry, and dynamics of ecosystems. Ecol. Monogr. 1992, 62, 447–502. [Google Scholar] [CrossRef]
- Grimm, V.; Wissel, C. Babel, or the ecological stability discussions: An inventory and analysis of terminology and a guide for avoiding confusion. Oecologia 1997, 109, 323–334. [Google Scholar] [CrossRef]
- Standish, R.J.; Hobbs, R.J.; Mayfield, M.M.; Bestelmeyer, B.T.; Suding, K.N.; Battaglia, L.L.; Eviner, V.; Hawkes, C.V.; Temperton, V.M.; Cramer, V.A.; et al. Resilience in ecology: Abstraction, distraction, or where the action is? Biol. Conserv. 2014, 177, 43–51. [Google Scholar] [CrossRef] [Green Version]
- Walker, B.; Carpenter, S.; Anderies, J.; Abel, N.; Cumming, G.; Janssen, M.; Lebel, L.; Norberg, J.; Peterson, G.D.; Pritchard, R. Resilience management in social-ecological systems: A working hypothesis for a participatory approach. Ecol. Soc. 2002, 6, art14. [Google Scholar] [CrossRef]
- Sheffi, Y. The resilient enterprise: Overcoming vulnerability for competitive advantage. Choice Rev. Online 2006, 43, 3481. [Google Scholar]
- Nemeth, D.G.; Olivier, T.W. Innovative Approaches to Individual and Community Resilience from Theory to Practice; Academic Press: Cambridge, MA, USA, 2017; ISBN 9780128039137. [Google Scholar]
- Patterson, E.S.; Woods, D.D.; Cook, R.I.; Render, M.L. Collaborative cross-checking to enhance resilience. Cogn. Technol. Work 2007, 9, 155–162. [Google Scholar] [CrossRef]
- Sterk, M.; van de Leemput, I.A.; Peeters, E.T. How to conceptualize and operationalize resilience in socio-ecological systems? Curr. Opin. Environ. Sustain. 2017, 28, 108–113. [Google Scholar] [CrossRef]
- Sharifi, A.; Yamagata, Y. Principles and criteria for assessing urban energy resilience: A literature review. Renew. Sustain. Energy Rev. 2016, 60, 1654–1677. [Google Scholar] [CrossRef] [Green Version]
- ASME Innovative Technologies Institute. All Hazards Risk and Resilience: Prioritizing Critical Infrastructure Using the RAMCAP Plus; ASME: New York, NY, USA, 2009; ISBN 9780791802878. [Google Scholar]
- Bush, W. Critical Infrastructure Resilience Final Report and Recommendations; National Infrastructure Advisory Council: Washington, DC, USA, 2009. [Google Scholar]
- Youn, B.; Hu, C.; Wang, P. Resilience-Driven System Design of Complex Engineered Systems. J. Mech. Des. 2011, 133, 101011. [Google Scholar] [CrossRef]
- Cabinet Office. Keeping the Country Running: Natural Hazards and Infrastructure; Cabinet Office: London, UK, 2011. [Google Scholar]
- Jufri, F.H.; Kim, J.S.; Jung, J. Analysis of determinants of the impact and the grid capability to evaluate and improve grid resilience from extreme weather event. Energies 2017, 10, 1779. [Google Scholar] [CrossRef] [Green Version]
- Bruneau, M.; Chang, S.E.; Eguchi, R.T.; Lee, G.C.; O’Rourke, T.D.; Reinhorn, A.M.; Shinozuka, M.; Tierney, K.; Wallace, W.A.; Von Winterfeldt, D. A Framework to Quantitatively Assess and Enhance the Seismic Resilience of Communities. Earthq. Spectra 2003, 19, 733–752. [Google Scholar] [CrossRef] [Green Version]
- Ouyang, M.; Dueñas-Osorio, L.; Min, X. A three-stage resilience analysis framework for urban infrastructure systems. Struct. Saf. 2012, 36–37, 23–31. [Google Scholar] [CrossRef]
- Panteli, M.; Trakas, D.N.; Mancarella, P.; Hatziargyriou, N.D. Power Systems Resilience Assessment: Hardening and Smart Operational Enhancement Strategies. Proc. IEEE 2017, 105, 1202–1213. [Google Scholar] [CrossRef] [Green Version]
- Panteli, M.; Mancarella, P.; Trakas, D.N.; Kyriakides, E.; Hatziargyriou, N.D. Metrics and Quantification of Operational and Infrastructure Resilience in Power Systems. IEEE Trans. Power Syst. 2017, 32, 4732–4742. [Google Scholar] [CrossRef] [Green Version]
- Panteli, M.; Mancarella, P. The Grid: Stronger, Bigger, Smarter? IEEE Power Energy Mag. 2015, 13, 58–66. [Google Scholar] [CrossRef]
- Jufri, F.H.; Widiputra, V.; Jung, J. State-of-the-art review on power grid resilience to extreme weather events: Definitions, frameworks, quantitative assessment methodologies, and enhancement strategies. Appl. Energy 2019, 239, 1049–1065. [Google Scholar] [CrossRef]
- Lu, J.; Guo, J.; Jian, Z.; Yang, Y.; Tang, W. Resilience assessment and its enhancement in tackling adverse impact of ice disasters for power transmission systems. Energies 2018, 11, 2272. [Google Scholar] [CrossRef] [Green Version]
- Yates, D.; Luna, B.Q.; Rasmussen, R.; Bratcher, D.; Garre, L.; Chen, F.; Tewari, M.; Friis-Hansen, P. Stormy weather: Assessing climate change hazards to electric power infrastructure: A sandy case study. IEEE Power Energy Mag. 2014, 12, 66–75. [Google Scholar] [CrossRef]
- Abbey, C.; Cornforth, D.; Hatziargyriou, N.; Hirose, K.; Kwasinski, A.; Kyriakides, E.; Platt, G.; Reyes, L.; Suryanarayanan, S. Powering through the storm: Microgrids operation for more efficient disaster recovery. IEEE Power Energy Mag. 2014, 12, 67–76. [Google Scholar] [CrossRef]
- Singh, N.; Gupta, A. A study on mitigation of blackout risks in smart grid. In Proceedings of the IICPE IEEE India International Conference on Power Electronics, Patiala, India, 17–19 November 2016; pp. 1–4. [Google Scholar]
- Warnier, M.; Dulman, S.; Koç, Y.; Pauwels, E. Distributed monitoring for the prevention of cascading failures in operational power grids. Int. J. Crit. Infrastruct. Prot. 2017, 17, 15–27. [Google Scholar] [CrossRef] [Green Version]
- Ji, C.; Wei, Y.; Poor, H.V. Resilience of Energy Infrastructure and Services: Modeling, Data Analytics, and Metrics. Proc. IEEE 2017, 105, 1354–1366. [Google Scholar] [CrossRef]
- Gao, H.; Chen, Y.; Mei, S.; Huang, S.; Xu, Y. Resilience-Oriented Pre-Hurricane Resource Allocation in Distribution Systems Considering Electric Buses. Proc. IEEE 2017, 105, 1214–1233. [Google Scholar] [CrossRef]
- Reilly, A.C.; Tonn, G.L.; Zhai, C.; Guikema, S.D. Hurricanes and Power System Reliability-The Effects of Individual Decisions and System-Level Hardening. Proc. IEEE 2017, 105, 1429–1442. [Google Scholar] [CrossRef]
- McClure, G.; Langlois, S.; Rogier, J. Understanding how overhead lines respond to localized high intensity wind storms. In Proceedings of the 2008 Structures Congress-Structures Congress 2008: Crossing the Borders, Vancouver, British, 24–26 April 2008; American Society of Civil Engineers: Reston, VA, USA, 2008; Volume 314, pp. 1–10. [Google Scholar]
- Panteli, M.; Mancarella, P. Influence of extreme weather and climate change on the resilience of power systems: Impacts and possible mitigation strategies. Electr. Power Syst. Res. 2015, 127, 259–270. [Google Scholar] [CrossRef]
- Ward, D.M. The effect of weather on grid systems and the reliability of electricity supply. Clim. Chang. 2013, 121, 103–113. [Google Scholar] [CrossRef]
- Hines, P.; Apt, J.; Talukdar, S. Large blackouts in North America: Historical trends and policy implications. Energy Policy 2009, 37, 5249–5259. [Google Scholar] [CrossRef]
- Chen, C.; Wang, J.; Ton, D. Modernizing Distribution System Restoration to Achieve Grid Resiliency Against Extreme Weather Events: An Integrated Solution. Proc. IEEE 2017, 105, 1267–1288. [Google Scholar] [CrossRef]
- Araneda, J.C.; Rudnick, H.; Mocarquer, S.; Miquel, P. Lessons from the 2010 Chilean earthquake and its impact on electricity supply. In Proceedings of the IEEE 2010 Powercon International Conference on Power System Technology: Technological Innovations Making Power Grid Smarter, Hangzhou, China, 24–28 October 2010; pp. 1–7. [Google Scholar]
- Shinozuka, M.; Dong, X.; Chen, T.C.; Jin, X. Seismic performance of electric transmission network under component failures. Earthq. Eng. Struct. Dyn. 2007, 36, 227–244. [Google Scholar] [CrossRef]
- Nuti, C.; Rasulo, A.; Vanzi, I. Seismic safety evaluation of electric power supply at urban level. Earthq. Eng. Struct. Dyn. 2007, 36, 245–263. [Google Scholar] [CrossRef]
- Panteli, M.; Trakas, D.N.; Mancarella, P.; Hatziargyriou, N.D. Boosting the Power Grid Resilience to Extreme Weather Events Using Defensive Islanding. IEEE Trans. Smart Grid 2016, 7, 2913–2922. [Google Scholar] [CrossRef]
- Bie, Z.; Lin, Y.; Li, G.; Li, F. Battling the Extreme: A Study on the Power System Resilience. Proc. IEEE 2017, 105, 1253–1266. [Google Scholar] [CrossRef]
- Ferreira, E.F.; Barros, J.D. Faults Monitoring System in the Electric Power Grid of Medium Voltage. In Proceedings of the Procedia Computer Science, Porto, Portugal, 8–11 May 2018; Elsevier: Amsterdam, The Netherlands, 2018; Volume 130, pp. 696–703. [Google Scholar]
- Billinton, R.; Singh, G. Application of adverse and extreme adverse weather: Modelling in transmission and distribution system reliability evaluation. IEE Proc.-Gener. Transm. Distrib. 2006, 153, 115–120. [Google Scholar] [CrossRef]
- Mills, B.; Unrau, D.; Pentelow, L.; Spring, K. Assessment of lightning-related damage and disruption in Canada. Nat. Hazards 2010, 52, 481–499. [Google Scholar] [CrossRef]
- Li, Z.; Shahidehpour, M.; Aminifar, F.; Alabdulwahab, A.; Al-Turki, Y. Networked Microgrids for Enhancing the Power System Resilience. Proc. IEEE 2017, 105, 1289–1310. [Google Scholar] [CrossRef]
- Wang, Y.; Chen, C.; Wang, J.; Baldick, R. Research on Resilience of Power Systems under Natural Disasters-A Review. IEEE Trans. Power Syst. 2016, 31, 1604–1613. [Google Scholar] [CrossRef]
- Xie, Q.; Zhu, R. Earth, wind, and ice. IEEE Power Energy Mag. 2011, 9, 28–36. [Google Scholar] [CrossRef]
- Xu, Y.; Liu, C.C.; Schneider, K.P.; Ton, D.T. Toward a resilient distribution system. In Proceedings of the IEEE Power and Energy Society General Meeting, Denver, CO, USA, 26–30 July 2015; Volume 2015, pp. 1–5. [Google Scholar]
- Li, W.; Zhang, X. Simulation of the smart grid communications: Challenges, techniques, and future trends. Comput. Electr. Eng. 2014, 40, 270–288. [Google Scholar] [CrossRef]
- Baldick, R.; Chowdhury, B.; Dobson, I.; Dong, Z.; Gou, B.; Hawkins, D.; Huang, H.; Joung, M.; Kirschen, D.; Li, F.; et al. Initial review of methods for cascading failure analysis in electric power transmission systems IEEE PES CAMS task force on understanding, prediction, mitigation and restoration of cascading failures. In Proceedings of the 2008 IEEE Power and Energy Society General Meeting-Conversion and Delivery of Electrical Energy in the 21st Century, Pittsburgh, PA, USA, 20–24 July 2008; pp. 1–8. [Google Scholar]
- Andersson, G.; Donalek, P.; Farmer, R.; Hatziargyriou, N.; Kamwa, I.; Kundur, P.; Martins, N.; Paserba, J.; Pourbeik, P.; Sanchez-Gasca, J.; et al. Causes of the 2003 major grid blackouts in North America Europe, and recommended means to improve system dynamic performance. IEEE Trans. Power Syst. 2005, 20, 1922–1928. [Google Scholar] [CrossRef]
- Kaitovic, I.; Lukovic, S.; Malek, M. Proactive failure management in smart grids for improved resilience: A methodology for failure prediction and mitigation. In Proceedings of the 2015 IEEE Globecom Workshops, GC Wkshps 2015-Proceedings, San Diego, CA, USA, 6–10 December 2015; pp. 1–6. [Google Scholar]
- Vaiman, M.; Bell, K.; Chen, Y.; Chowdhury, B.; Dobson, I.; Hines, P.; Papic, M.; Miller, S.; Zhang, P. Risk assessment of cascading outages: Methodologies and challenges. IEEE Trans. Power Syst. 2012, 27, 631–641. [Google Scholar] [CrossRef]
- Colak, I.; Sagiroglu, S.; Fulli, G.; Yesilbudak, M.; Covrig, C.F. A survey on the critical issues in smart grid technologies. Renew. Sustain. Energy Rev. 2016, 54, 396–405. [Google Scholar] [CrossRef]
- Zad Tootaghaj, D.; Bartolini, N.; Khamfroush, H.; He, T.; Ray Chaudhuri, N.; La Porta, T. Mitigation and Recovery from Cascading Failures in Interdependent Networks under Uncertainty. IEEE Trans. Control Netw. Syst. 2018, 6, 501–514. [Google Scholar] [CrossRef]
- Wang, W.; Lu, Z. Cyber security in the Smart Grid: Survey and challenges. Comput. Netw. 2013, 57, 1344–1371. [Google Scholar] [CrossRef]
- Pagani, G.A.; Aiello, M. The Power Grid as a complex network: A survey. Phys. A Stat. Mech. Appl. 2013, 392, 2688–2700. [Google Scholar] [CrossRef] [Green Version]
- Danzi, P.; Angjelichinoski, M.; Stefanović, Č.; Dragičević, T.; Popovski, P. Software-Defined Microgrid Control for Resilience Against Cyber Attacks. IEEE Trans. Smart Grid 2018, 10, 5258–5268. [Google Scholar] [CrossRef]
- Schuelke-Leech, B.A.; Barry, B.; Muratori, M.; Yurkovich, B.J. Big Data issues and opportunities for electric utilities. Renew. Sustain. Energy Rev. 2015, 52, 937–947. [Google Scholar] [CrossRef]
- Erol-Kantarci, M.; Mouftah, H. Smart grid forensic science: Applications, challenges, and open issues. IEEE Commun. Mag. 2013, 51, 68–74. [Google Scholar] [CrossRef]
- Liu, J.; Xiao, Y.; Li, S.; Liang, W.; Chen, C.L.P. Cyber security and privacy issues in smart grids. IEEE Commun. Surv. Tutor. 2012, 14, 981–997. [Google Scholar] [CrossRef]
- Manandhar, K.; Cao, X.; Hu, F.; Liu, Y. Detection of faults and attacks including false data injection attack in smart grid using Kalman filter. IEEE Trans. Control Netw. Syst. 2014, 1, 370–379. [Google Scholar] [CrossRef]
- Zhu, Y.; Yan, J.; Tang, Y.; Sun, Y.; He, H. Resilience analysis of power grids under the sequential attack. IEEE Trans. Inf. Forensics Secur. 2014, 9, 2340–2354. [Google Scholar] [CrossRef]
- Kosut, O.; Jia, L.; Thomas, R.J.; Tong, L. Malicious data attacks on the smart grid. IEEE Trans. Smart Grid 2011, 2, 645–658. [Google Scholar] [CrossRef] [Green Version]
- Smith, M.A.; Shneiderman, B.; Milic-Frayling, N.; Mendes Rodrigues, E.; Barash, V.; Dunne, C.; Capone, T.; Perer, A.; Gleave, E. Analyzing (social media) networks with NodeXL. In Proceedings of the Fourth International Conference on Communities and Technologies-C&T ’09, State College, PA, USA, 25–27 June 2009; ACM Press: New York, NY, USA, 2009; p. 255. [Google Scholar]
- Himelboim, I.; Smith, M.A. NodeXL. In The International Encyclopedia of Communication Research Methods; John Wiley & Sons, Inc.: Hoboken, NJ, USA, 2017; pp. 1–3. [Google Scholar]
- Jacomy, M.; Venturini, T.; Heymann, S.; Bastian, M. ForceAtlas2, a continuous graph layout algorithm for handy network visualization designed for the Gephi software. PLoS ONE 2014, 9, e98679. [Google Scholar] [CrossRef]
- Electric Institute, E. Before and After the Storm. 2014. Available online: http://www.eei.org/issuesandpolicy/electricreliability/mutualassistance/Documents/BeforeandAftertheStorm.pdf (accessed on 15 October 2019).
- Papic, M.; Bell, K.; Chen, Y.; Dobson, I.; Fonte, L.; Haq, E.; Hines, P.; Kirschen, D.; Luo, X.; Miller, S.S.; et al. Survey of tools for risk assessment of cascading outages. In Proceedings of the IEEE Power and Energy Society General Meeting, Detroit, MI, USA, 24–28 July 2011; pp. 1–9. [Google Scholar]
- Shiwen, Y.; Hui, H.; Chengzhi, W.; Hao, G.; Hao, F. Review on Risk Assessment of Power System. In Proceedings of the Procedia Computer Science, Zurich, Switzerland, 12–14 June 2017; Elsevier: Amsterdam, The Netherlands, 2017; Volume 109, pp. 1200–1205. [Google Scholar]
- Davis, G.; Snyder, A.F.; Mader, J. The future of Distribution System Resiliency. In Proceedings of the IEEE PSC 2014 Clemson University Power Systems Conference, Clemson, SC, USA, 11–14 March 2014; pp. 1–8. [Google Scholar]
- McGranaghan, M.; Olearczyk, M.; Gellings, C. Enhancing distribution resiliency: Opportunities for applying innovative technologies. Electr. Power Res. Inst. 2013, 20. [Google Scholar]
- Brown, R.E. Storm Hardening the Distribution System. 2010. Available online: www.tdworld.com (accessed on 12 October 2019).
- Amin, M.; Schewe, P.F. Preventing blackouts. Sci. Am. 2007, 296, 60–67. [Google Scholar] [CrossRef] [PubMed]
- Waterer, S. Enhance Power Equipment Reliability with Predictive Maintenance Technologies. 2012. Available online: https://www.se.com/us/en/download/document/1910DB1208/ (accessed on 11 November 2019).
- Poudineh, R.; Jamasb, T. Distributed generation, storage, demand response and energy efficiency as alternatives to grid capacity enhancement. Energy Policy 2014, 67, 222–231. [Google Scholar] [CrossRef] [Green Version]
- Hinkel, P.; Henschel, D.; Zugck, M.; Wellssow, W.; Torabi, E.; Guo, Y.; Rossa-Weber, G.; Gawlik, W.; Traxler, E.; Fiedler, L.; et al. Control Center Interfaces and Tools for Power System Restoration. In Proceedings of the ETG Symposium International ETG-Congress, Esslingen, Germany, 8–9 May 2019; VDE: Frankfurt, Germany, 2019; pp. 1–6. [Google Scholar]
- Madureira, A.; Gouveia, C.; Moreira, C.; Seca, L.; Lopes, J.P. Coordinated management of distributed energy resources in electrical distribution systems. In Proceedings of the 2013 ISGT LA IEEE PES Conference on Innovative Smart Grid Technologies, Sao Paulo, Brazil, 15–17 April 2013; pp. 1–8. [Google Scholar]
- Prostejovsky, A.M.; Brosinsky, C.; Heussen, K.; Westermann, D.; Kreusel, J.; Marinelli, M. The future role of human operators in highly automated electric power systems. Electr. Power Syst. Res. 2019, 175, 105883. [Google Scholar] [CrossRef] [Green Version]
- National Academies of Sciences, Engineering, and Medicine. Enhancing the Resilience of the Nation’s Electricity System; The National Academies Press: Washington, DC, USA, 2017. [Google Scholar]
- Januario, F.; Carvalho, C.; Cardoso, A.; Gil, P. Security challenges in SCADA systems over Wireless Sensor and Actuator Networks. In Proceedings of the IEEE International Congress on Ultra Modern Telecommunications and Control Systems and Workshops, Lisbon, Portugal, 18–20 October 2016; Volume 2016, pp. 363–368. [Google Scholar]
- Giani, A.; Karsai, G.; Roosta, T.; Shah, A.; Sinopoli, B.; Wiley, J. A testbed for secure and robust SCADA systems. ACM SIGBED Rev. 2008, 5, 1–4. [Google Scholar] [CrossRef]
- Marzband, M.; Moghaddam, M.M.; Akorede, M.F.; Khomeyrani, G. Adaptive load shedding scheme for frequency stability enhancement in microgrids. Electr. Power Syst. Res. 2016, 140, 78–86. [Google Scholar] [CrossRef]
- Golari, M.; Fan, N.; Wang, J. Large-scale stochastic power grid islanding operations by line switching and controlled load shedding. Energy Syst. 2017, 8, 601–621. [Google Scholar] [CrossRef]
- Hare, J.; Shi, X.; Gupta, S.; Bazzi, A. A review of faults and fault diagnosis in micro-grids electrical energy infrastructure. In Proceedings of the 2014 ECCE IEEE Energy Conversion Congress and Exposition, Pittsburgh, PA, USA, 14–18 September 2014; pp. 3325–3332. [Google Scholar]
- Ferreira, E.F.; Barros, J.D. Faults Monitoring System in the Electric Power Grid with Scalability to Detect Natural/Environmental Catastrophes. Int. J. Therm. Environ. Eng. 2018, 16, 37–45. [Google Scholar] [CrossRef]
- Divya pradeepa, T. Fault Diagnosis on Distribution System Using PLC & SCADA. Int. J. Innov. Res. Sci. Eng. Technol. 2017, 6, 21393–21401. [Google Scholar]
- Leahy, K.; Gallagher, C.; O’Donovan, P.; Bruton, K.; O’Sullivan, D.T.J. A robust prescriptive framework and performance metric for diagnosing and predicting wind turbine faults based on SCADA and alarms data with case study. Energies 2018, 11, 1738. [Google Scholar] [CrossRef] [Green Version]
- Vidal, Y.; Pozo, F.; Tutivén, C. Wind turbine multi-fault detection and classification based on SCADA data. Energies 2018, 11, 3018. [Google Scholar] [CrossRef] [Green Version]
- Zhao, Y.; Li, D.; Dong, A.; Kang, D.; Lv, Q.; Shang, L. Fault prediction and diagnosis of wind turbine generators using SCADA data. Energies 2017, 10, 1210. [Google Scholar] [CrossRef] [Green Version]
- Xue, S.M.; Liu, C. Line-to-line fault analysis and location in a VSC-based low-voltage DC distribution network. Energies 2018, 11, 536. [Google Scholar]
- Baran, M.E.; Mahajan, N.R. Overcurrent Protection on Voltage-Source-Converter-Based Multiterminal DC Distribution Systems. IEEE Trans. Power Deliv. 2007, 22, 406–412. [Google Scholar] [CrossRef]
- Zhu, Y.; Zheng, T.; Wang, M.; Zhao, H.; Wang, X. An improved directional relay adapted to a distribution network with IIG integration. Energies 2019, 12, 3345. [Google Scholar] [CrossRef] [Green Version]
- Hatziargyriou, N. Microgrids-Architectures and Control; Wiley: Hoboken, NJ, USA, 2013; ISBN 9781118720677. [Google Scholar]
- Khodaei, A. Resiliency-Oriented Microgrid Optimal Scheduling. IEEE Trans. Smart Grid 2014, 5, 1–8. [Google Scholar] [CrossRef]
- Kelly-Pitou, K.M.; Ostroski, A.; Contino, B.; Grainger, B.; Kwasinski, A.; Reed, G. Microgrids and resilience: Using a systems approach to achieve climate adaptation and mitigation goals. Electr. J. 2017, 30, 23–31. [Google Scholar] [CrossRef]
- Peiravi, R.I.A. A fast Algortithm for intentional islanding of power systems using the multilevel Kernel k-means approach. J. Appl. Sci. 2009, 9, 2247–2255. [Google Scholar] [CrossRef]
- Brodzki, J.; Quirós-Tortós, J.; Bialek, J.; Sánchez-García, R.; Terzija, V. Constrained spectral clustering-based methodology for intentional controlled islanding of large-scale power systems. IET Gener. Transm. Distrib. 2015, 9, 31–42. [Google Scholar]
- Ding, L.; Gonzalez-Longatt, F.M.; Wall, P.; Terzija, V. Two-step spectral clustering controlled islanding algorithm. IEEE Trans. Power Syst. 2013, 28, 75–84. [Google Scholar] [CrossRef] [Green Version]
- Zeineldin, H.; El-Saadany, E.F.; Salama, M.M.A. Intentional islanding of distributed generation. IEEE Power Eng. Soc. Gen. Meet. 2005, 2005, 1–7. [Google Scholar]
- Kim, M.S.; Haider, R.; Cho, G.J.; Kim, C.H.; Won, C.Y.; Chai, J.S. Comprehensive review of islanding detection methods for distributed generation systems. Energies 2019, 12, 837. [Google Scholar] [CrossRef] [Green Version]
- Esmaeilian, A.; Kezunovic, M. Prevention of power grid blackouts using intentional islanding scheme. IEEE Trans. Ind. Appl. 2017, 53, 622–629. [Google Scholar] [CrossRef]
- Zhang, H.; Peng, M.; Wu, H.; Zhu, L.; Che, H.; Liu, Z. A strategy for intentional islanding of distribution networks based on node electrical relevance and artificial bee colony algorithm. IEEJ Trans. Electr. Electron. Eng. 2017, 13, 2501. [Google Scholar] [CrossRef]
- Kezunovic, M. Smart Fault Location for Smart Grids. IEEE Trans. Smart Grid 2011, 2, 11–22. [Google Scholar] [CrossRef]
- Mohammadi, P.; El-Kishyky, H.; Abdel-Akher, M.; Abdel-Salam, M. The impacts of distributed generation on fault detection and voltage profile in power distribution networks. In Proceedings of the IPMHVC 2014 IEEE International Power Modulator and High Voltage Conference, Santa Fe, NM, USA, 1–5 June 2014; pp. 191–196. [Google Scholar]
- Ates, Y.; Boynuegri, A.R.; Uzunoglu, M.; Nadar, A.; Yumurtacı, R.; Erdinc, O.; Paterakis, N.G.; Catalão, J.P.S. Adaptive protection scheme for a distribution system considering grid-connected and islanded modes of operation. Energies 2016, 9, 378. [Google Scholar] [CrossRef]
- Norshahrani, M.; Mokhlis, H.; Abu Bakar, A.; Jamian, J.; Sukumar, S. Progress on Protection Strategies to Mitigate the Impact of Renewable Distributed Generation on Distribution Systems. Energies 2017, 10, 1864. [Google Scholar] [CrossRef] [Green Version]
- Caramia, P.; Di Mambro, E.; Varilone, P.; Verde, P. Impact of distributed generation on the voltage sag performance of transmission systems. Energies 2017, 10, 959. [Google Scholar] [CrossRef] [Green Version]
- Torrent-Fontbona, F.; López, B. Decision support for grid-connected renewable energy generators planning. Energy 2016, 115, 577–590. [Google Scholar] [CrossRef]
- Chang, L.; Wu, Z. Performance and reliability of electrical power grids under cascading failures. Int. J. Electr. Power Energy Syst. 2011, 33, 1410–1419. [Google Scholar] [CrossRef]
- Cadini, F.; Agliardi, G.L.; Zio, E. A modeling and simulation framework for the reliability/availability assessment of a power transmission grid subject to cascading failures under extreme weather conditions. Appl. Energy 2017, 185, 267–279. [Google Scholar] [CrossRef] [Green Version]
- Sartori, I.; Napolitano, A.; Voss, K. Net zero energy buildings: A consistent definition framework. Energy Build. 2012, 48, 220–232. [Google Scholar] [CrossRef] [Green Version]
Figure 1.
Grid conditions associated with an extreme event, adapted from [44].
Figure 1.
Grid conditions associated with an extreme event, adapted from [44].
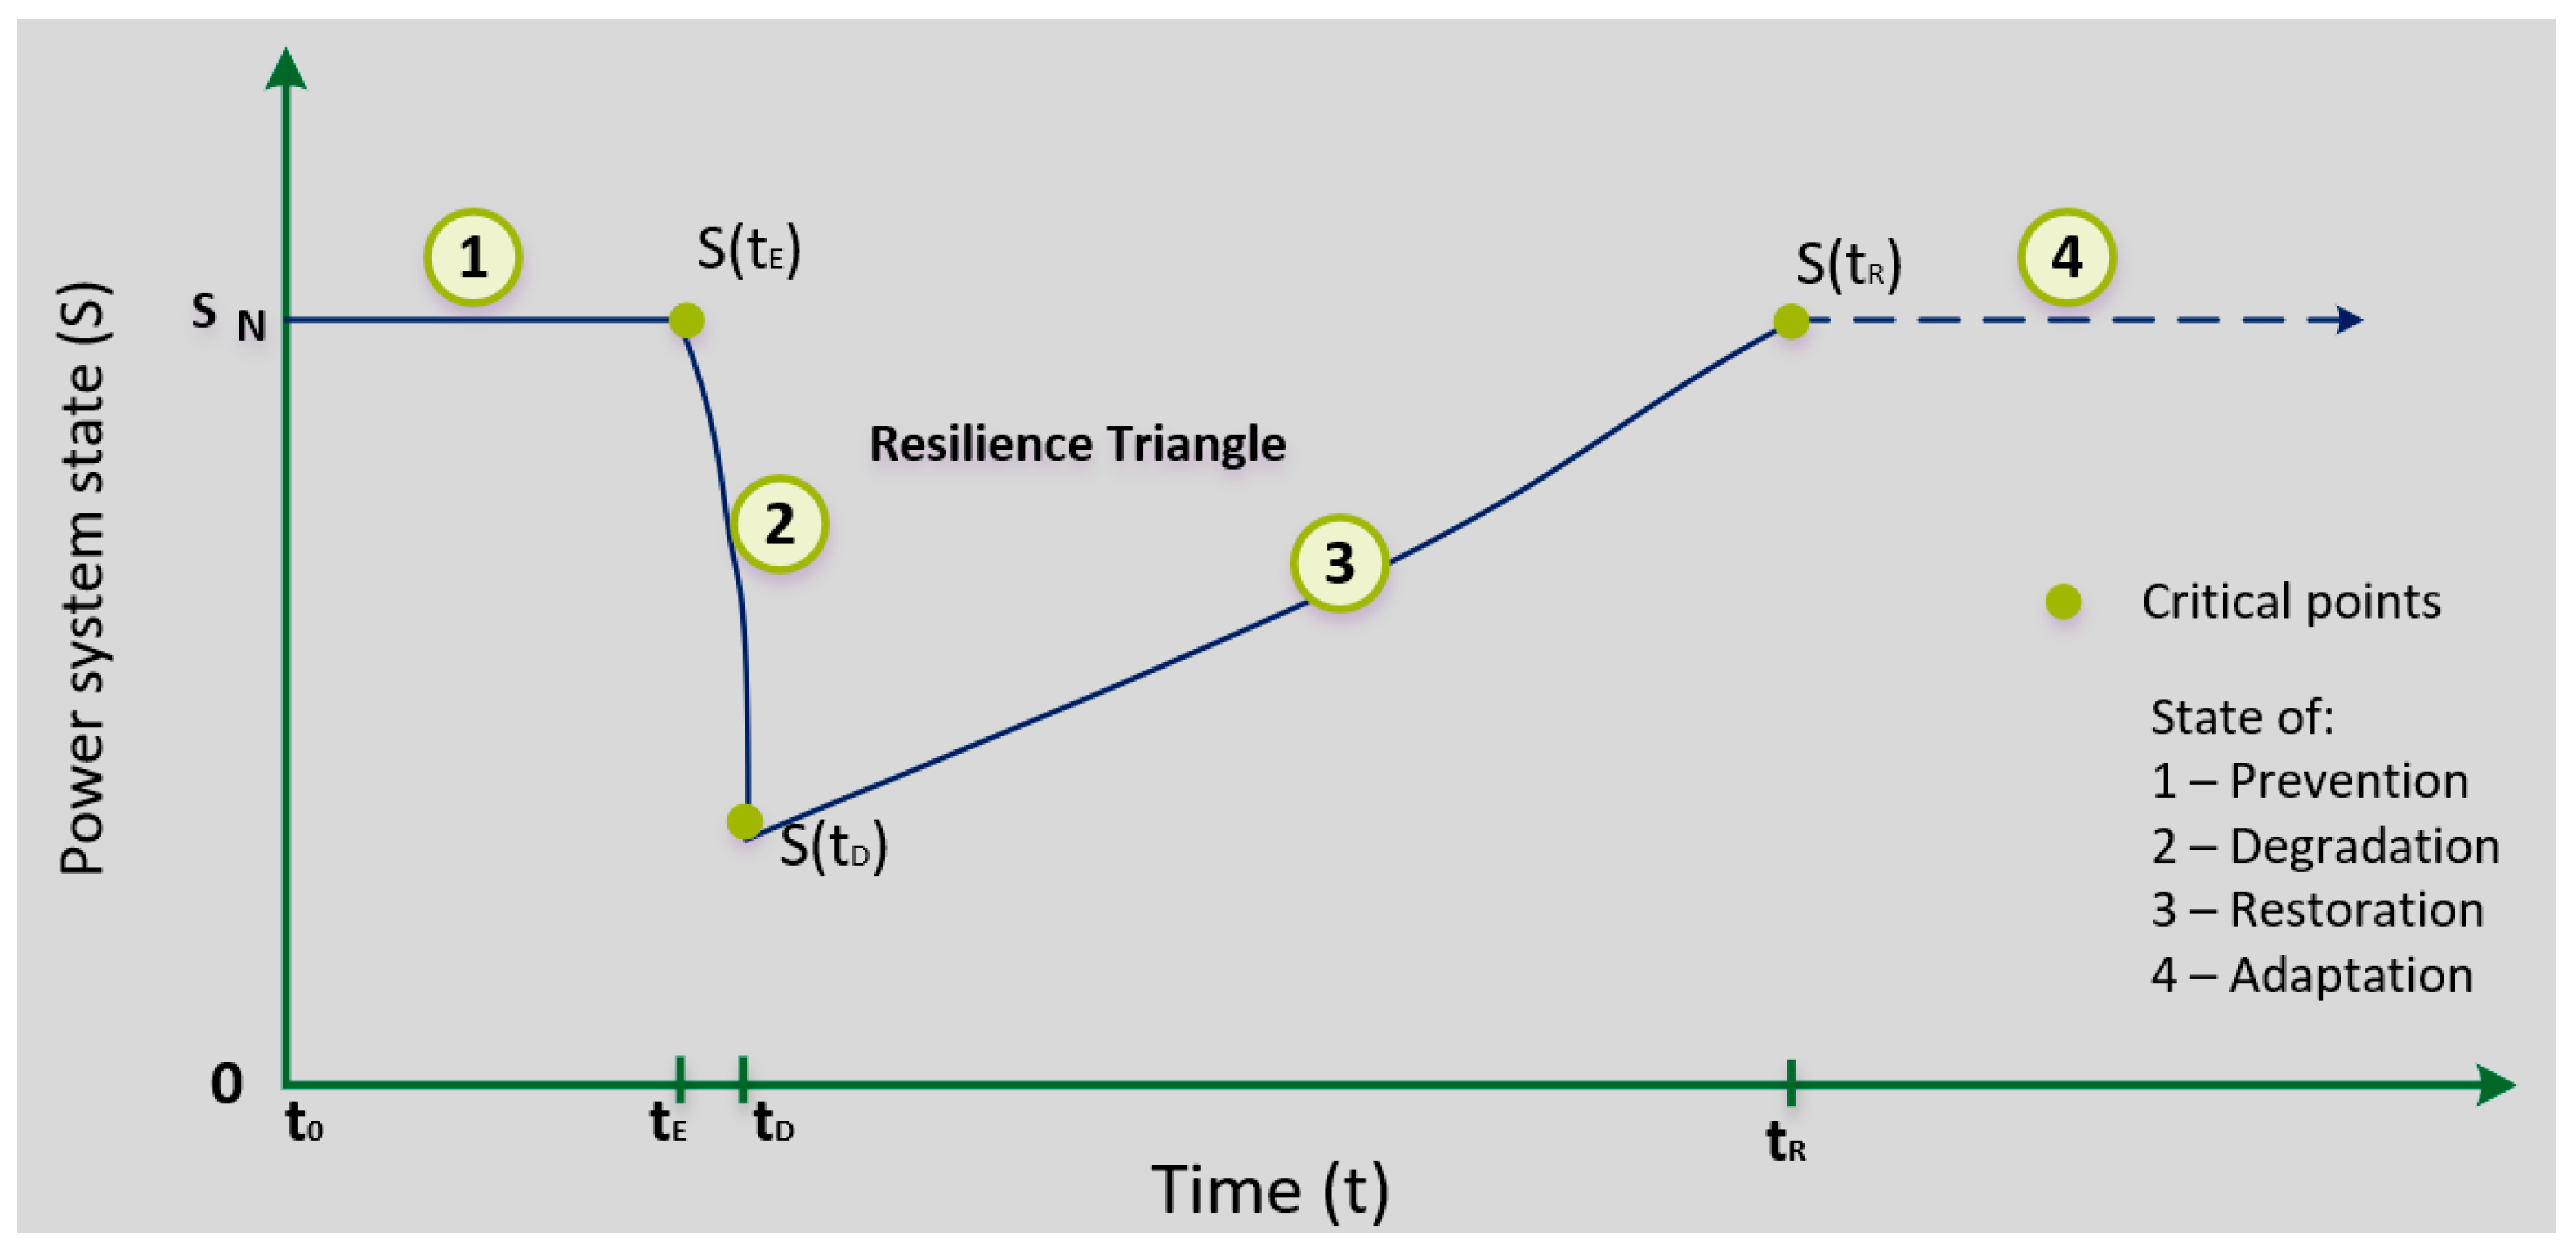

Figure 3.
Graphical relationship of EPG faults and causes.

Figure 4.
Close-up views of the causes/faults graph.
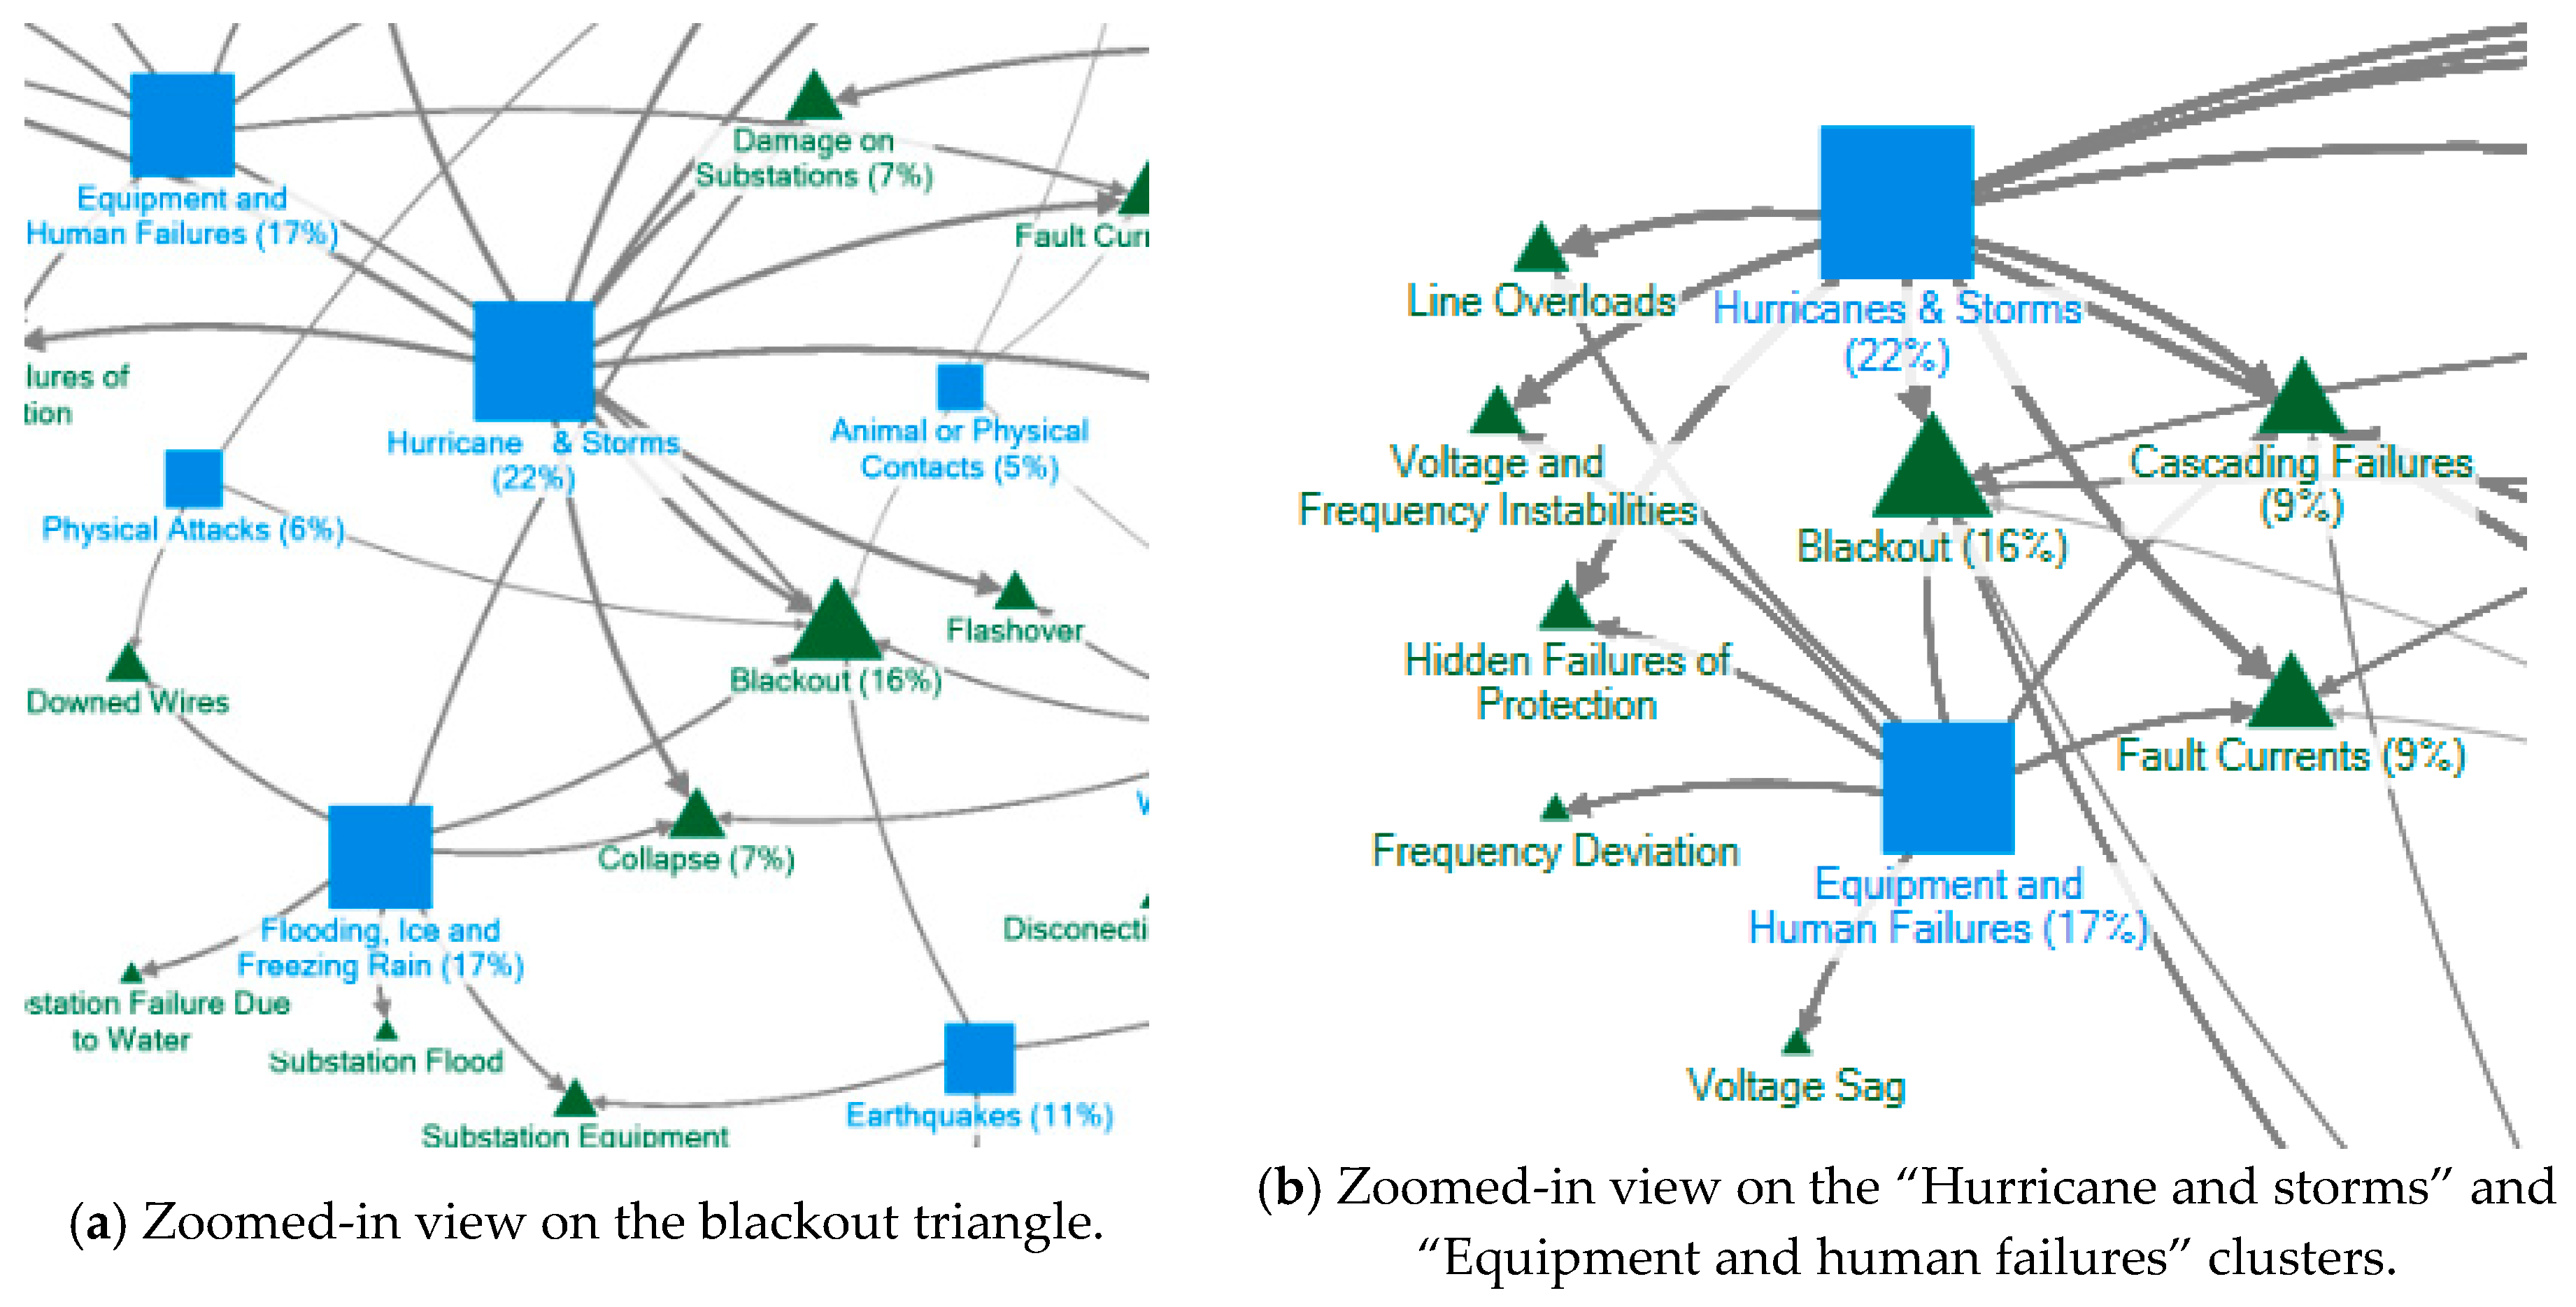
Figure 5.
Fault resolutions graph.
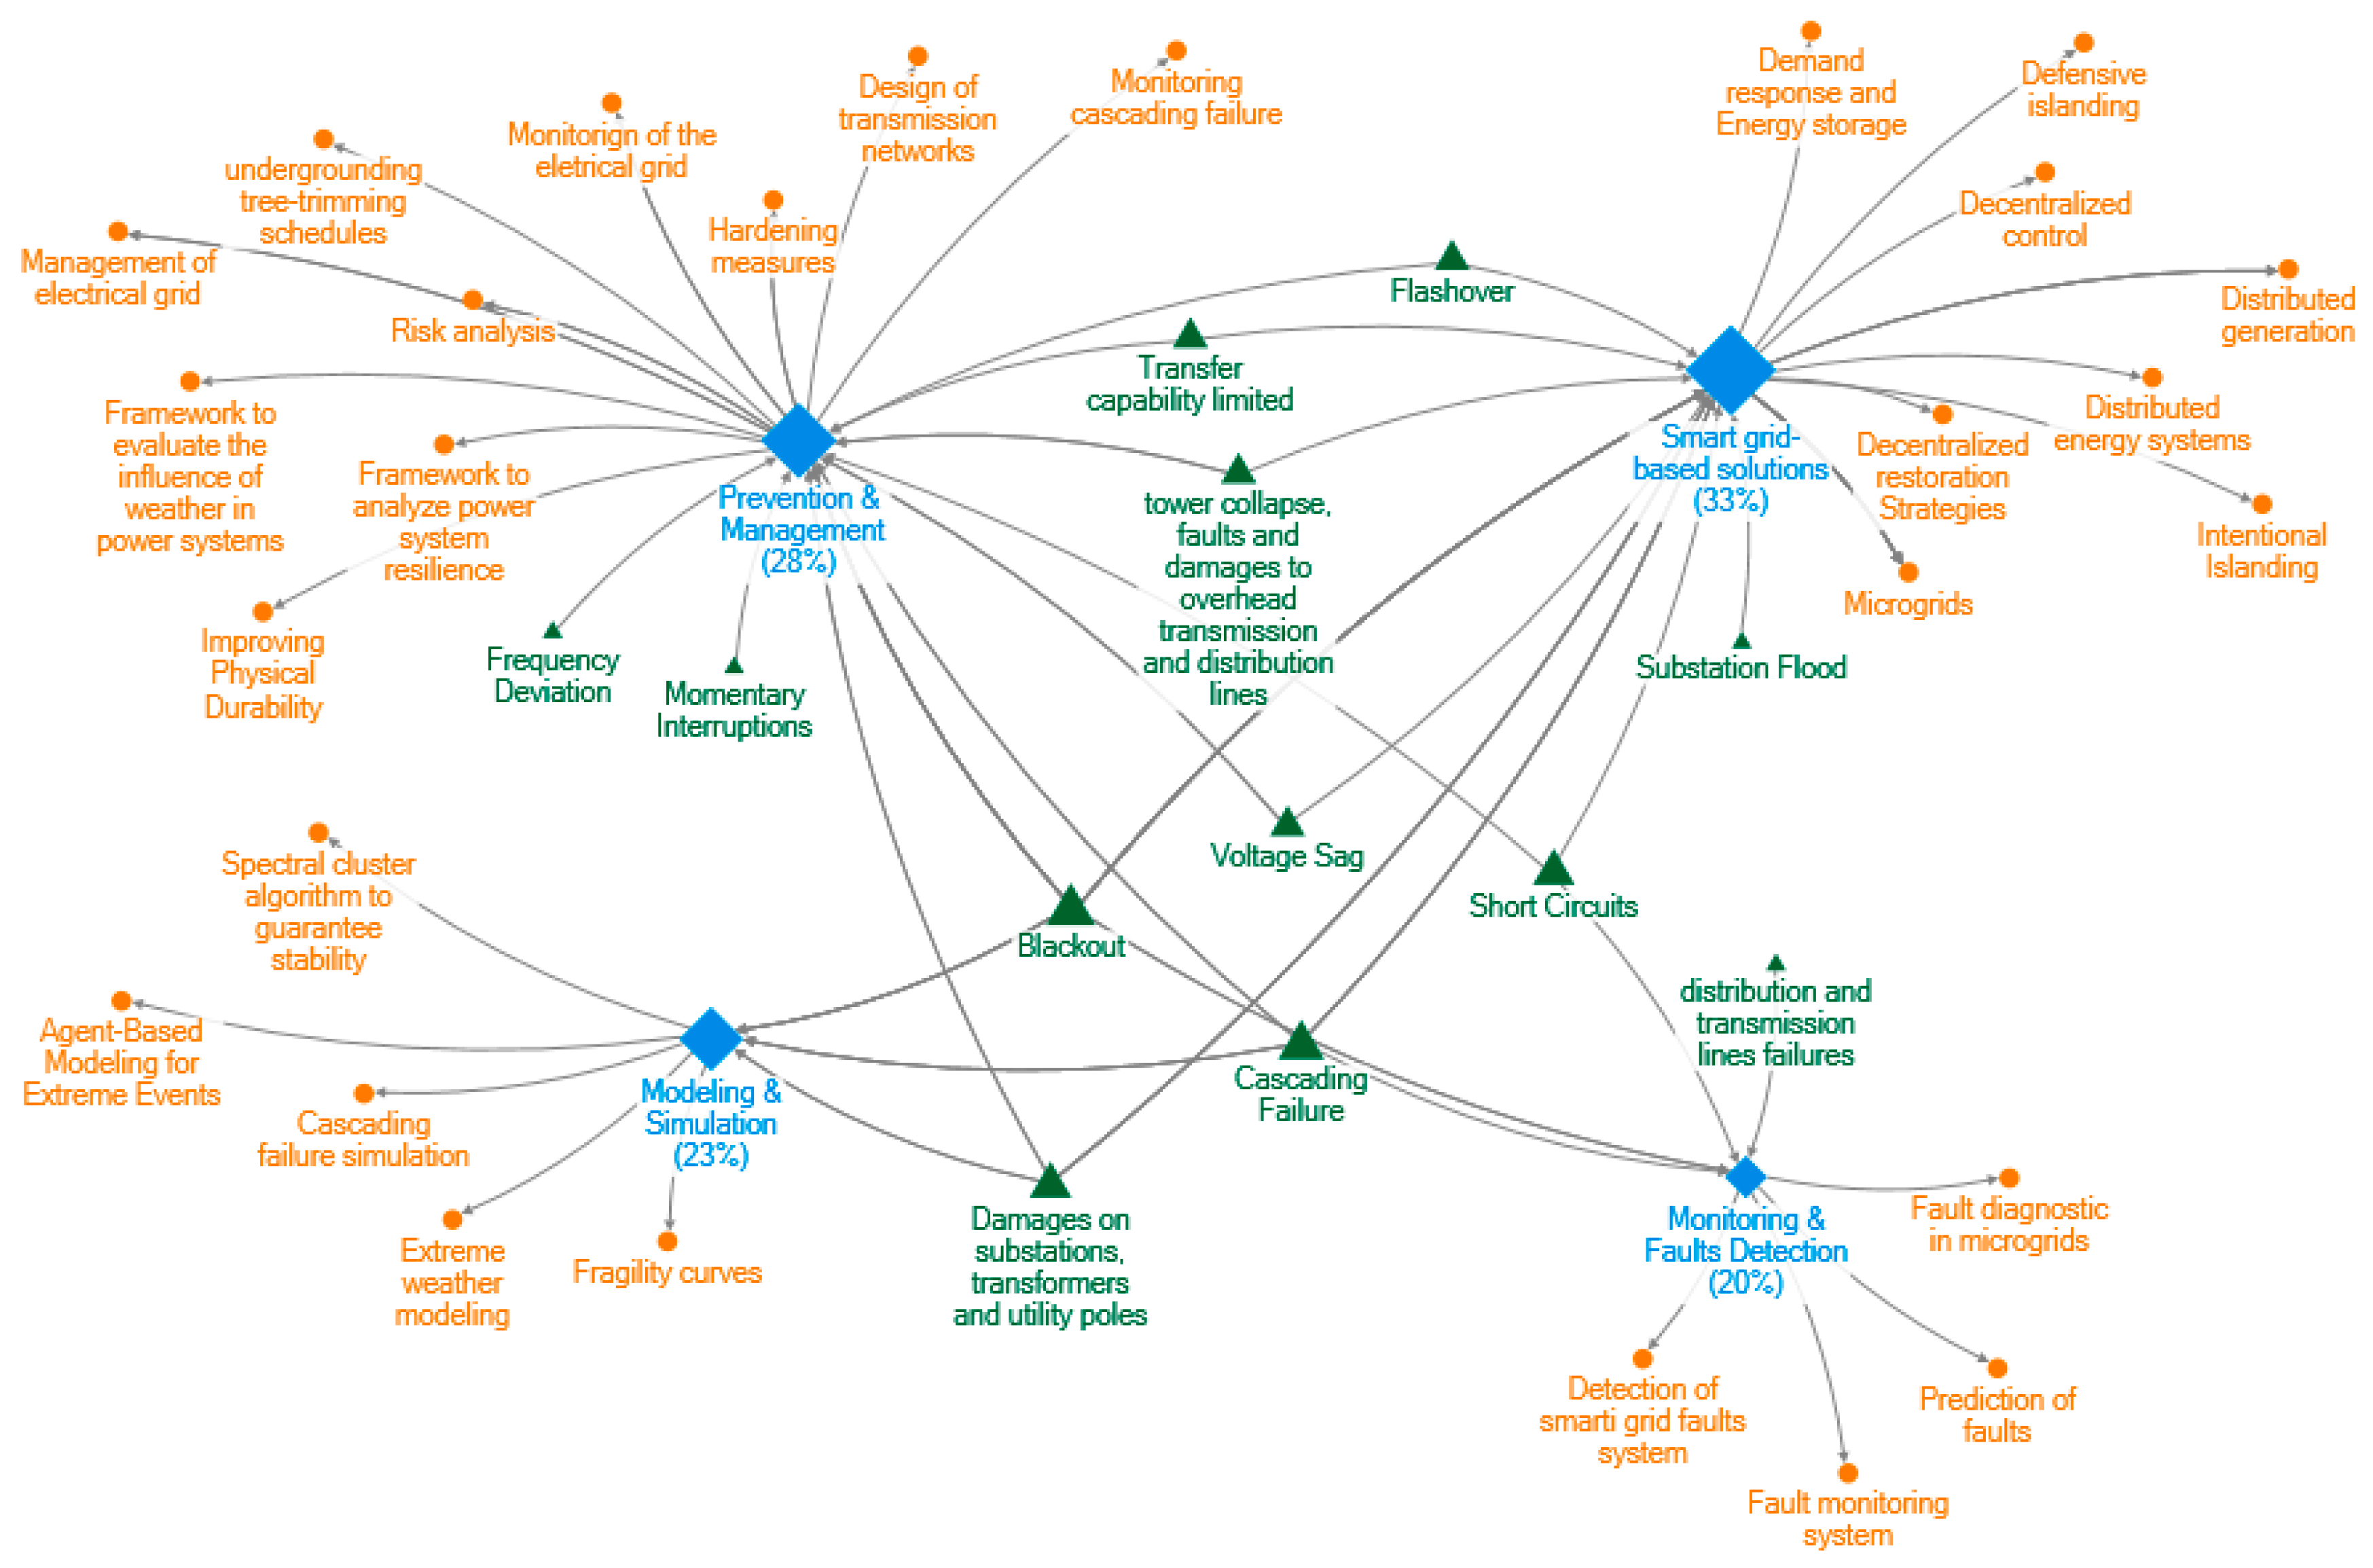
Figure 6.
Grid operator’s and customers’ points of view about microgrids.
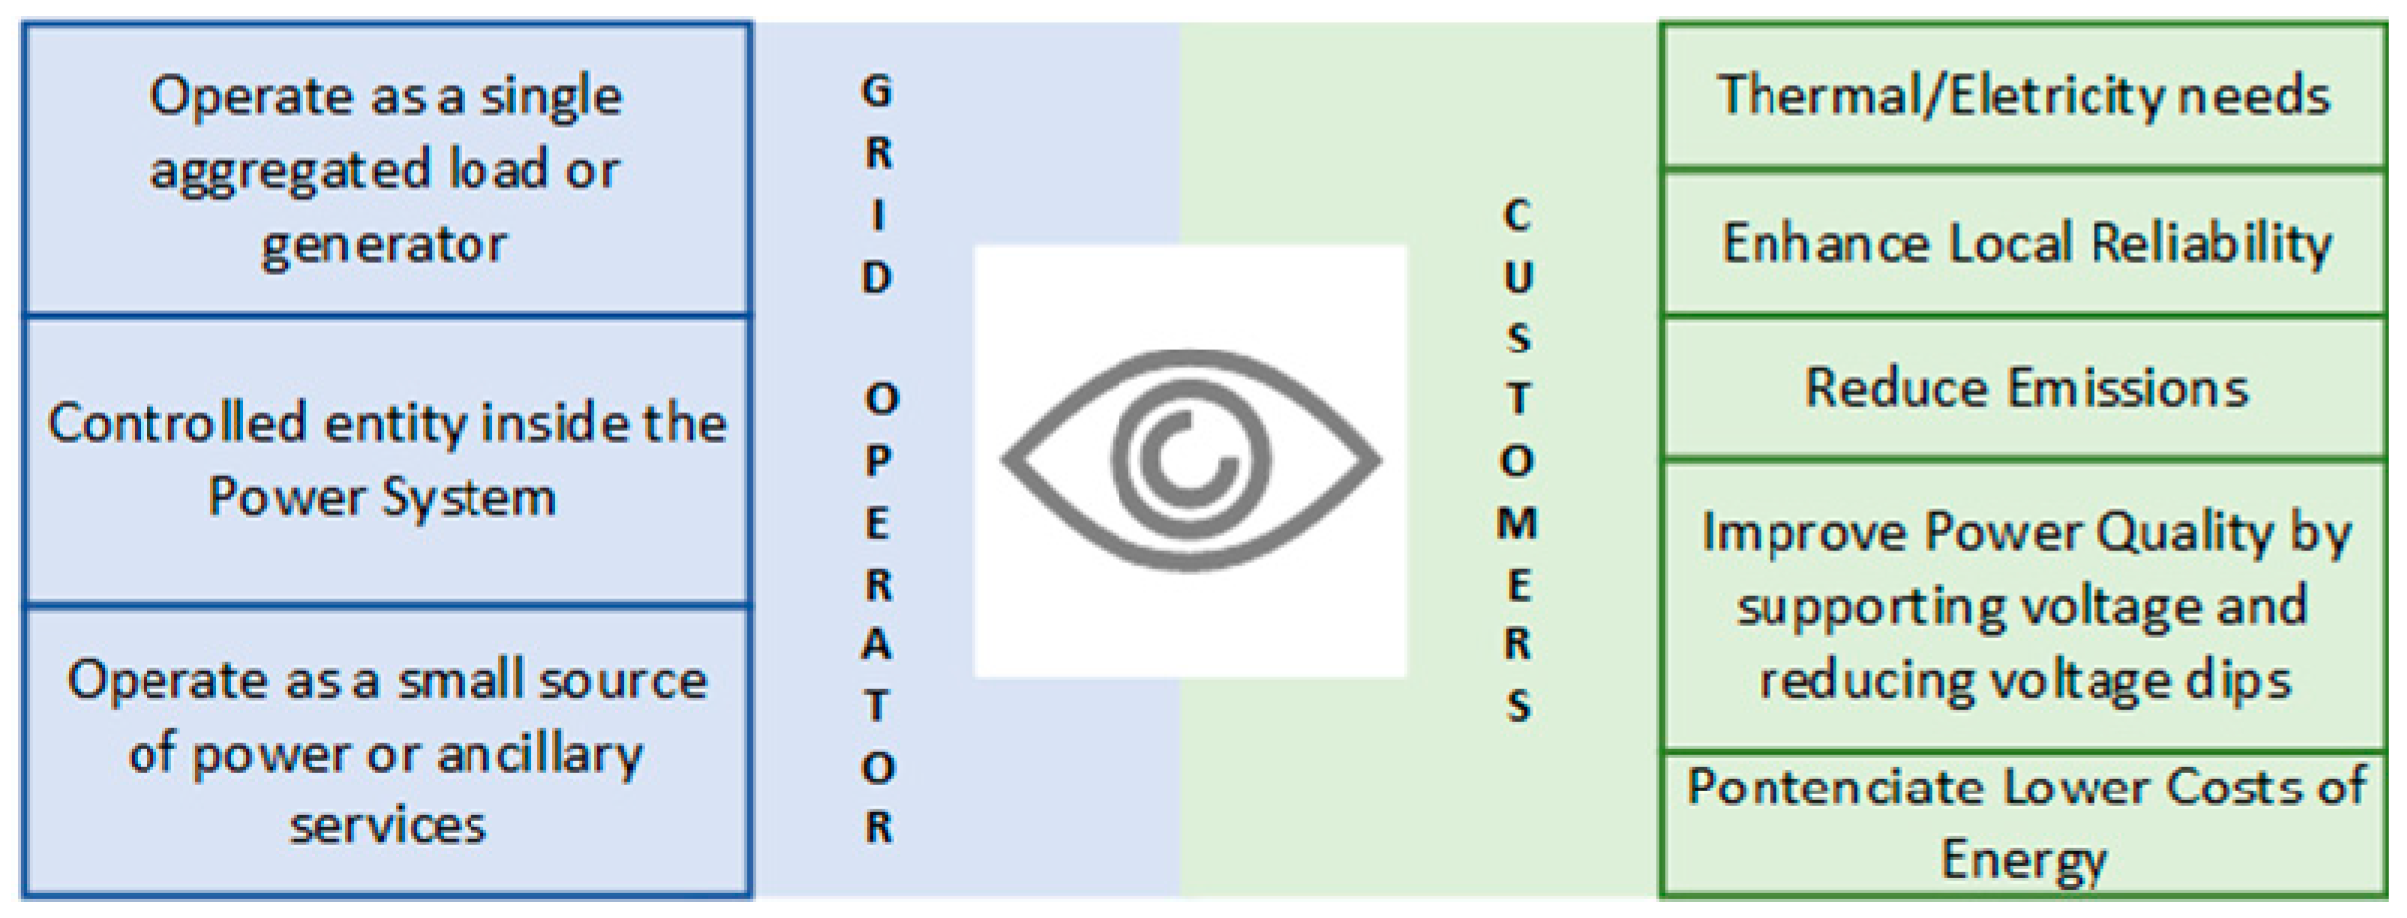
Figure 7.
Fault resolution clusters vs. resilience curve.
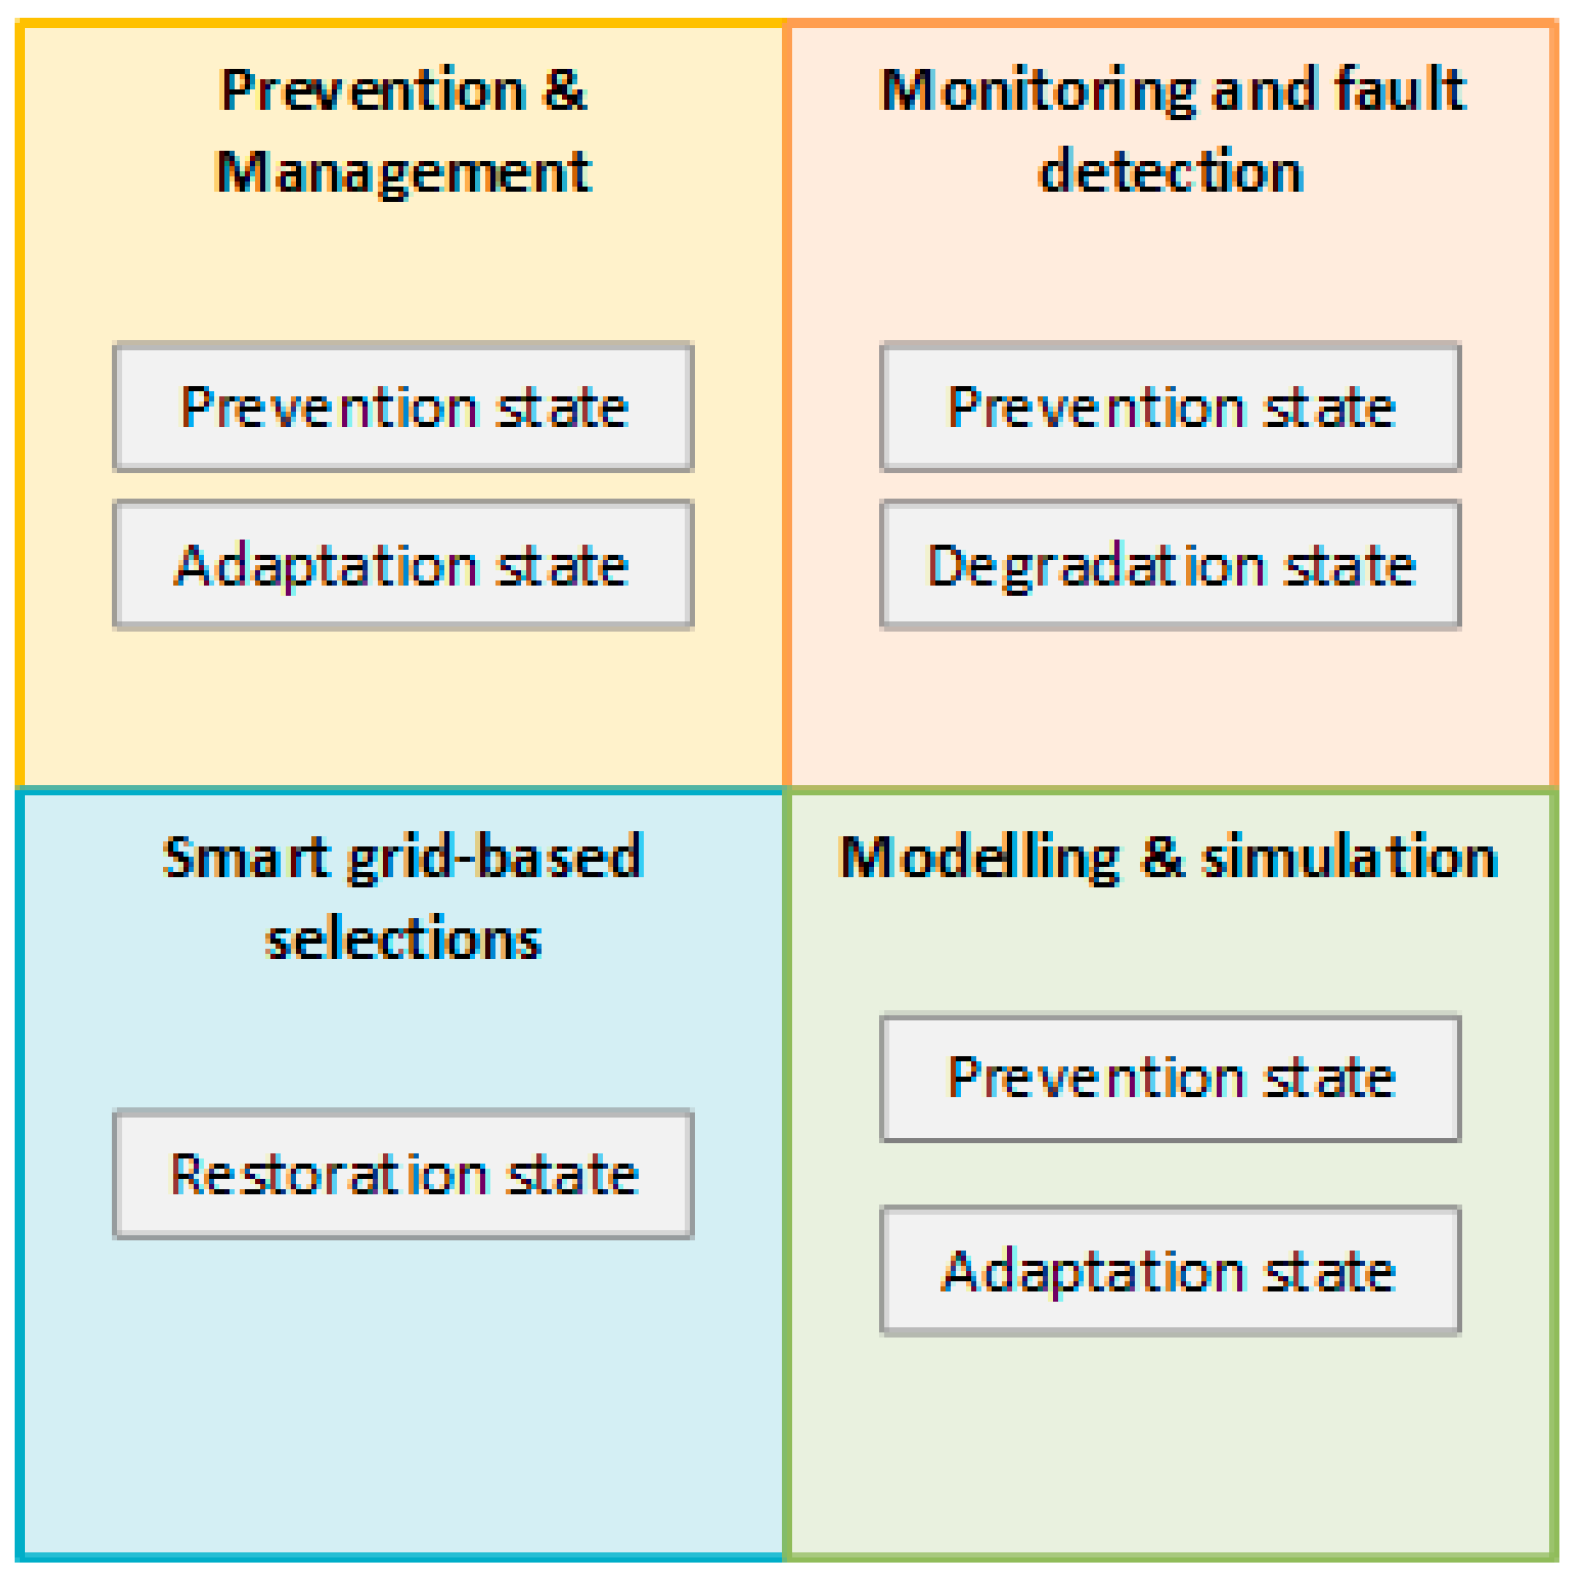
Figure 8.
Articles per year.

Figure 9.
Tendency curve of articles per year.


Table 1.
Faults reported in the literature.
| Causes | Faults | Refs |
|---|---|---|
| Natural Causes |
| [2,4,8,9,19,38,46,47,48,49,50,51,52,53,54,55,56,57,58,59,60,61,62,63,64,65,66,67,68,69] |
| ||
| ||
| ||
| ||
| ||
| ||
| ||
| ||
| ||
| ||
| ||
| ||
| ||
| ||
| ||
| ||
| ||
| ||
| ||
| ||
| ||
| Errors |
| [2,7,18,48,49,66,67,70,71,72,73,74,75] |
| ||
| ||
| ||
| ||
| ||
| ||
| ||
| ||
| Attacks |
| [1,2,9,18,57,62,66,67,76,77,78,79,80,81,82,83,84,85] |
| ||
| ||
| ||
| ||
|
© 2019 by the authors. Licensee MDPI, Basel, Switzerland. This article is an open access article distributed under the terms and conditions of the Creative Commons Attribution (CC BY) license (http://creativecommons.org/licenses/by/4.0/).
Share and Cite
MDPI and ACS Style
Mar, A.; Pereira, P.; F. Martins, J. A Survey on Power Grid Faults and Their Origins: A Contribution to Improving Power Grid Resilience. Energies 2019, 12, 4667. https://doi.org/10.3390/en12244667
AMA Style
Mar A, Pereira P, F. Martins J. A Survey on Power Grid Faults and Their Origins: A Contribution to Improving Power Grid Resilience. Energies. 2019; 12(24):4667. https://doi.org/10.3390/en12244667
Chicago/Turabian StyleMar, Adriana, Pedro Pereira, and João F. Martins. 2019. "A Survey on Power Grid Faults and Their Origins: A Contribution to Improving Power Grid Resilience" Energies 12, no. 24: 4667. https://doi.org/10.3390/en12244667
Note that from the first issue of 2016, this journal uses article numbers instead of page numbers. See further details here.