Abstract
To further promote market competition, enrich trading varieties, alleviate information asymmetry, and improve trading efficiency during electricity market reform in China, the continuous bidirectional transaction (CBT) was designed and applied in the Yunnan electricity market (YNEM), which is dominated by medium- and long-term power energy trading. The clearing model for the CBT with the goal of maximum social welfare is proposed in two bidding stages, including call auction (CA) and continuous double auction (CDA). Correspondingly, the integrated two-stage market clearing algorithm is also introduced to ensure the data consistency and business continuity. Finally, the analysis of the practical application shows that the proposed model, algorithm, and various key implementation strategies of the trading platform support the bidding and clearing of the CBT well. In addition, the research and application of CBT may also provide valuable insights for other electricity market construction.
1. Introduction
Over the last few decades, the installed power-generation capacity of China has exploded, especially for hydropower capacity, increasing from 20 GW in 1980 to 352 GW in 2018 [1,2]. However, wasted hydropower is often associated with the rapid deployment of hydropower because of a lack of energy planning, delayed construction of power grid, and multiple interest game [3]. According to official statistics, wasted hydropower exceeded 28.7 terawatt hours (TWh) and 31 TWh, respectively, in Sichuan and Yunnan in 2016 [4], which are the two hydropower-dominated power grids. This is a very serious problem and also partly motivated the electricity market reform. Therefore, the “Opinions on Further Deepening the Reform of the Electric Power Systems: Document No. 9” was promulgated in March 2015 by the State Council and the Central Committee of the Communist Party [5].
Since the new round of electricity market reform in 2015, various regions and provinces in China have created medium- and long-term electricity markets, and a great deal of progress has been made. Two regional trading centers in Beijing and Guangzhou, as well as provincial trading centers in each province, have been set up to handle cross-provincial, cross-regional, and intra-provincial transactions. From the perspective of the whole country, the market reform has been deepened year by year due to positive factors, such as diversified market entities, rich trading varieties, and diversified market services. In 2018, the total amount of electricity traded (including the generation rights traded) in the national electricity market was 2065.4 billion kilowatt hours, up 26.5% from the previous year. The proportion of electricity traded in the market was 30.2% of the total electricity consumed by the whole society, 4.3 percentage points higher than in the previous year. The proportion of electricity traded in the market was 37.1% of the electricity sold by power grid enterprises [6].
Yunnan Province, as one of the first batches of comprehensive pilot provinces of electricity market reform, has always been in the forefront of domestic electricity market reform. After several years implementing successful operations, much progress has been made in, for instance, the market scale, the market supervision and the trading mechanism. By the end of December 2018, a total of 7662 market entities had completed registration and gained access. This scale is three times that of the initial stage of the Yunnan electricity market (YNEM). In 2018, more than 85 billion kilowatt-hours of electricity were traded in the provincial market, an increase of more than 21% from the previous year. Among this electricity, the proportion of clean energy trading electricity accounted for more than 97%, ranking highest in the country. Trading electricity accounted for more than 62% of the electricity sold in the Yunnan power grid (YNPG) [7]. This increase in electricity trading volume indicates an increase in market demand, which promotes the reduction of hydropower curtailment to a certain extent. In addition, medium- and long-term trading mechanisms are becoming increasingly mature, and trading varieties are abundant, providing diversified choices for market players [8]. As a pioneer in the new round of electricity market reform in China, the newly reformed YNEM has achieved initial results, where an increasingly mature, efficient, and fair electric power trading market has been gradually established, which provides valuable experience for the construction of electricity markets in other provinces.
The market operators of the YNEM have been committed to enriching the construction of the trading mechanism. To further promote market competition, enrich trading varieties, alleviate information asymmetry, and improve trading efficiency, the continuous bidirectional transaction (CBT) was designed and applied in the YNEM in 2018 [9], which is characterized by a sequential two-stage bidding process with real-time market information disclosure that integrates call auction (CA) and continuous double auction (CDA) [10,11]. The CBT is quite different from the original trading methods in the YNEM. How to design and implement CBT business, such as bidding and market clearing, is a problem worth studying.
Research on electricity trading mechanisms attracts much attention. Many experts and scholars have done a great deal of work on this topic [12]. On the one hand, game theory, auction theory, and other mechanism design theories are widely used in power market design. Using game theory, Carlos Silva et al. designed a new mechanism. In the deregulated environment, efficiency (economic dispatch) can be achieved despite the information barrier of effective distribution of power production [13]. Based on the theory of signal game, Liu Z et al. took the degree of information interference as an important factor to evaluate the bidding mechanism and put forward a semi-random matching (GSM) incentive bidding mechanism [14]. In order to alleviate the market power of participants and improve the social welfare of the power market, Xiaoyan Zou took the social welfare contribution of each participant as the key factor of market clearing, payment and settlement, and transaction matching rules, and proposed a new double-sided auction mechanism [15]. Under the condition of satisfying the characteristics of mechanism design theory of individual rationality, incentive compatibility and payment cost minimization, Zou P et al. analyzed, derived and designed a customized pool-based market mechanism by using the economic mechanism design theory [16]. In order to institutionally stabilize the market, Chen Zhang and Wei Yan restricted the abuse of market power by restricting the arbitrage opportunities generated by multiple markets and developed a mechanism [17]. In order to realize the long-term stability of electricity price in the day-ahead electricity market [18,19,20], Ying Yu et al. designed an incentive contract menu. In the framework of a one-leader and multi-follower game, a bilevel Stackelberg game model was also proposed to find the optimal incentive mechanism [21]. On the other hand, with the development of power system, the design of power market in the environment of rapid penetration of renewable energy and distributed energy is also concerned [22]. Agalgaonkar et al. examined placement and penetration level of the distributed generations under the standard market design (SMD) framework [23]. Based on the indirect mechanism design framework, Khazaei and Zhao aggregated renewable energy power generation companies in a two-settlement electricity market and designed the revenue distribution mechanism by solving the competitive equilibrium of the special market with transferable revenue [24]. Liu et al. discussed P2P power trading mechanisms based on auction and bilateral contract and analyzed their effectiveness in the future power distribution system, to reasonably manage power trading between users [25]. To develop strategies for the integration of prosumers into competitive electricity markets, Parag and Sovacool identified and discussed three potential retail markets related to the integration of retail power grid, peer-to-peer models, and retail community groups [26]. Relying on blockchain and CDA mechanism, Wang et al. proposed a decentralized electricity transaction mode for microgrids [27]. Mengelkamp et al. derived seven market components as a framework to build an efficient microgrid energy market [28].
Although there are a lot of studies on market mechanism, its literature and real application on integrated CA and CDA in the electricity market, which is dominated by medium- and long-term power energy trading, are relatively less. This paper aims to research and design the CBT and put it into operation in YNEM. To this end, the clearing model with the goal of maximum social welfare for the CBT is proposed, which is the theoretical basis of market clearing based on CBT trading rules. Correspondingly, based on the difference and connection analysis of the two stages, the design of a two-stage integrated market clearing algorithm to ensure the data consistency and business continuity is also introduced. Moreover, the practical experiences in implementing the CBT-based electricity trading platform (CETP) are described. Finally, the practical application is analyzed, and the CBT mechanism, clearing model, algorithm, and platform construction experience mentioned in this paper may provide valuable insight for other power market constructions.
The rest of the paper is structured as follows. In Section 2, the continuous bidirectional transaction of the YNEM is briefly introduced. The two-stage integrated clearing model of the CBT is proposed in Section 3. Section 4 illustrates the design of the market-clearing algorithm of the CBT. Section 5 presents the architecture and some implementation strategies adopted in the CETP. The practical application of the CBT based on the CETP in the YNEM is shown in Section 6. Finally, conclusions are drawn in Section 7.
2. Organization of Continuous Bidirectional Trading Mechanism
Unlike the major electricity markets operated by Pennsylvania-New Jersey-Maryland(PJM), California Independent System Operator (CAISO), and Electric Reliability Council of Texas (ERCOT) in North America [29,30,31], British Electricity Trading and Transmission Arrangements (BETTA) in Great Britain [32] and Nord Pool Spot in Nordic Europe [33], the YNEM is dominated by medium- and long-term electrical energy transactions briefly described in Figure 1. Moreover, all trading contracts require physical delivery, which means that the final transaction results need to be checked by YNPG [34]. The continuous bidirectional transaction (CBT) is new to the YNEM; it was introduced in the beginning of 2018, and currently, this bidding scheme is applied to the monthly market, where electricity consumers and producers submit a set of price-volume pairs, indicating their willingness to buy and sell electricity for the next operating month [9]. The CBT, together with the original bilateral transaction and matching transaction, constitute the main transaction varieties in the monthly market.
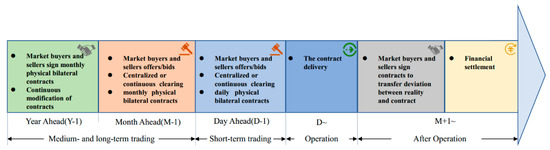
Figure 1.
Process of the medium- and long-term electrical energy transactions in the Yunnan electricity market (YNEM).
The CBT is a multistage double auction with numerous buyers and sellers, where the following rules are applied:
- It is a two-stage double auction online.
- The first stage includes a call auction (CA), i.e., a one-shot game, where buyers and sellers submit sealed bids with discrete price–quantity combinations, which state the amount of energy that the company is pleased to sell or buy at specified prices.
- During the first stage, the sellers cannot obtain the buyer’s demand curves. In the same way, sellers’ supply curves are not available to the buyers. All market participants can bid or cancel a bid until the time is up. After the closure of this stage, the submitted seller and buyer bids are aggregated, resulting in the first-stage unconstrained results by the CETP of Kunming Power Exchange (KMPEX). The results include the market clearing prices (MCPs) of this stage and bid matchings according to the submitted bids [35]. Orders with remaining unmatched volume will enter the second stage first with the same timestamp.
- The second stage consists of a continuous double auction (CDA) [36]. Participants use the CETP to advertise offers to sell or bids to buy energy. In such a computerized marketplace, all participants can observe the quantity and price submitted by other parties, but they cannot learn the identity of any party who submits an order. When a party enters a new bid, the CETP checks whether there is a matching offer within the bid-delivery period. If it finds that the differences of prices (DOP) between the buyer’s and the seller’s bids is not negative, the transaction is automatically concluded, and the price and quantity are displayed for all participants to view. Otherwise, the unmatched new bid is added to the list of uncompleted bids and will remain until a transaction can be concluded or until the bid is withdrawn. A similar procedure occurs each time a new bid is entered into the system [37].
- Since the auction is calculated in a sequential machine, the bidding information is registered in time-sharing. Therefore, even if two bids are submitted at exactly same time, they are registered in order, which is determined by chance [38].
- If no time is left in the second period, the auction is finished. Here, the total unconstrained results are submitted to YNPG for security checks, which take into account the technical requirements, such as spatial–temporal coupling among reservoirs, line congestion on both the buyer and seller side, and the risk of water spillage, rather than economic factors, such as price or cost. For instance, when the transmission line is blocked, the power generation needs to be curtailed according to the capacity, which means that power generation is substantially controlled by the grid [39].
- The results of the security check are returned to KMPEX in the form of the caps of the power generation, which KMPEX regards as constraints to the final bid clearing. Then, the final constraint results will be part of the monthly transaction contracts [40].
The organizational process of the CBT is shown in Figure 2. The regular schedule of each stage listed in the figure may be adjusted and disclosed to market participants before the transaction is actually carried out.
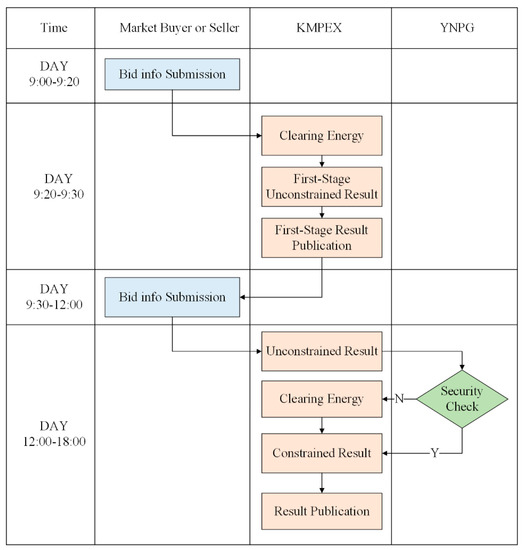
Figure 2.
Flowchart of the continuous bidirectional transaction (CBT).
3. Two-Stage Clearing Model of the CBT
In this paper, the expected total revenue of buyers and sellers is regarded as the whole social welfare (also denoted as ‘surplus’) from the auction [15,35,41]. The CBT is also an auction mechanism maximizing the whole social welfare, which is equivalent to maximizing the expected total revenue of sellers and buyers under the following restrictions. The market-clearing model for the CBT can be described as follows.
3.1. Call Auction Stage
Objective function—the social welfare of the call auction stage can be expressed as follows:
where and represent the index and set of market buyers, respectively; and represent the index and set of market sellers; (yuan/kWh) represents the bid price of market buyer ; (yuan/kWh) represents the deal price of market buyer with market seller ; (kWh) represents the energy cleared of market buyer with market seller ; (yuan/kWh) represents the bid price of market seller ; (yuan/kWh) represents the deal price of market seller with market buyer ; (kWh) represents the energy cleared of market seller with market buyer ; and (yuan) represents the social welfare of the call auction stage.
All the constraints are given by the KMPEX before the bidding. The constraints faced by the call auction stage include bidding constraints and clearing constraints.
Market bidding constraints are defined as follows:
where (kWh) represents the quantity caps of buyer bid; (kWh) represents the quantity caps of seller bid; and (yuan/kWh) and (yuan/kWh) represent the lower and upper bounds of the bid price of buyer and seller , respectively.
Market clearing constraints are defined as follows:
Equation (4) indicates that the accumulated transaction quantity does not surpass the bid quantity. Equation (5) is the power balance constraint, which represents that the total amount of electricity traded between buyers and sellers is balanced. In Equation (6), the lower bound takes nonnegative values for and , which means that transfers of electricity between buyers or between sellers are not allowed in this transaction.
All sellers () and buyers () are paired into pairs, and the DOP of pairs are calculated by Equation (7), where represents the DOP between marker buyer and marker seller , which is not negative to meet the transaction conditions. and represents the buying and selling prices for the financial settlement of each pair, respectively, which are determined according to a modified pay-as-bid (PAB) principle that adjusts the effective prices through their DOP [4].
3.2. Continuous Auction Stage
In the continuous stage, every pair matched successfully is recorded as one round. That is, there is only one matching pair of trades per round.
Objective function—the social welfare of the continuous auction stage can be expressed as follows:
where , represents the index and set of trade rounds during the second stage (continuous double auction); (yuan/kWh) represents the bid price of market buyer in the round ; (yuan/kWh) represents the deal price of market buyer with market seller in the round ; (kWh) represents the energy cleared of market buyer with market seller in the round ; (yuan/kWh) represents the bid price of market seller j in the round ; (yuan/kWh) represents the deal price of market seller with market buyer in the round ; (kWh) represents the energy cleared of market seller with market buyer in the round ; and (yuan) represents the social welfare of the second stage.
Market bidding constraints are defined as follows:
where represents the bid quantity caps of buyer in the round ; represents the bid quantity caps of seller in the round ; Equation (10) explains that how to calculate the bid quantity constraint value of the round .
Market clearing constraints are defined as follows:
Equation (12) indicates that the accumulated transaction quantity must be less than their bid quantity in the per round. Equation (13) represents that the total amount of electricity traded between buyers and sellers is balanced. In Equation (14), the lower bound takes nonnegative values for and , which means that transfers of electricity between buyers or between sellers are not allowed in this transaction. The clearing price mechanism is illustrated in Equation (15). represents the DOP between marker buyer and marker seller in the round , and are the buying and selling prices for the financial settlement of each pair, respectively.
4. Two-Stage Integrated Clearing Algorithm
As mentioned above, the CBT includes a bidding process that integrates CA and CDA. In order to better design a two-stage integrated market clearing algorithm, it is necessary to analyze its main differences and connections.
Connections: After the market clearing of the first stage, the orders with remaining unmatched volume will be directly included in the second stage, at the same time as the earliest bidding information in the second stage.
Differences: The market clearing takes place only once after all the biddings are collected in the first stage, and the bidding and clearing are obviously sequential; the market clearing is real-time in the second stage, and once the transaction conditions are met, the matching will be carried out. The real-time market-clearing couples the continuous bidding and clearing together.
To ensure the data consistency and business continuity in an efficient way, based on the above analysis, a two-stage integrated market-clearing algorithm is designed. The algorithm used to solve the whole problem is represented by the flowchart in Figure 3. The main steps involved in the algorithm implementation are described as follows.
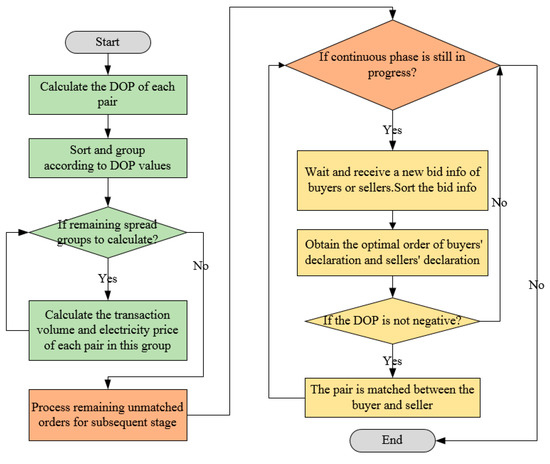
Figure 3.
Flowchart of the algorithm.
- Step 1: pair each buyer and seller, and the DOPs are calculated for all matching pairs.
- Step 2: these pairs are then sorted in descending order based on DOP values. Obviously, a pair with a negative DOP value will not be contracted. The same DOP pairs are divided into a group.
- Step 3: start with the group with the largest DOP. If there are any remaining spread groups to calculate, proceed to the next step; otherwise, the market clearing of the first phase is over, so move on to Step 5.
- Step 4: the total transaction amount of this group is the smaller value of the quantity declared by all the buyers and the quantity declared by all the sellers in this group. Then, the transaction quantity of each pair is allocated according to the bid quantity in this group. The prices are given by Equation (7), which is mentioned above. After the contract is formed, move on to step 3.
- Step 5: orders with remaining unmatched volume are marked with the same timestamp and grouped by price. After entering the second stage, each group is listed as a new order at the earliest time.
- Step 6: if the continuous phase is still in progress, then enter the next step; otherwise, the market clearing in the second phase is over.
- Step 7: wait and receive new bid info of buyers or sellers. All buyer bids are sorted according to bid-price values in descending order, while seller bids are sorted in ascending order. Once the bid price between buyers or between sellers is the same, it shall be sorted according to the principle of early declaration priority.
- Step 8: obtain the optimal order of buyers’ declaration and sellers’ declaration, and calculate the DOP between buyers’ and sellers’ bids.
- Step 9: if the DOP is not negative, go to the next step; otherwise, move on to step 6.
- Step 10: the pair is matched between the buyer and seller, whose transaction amount is the smaller value of the quantity declared by the buyer and the quantity declared by the seller. The buyer price and seller price are given by Equation (15), which is mentioned above. After the contract is formed, move on to step 6.
5. CBT-Based Electricity Trading Platform
As the software application platform for the CBT in the YNEM, the CETP mainly serves market participants and the market operators. The former need to submit a set of price-volume bids through the CETP to obtain the electricity contracts. The latter is responsible for matching the electricity bids submitted by buyers and sellers and for determining the prices and quantities of the energy traded in the market, which needs to be completed through the CETP.
The framework of the CETP and some key implementation strategies adopted in the system are described below.
5.1. The Overall Architecture of CETP
The conceptual framework of the CETP is demonstrated in Figure 4, employing a multitier architecture: client-side application (presentation tier); application server cluster (application tier); and database cluster (data tier) [42]. In the overall deployment, the responsibilities of each tier are different, and each tier can have one or more components. It should be noted that these tiers may not correspond to the physical distribution and are purely abstract. The components that handle the user interface and user interaction are at the presentation tier. Components that work together to solve business logic problems, such as user bidding, order validation, and market clearing, belong to the application layer. The business logic tier uses the data tier as the repository of the whole system. The CETP selects both relational and nonrelational databases [43], according to the business characteristics of the CBT. For the sake of high performance, clustering technology and dual hot backup machine technology are adopted for each application server and database server in the system.
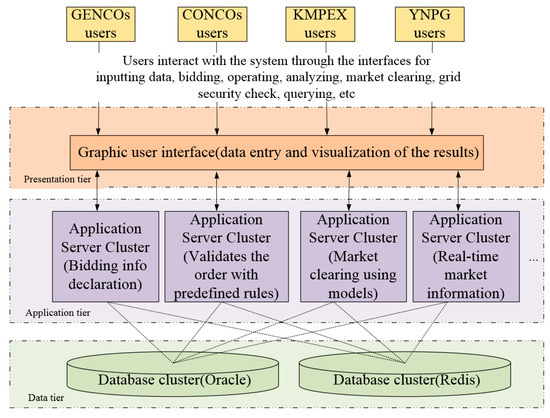
Figure 4.
Conceptual framework of the trading system with multitiered architecture.
Generating company (GENCO) users, consumption company (CONCO) users, market operators of the KMPEX, etc. can independently and synchronously access the user interfaces for data entry, bidding, operation, analysis, market clearing, grid security checks, querying information, and so on. The requests received in the presentation tier are proposed in the application tier. Components consisting in the application tier constitute four main modules: message queue-based order processing, multilevel order logic verification with predefined rules, market clearing using models (i.e., market clearing models), and real-time push and disclosure of market information. The data generated by the application layer will be stored in the database for archiving. The results are displayed to the user in the presentation tier.
5.2. Process Flow of Bidding Order
The CBT orders run through the kernel business of the CETP. Figure 5 graphically represents the order data flows in the CETP and analyzes the data flows during order processing. During processing, the orders in the CETP are stored in a message queue. All the orders submitted or canceled are first placed in the original queue. If two bids are made at exactly the same time, the order of entry into the original queue is determined by chance. Next, the orders in the original queue will be marked with a timestamp, as a key indicator of order sorting for the clearing algorithm, and then enter the queue to be detected. Furthermore, based on the trading rules, all orders in the order queue to be detected are checked according to the rules, and those that do not meet the conditions are put into the order queue without pass validation; otherwise, they are put into the order queue with pass validation. Only orders that pass validation can be used for market clearing, and the orders that meet the transaction conditions will be matched to form the final transaction results stored in the result queue. In addition, the market information needs to be calculated logically based on the market process information and pushed to the market participants through the real-time push service. All process and result information for processing an order is stored in a persistent manner.
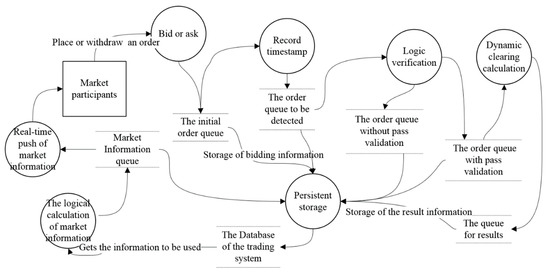
Figure 5.
Data flow diagram of CBT.
5.3. Logic Verification for Trading Rules
Reasonable and effective order verification can ensure the standardization and effectiveness of bidding orders, to ensure the normal operation of transactions. A multilevel order logic verification method with predefined rules is put into use in the CETP.
The verification content of each level is as follows.
Level One: verify the information integrity of the bidding data, such as the unique identification code of the bidding subject and the bidding timestamp, which is regarded as the information integrity validation.
Level Two: verify the basic specifications of bidding power and electricity price in each stage, such as data type and accuracy, which is regarded as business standardization verification.
Level Three: verify the number of bidding segments in each stage, the logic of placing and withdrawing orders, and other types of business constraints, which is regarded as the business logic validation.
As shown in Figure 6, the verification of the three layers is carried out in sequence. Once the order cannot pass the verification of one layer, the verification failure will be directly determined. It should be noted that the check items in each layer can be adjusted, invalidated, or added when the business rules change. After the verification process, the verification module forwards the order to the verification result queue, and participants get notified of a successful or failed order submission.
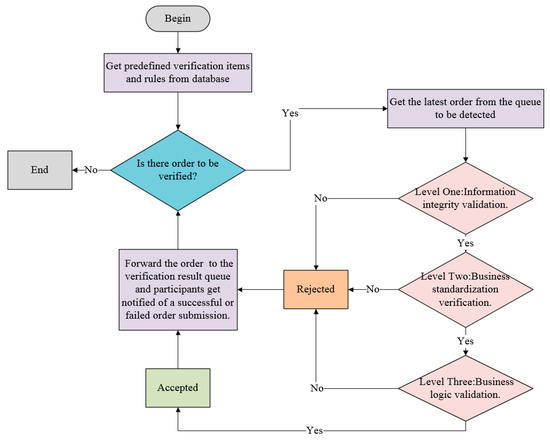
Figure 6.
Schematic diagram of the verification process.
5.4. Market Quotation Information
The information-disclosure mechanism is very important to increase market transparency, reduce transaction costs, improve market fairness, and enhance power-system security [44]. In the bidding process of the CBT, market participants can obtain not only their own private information, such as the submitted quantity price, but also the public information of the market, i.e., market information. The real-time display of market information is one of the major features of the CBT in the continuous bidding stage. Normative and transparent information disclosure can weaken information asymmetry. The market information of the CBT mainly includes top of book, market summary, last trades, and candlestick charts, which are effective guides for market participants to make bidding decisions. The market information is explained below, as shown in Figure 7.
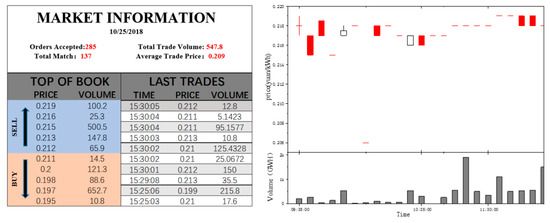
Figure 7.
Schematic diagram of market information.
Top of book: all the bids are queued in an order book. The five best bids or asking prices submitted to the market are listed on the publicly observable board. The buyers’ bids in the order book are arranged in descending order of price, while the sellers’ bids are sorted in ascending order (the higher the buyer’s price is, the more likely the transaction will be caused by the lower the seller’s price is).
Market summary: during the bidding process, the market summary can be disclosed based on the latest real-time market data, which include the number of orders received, the total trade volume, the average hammer price, etc.
Last trades: the last trades are listed in a contract table. The disclosure information is restricted to the paired transaction time, the clearing price, and the volume for each contract. The trades in the table are sorted in decreasing order of matching time.
Candlestick charts: as trade progresses, candlestick charts for different timescales, such as 5 minutes and 10 minutes, will be drawn based on cumulative data. In practice, the relationship among opening, high, low, and closing prices in a continuous trading process is utilized by proponents of candlestick charts, to predict price movements.
All the abovementioned information is updated when there is a new order or trade.
6. Case Study and Application
6.1. Results and Analysis for CBT
To illustrate the effect and characteristics of CBT, take the power energy trading market in November 2018 as an example. Its process and schedule are shown in Figure 8. The bidding period of the first stage was 09:00–09:20, and that of the second stage was 09:30–12:00. A total of 45 CONCOs and 34 GENCOs participated in this transaction. The bidding and clearing of this transaction are described below.
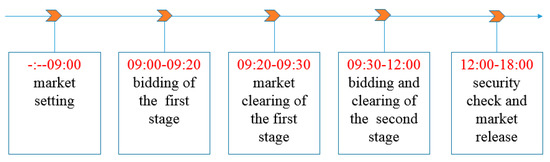
Figure 8.
Process and schedule of the CBT in November 2018.
A total of 81 orders (including six orders withdrawn) were declared during the first stage, among which the CONCOs declared 101.929 GWh of electricity, with an average price of 0.19867 yuan/kWh. The declared electric quantity of GENCOs was 2774.818 GWh, with an average price of 0.22544 yuan/kWh. The market bidding data also reflected the characteristics of the YNEM, where supply far exceeds demand. However, during the process of the first stage, the market information was not transparent, which was precious for the bidding-strategy adjustment. The one-round auction made it difficult to realize full competition. As Figure 9 illustrates, buyers and sellers had great differences in price intention. On the demand side, the bid price changed greatly and dispersedly, the bid volume was relatively small, and the demand curve was steep. On the supply side, hydropower plants stored water to high reservoir levels after the wet season, and bid price was usually higher at this point. However, for such hydropower stations with poor regulating performance, they were willing to declare a lower price, to improve the probability of winning the bid, in order to increase its power generation and reduce the risk of water abandonment. The transaction volume of this stage was only 14 GWh, and the average transaction price was 0.21380 yuan/kWh. A total of 24 contracts were concluded, and the rate of trade for the users was only 13.74%.
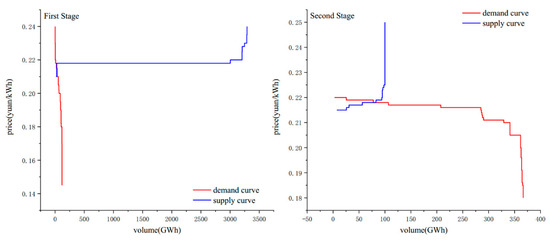
Figure 9.
Supply-and-demand curves of two stages of CBT.
Before the beginning of the second stage, the clearing price and contract volume of the first stage were announced, which played a certain price-guiding role in the subsequent bidding. During the second stage, a total of 248 orders (including 100 orders withdrawn) were declared, among which the cumulative effective order quantity of 124.05771 GWh was placed by CONCOs, and the average price was 0.21562 yuan/kWh. The effective order quantity of GENCOs was 83.444 GWh, with an average price of 0.21839 yuan/kWh. In contrast to the first stage, the market information was disclosed in real time in the continuous bidding process, and the market participants could directly respond to the price signals through their trading decisions. Figure 9 shows that the difference in price intention between buyers and sellers was much smaller than previously. As opposed to the one-shot nature of the first stage’s auction, the transaction intentions were reached gradually through the strategy adjustment of both sides in the process of constant gaming until market closure. As the deal closed, the accumulated transaction power reached 93.99562 GWh, the average transaction price was 0.21770 yuan/kWh, 83 contracts were reached, and the deal rate for the user was up to 75.77%.
Finally, all the two-stage unconstrained transaction results passed the security check by YNPG.
According to the two-stage clearing model of the CBT, the social welfare of the first stage and the second stage were 106,519 yuan and 14,880.08 yuan, respectively. Although the volume of matched deals in the second stage was far more than that in the first stage, the social welfare was less than that in the first stage. The reasons accounting for this phenomenon mainly included the following two aspects: (1) due to the high transparency of price in the second stages, the price willingness of both parties was gradually close to each other’s, and the DOP of the two matched sides was small or even zero. (2) The second stage was a continuous transaction based on the principle with first come, first serve, which existed the loss of allocative efficiency. In other words, the previously matched result maybe lost the greater social welfare that was possibly brought by the subsequent bidding [45].
To further illustrate the dynamic bidding process in the continuous bidding stage, i.e., the second stage, a large user (user A) was taken as an example to describe the dynamic bidding and game process based on market information. Figure 10 shows the average transaction price during the period of the entire market used to indicate the market price signal. The bidding price and trading volume of user A, which are drawn in Figure 10, represent its bidding strategy and strategic results, respectively.
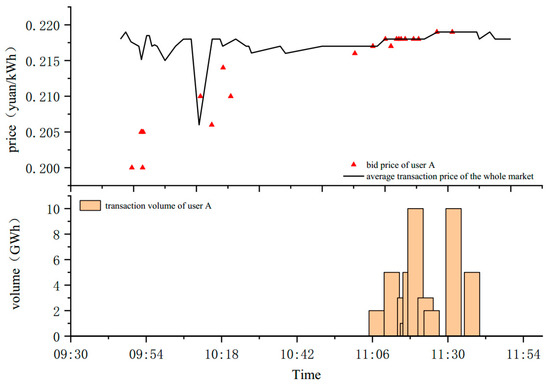
Figure 10.
The dynamic bidding and game process of user A.
After the market was opened, the first hammer price of the whole market was approximately 0.218 yuan/kWh, and user A failed to win the bid for the first order, with a price of 0.2 yuan/kWh. In the early period of the market (approximately 09:30–10:00), the average transaction price fluctuated in the price range of 0.215–0.218 yuan/kWh; however, the highest bid of user A was only 0.205 yuan/kWh, so the contract was not reached. Then, the average price showed a large drop (approximately 10:10); at this time, user A had raised the price to 0.209 yuan/kWh but did not take the initiative and still did not win the bid. Subsequently, user A continued to adjust the bidding strategy but failed to satisfy the conditions for the conclusion of the business. The average transaction price was relatively stable at 0.217 yuan/kWh in the middle term of the market (approximately 10:25–11:00), but user A did not bid. As the market gradually entered the later period, the user significantly increased the order price to 0.217 yuan/kWh and won the bid for the first time, reaching a contract volume of nearly 2 GWh. Later, the quotation price of user A was steadily above 0.218 yuan/kWh, winning the bid many times, and the transaction contracts were concluded. With the deadline of the continuous bidding stage, the final cumulative transaction volume of user A was fixed at 46 GWh.
It can be seen from the above description that, in the whole continuous bidding stage, market participants can flexibly adjust their bidding strategies and conduct a dynamic game with the market itself by considering their own resource endowment, risk preference, and other factors to reach trading intention and maximize their own interests.
According to the above two aspects of the analysis, the combination of the two bidding stages accelerates the discovery of market prices. The real-time disclosure of market information weakens information asymmetry. Market players adjust their strategies based on market information, and dynamic games promote full competition in the market. Continuous clearing increases transaction efficiency.
6.2. Overall Application and Prospect
The CETP has been in operation since the end of 2017, so it supports the effective implementation of the CBT. By December 2018, 12 CBTs were successfully launched in the YNEM. A total of 232 CONCOs participated in the bidding, with a total of 2178 Gigawatt hours (GWh) declared. A total of 167 GENCOs participated in the declaration, with a total of 32196 GWh declared [7]. In the whole year of 2018, a total of 5278 orders were processed, 5136 CBT contracts were concluded, and the total volume of the energy cleared was up to 1018 GWh.
Table 1 shows aggregated data from the CETP in 2018, including the total volume and average price of each transaction. Data analysis shows that the transaction size of the CBT varies from month to month, which is affected by the primary energy supply, market demand, and other trading varieties within a month. As a hydro-dominated electricity market, the YNEM has abundant incoming water in the wet season (from June to October in Yunnan), and the supply far exceeds the market demand. The typical buyer’s market causes trading prices to be lowered to “the floor price”, defined by trading rules (0.13 yuan/kWh) in many months of the wet season. In addition, compared with the dry season, most of the market demand has been met by other varieties (for example, the bilateral negotiated transaction) before the CBT is carried out in the same month during the wet season, leaving less demand space, resulting in a small amount of CBT contracts. In addition, from the point of the two-phase contrast of each month, the contract volume in the continuous bidding stage is more than that in the call auction stage. The longer trading period in the continuous bidding stage has a positive impact on the contract volume, but the more important reason is that the real-time disclosure of market information is conducive to market players tracking market trends, capturing price signals, and forming more contracts through more sufficient competition. Although the transaction amount in the call auction stage is small, it still has many functions: First, in bilateral transactions, many market players take the average transaction price of the first stage as the "benchmark" and determine the final transaction price of bilateral transaction electricity [9]; second, in the continuous bidding stag, market players usually bid or offer by reference to the average transaction price of the call auction stage [7]. More public information about the CBT can be found at www.kmpex.com.

Table 1.
The market-clearing overview of the CBT in 2018 (data source: CETP).
Through the analysis of the application in the whole year, it shows that any mechanism can give full play to its advantages only under suitable conditions. The CBT needs to be further improved and adjusted based on the above practical operation analysis. Examples of improvements include the following:
- In the medium- and long-term market, the proportion of bilateral negotiation transaction and CBT can be coordinated to release more bidding space for the CBT, which may further play the advantages of the CBT.
- In the stage of the call auction, the degree of information disclosure can be improved, such as real-time disclosure of virtual transaction price, virtual transaction volume, and virtual non-transaction volume in the bidding stage, but the order information is not disclosed, which may help to further play the function of price discovery.
7. Conclusions
Since the beginning of 2015, China has been in the process of electricity market reform, and all provinces or regions are actively exploring the suitable market mechanism and construction. In this paper, a new trading mechanism is proposed, which is characterized by a sequential bidding and clearing process that integrates CA and CDA. The clearing model of the CBT, with the maximum goal of social welfare for the two bidding stages, is introduced. A two-stage integrated market clearing algorithm is designed to ensure data consistency and business continuity. Finally, the trading platform based on the CBT mechanism is established and has been applied in the YNEM. The analysis results and practical application throughout one year illustrate that the proposed model, algorithm, and various key measures in the trading platform support the business development of the CBT well. It shows that sellers and buyers actively take part in the electricity market and can take the initiative to adjust their bidding wills in two stages, according to the price signals of the market, in order to win the desired electric volume. From a practical point of view, the CBT can promote market competition and price discovery, alleviate information asymmetry, and improve transaction efficiency.
Certainly, the CETP also has some weakness, including the following two points: (1) market entity could not timely receive market quotation information because of poor network condition; (2) the logical verification is less efficient for many bidding orders in a few paralleled electricity markets because the program is running in the same server machine. We will look at solving these problems as our next step.
Data Statement
We report on aggregated data from the CBT-based electricity trading platform of the YNEM. These data are reported in the figure in which they are shown, but original datasets are subject to commercial confidentiality requirements and are hence not publishable.
Author Contributions
Conceptualization, X.Y. and G.L.; methodology, X.Y. and C.C.; software, G.L. and X.Y.; validation, G.L., X.Y., Y.S., and R.C.; investigation, C.C. and Y.S.; writing—original draft preparation, X.Y.; writing—review and editing, C.C., G.L., and R.C.
Funding
This research was supported by the National Natural Science Foundation of China (No. 51879030).
Acknowledgments
The authors are very grateful to the anonymous reviewers and editors for their constructive comments.
Conflicts of Interest
The authors declare no conflicts of interest.
References
- China Electric Power Press. China Electric Power Yearbook 2016; China Electric Power Press: Beijing, China, 2017. [Google Scholar]
- A list of Statistical Express of the National Power Industry in 2018. ec.org.cn 2019. Available online: http://www.cec.org.cn/d/file/guihuayutongji/tongjxinxi/niandushuju/2019-01-22/4fedb4c956f6059c5998913b10a6233a.pdf (accessed on 19 January 2019).
- Li, X.; Chen, Z.; Fan, X.; Cheng, Z.J. Hydropower development situation and prospects in China. Renew. Sustain. Energy Rev. 2018, 82, 232–239. [Google Scholar] [CrossRef]
- Cheng, C.; Chen, F.; Li, G.; Ristić, B.; Mirchi, A.; Qiyu, T.; Madani, K. Reform and renewables in China: The architecture of Yunnan’s hydropower dominated electricity market. Renew. Sustain. Energy Rev. 2018, 94, 682–693. [Google Scholar] [CrossRef]
- State Council. Opinions on Further Deepening the Reform of the Electric Power Systems: Document No. 9. Beijing. Available online: http://tgs.ndrc.gov.cn/zywj/201601/t20160129_773852.html (accessed on 15 March 2015).
- Trading in the National Electricity Market in 2018. Sohu.com 2019. Available online: http://www.sohu.com/a/300817741_722664 (accessed on 11 March 2019).
- Kunming Power Exchange. Operational Analysis of Yunnan Electricity Market of 2018 and Market Forecast of 2019. Available online: https://www.kmpex.com:8443/file/download/a5dd58fa5699445dab6d880d9bd986a6 (accessed on 2 February 2019).
- Yang, Q.; Cai, H.; Yan, M.; Zhang, M.; Liu, S.; Xing, Y. Design and application of electricity market mechanisms for Yunnan based on theory of Incentive compatibility and games in depth. Autom. Electr. Power Syst. 2017, 41, 27–34. [Google Scholar] [CrossRef]
- Yunnan Provincial Industry and Information Technology Commission. Implementation Plan of the Yunnan Electricity Market in 2018. Available online: http://www.ynetc.gov.cn/Item/17434.aspx (accessed on 21 November 2017).
- Fabra, N.; Von der Fehr, N.H.; Harbord, D. Modeling electricity auctions. Electr. J. 2002, 15, 72–81. [Google Scholar] [CrossRef]
- Haoyong, C.; Xiuli, W.; Xifan, W.; Jian, G. Auction Theory and Its Application in Electricity Market Auction Design Part Two: Application of Auction Theory in Electricity Market Auction Design. Autom. Electr. Power Syst. 2003, 4, 17–23. [Google Scholar]
- Stoft, S. Power System Economics: Designing Markets for Electricity. J. Energy Lit. 2002, 99, 58–63. [Google Scholar]
- Silva, C.; Wollenberg, B.F.; Zheng, C.Z. Application of mechanism design to electric power markets (republished). IEEE Trans. Power Syst. 2001, 16, 862–869. [Google Scholar] [CrossRef]
- Liu, Z.; Zhang, X.; Lieu, J. Design of the incentive mechanism in electricity auction market based on the signaling game theory. Energy 2010, 35, 1813–1819. [Google Scholar] [CrossRef]
- Zou, X. Double-sided auction mechanism design in electricity based on maximizing social welfare. Energy Policy 2009, 37, 4231–4239. [Google Scholar] [CrossRef]
- Zou, P.; Chen, Q.; Xia, Q.; He, C.; Kang, C. Incentive compatible pool-based electricity market design and implementation: A Bayesian mechanism design approach. Appl. Energy 2015, 158, 508–518. [Google Scholar] [CrossRef]
- Zhang, C.; Yan, W. Spot Market Mechanism Design for the Electricity Market in China Considering the Impact of a Contract Market. Energies 2019, 12, 1064. [Google Scholar] [CrossRef]
- Pezzutto, S.; Grilli, G.; Zambotti, S.; Dunjic, S. Forecasting Electricity Market Price for End Users in EU28 until 2020—Main Factors of Influence. Energies 2018, 11, 1460. [Google Scholar] [CrossRef]
- Bobinaitė, V.; Konstantinavičiūtė, I.; Lekavičius, V. Theoretical model for electricity market price forecasting. Econ. Manag. 2012, 17, 944–951. [Google Scholar] [CrossRef]
- Nowotarski, J.; Tomczyk, J.; Weron, R. Robust estimation and forecasting of the long-term seasonal component of electricity spot prices. Energy Econ. 2013, 39, 13–27. [Google Scholar] [CrossRef]
- Yu, Y.; Jin, T.; Zhong, C. Designing an incentive contract menu for sustaining the electricity market. Energies 2015, 8, 14197–14218. [Google Scholar] [CrossRef]
- Hobbs, B.F.; Oren, S.S. Three waves of US reforms: Following the path of wholesale electricity market restructuring. IEEE Power Energy Mag. 2019, 17, 73–81. [Google Scholar] [CrossRef]
- Agalgaonkar, A.P.; Kulkarni, S.V.; Khaparde, S.A.; Soman, S.A. Placement and penetration of distributed generation under standard market design. Int. J. Emerg. Electr. Power Syst. 2004, 1. [Google Scholar] [CrossRef]
- Khazaei, H.; Zhao, Y. Indirect mechanism design for efficient and stable renewable energy aggregation. IEEE Trans. Power Syst. 2019, 34, 1033–1042. [Google Scholar] [CrossRef]
- Liu, Y.; Wu, L.; Li, J. Peer-to-peer (P2P) electricity trading in distribution systems of the future. Electr. J. 2019, 32, 2–6. [Google Scholar] [CrossRef]
- Parag, Y.; Sovacool, B.K. Electricity market design for the prosumer era. Nat. Energy 2016, 1, 16032. [Google Scholar] [CrossRef]
- Wang, J.; Wang, Q.; Zhou, N.; Chi, Y. A novel electricity transaction mode of microgrids based on blockchain and continuous double auction. Energies 2017, 10, 1971. [Google Scholar] [CrossRef]
- Mengelkamp, E.; Gärttner, J.; Rock, K.; Kessler, S.; Orsini, L.; Weinhardt, C. Designing microgrid energy markets: A case study: The Brooklyn Microgrid. Appl. Energy 2018, 210, 870–880. [Google Scholar] [CrossRef]
- Ott A, L. Experience with PJM market operation, system design, and implementation. IEEE Trans. Power Syst. 2003, 18, 528–534. [Google Scholar] [CrossRef]
- Huang, J.; Yalla, P.; Yong, T. New real time market applications at the California Independent System Operator (CAISO). In Proceedings of the IEEE PES Power Systems Conference and Exposition, New York, NY, USA, 10–13 October 2004; pp. 1228–1233. [Google Scholar]
- Amin, M. North America’s electricity infrastructure: Are we ready for more perfect storms? IEEE Secur. Priv. 2003, 99, 19–25. [Google Scholar] [CrossRef]
- Roques, F.A.; Newbery, D.M.; Nuttall, W.J. Investment incentives and electricity market design: The British experience. Rev. Netw. Econ. 2005, 4. [Google Scholar] [CrossRef]
- Flatabo, N.; Doorman, G.; Grande, O.S.; Randen, H.; Wangensteen, I. Experience with the Nord Pool design and implementation. IEEE Trans. Power Syst. 2003, 18, 541–547. [Google Scholar] [CrossRef]
- Chen, F.; Cao, R.; Cheng, C.; Li, G.; Li, X. Contracted generation verification in hydro-dominated electricity markets. In Proceedings of the 2017 IEEE International Conference on Environment and Electrical Engineering and 2017 IEEE Industrial and Commercial Power Systems Europe (EEEIC/I&CPS Europe), Milan, Italy, 6–9 June 2017; pp. 1–6. [Google Scholar]
- Fang, D.; Ren, Q.; Yu, Q. How Elastic Demand Affects Bidding Strategy in Electricity Market: An Auction Approach. Energies 2019, 12, 9. [Google Scholar] [CrossRef]
- Chen, K.; Lin, J.; Song, Y. Trading strategy optimization for a prosumer in continuous double auction-based peer-to-peer market: A prediction-integration model. Appl. Energy 2019, 242, 1121–1133. [Google Scholar] [CrossRef]
- Kirschen, D.S.; Strbac, G. Fundamentals of Power System Economics; John Wiley & Sons: New York, NY, USA, 2004. [Google Scholar]
- Munhoz, F.C.; Correia, P.B. Bidding design for price-taker sellers in bilateral electricity contract auctions. Int. J. Electr. Power Energy Syst. 2008, 30, 491–495. [Google Scholar] [CrossRef]
- Rangel L, F. Competition policy and regulation in hydro-dominated electricity markets. Energy Policy 2008, 36, 1292–1302. [Google Scholar] [CrossRef]
- Liu, S.; Yang, Q.; Cai, H.; Yan, M.; Zhang, M.; Wu, D.; Xie, M. Market reform of Yunnan electricity in southwestern China: Practice, challenges and implications. Renew. Sustain. Energy Rev. 2019, 113, 109265. [Google Scholar] [CrossRef]
- Weber, J.D.; Overbye, T.J. An individual welfare maximization algorithm for electricity markets. IEEE Trans. Power Syst. 2002, 17, 590–596. [Google Scholar] [CrossRef]
- Matena, V.; Krishnan, S.; DeMichiel, L.; Stearns, B. Applying Enterprise JavaBeanse: Component-Based Development for the J2EEe Platform, 2nd ed.; Addison-Wesley: Boston, MA, USA, 2003. [Google Scholar]
- Jatana, N.; Puri, S.; Ahuja, M.; Kathuria, I.; Gosain, D. A survey and comparison of relational and non-relational database. Int. J. Eng. Res. Technol. 2012, 1, 1–5. [Google Scholar]
- Yang, Y.; Bao, M.; Ding, Y.; Song, Y.; Lin, Z.; Shao, C. Review of information disclosure in different electricity markets. Energies 2018, 11, 3424. [Google Scholar] [CrossRef]
- Scharff, R.; Amelin, M. Trading behaviour on the continuous intraday market Elbas. Energy Policy 2016, 88, 544–557. [Google Scholar] [CrossRef]
© 2019 by the authors. Licensee MDPI, Basel, Switzerland. This article is an open access article distributed under the terms and conditions of the Creative Commons Attribution (CC BY) license (http://creativecommons.org/licenses/by/4.0/).