Abstract
This work deals with two paramount devices when Smart Grids are concerned: phasor measurement units (PMUs) and low-power instrument transformers (LPITs). In particular, a simple calibration procedure to test the measurement chain PMU + LPIT has been developed. The procedure involves steady-state conditions of the grid and off-nominal input signals for testing current, voltage, frequency, and rate of change of frequency (ROCOF). In addition, the procedure includes a preliminary testing of the PMU without the LPIT to understand the influence of the latter. The procedure is then applied to a specific case study: a low-cost PMU developed by the authors and one of the most common LPITs adopted in Italian medium voltage networks. The obtained results are promising for two reasons. First, the low-cost PMU works correctly even in off-nominal conditions of the grid; second, the presented calibration procedure demonstrated to be effective and applicable to very common equipment, using a rather simple test setup.
1. Introduction
After the recent development of power networks, for example, the introduction of distributed energy sources (DERs) and many new intelligent electronic devices (IEDs), the monitoring systems require improvement as well. In particular, concerning medium and low voltage networks (MV and LV), the measurement instruments used for monitoring purposes should have reduced costs and high flexibility. This aspect is fundamental to match with the high number of nodes of the MV/LV networks.
Two devices that answer to such requirements are the well-known phasor measurement unit (PMU) and the recently introduced low-power instrument transformer (LPIT). As for the former device, it is a consolidated technology, which allows a high level of network monitoring [1]. This is due to its capabilities of measuring synchrophasors, frequency, and rate of change of frequency (ROCOF) [2,3].
Typically, PMUs are expensive devices that do not fit with the inexpensiveness requirement of the distribution networks. Therefore, in [4], the authors developed a low-cost version (LOCO PMU) compliant with the Standard IEEE c37.118.1-2011 and its amendment IEEE c37.118.1a-2014 [5] in terms of measurements. As for the communication, it follows the well-known IEC 61850 [6] with the supplement of having cybersecure measurements.
As for the LPITs (or sensors) [7,8,9], they are replacing the legacy inductive ones [10] thanks to their reduced dimensions and costs. One example, installed in many Italian secondary substations, is the “Smart termination” [11]: a combined voltage and current sensor.
An aspect that involves both PMUs and LPITs is the accuracy. As a matter of fact, the level of accuracy may change the effectiveness of a particular device in specific applications. In the literature, this aspect is widely tackled. For example, in [12,13,14], the accuracy has been evaluated to assess three key topics regarding PMUs: grid observability, synchronization, and predictive algorithms, respectively. Analogously, in [15,16] the accuracy associated with power quality measurements has been evaluated; while in [17] the accuracy of current transformers has been improved for in-service measurements.
Therefore, tests and procedures that tackle the accuracy performance of LPITs and PMUs are necessary because their results are used in many applications and algorithms [18,19].
In light of what presented in [4,11,20] (of which this paper represents a technical extension), the authors characterized the measurement chain composed of those two elements. Such measurement chain has been tackled in the literature for different purposes in [21,22,23,24], whereas [25] deals with the impact of the ITs’ transient response, and [26] uses the complete measurement chain to estimate the line parameters.
The aim of [20] was to assess the performance of such a new and cheap measurement chain, testing the typical quantities measured and computed by a PMU under sinusoidal (50 Hz) supply. The tested quantities were: current and voltage phasors, with particular attention to their absolute phase, phase difference, frequency, and ROCOF.
In light of the good results obtained, authors made a further step on the calibration issue for PMUs and LPITs when they operate under off-nominal voltage supply. It consists, for example, in a variation of the frequency from the power systems one (50 Hz) or in the presence of harmonics superimposed to it. Such behavior must be tackled by all the measurement instruments installed in the field; in fact, as it is well known, the power network rarely works under ideal conditions.
In the literature, a lot of works deal with such an issue, facing it from different points of view. For example, the authors of [27,28,29] developed algorithms to detect and assess the presence of harmonics. The authors of [30] and [28,31] smartly used PMU to solve the harmonics issue. Finally, the authors of [32] performed an in-field measurement campaign to assess the actual condition of the grid and to evaluate the harmonics propagation in it.
By considering the aforementioned, the testing condition applied in the following is inspired by the standards IEEE c37.118.1-2011 and IEEE c37.118.1a-2014, but also by the EN 50160 [33], which defines the power quality limits (and not the tests) for the secure operation of MV and LV distribution systems. Authors considered and used such limits to build a distorted waveform made by the power frequency component and one harmonic at the time. Of course, more complex tests might be performed, including several harmonic components at the time (without exceeding the allowed THD limit), but till now, no standardized tests have been defined. For example, a possible solution may be to apply arbitrary generated distorted waveforms, as in [34,35], for inductive current and voltage transformers, or to use already existing databases with actual waveform collected from the grid, as it has been done in [36], for inductive current transformers.
The defined tests were chosen to verify the impact of more actual input signals on sensor and PMU operation. Of course, the power network also suffers from non-steady-state events. However, to better highlight the results’ details (and for obvious issues of length and readability), this paper focuses only on steady-state disturbances and single harmonic evaluation. In particular, with this work, the authors wanted to introduce a simple calibration procedure, to be applied on a more and more common measurement chain spread among the MV networks: the PMU + the LPIT. The calibration focuses on the previously described off-nominal conditions and considers the influence of the LPIT in the measurement chain. In fact, it suggests to perform measurements with and without the LPIT in between the generation and the PMU, to provide at a glance its impact on the overall accuracy.
Afterwards, the presented procedure has been tested on a particular case study. It consists of the LOCO PMU developed by the authors and the Smart termination mentioned before.
Summarizing, the case study presented in this work has been used to verify the calibration procedure suggested in this work. The aim of such procedure is to test LPITs + PMU in off-nominal steady-state conditions.
2. Calibration Procedure
2.1. Introduction
In this Section, all the measurement to be performed on the LPIT + PMU system, and to the PMU alone, are described. The aim is to suggest and present a simple calibration to be used in an academic or industry environment. The procedure applies to a measurement chain that is becoming more and more popular every day: LPIT + PMU. Therefore, considering that no standard describes how to test these two elements when they operate together, the following tests were developed considering the existing literature and tests for LPITs and PMUs, separately (see, for example, [7,8,33]).
The generic schematic of two such calibration systems are depicted in Figure 1; in addition to the LPIT and the PMU, a calibrator is included to apply/inject the voltages/currents necessary for the tests. Finally, in the bottom picture of Figure 1, a current and voltage adapter (CVA) are to be included if the LPITs do not provide signals already suitable with the PMUs.
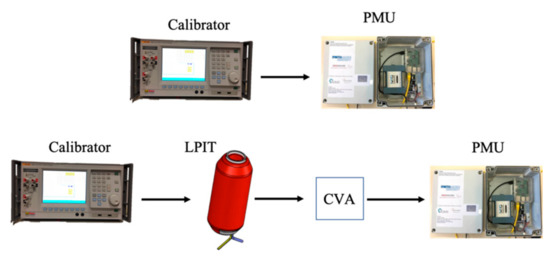
Figure 1.
Simple representation of the setups suggested for the calibration.
The intent of the calibration procedure is to evaluate the accuracy of all the quantities provided by the LPIT + PMU and by the PMU alone: RMS of voltages and current synchrophasors with a different relative phase, frequency, and ROCOF. They are computed according to their definition as in [5]. Tests without the LPIT are included in the procedure in order to compare such tests with the previous ones and highlight the contribution of the LPIT itself, in which the calibration [37] is outside the purpose of this work. As already mentioned, the calibration procedure is to be applied on systems for the distribution network; therefore, the tests on frequency and ROCOF are limited in range and number with respect to the indications of the IEEE Std. C37.118.1-2011 and C37.118.1a-2014. Furthermore, in distribution grids, the current and voltage phasors are elaborated to obtain power flow and reactive power injection measurements; therefore, the developed tests are focused on the accuracy of the phase angle difference between voltage and current. Phase angle measurements have to be repeated several times during the lab testing sessions. Such procedures require having a fixed phase angle to ensure the repeatability of the test over time.
2.2. Tests
In [20], the author’s tests had the aim of assessing, under sinusoidal conditions, the following quantities:
- RMS and phase of the phasors provided by the PMU (in the range 0–1000 V);
- Phase difference between current and voltage channels of the system LPIT + PMU. In particular, in [20], the absolute values of the phases were measured with a reference instrument. Therefore, in this work, the phase measurement results are simply collected by the PMU and evaluated with its algorithms.
- Frequency and ROCOF (in accordance with [5]) on different days to assess the measurement repeatability over time.
In this work, a new set of tests, focused on power quality issues, has been developed to describe a simple calibration procedure. Such tests can be distinguished in two main parts: those in which measurement setups include the LPIT and those that do not. For both groups of tests, the aim is to assess the device under test in steady-state conditions. Such a choice, in the author’s opinion, is of paramount importance before moving to dynamic tests because, even in “simpler” operating conditions, criticality may be found.
In the case-study that follows, 100 measurements were performed in every single test. Such a value is adopted and recommended to have a sufficient number of measurements to assess the quantities to be collected.
2.2.1. Tests with Calibrator + PMU
This first set of tests aims at verifying the performance of a PMU when fed, with sinusoidal/distorted supply, directly from a calibrator. The tests include:
- Measurements vs. frequency.
In the range 48.5–51.5 Hz, (it contains the frequency allowed from [26] for the distribution supply during the 99.5% of the time), with steps of 0.1 Hz, the following quantities have to be measured with the PMU: RMS voltage of the synchrophasors, frequency, and ROCOF.
- Measurement vs. harmonics.
In [33], the maximum percentage value of each harmonic, with respect to the fundamental, was defined (see Section 4). Hence, for each odd harmonic, from 3 to 25, the PMU has to be fed with the sinusoidal 50 Hz signal plus one harmonic at the time. The harmonic absolute value has been chosen according to the maximum allowed from the standard (which, however, does not define how to perform tests). In addition, the maximum harmonic order considered is the 25th because the authors of [33] state that the higher orders are completely unpredictable and have a negligible amplitude. In these operating conditions, the following quantities have to be measured: RMS voltage of the synchrophasors, frequency, ROCOF.
Finally, the procedure for testing the PMU alone ends by measuring the phase difference of 0.5234 rad between two channels of the PMU when the frequency and the harmonics are set as described above. This test is important to understand whether the measurements related to the phase (active/reactive power, hence the energy) are affected or not by non-ideal conditions. In addition, the 0.5234 rad angle has been used to test the system with a typical value that can be found in in-field applications (which gives a power factor between 0.8 and 0.9). This test basically assesses the phase difference computation between two channels (both voltages due to PMU’s input characteristics).
Of course, even if the 0 and 0.5234 rad tests already cover a typical operating range, the tester may apply the same measurement procedure to more phase difference values between voltage and current channels.
For both sets of tests, what needs to be defined is the amplitude of the voltage to be applied to the PMU. The typical analogue input of MV/LV PMU is between 0 and 10 V; therefore, any value in this range can be used for the tests. The reason underlying the choice of leaving the tester to select whatever voltage in the available range is that, even if using a value close to the full scale of the PMU could appear reasonable in terms of error, in actual applications, it is not guaranteed that this condition is going to be respected. In the case-study presented below, the reason for the above choice is supported with actual measurement results.
2.2.2. Tests with Calibrator + LPIT + PMU
This second set of tests, the main one, aims to complete the calibration procedure when the complete system is concerned. Furthermore, once both the results of these tests and the ones from 2.2.1 are obtained, a comparison can be performed to evaluate the effects of the LPIT on the overall system.
In accordance with the structure of 2.2.1, the following tests have been developed for the complete system (bottom picture of Figure 1):
- Measurements vs. frequency.
From 48.5 to 51.5 Hz, with steps of 0.1 Hz, the following quantities have to be measured with the PMU: RMS of the voltage and current extracted from their associated synchrophasors, frequency, ROCOF.
- Measurements vs. harmonics.
According to what stated in 2.2.1, the quantities of interest have to be evaluated when one harmonic at the time was superimposed to the power frequency one (50 Hz). In this way, the harmonics’ impact can be evaluated and confronted in the presence or not of the LPIT.
Again, these two test conditions have been replicated to measure the phase difference of 0.5234 rad between two channels of the PMU. In this particular setup, the two channels correspond to the voltage and the current inputs coming from the LPIT.
As for the amplitude of the signals to be applied with the calibrator, there are two options. On the one hand, the LPITs can be fed with their rated values to guarantee the operating condition in actual applications. On the other hand, also considering the low availability of MV calibrators, if the adopted LPIT follow a linear law, the user can apply signals lower than the rated ones. For example, such an assumption of linearity can be applied on Rogowski coils and capacitive dividers without inferring on the final results of the calibration procedure.
3. Case Study
3.1. Introduction
In this Section, the calibration procedure described in Section 2 is applied to a specific case study. By using the schematic system suggested by Figure 1, the actually implemented system is shown in Figure 2. In the following, the LOCO PMU and LPIT are briefly presented; then, the entire measurement setup and its features are described.
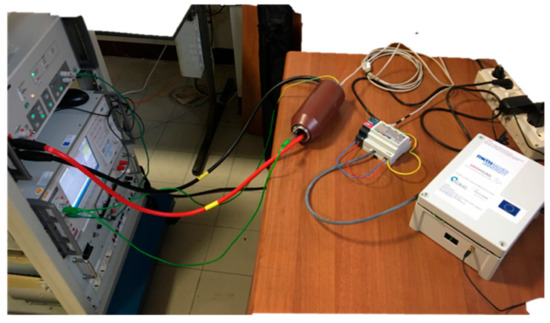
Figure 2.
Picture taken during the performed tests with the presented setup.
3.2. The LOCO PMU
In this Section, the LOCO PMU used in this case study is briefly recalled from [20] for the sake of clarity. In brief, the LOCO PMU is capable of providing the synchrophasors of the voltages and currents connected to its inputs. Then, the PMU can compute the frequency and the ROCOF of the input quantities. Such quantities are those tackled and evaluated in this case study.
3.2.1. The Hardware Description
Three main components can be distinguished in the picture of the LOCO PMU of Figure 3: (i) the data acquisition board, an MCC USB 201, which works in the ± 10 V range up to 12.5 kHz, converts the analogue input to digital sampled values (up to 12.5 kHz). (ii) The Raspberry Pi 3, the core of the PMU, which processes the data sampled by the acquisition board. Such values, according to [6], are compressed in Sampled Value (SV) protocol and in UDP-IP packets. This way, the communication between the PMU and the Phasor Data Concentrator (PDC) can happen by means of the open source OpenVPN software. (iii) A GPS module, to attach the PPS information to the acquired measurement, connected via a Universal Asynchronous Receiver/Transmitter (UART) interface to the Raspberry PI.
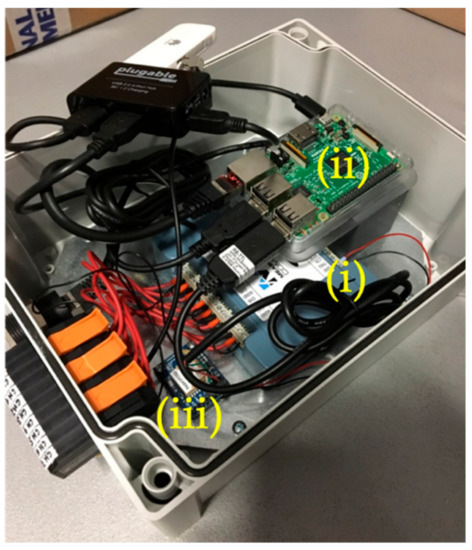
Figure 3.
Actual image of the phasor measurement units (PMU) in which the 3 main components have been highlighted.
The overall cost of the presented hardware is around 250 €; hence, it could be considered low-cost compared to the typical off-the-shelf PMUs in which the cost starts from several thousand euros.
3.2.2. The Algorithm
The algorithm, on which the PMU is based, works on a time-base of 1 s. When the PPS information arrives, measurements are acquired for around 800 ms while the remaining time is dedicated to the computation and communication before the next PPS arrives. The collected samples are subjected to a filter process (3rd order Butterworth filter with a cut frequency equal to 70 Hz) to avoid undesired high-frequency components and to a zero-crossing algorithm to extract the signal frequency. Once the frequency and the ROCOF have been computed, the filtered signal is deleted, and the remaining data analysis is performed on the original samples. As for the ROCOF, it is computed as the difference between the frequencies of the first and the last cycle (inside the measurement interval). For a detailed description of the algorithm, see [4]. Furthermore, as detailed in that document, the LOCO PMU allows the measurement of all quantities with an accuracy sufficient to be compliant with [5]. Therefore, the description of the following case-study is a further step to stress and evaluate the PMU’s behaviour in more actual and off-nominal conditions of the MV distribution network.
3.3. The LPIT
After the introduction of the LPITs, international standards have been updated consequentially [7,8] to include their new features. Among them, it is worth to mention their low-power output, already suitable for the most common acquisition systems. Such a characteristic, in addition to linearity, reduced weight, cost and flexibility, makes LPITs suitable for being spread and installed in many secondary substations.
In light of the authors’ gained experience on the topic [38,39] in this work, a particular LPIT [11] has been used to complete the work started in [20]. The used LPIT is a 0.5 accuracy class combined voltage and current sensor, of the pass-through type, which can be installed in power systems with 50 or 60 Hz as the rated frequency. The main features of the LPIT are listed in Table 1.

Table 1.
Combined current and voltage sensor features.
The sensor communicates via an RJ45 connector, which provides the scaled current and voltage plus the ground potential. The choice of the LPIT was made by considering its extensive presence in the MV Italian power networks and its consolidated usage in several MV applications.
3.4. The Measurement Setup
The setup used in this case study consists of:
- Calibrator Fluke 6105A under metrological confirmation. It provides the required output to the equipment at both sinusoidal (including frequencies different from 50 Hz) and non-sinusoidal conditions (with superimposed harmonics). Its accuracy specifications are collected in Table 2.
Table 2. Accuracy specification of the calibrator fluke 6105a for both current and voltage.
- LPIT. Its actual in/out ratios are 8782 and 34,934.56 for the voltage and the current, respectively. In particular, the voltage sensor consists of a capacitive voltage divider, whereas the current one is a Rogowski coil. Both sensors present high linearity in all their range of operation due to their working principles [1,40].
- The Low-Cost PMU, already detailed in Section 2.
- Current and Voltage Adapter (CVA): Such adapter has been developed inside the laboratory to condition the LPIT voltage and current outputs to obtain values suitable for the input range of the PMU. The CVA features input/output ratios of 400 and 4 for the current and the voltage, respectively. Moreover, its accuracy performances were assessed through a characterization process, performed by using the Fluke 6105A. The results have been omitted for the sake of brevity; however, the phase angle deviations obtained are negligible compared to the reference accuracies of the calibrator.
Considering the calibration procedure performed that threats the devices under test as black boxes, the only information needed for the accuracy evaluation is that of the calibrator, provided in Table 2.
4. Calibration Results
In the following, Section 4.1 describes the results obtained from the calibration described in Section 2.2.1, while Section 4.2 details the results obtained from the calibration of the complete system, as presented in Section 2.2.2. For all tests, 100 measurements were performed for each quantity of interest. Finally, Section 4.3 is completely dedicated to the results’ analysis of two critical quantities: the frequency and the phase difference.
4.1. Calibrator + PMU Tests Results
Figure 4 and Figure 5 present the first set of results. They contain the RMS voltage and the ROCOF measured in the 31 different frequencies from 48.5 to 51.5 Hz, respectively. Considering that during each test, the frequency was kept constant, the reference ROCOF is zero; hence, it is equal to the ROCOF error, as defined in [5]. Consequently, in all the following results, only the term ROCOF has been adopted. In Figure 4, the measured values are presented along with the reference one, set on the calibrator. Both measured and reference voltages have been plotted with the associated uncertainty: standard deviation for the measured voltage and rated accuracy for the reference (dashed lines, see Table 2). Voltage mean standard deviation (evaluated with the type A method) is in the order of for all tested frequencies. A comment on the voltage amplitude has to be done. In accordance with what is stated in Section 2, the reference value applied with the calibrator is 0.4 VRMS. The choice was made to be aligned with the values read by the PMU in the tests also performed with the LPIT.
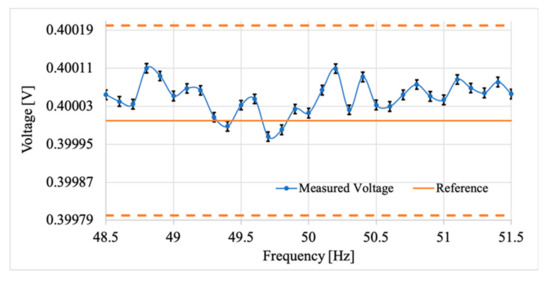
Figure 4.
Voltage vs. frequency test results when the low-power instrument transformers (LPIT) has not been included.
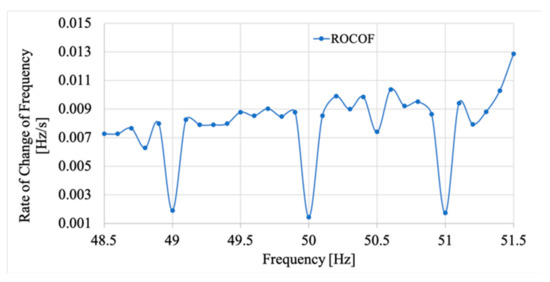
Figure 5.
Rate of change of frequency (ROCOF) vs. frequency results when the LPIT has not been included.
ROCOF values reported in Figure 5 are always within the limits provided by the Standards; in particular, it is very low for the 50 Hz and the other integer frequency measurements. This is due to the algorithm of the frequency and ROCOF extraction from the phasor. As a matter of fact, an integer frequency results in an integer number of periods in a 1 second time-window observation. However, the uncertainty associated with the ROCOF measurement is stable and in the order of .
Moving to the tests vs. harmonics, the limits defined in [33] are listed in Table 3 along with , which is the RMS of the weighted sum of the 50 Hz signal plus the harmonic component (weighted by the percentage of the harmonics with respect to the 50 Hz one), and the value applied by the calibrator. The uncertainty affecting is 0.2 mV (see Table 2) and it is included in the Table. Referring to that Table, all the vs. harmonics results are collected in Table 4.
Table 3.
Harmonics limits with respect to the fundamental signal, according to EN 50160.
Table 4.
Measurements vs. harmonics results.
In Table 4, there are the mean values and the mean standard deviation associated with the measured RMS voltage (, ), the frequency (, ), and the ROCOF (ROCOF, ). Moreover, the minimum and maximum values of each of the three quantities have been included in the table to better appreciate the range of variation of the measured quantities. For a clear overview of the results, values and their reference values (from Table 3) have been plotted in Figure 6. From the picture, it can be highlighted that discrepancies from the reference values happen when the superimposed harmonic is of low order. In fact, from Table 3, it is clear that lower limits, in terms of percentage, are defined for the highest order harmonics. However, in the overall, the absolute value of such discrepancies is very low and in the order of the per-thousand.
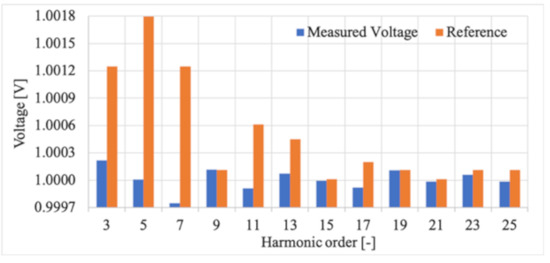
Figure 6.
Voltage vs. harmonics test results when the LPIT has not been included.
Finally, the choice of feeding the PMU using a base of 1 VRMS plus the harmonics has a bifold meaning. First, with 1 V, the weight of each single harmonic can be appreciated at a glance; second, the voltage level is aligned with what has been done in the other tests.
As far as the frequency measurements are concerned, the frequency itself is going to be separately analysed in the following. Instead, from the ROCOF results, an interesting observation emerges. Figure 7 represents the ROCOF vs. harmonics results listed in Table 4. It is evident from the graph that the low-cost PMU is more affected from particular harmonics orders (13, 15, 23, and 25) resulting in a ROCOF one order of magnitude greater than the other harmonic orders. However, the high values included in the graph are still within the limits specified by the Standards.
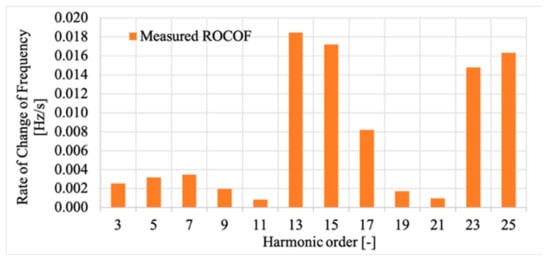
Figure 7.
Measured ROCOF when different harmonics have been superimposed to the fundamental when the LPIT has not been included.
All the aforementioned results represent a starting point for the calibration procedure that is completed in the next subsection.
4.2. Calibrator + LPIT + PMU Tests Results
The results of the voltage and current vs. frequency tests are presented in Figure 8 and Figure 9, respectively. Voltage and current quantities come from the sensor outputs. The input quantities, provided by the calibrator, were selected according to what was stated in Section 2. In particular: 936 V and 100 A were applied to the LPIT. This was done by considering the linearity of the capacitive divider and the Rogowski on which the LPIT is based. In addition, for the current, 100 A is an average value flowing through the distribution network cables (sometimes even far lower than 100 A); hence ensuring to reproduce an actual case study. Afterwards, the LPIT output has been adapted by the CVA to fit the PMU inputs, according to the following current and voltage coefficients, and , respectively:
where and are the voltage and current modules set on the Calibrator, respectively. and instead, are the voltage and current modules acquired from the CVA outputs, respectively. The values used for the computation of the coefficients are those provided in Section 3.4 and recalled in the formulae for the sake of clarity. Regarding the phase, both the LPIT and the CVA have negligible phase coefficients compared to the obtained phases (as detailed in the results).
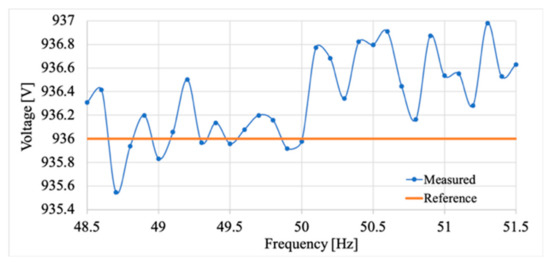
Figure 8.
Voltage vs. frequency test results when the complete measurement chain is concerned.
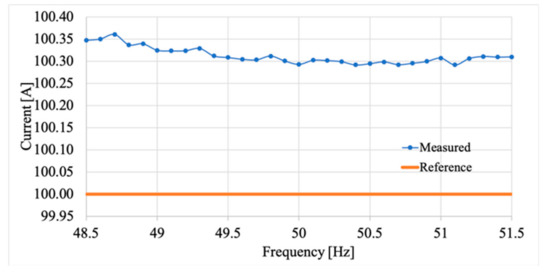
Figure 9.
Current vs. frequency test results when the complete measurement chain is concerned.
Consistently with what has been done for Figure 4, both Figure 8 and Figure 9 already contain values scaled to the reference ones (included in the graphs) by means of the coefficients and . As far as the voltage is concerned, measured values in Figure 8 are associated with a standard deviation of the mean between 1 and 3 V for all the tested frequencies. The uncertainty associated with the reference value (0.05 V) has been omitted in the graph due to its negligibility compared to the measured values. As a further comment, the measured values and their related uncertainties are consistent with the reference value and its associated uncertainty.
Hence, a first comment can be made considering the introduction of the voltage sensors in the measurement chain: compared to the case without LPIT, the uncertainty is two orders of magnitude greater. A second comment is related to the stability: the measurement chain LPIT + PMU is not affected by the selected range of frequencies. As a matter of fact, all the measurements results lay within the limits of the obtained standard deviation. Comments on the current results are very similar. In fact, the associated standard deviation of the mean of degrade, after the current sensor introduction, is of one order of magnitude. From the graph, it can be noted that the measured current is always greater than the reference one, in which standard uncertainty is 0.01 A. This may be due to the non-centred position of the cable with respect to the LPIT. The effects of the cable position on the LPCT measurements are well-known in literature [41] and tackled by the standards [7].
A final comment on the vs. frequencies tests can be given by observing Figure 10. It contains the ROCOF measurement results of the LPIT + PMU measurement chain (plane line) and the ones obtained in the previous section (dotted line) for the case without LPIT. From the graph, it emerges that the sensors presence does not affect the ROCOF evaluation at different frequencies. Moreover, its associate standard deviation of the mean is fully consistent with the one of the previous case ().
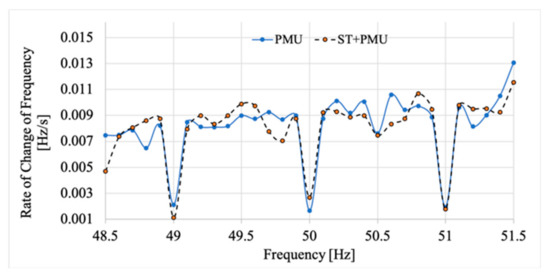
Figure 10.
ROCOF measurement at different frequencies.
Moving now to the vs. harmonics tests, in accordance to what has been done in Section 4.1, Table 5 collects the mean values, standard deviation of the mean associated and maximum and minimum values of the quantities of interest. Such quantities are the same of the ones in Table 5 with the exception of , , , and , which are the mean, max, min values of the measured RMS current and the associated standard deviation of the mean, respectively. Considering the harmonics values of Table 3, Figure 11 and Figure 12 represent the comparison between the measured and the reference voltages and currents, respectively. In other words, both current and voltages have been applied (or injected) into the LPIT with a harmonic content specified in Table 3. Therefore, both Figure 11 and Figure 12 depict the quantities measured by the LOCO PMU, compared to the reference value set on the calibrator. On the one hand, both current and voltages defer from the reference values in the order of some per-thousand, which is satisfactory considering the presence of the LPIT in between the source and the PMU. On the other hand, the standard deviation associated with the amplitude values is one order of magnitude lower than the one obtained without LPIT. That confirms what has been obtained in the tests vs. frequency.
Table 5.
Measurements vs. harmonics results, complete measurement setup.
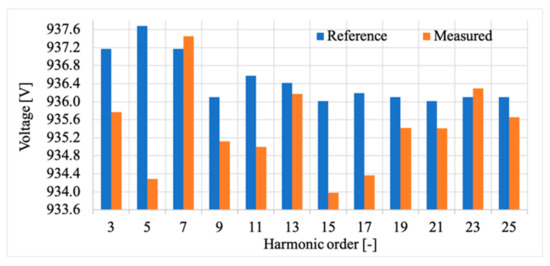
Figure 11.
Voltage vs. harmonics test results when the complete measurement chain is concerned.
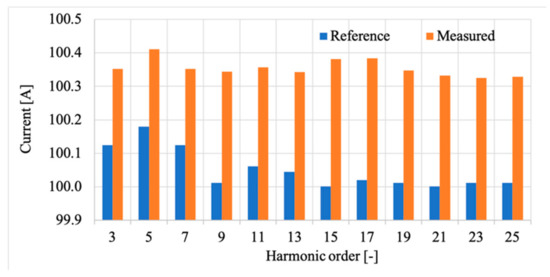
Figure 12.
Current vs. harmonics test results when the complete measurement chain is concerned.
As far as the ROCOF is concerned, Figure 13 shows the comparison between the calibration results with and without the LPIT. Two comments arise from the graphs: firstly, the harmonics that affected the PMU are confirmed to be an issue also in the presence of an LPIT. Secondly, the harmonics sensitivity has increased with the introduction of the LPIT, as it can be seen in the ninth and eleventh harmonic results. However, considering that the obtained values remain within the limits fixed by the Standards, the influence of specific harmonics on the PMU evaluation is typical in off-the-shelf devices [42]. Furthermore, a slight increase of the errors was reported even in the standard tests performed in [4]. Such phenomena could be associated with the design of the algorithm included in the PMU.
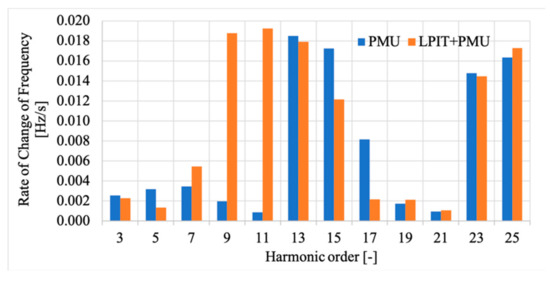
Figure 13.
ROCOF vs. harmonics measurement results using both proposed measurement setups.
4.3. Frequency and Phase Tests Results
In this last subsection, particular attention is given to the frequency and phase tests. This is due to their importance for the power network; in fact, the frequency measurement is crucial to maintain its value within limits acceptable for the grid. The phase instead is paramount in all the power evaluation and computation for the power network components.
Starting from the frequency, the aforementioned tests included its measurement, and the mean value and standard deviation have been computed in all cases. For the sake of clarity, frequency test results have been processed considering them as a calibration curve, which differs from an ideal one. More in detail, gain error and non-linearity error have been calculated as:
where and are the angular coefficients of the best fit line of the calibration curve and the ideal characteristic line, respectively. As for , and are the measured and reference frequencies, respectively. and have been computed for all of the four cases: tests vs. frequency and vs. harmonics, with or without LPIT. Results are summarized in Table 6.
Table 6.
Frequency results, gain and non-linearity error.
Overall, frequency measurements results are very satisfactory in both terms of gain and non-linearity error. The exception regards the non-linearity when the setup LPIT + PMU is concerned. However, the value is acceptable, considering that the frequency variation issue is always controlled by the three levels of frequency regulation along the power network. Furthermore, tests results only considering the PMU have an associated standard deviation of the mean in the order of , which is degrading to when the instrument transformer is also considered.
As far as the phase difference is concerned, all tests included the phase difference evaluation among voltage and current (or between two channels in the case of the setup with only the PMU). This phase difference was set at 0.5233 rad for all tests, for the sake of comparison. In Figure 14 and Figure 15, results are presented. In Figure 14, the tests vs. frequency highlight that, without any sensor, the PMU is computing the phase difference with almost no distinction from the reference value. However, in the complete measurement chain, a higher discrepancy is obtained, (considering it satisfactory in absolute terms). Standard deviations of the mean are confirming the goodness of the results. They are in the order of rad and rad in the absence of LPIT or not, respectively. As for the reference, it provides the phase values with a standard uncertainty of and , for current and voltage tests, respectively. The same comments can be drawn in the case of the phase vs. harmonic test.
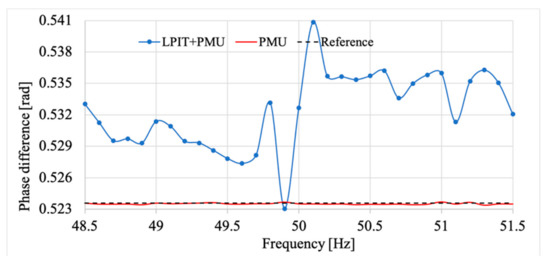
Figure 14.
Phase difference vs. frequency measurement results using both proposed measurement setups.
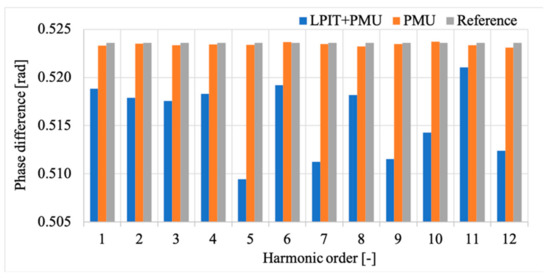
Figure 15.
Phase difference vs. harmonics measurement results using both proposed measurement setups.
It can be stated that the calibration procedure presented in this work allows an assessment of the performance of the LPIT + PMU system. Such an evaluation included a preliminary set of tests on the PMU alone; from which, the effects of the presence of the LPIT have been demonstrated. Furthermore, the tackled frequency range, up to 0.5234 rad, has been used because is the typical phase shift value of the load in actual applications. However, in [4] and [20], the LPIT + PMU measurement chain was tested with phase difference values, between voltage and current, ranging from 0° to 90°. The obtained results are consistent with the ones here presented.
Finally, by considering that the results have been expressed in terms of ratio for the amplitude and phase difference for the phase shifts, the computation of the TVE was avoided. This in accordance with [1], which confirms that in practical situations, it is common to refer to the TVE single contributions to highlight their variation.
5. Conclusions
PMUs are key elements for Smart Grid operation; however, they always work combined with a sensing element. Such an element could be a low power instrument transformer, as it is happening more and more in recent years. To this purpose, the authors proposed and characterized, in previous work, a measurement system composed by LPIT + PMU. From the obtained satisfactory results, the work continued presenting a simple calibration procedure to assess LPITs and PMUs during non-sinusoidal and distorted operation (frequency variations and harmonics superimposed to the fundamental). This further step has been done for two main reasons: (i) there is no standard that indicated how to perform tests on such a novel measurement chain (LPIT + PMU); (ii) even single standards for LPITs and PMUs do not always cover all aspects regarding the off-nominal conditions of the network.
The presented procedure, applicated to a common case study, resulted in being significant for the system and performance evaluation. As a matter of fact, the tests present results in accordance with the related Standards. In addition, the described case study highlighted the goodness of the LOCO PMU developed by the authors when working in off-nominal conditions.
As a final comment, this work, together with other existing literature can represent a starting point for the preparation of a Standard document aimed at testing real, in-field installed, LPIT + PMU systems in actual operating conditions. Therefore, the next step will be the study of peculiar waveforms and tests to be used to replicate the actual operating conditions of both sensors and PMUs.
Author Contributions
Conceptualization, L.P., A.M. (Antonello Monti) validation, R.T., F.P. funding acquisition, L.P., A.M. (Antonello Monti) software and writing, A.M. (Alessandro Mingotti), A.A. writing and editing, A.M. (Alessandro Mingotti), A.A. supervision, R.T., F.P.
Funding
This research has been partially funded by the European project Horizon H2020 SOGNO: Service Oriented Grid for the Network Of the future. Grant number 774613.
Conflicts of Interest
The authors declare no conflict of interest. The funders had no role in the design of the study; in the collection, analyses, or interpretation of data; in the writing of the manuscript, or in the decision to publish the results.
References
- Monti, A.; Muscas, C.; Ponci, F. Phasor Measurement Units and Wide Area Monitoring Systems; Elsevier Science & Technology: London, UK, 2016. [Google Scholar]
- Muscas, C.; Sulis, S.; Angioni, A.; Ponci, F.; Monti, A. Impact of Different Uncertainty Sources on a Three-Phase State Estimator for Distribution Networks. IEEE Trans. Instrum. Meas. 2014, 63, 2200–2209. [Google Scholar] [CrossRef]
- De Din, E.; Lipari, G.; Angioni, A.; Ponci, F.; Monti, A. Effect of the reporting rate of synchrophasor measurements for distributed secondary control of AC microgrid. In Proceedings of the 2017 IEEE International Workshop on Measurement and Networking (M&N), Naples, Italy, 27–29 September 2017; pp. 1–6. [Google Scholar]
- Angioni, A.; Lipari, G.; Pau, M.; Ponci, F.; Monti, A. A Low Cost PMU to Monitor Distribution Grids. In Proceedings of the 2017 IEEE International Workshop on Applied Measurements for Power Systems (AMPS), Liverpool, UK, 20–22 September 2017; pp. 1–6. [Google Scholar]
- IEEE Standard for Synchrophasor Measurements for Power Systems. In IEEE Std C37.118.1-2011 (Revision of IEEE Std C37.118-2005); IEEE: New York, NY, USA, 2011; pp. 1–61. [CrossRef]
- IEC. Communication Networks and Systems for Power Utility Automation; International Standardization Organization: Geneva, Switzerland, 2018. [Google Scholar]
- IEC. Instrument Transformers—Part 10: Specific Requirements for Low-Power Passive Current Transformers; International Standardization Organization: Geneva, Switzerland, 2017. [Google Scholar]
- IEC. Instrument Transformers—Part 11: Additional Requirements for Low-Power Passive Voltage Transformers; International Standardization Organization: Geneva, Switzerland, 2016. [Google Scholar]
- Mingotti, A.; Peretto, L.; Tinarelli, R.; Yigit, K. Simplified Approach to Evaluate the Combined Uncertainty in Measurement Instruments for Power Systems. IEEE Trans. Instrum. Meas. 2017, 66, 2258–2265. [Google Scholar] [CrossRef]
- IEC. Instrument Transformers—Part 1: General Requirements; International Standardization Organization: Geneva, Switzerland, 2011. [Google Scholar]
- Gentilini, I.; Calone, R.; Giammanco, F.; Bolcato, G.; Weichold, J.; Stalder, M. The smart termination: An innovative component to enable Smart Grids development. In Proceedings of the 22nd International Conference and Exhibition on Electricity Distribution (CIRED), Stockholm, Sweden, 10–13 June 2013. [Google Scholar]
- Kamwa, I.; Samantaray, S.; Joos, G. On the accuracy versus transparency trade-off of data-mining models for fast-response PMU-based catastrophe predictors. In Proceedings of the IEEE Power & Energy Society General Meeting, Vancouver, BC, Canada, 21–25 July 2013. [Google Scholar]
- Singh, R.S.; Hooshyar, H.; Vanfretti, L. Laboratory test set-up for the assessment of PMU time synchronization requirements. In Proceedings of the IEEE Eindhoven Power Tech, Eindhoven, The Netherlands, 29 June–2 July 2015. [Google Scholar]
- Ghosh, P.G. Complete and incomplete PMU observability for hybrid state estimation. In Proceedings of the International Conference on Computation of Power, Energy Information and Communication, Melmaruvathur, India, 22–23 March 2017. [Google Scholar]
- Tong, Y.; Liu, B.; Deng, X.; Wang, Y. The experimental study on the electronic instrument transformer harmonic accuracy. In Proceedings of the China International Conference on Electricity Distribution, Shenzhen, China, 23–26 September 2014. [Google Scholar]
- Kaczmarek, M.; Nowicz, R. Simulation of the influence of conductive disturbances on accuracy of the voltage transformers during measurements of the power quality. In Proceedings of the 10th International Conference on Electrical Power Quality and Utilisation, Lodz, Poland, 15–17 September 2009. [Google Scholar]
- Slomovitz, D. Electronic system for increasing the accuracy of in-service instrument-current transformers. IEEE Trans. Instrum. Meas. 2003, 52, 408–410. [Google Scholar] [CrossRef]
- Mingotti, A.; Peretto, L.; Tinarelli, R. An equivalent synchronization for phasor measurements in power networks. In Proceedings of the Workshop on Applied Measurements for Power Systems, Liverpool, UK, 20–22 September 2017. [Google Scholar]
- Ortiz, G.A.; Colomé, D.G.; Puma, J.J.Q. State estimation of power system based on SCADA and PMU measurements. In Proceedings of the 2016 IEEE ANDESCON, Arequipa, Peru, 19–21 October 2016. [Google Scholar]
- Mingotti, A.; Peretto, L.; Tinarelli, R.; Angioni, A.; Monti, A.; Ponci, F. Calibration of Synchronized Measurement System: From the Instrument Transformer to the PMU. In Proceedings of the 2018 IEEE 9th International Workshop on Applied Measurements for Power Systems (AMPS), Bologna, Italy, 26–28 September 2018. [Google Scholar]
- Asprou, M.; Kyriakides, E.; Albu, M. The effect of PMU measurement chain quality on line parameter calculation. In Proceedings of the IEEE International Instrumentation and Measurement Technology Conference, Turin, Italy, 22–25 May 2017. [Google Scholar]
- Singh, R.S.; Cobben, S.; Gibescu, M. Assessment of errors in the measurement chain of distribution grids feasibility study of a PMU application. In Proceedings of the First International Colloquium on Smart Grid Metrology, Split, Croatia, 24–27 April 2018. [Google Scholar]
- Tuttelberg, K.; Kilter, J. Uncertainty propagation in PMU-based trasmission line monitoring. IET Gener. Transm. Distrib. 2018, 12, 745–755. [Google Scholar] [CrossRef]
- Wu, Z.; Thomas, K.; Sun, R.; Centeno, V.A.; Phadke, A.G. Three-phase instrument transformer calibration with synchronized phasor measurements. In Proceedings of the IEEE PES Innovative Smart Grid Technologies, Washington, DC, USA, 16–20 January 2012. [Google Scholar]
- Bi, T.; Liu, H.; Zhou, X.; Yang, Q. Impact of transient response of instrument transformers on phasor measurements. In Proceedings of the IEEE PES General Meeting, Providence, RI, USA, 25–29 July 2010. [Google Scholar]
- Pegoraro, P.A.; Castello, P.; Muscas, C.; Brady, K.; Von Meier, A. Handling Instrument Transformers and PMU Errors for the Estimation of Line Parameters in Distribution Grids. In Proceedings of the IEEE International Workshop on Applied Measurements for Power Systems, Liverpool, UK, 20–22 September 2017. [Google Scholar]
- Hou, S.; Xu, Z.; Lv, H.; Jiang, Z.; Lingyi, W. Research into Harmonic State Estimation in Power System Based on PMU and SVD. In Proceedings of the International Conference on Power System Technology, Chongqing, China, 22–26 October 2006. [Google Scholar]
- Chakir, M.; Kamwa, I.; Le Huy, H. Extended C37.118.1 PMU Algorithms for joint tracking of fundamental and harmonic phasors in stressed power systems and microgrids. IEEE Trans. Power Deliv. 2014, 29, 1465–1480. [Google Scholar] [CrossRef]
- Melo, I.D.; Pereira, J.L.R.; Variz, A.M.; Oliveira, B.C. A PMU-based distribution system harmonic state estimation using parallel processing. In Proceedings of the IEEE International Conference on Harmonics and Quality of Power, Belo Horizonte, Brazil, 16–19 October 2016. [Google Scholar]
- Dixit, A.; Kaur, M. Harmonic source identification with optimal placement of PMUs. In Proceedings of the IEEE International Conference on Power Electronics, Intelligent Control and Energy System, Delhi, India, 4–6 July 2016. [Google Scholar]
- Carta, A.; Locci, N.; Muscas, C. A PMU for the measurement of synchronized harmonic phasors in three-phase distribution networks. IEEE Trans. Instrum. Meas. 2009, 58, 3723–3730. [Google Scholar] [CrossRef]
- Wright, P.S.; Christensen, A.E.; Davis, P.N.; Lippert, T. Multiple-site amplitude and phase measurements of harmonics for analysis of harmonic propagation on Bornholm island. IEEE Trans. Instrum. Meas. 2017, 66, 1176–1183. [Google Scholar] [CrossRef]
- EN 50160:2011. Voltage Characteristics of Electricity Supplied by Public Electricity Networks; European Committee for Standardization: Brussels, Belgium, 2017. [Google Scholar]
- Aristoy, G.; Trigo, L.; Santos, A.; Brehm, M.; Slomovitz, D. Measuring system for calibrating high voltage instrument transformers at distorted waveforms. In Proceedings of the Conference on Precision Elctromagnetic Measurements, Ottawa, ON, Canada, 10–15 July 2016. [Google Scholar]
- Aristoy, G.; Trigo, L.; Santos, A.; Brehm, M.; Slomovitz, D. Behavior of current transformers under distorted waveforms. In Proceedings of the PES Innovative Smart Grid Technologies Latin America, Montevideo, Uruguay, 5–7 October 2015. [Google Scholar]
- Mingotti, A.; Peretto, L.; Tinarelli, R.; Zhang, J. Use of COMTRADE Fault Current Data to Test Inductive Current Transformers. In Proceedings of the Workshop on Metrology for Industry 4.0 and IoT, Naples, Italy, 4–6 June 2019. [Google Scholar]
- Pasini, G.; Peretto, L.; Roccato, P.; Sardi, A.; Tinarelli, R. Traceability of low-power voltage transformer for medium voltage application. IEEE Trans. Instrum. Meas. 2014, 63, 2804–2812. [Google Scholar] [CrossRef]
- Mingotti, A.; Peretto, L.; Tinarelli, R.; Ghaderi, A. Uncertainty sources analysis of a calibration system for the accuracy vs. temperature verification of voltage transformers. J. Phys. 2018, 1065, 052041. [Google Scholar] [CrossRef]
- Mingotti, A.; Peretto, L.; Tinarelli, R. Low Power Voltage Transformer Accuracy Class Effects on the Residual Voltage Measurement. In Proceedings of the 2018 IEEE International Instrumentation and Measurement Technology Conference (I2MTC), Houston, TX, USA, 14–17 May 2018; pp. 1308–1313. [Google Scholar]
- Djokic, B.V.; Ramboz, J.D.; Destefan, D.E. To what extent can the current amplitude linearity of Rogowski coils be verified? IEEE Trans. Instrum. Meas. 2011, 60, 2409–2414. [Google Scholar] [CrossRef]
- Peretto, L.; Tinarelli, R. Procedure for the assessment of metrological characteristics of window-type current transformers in three-phase power systems. In Proceedings of the IEEE International Workshop on Applied Measurements for Power Systems, Aachen, Germany, 24–26 September 2014. [Google Scholar]
- Loper, M.; Salumae, U.; Kilter, J. Assessment of higher harmonics influence to PMU measurement accuracy. In Proceedings of the PES Innovative Smart Grid Technologies Conference Europe, Torino, Italy, 26–29 September 2017. [Google Scholar]
© 2019 by the authors. Licensee MDPI, Basel, Switzerland. This article is an open access article distributed under the terms and conditions of the Creative Commons Attribution (CC BY) license (http://creativecommons.org/licenses/by/4.0/).