Article

Radioactive Heat Production and Terrestrial Heat Flow in the Xiong’an Area, North China

1
State Key Laboratory of Petroleum Resources and Prospecting, China University of Petroleum, Beijing 102249, China
2
College of Geosciences, China University of Petroleum, Beijing 102249, China
*
Author to whom correspondence should be addressed.
Energies 2019, 12(24), 4608; https://doi.org/10.3390/en12244608
Submission received: 22 September 2019 / Revised: 1 December 2019 / Accepted: 3 December 2019 / Published: 4 December 2019
(This article belongs to the Section H: Geo-Energy)

Abstract

:
Herein, integrated heat production analysis in the Xiong’an area was conducted by measuring uranium, thorium, and potassium in different rock types to clarify crust heat flow contribution, simulate the conductive terrestrial heat flow, and illustrate heat source mechanisms of Xiong’an area geothermal resources. The study area was divided into three lithosphere structure types from west to east, and heat production corresponded to layer thickness and heat production with the central area having thicker crust and lower heat production than the eastern and western areas. Crustal heat production, mantle heat flow, and crust–mantle heat flow ratio reveal a ‘cold crust-hot mantle’ in the Xiong’an area.

Graphical Abstract

1. Introduction

Energy released by the radioactive decay of elements—such as uranium (U), thorium (Th), and potassium (K)—in Earth’s interior is the main source of heat production. Different rock types, ages, and metamorphic degrees as well as different locations have significant differences in radioactive heat-producing elements (HPEs) [1,2,3]. Additionally, differing mineral compositions of similar rocks affect the HPE [4]. Therefore, lucubrating the distributive regularities of HPE are fundamentally significant for understanding the contribution of HPE to surface heat flow, exploring the lithospheric thermal structure, and explaining geothermal distribution. In shallow sedimentary layers, radioactive heat production is mainly determined through direct measurements of HPE concentrations (U, Th, and K) in crustal rock samples, whereas in areas lacking drilled wells, heat production is mainly estimated through gamma-ray logging or seismic wave velocity measurements [5]. Measuring radioactive elements and rock density is the most precise and commonly used approach for determining heat production in rocks. Currently, radioactive HPE are mainly quantified using inductively coupled plasma mass spectrometry (ICP-MS) [6] and gamma-ray spectrometry [7,8,9,10].
HPE concentrations are extremely low in the mantle and lower crust of the lithosphere, and thus have little effect on the surface heat flow [11]. Therefore, this study is mainly based on the radioactive heat production of sedimentary layers and upper crust. The contribution of radioactive heat production to surface heat flow in some major tectonic units of China was concluded, and the results show that the contribution of crustal heat production gradually increases from east to west [12,13,14,15]. Lower crustal contributions were found in the Liaohe and North China basins—i.e., 38% and 45%, respectively—whereas the crust contributes more to surface heat flow in the Qaidam and Tarim basins—i.e., 54% and 55%, respectively. This demonstrates that the tectonically active areas have large amounts of heat production from the deep mantle and crust heat production is small, whereas crustal heat production contributes significantly in tectonically stable zones [16,17]. Therefore, collecting and studying rock heat production data is crucial for investigating conductive terrestrial heat flow and crust heat flow contribution. This study first analyzed the concentration of HPE, their contributions to heat production, and heat production in various rock types based on the radioactive heat production measurements of core samples from the Xiong’an area. Combined with a crustal layered structure from geophysical exploration data, the influence of sedimentary layer and crust on heat production in the study area and conductive terrestrial heat flow were calculated. This study will improve the understanding of heat production in rocks from different sedimentary layers and upper crust, and the results will provide fundamental knowledge for geothermal analysis and illustration of heat source mechanisms in the Xiong’an area.

2. Samples and Analytical Methods

2.1. Geological Background and Sample Information

The Xiong’an area is in the Bohai Bay basin, a Meso–Cenozoic superficial rift basin in the eastern portion of the North China Craton (NCC) (Figure 1a). Some of its main structural units include the Rongcheng and Niutuozhen salient and Gaoyang low salient. The Bohai Bay basin experienced four evolutionary stages, namely a stable sedimentary stage lasting from the middle-late Proterozoic to the Paleozoic, fold uplift stage in the Mesozoic, fault development stage in the Paleogene, and depression stage in the Neogene and Quaternary. In the Middle and Late Proterozoic, the Bohai Bay Basin was dominated by the extension-sag structure, which was characterized by the development of the Jura Valley, the non-orogenic magmatism, the large-scale basic rock wall emplacement, and the early metamorphic basal uplift. At the end of the Proterozoic era, the platform was generally uplifted and subjected to denudation. Until the early Paleozoic, the North China Plate was controlled by the passive continental marginal, and the stable neritic facies craton was developed. At the end of the middle Ordovician, the Caledonian movement caused the whole plate to rise and be denuded, until the middle Carboniferous, the overall plate descended and developed Marine and Continental intersections facies. The whole Triassic in Bohai Bay basin was missing as a result of the Hercynian movement at the end of Permian. Mesozoic was the main tectonic transition period in Bohai Bay basin, and the Indosinian movement and Yanshan movement caused the strong intracontinental orogenesis, basin-forming, and magmatic-thermal action. Additionally, a series of NE, NNE, and EW major faults have been developed, with the Taihang Mountains, Yanshan Mountains and Jiaoliao Mountains rising, and the basin was uplift for a long term, suffered a lot of denudation, and exposed a large number of metamorphic bedrock. At the same time, the Niutuozhen salient in the study area began to develop, affected by tectonic compression, the strata in the section presented a convex shape. In the late Yanshan movement, under the influence of the North China Plate, the Niutuozhen salient continuously uplifted with the middle Proterozoic strata exposed, and the strata gradually changed new to the two sides which the Jurassic period was completely denuded. Under the influence of the Himalayan movement in the Paleogene, a series of faults and uplifts occurred in the Bohai Bay basin. In the Neogene, the Pacific plate receded into the Eurasian subduction zone, and the Bohai Bay basin changed from a tensile tectonic stress environment to a compressional one. The fault activities gradually weakened, and under the influence of the Himalayan movement, the basin entered a period dominated by depressions, the salients and the regional basement were had the same subsidence, which caused the basin to enter the depression basin-forming stage.
Therefore, from bottom to top, the study area comprises metamorphic rocks from the Archean, marine carbonate rocks from the middle-late Proterozoic to the middle Ordovician, which were affected by the transgression, marine-terrigenous facies clastic rocks bearing a few carbonate rocks from the Permian, lacustrine, and foliate facies sandstone, and mudstone from the Paleogene to the Quaternary (Figure 1c). The Triassic sequence is missing because it was affected by the Indosinian movement. The Bohai Bay basin developed a moderately acidic volcanic intrusion in the Late Cretaceous and basic volcanic intrusion in the Paleogene under the influence of rifting cycle stages during the Mesozoic to Cenozoic. The igneous rock intrusion in the Jizhong depression is widely distributed through the Langgu and Baxian sags and has scattered distribution in the Raoyang sag [18,19,20].
Herein, we measured 83 core samples comprising mudstone, sandstone, siltstone, dolomite, basalt, orbite, and metamorphic basement rocks from 32 wells in and around the Xiong’an area (Table 1). These samples included all the sedimentary layers in the depression from the Archean metamorphic rock basement to the Neogene. Igneous rock samples—i.e., basalt and hornblende—are from the late Lvliang period, approximately 1.65 to 1.8 Ga, i.e., the Changcheng system. Due to limitations caused by the distribution of oil fields and wells, most samples were obtained from the Niutuozhen salient, Baxian sag, and Raoyang sag, with sporadic samples from the Rongcheng salient and Gaoyang low salient (Figure 1).

2.2. Experimental Methods

The samples were analyzed at the Radionuclide Lab, Beijing Institute of Geology, Nuclear Industry using ICP-MS methods. 238U and 232Th were measured using a PerkinElmer, Type Elan DCR-e ICP-MS in standard mode, and 40K was measured using a PerkinElmer Type 5300DV ICP-OES at 14 °C and relative humidity of 30%. The samples were dissolved using a mixed acid closed digestion method. The volume ratio of hydrochloric acid, nitric acid, hydrofluoric acid, and perchloric acid was 4: 3.5: 2: 6.5, and the dilution factor was 500 (diluted 0.1 g to a constant volume of 50 ml). Two blank experiments were conducted, and the blank values of U and Th were adopted as 0.003 ng/ml. The principle is that the ICP uses a high-frequency RF signal of powerful power applied on the inductor coil to form a high-temperature plasma inside the coil (that is, ionizes an electron to form a monovalent positive ion), and promotes the plasma continuous balance and ionization by pushing the gas. While mass spectrometry is a mass screening and analyzer that measures the intensity of an ion by selecting ions of different mass-to-nuclear ratios (m/z) to calculate the intensity of an element. The experiment was conducted based on the reference material GB/T14506.30-2010 and GB/T14506.11-2010.
The density of samples were measured at the State Key Laboratory of Petroleum Resources and Prospecting, China University of Petroleum, Beijing, using AR-3000R multi-function density tester. The measurement was carried out at room temperature of 18 °C, humidity of 30%, and measurement under normal atmospheric pressure with an accuracy of 0.01%. The measuring principle of the instrument adopts buoyancy method with the Archimedes principle. The weight of the sample in the air and in the water is measured by the high-precision electronic analytical balance, and the displacement of the sample in the water is also measured. Using the water temperature and water density comparison table, the sample density is available.

3. Radioactive Heat Production of Sedimentary Rocks, Pyrolite, and Metamorphic Rocks

Heat production was calculated using the empirical formula proposed by Rybach [21] shown in Equation (1)
A = ρ(9.52CU + 2.56CTh + 3.48CK) × 10−5
where A is radioactive heat production (μW/m3), ρ is rock density (kg/m3), and CU, CTh, and CK represent the contents of U (mg/g), Th (mg/g), and K (wt %), respectively.
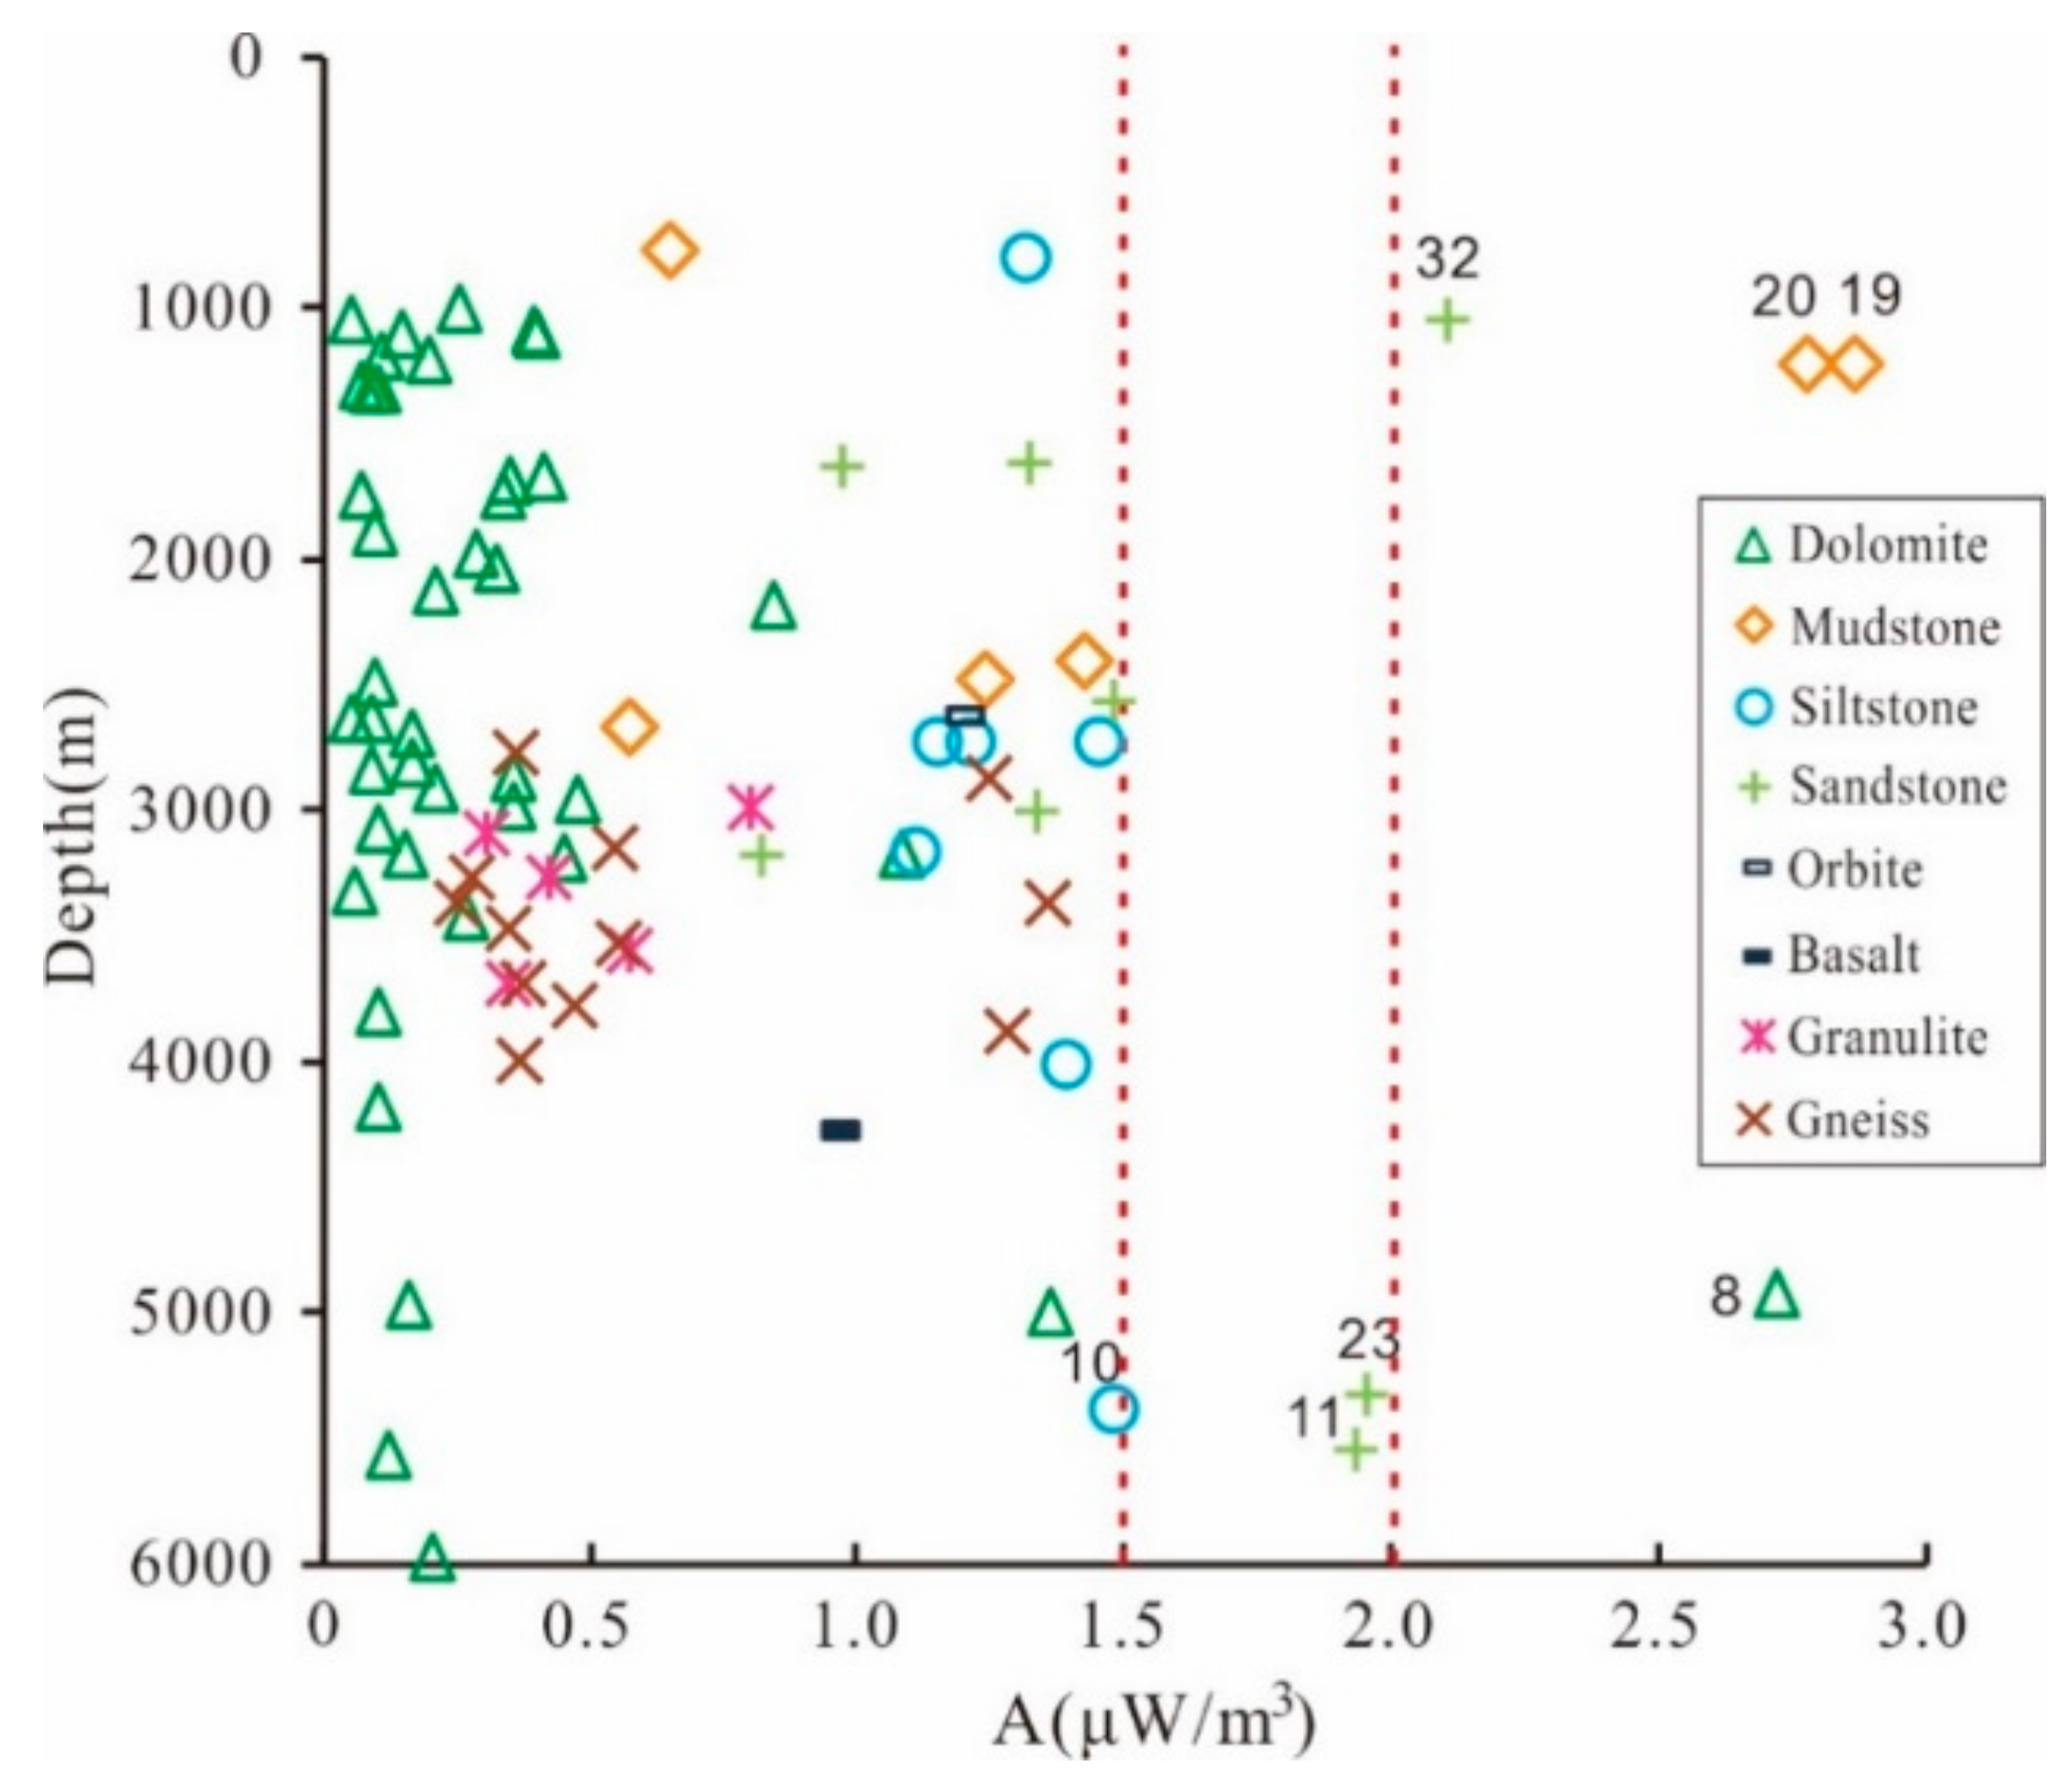
The HPE concentration and calculated heat production of each sample is listed in Table A1, and the relation between heat production and depth is shown in Figure 2. Most samples have heat production values lower than 1.5 μW/m3 with only six samples (7%) having heat production values greater than 1.5 μW/m3 and 95% are lower than 2 μW/m3. There is no significant correlation between heat production and depth. The heat production values of mudstone, siltstone, and sandstone are similarly distributed, whereas marine sandstone and mudstone (samples from the Proterozoic) have an obviously higher distribution. Heat production is lowest in dolomite, although that of the dolomite with high argillaceous content sample (No. 8) is relatively higher.
Additionally, different lithologies showed varying heat production distributions. Four of the six mudstone samples had heat production values lower than 1.5 μW/m3, whereas two (nos. 19 and 20) had heat production values greater than 2.5 μW/m3. Sandstone samples with heat production values of 0.5–1, 1–1.5, and 1.5–2 μW/m3 were almost equal in number at 25% (2/8), 37% (3/8), and 25% (2/8), respectively, and the remaining sandstone sample’s heat production value was 2–2.5 μW/m3. Although the dolomite samples had relatively scattered distribution, samples with heat production values lower than 0.5 μW/m3 made up 88% (38/43) of the total dolomite samples, and those lower than 1.5 μW/m3 made up 97% (42/43) of the total with only one sample greater than 2.5 μW/m3. All the siltstone samples had heat production values of 1–1.5 μW/m3. Pyrolith samples were sparse, and the average heat production values of basalt and orbite were 0.94 and 1.17 μW/m3, respectively, and were concentrated at 0.5–1.5 μW/m3. The heat production values of granulite and gneiss in basement metamorphic rock samples were mainly distributed around 0–0.5 μW/m3, making up 60% (3/5) and 58% (7/12) of these samples, respectively. Additionally, 40% (2/3) and 17% (2/12) of the granulite and gneiss samples, respectively, were distributed at approximately 0.5–1 μW/m3, whereas the remaining 25% (3/12) of the gneiss samples were distributed at approximately 1–1.5 μW/m3.
Heat production is a basic rock thermal characteristic that typically has a strong correlation with lithology, i.e., carbonate rocks usually have lower heat production values than clastic rocks, basic igneous rocks usually have lower heat production values than that of intermediate acidic igneous rocks, and basement metamorphic rocks have heat production values between those of clastic and carbonate rocks. However, heat distribution within the same lithology can also be scattered. Therefore, before calculating heat production characteristics of the same lithology, further analysis of heat production, such as the contribution of various radioactive elements, is necessary.
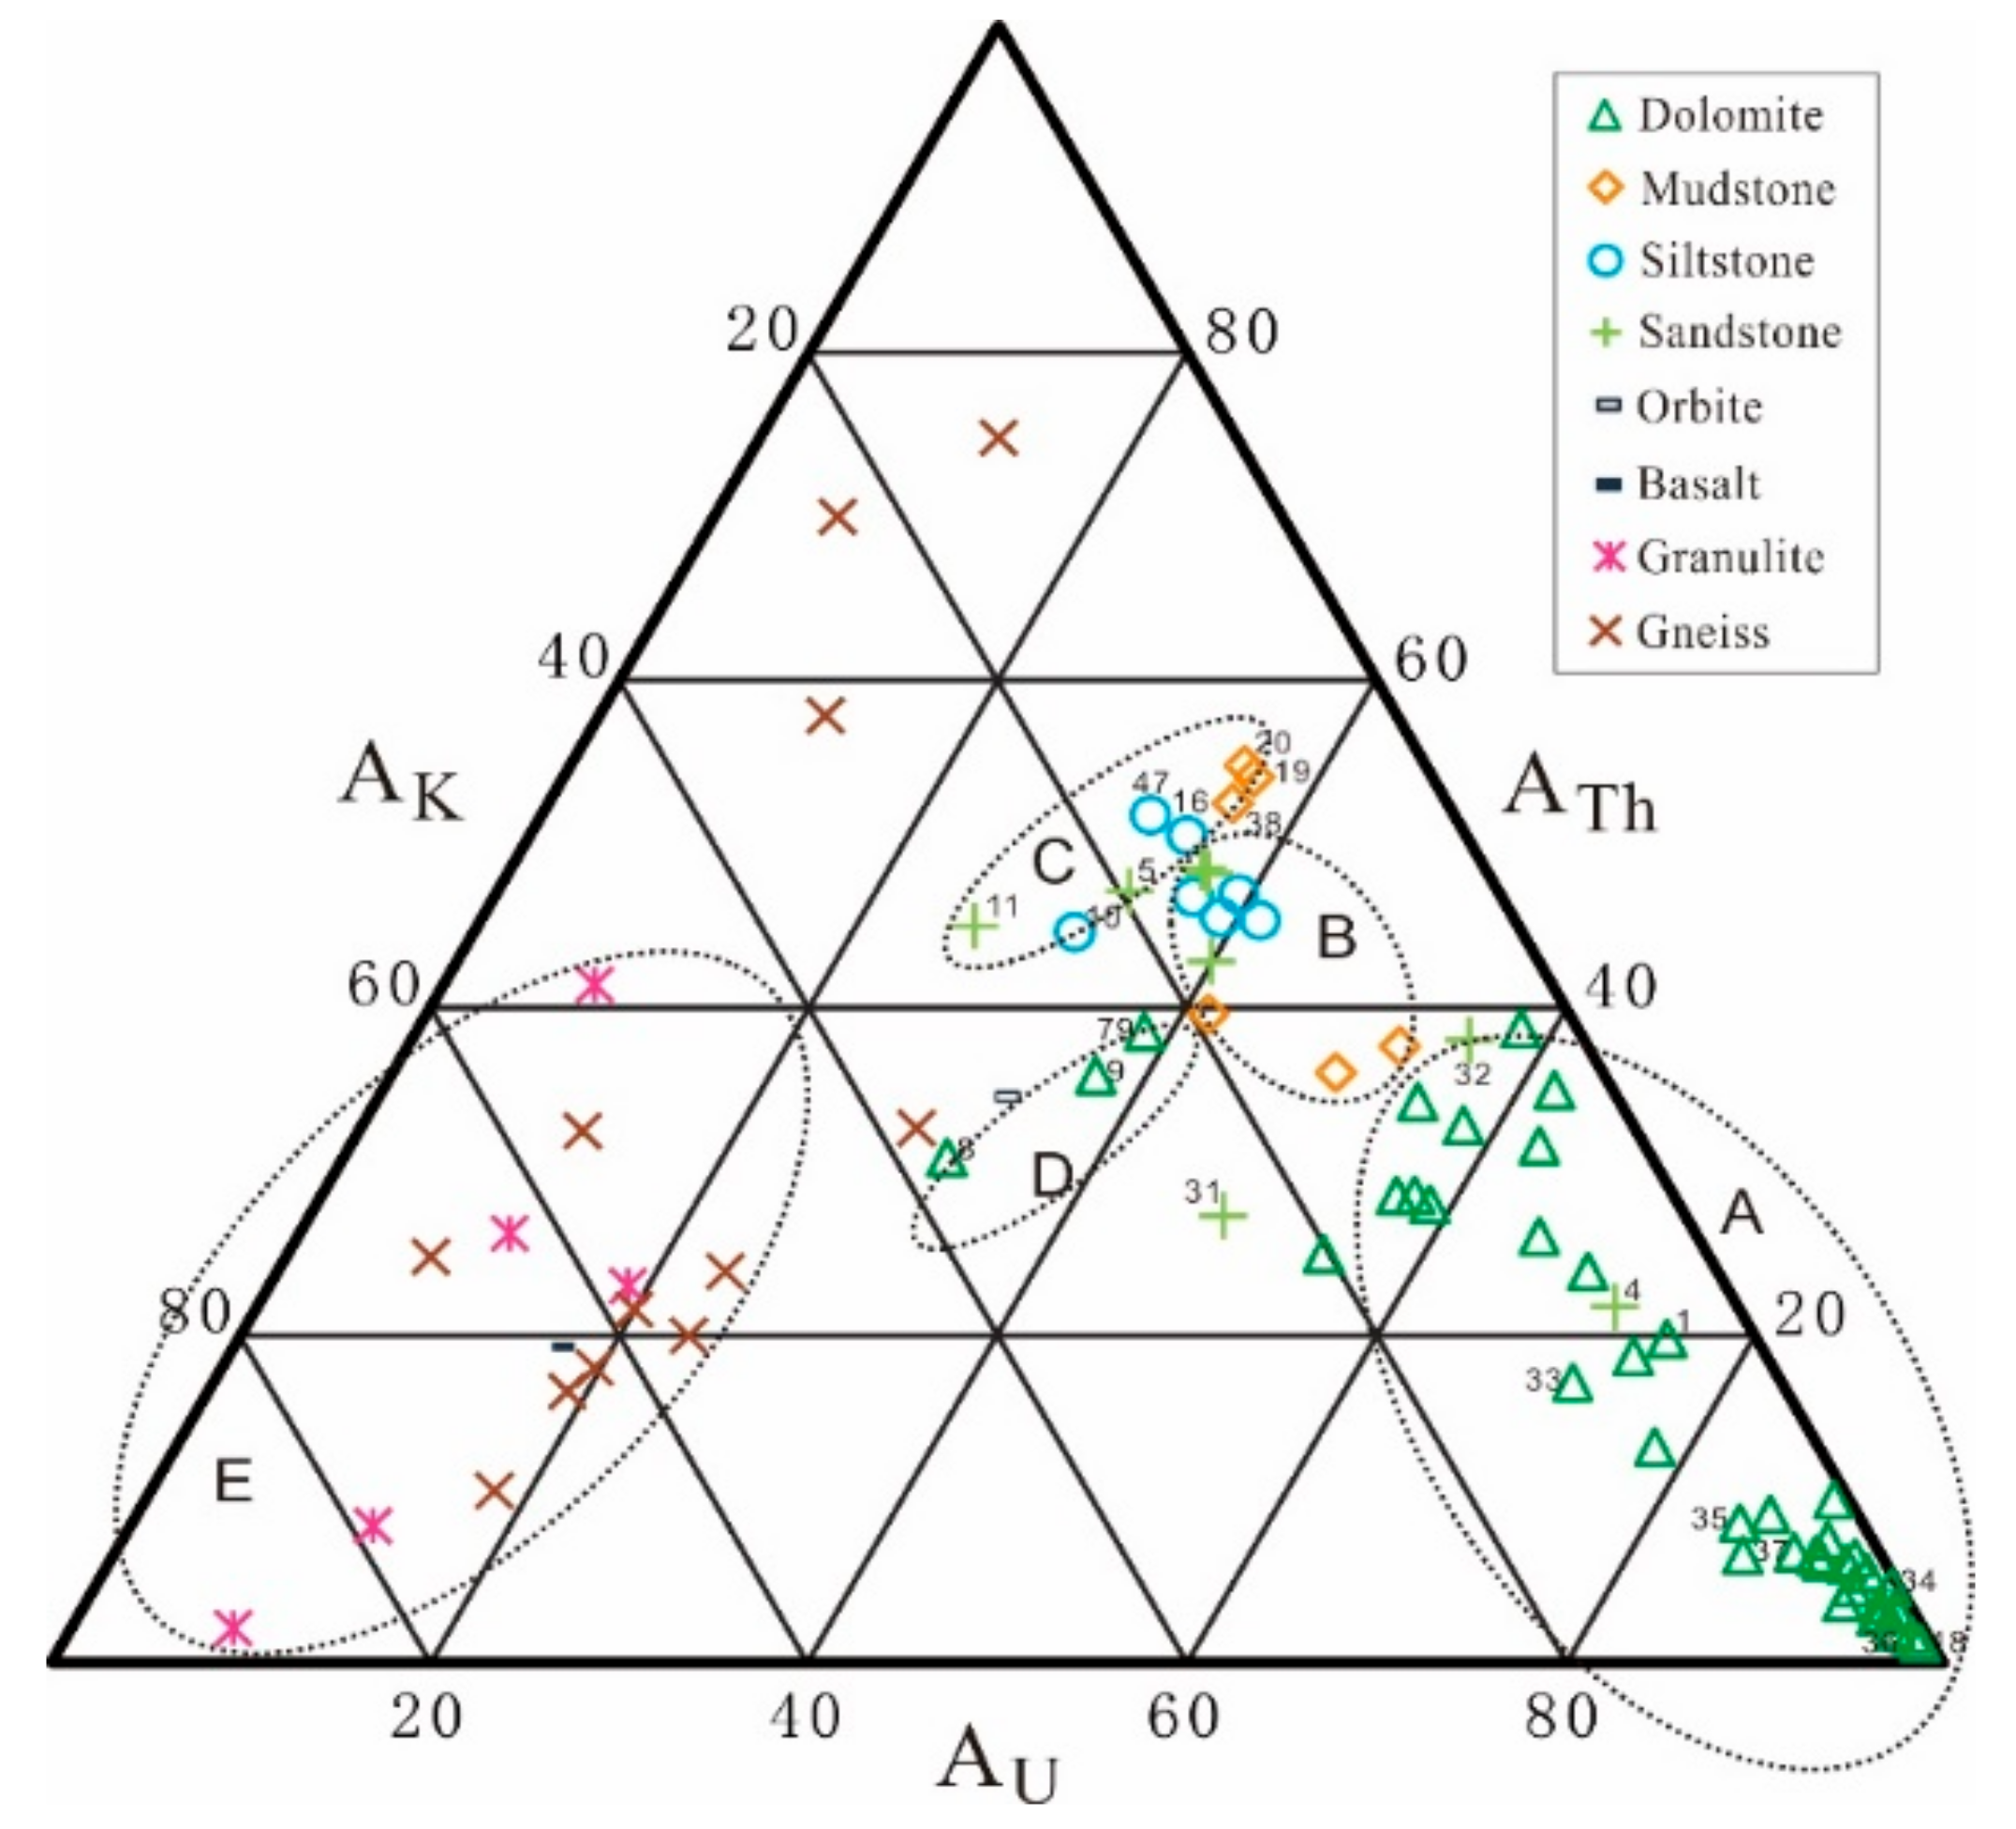
Figure 3 shows that the heat production of Th in sedimentary rocks, such as sandstone, siltstone, and mudstone, is higher than that in dolomite. In marine clastic facies (nos. 10, 11, 19, and 20), Th heat production is similar and U heat production is relatively higher in marine clastic rocks than that in continental clastic rocks. Heat production of K in basal granulite and gneiss are obviously higher than that in sedimentary rocks. Dolomite samples, continental clastic rock samples, marine clastic rock samples, metamorphic rock samples, and dolomites with high argillaceous content were mostly distributed in Groups A, B, C, E, and D, respectively. In Group A, sedimentary rock samples comprised mainly of continental and marine dolomites. Examples include sample nos. 33–37, which were lacustrine dolomites developed in the Nm and Ed with heat production characteristics similar to those of marine dolomites and relatively low heat production. Clastic rocks in Groups B and C had relatively high heat production, whereas those of marine clastic rocks in Group C were higher than those in Group B. Examples include nos. 10 and 11, which were siltstone and quartz sandstone samples in well GS1 in the Changcheng system, and nos. 19 and 20, which were mudstone samples in well N28 in the Jixian system. Sample nos. 8, 9, and 79 in Group D were argillaceous dolomite samples developed in the Changcheng system. Samples in the Changcheng system typically had higher argillaceous content and greater heat production than dolomite samples in Group A, but were lower than Groups B and C clastic rock samples. The Group E samples contained basalt, indicating that the basalt composition was mainly from deep material upwelling caused by plate tension and thinning. The heat production values of basic igneous rocks were lower than those of neutral igneous rocks, and their radioactive element contents were similar to that of gneiss.
The vertical distribution and element ratios of U, Th, and K (Th/U and Th/K) reflected sedimentary ages and environments [22,23,24,25,26]. U was easily oxidized during deposition, with U4+ being oxidized to U6+ and forming free oxide [UO]2]2−, which has good water solubility and is prone to migration, whereas thorium did not have this property. Therefore, the Th/U ratio can indicate a paleoenvironment’s redox state. In an oxidizing environment, the Th/U ratio is greater than six, whereas in a reducing environment, it is less than two [27,28]. K is not easily enriched in sediments owing to its activity; therefore, K in sedimentary rocks is usually related to clay mineral and K mineral contents in the provenance area. Generally, the potassium content is higher in shallow near-shore water and lower in the open ocean [29]. Therefore, the Th/K ratio can indicate changes in water depth. The Th/K ratio of long-term weathered sediments is greater than seven, whereas that of a deep-water low-energy environment is relatively low [30,31].
Calculations based on radioactive heat production data, the Th/U ratio of continental clastic rocks is calculated as 3.2 (R2 = 0.68) (3–6) and Th/K ratio is 3.9 (R2 = 0.11) (3–6), whereas that of marine carbonate rocks is 1.4 (R2 = 0.41) (1–2) and Th/K ratio is 1.3 (R2 = 0.87) (1–2). Thus, the rock samples were classified based on heat production contributions of radioactive elements. As shown in Table 2, the Th/U and Th/K ratios gradually decreased from sandstone to mudstone to dolomite in marine sedimentary rocks, i.e., clastic rocks deposited in an oxidizing environment of relatively shallow water and carbonate rocks deposited in a reducing environment of deep water. In continental sedimentary rocks, the Th/U ratios of mudstone and siltstone belong to the median area; however, the sandstone ratio changes the most and is at the upper limit of the Th/U ratio, indicating that the rock grain size change in continental sediments reflected different sedimentary facies zones, and the rule change of U, Th, and K also reflected the restriction effects of different sedimentary environments on their distribution [29]. We calculated the average heat production and contributions of U, Th, and K in samples with different lithologies based on these sample classifications. Table 2 shows the results of these calculations. The average heat production values of sandstone, siltstone, mudstone, dolomite, basalt, orbite, granulite, and gneiss were 1.43 ± 0.44, 1.27 ± 0.14, 0.97 ± 0.37, 0.34 ± 0.47, 0.94, 1.17, 0.49 ± 0.18, and 0.62 ± 0.40 μW/m3, respectively. The marine clastic rocks samples had heat production values of 2.26 ± 0.58 μW/m3. The marine dolomite samples had heat production values of 0.37 ± 0.49 μW/m3, whereas that of the continental dolomite samples is 0.10 ± 0.06 μW/m3. The heat production contribution of U, Th, and K in continental sedimentary rock samples was 51–72%, 22–37%, and 6–12%, respectively. These results are similar to those reported by Abbaby [24], wherein thermal contributions of U, Th, and K were reported as 62%, 34%, and 4%, respectively, for continental sedimentary rocks in Egypt. In marine carbonate rocks, U was the main heat production contributor, accounting for 78% on average. In some samples, heat production was almost entirely from U. In basic igneous rocks (basalt), K is the main heat production contributor, whereas in neutral igneous rocks (orbite), U, Th, and K have similar heat production contributions and higher total heat production than basic igneous rocks. However, owing to the small number of samples, no specific analysis was conducted here.
The U, Th, and K contents of Archean metamorphic rock samples were 0.32 μg/g, 3.09 μg/g, and 2.8%, respectively, with an average heat generation rate of 16%, 29%, and 54%, and the Th/U ratio and Th/K ratios were 7.7 and 0.9, respectively (Table 2). This result was not consistent with that of global crustal rocks studied by Huang [32], which had U, Th, and K contents of 0.5–0.6 μg/g, 1.8–6.1 μg/g, and 0.6–1.9%, respectively. It was also not consistent with results on mainland China studied by Wang [33], which had U, Th, and K contents of 0.83–1.76 μg/g, 3.16–6.69 μg/g, and 1.0–2.12%, and Th/U ratios of 3.8–5. We found that U and Th were affected by tectonic movements and migration owing to their activity, or that only metamorphic rock samples were selected in one well, which only represents a horizon of element abundance and heat production and cannot represent that of the entire upper crust [34,35,36].
In conclusion, the sedimentary layer in the Xiong’an area had relatively low heat production. The average of all samples herein was 0.98 μW/m3, which was close to the value of the Sichuan Basin sedimentary layer, i.e., 0.97 μW/m3, calculated by Zhu et al. [36]. However, this value is lower than previously calculated global average heat production values, such as 2.3, 2.1, and 1.9 μW/m3 in the Phanerozoic, Mesozoic, and Cenozoic, as calculated by Huang [32], Wang et al. [13], and Qiu [37], respectively. Additionally, the heat production values of sedimentary layers in the eastern China Basin and western Qaidam Basin ranged 2.0–2.2 μW/m3, which is even lower than that of the Junggar Basin (1.137 μW/m3), which was thought to have the lowest heat production [38]. The Bohai Bay basin is a Mesozoic–Cenozoic superimposed rift basin in the eastern portion of the NCC that developed large scale basic volcanic rocks during the Yanshanian. Additionally, the relatively low heat production of dolomites and basic igneous rocks may also be one of the reasons for the low heat production in the Xiong’an area.

4. Discussion

4.1. Contribution of Sediments to Surface Heat Flow

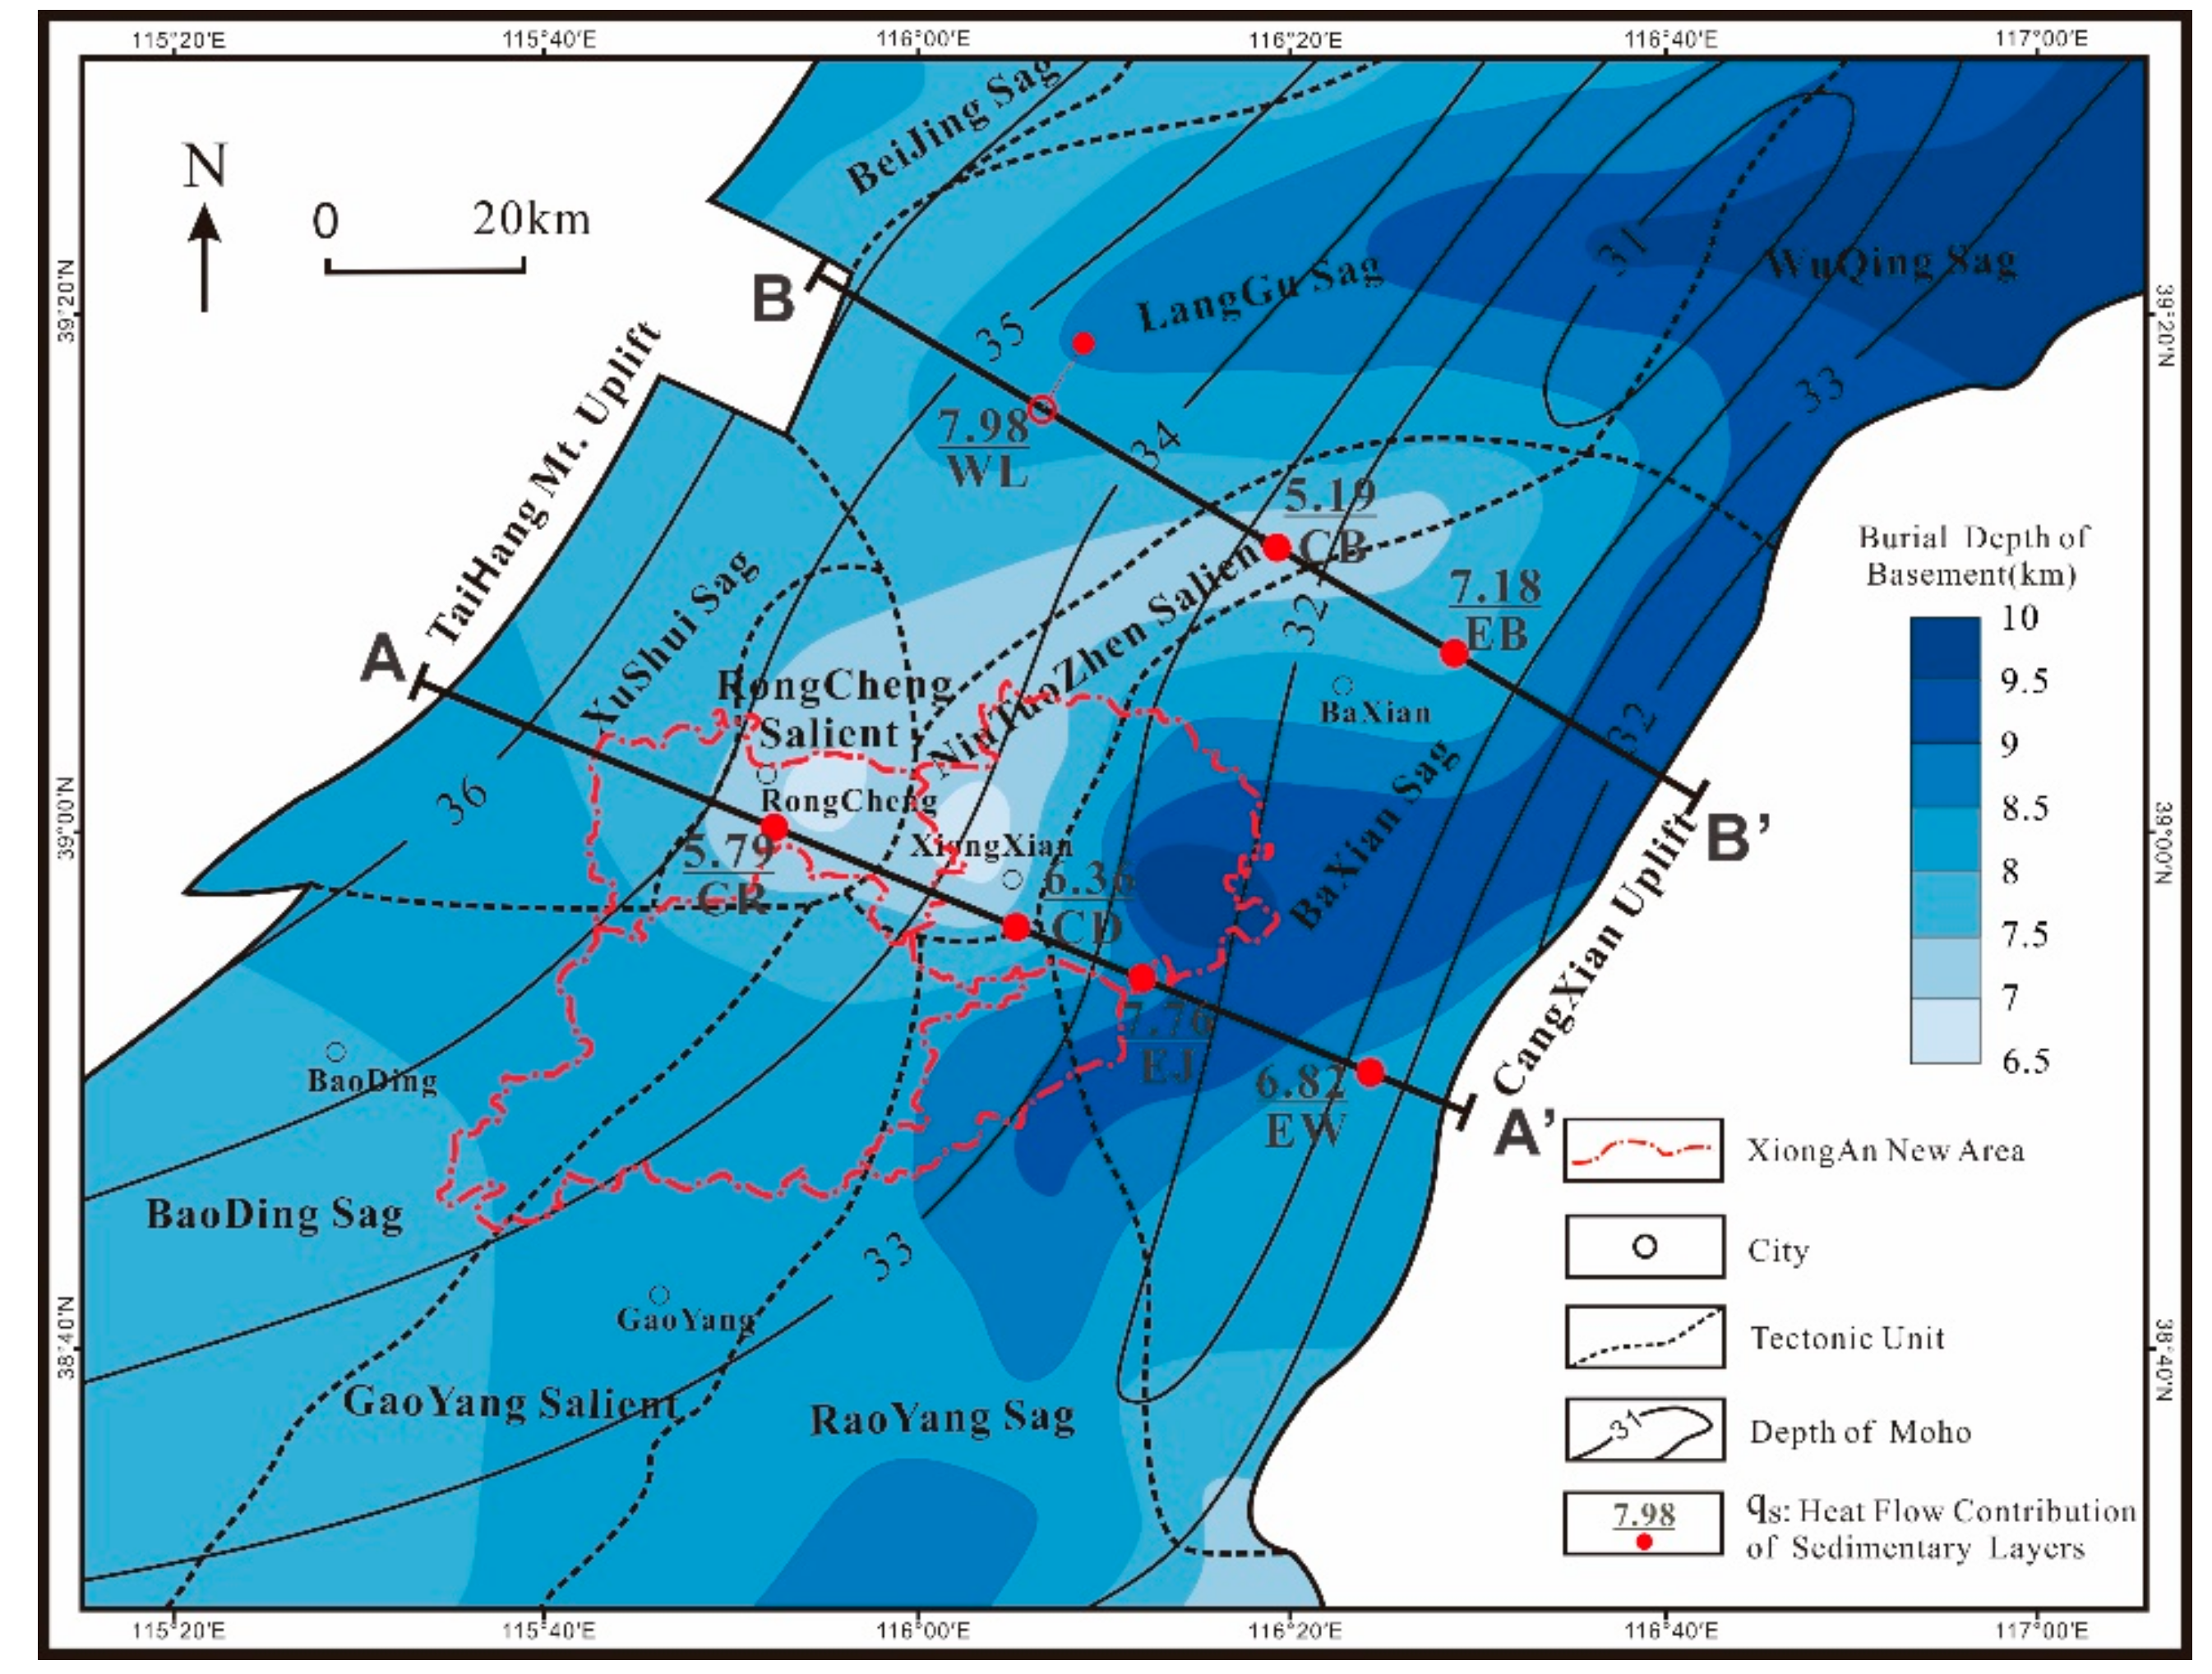
Previous studies demonstrated that heat flow was very low in the Jizhong depression, even lower than the average heat flow of the whole Bohai Bay basin [39,40,41,42]. Gong [40] studied Bohai Bay basin heat flow and found that it was in the range of 43.9–90 mW/m2 with an average heat flow of 61.1 ± 9.4 mW/m2. Jiang et al. [39] and Jiang et al. [43] calculated average heat flows for mainland China of 60.9 and 60.2 mW/m2, respectively, indicating that the Bohai Bay basin’s heat flow was higher than that of mainland China but lower than the average global heat flow of 65 ± 1.6 mW/m2 estimated by Pollack et al. [44]. We collected heat flow of 233 wells in and around the study area [42,43,45,46,47,48,49,50], and found that it was distributed zonally in the longitudinal direction (Figure 1b). To avoid heat flow calculation deviations caused by the limited number and uneven distribution of measurement points, heat flow in the study area was gridded at 5′ × 5′. Results showed that the area’s average heat flow was 61.5 ± 12 mW/m2. In the western sag adjacent to the Taihang Mountains, heat flow was 48.7–60.4 mW/m2 with an average value of 52.9 mW/m2; in the central salient, heat flow was 65.7–90 mW/m2 with an average of 69.2 mW/m2, and in the eastern sag, heat flow was 50.6–66.2 mW/m2, with an average of 57.9 mW/m2. According to the basement depth shown in Figure 4 and the surface heat flow shown in Figure 1b, it can be seen the geothermal field distribution corresponded well with the fluctuation of basement depth, i.e., the heat flow was high in the salient and low in sags.
Huang [32] pointed out that the heat flow in sedimentary layers is mainly related to the sedimentary environment and was unaffected by deep tectonic and lithospheric thermal structures. In order to prove the conclusion further, we chose seven wells in the two typical east–west sections. Owing to these seven wells having no cores, the samples were lacking. However, according to the logging curves of these wells, the lithological composition of each structural layer can be obtained, and the average radioactive heat production (A) of each structural layer can be calculated according to the lithological composition (Table 3), and the heat production contribution of each structural layer can be calculated according to the actual thickness (Table 4). It is worth noting that EB well is drilled against igneous rock, so its radioactive heat production is lower than the average heat production of other wells in the Paleogene strata.
We calculated the thermal contribution of sedimentary layers in the study area based on the weighting of the rock composition (Table 3 and Table 4) with an average heat production of 0.81–1.06 μW/m3. This is in line with the upper limit of crustal heat production in mainland China of 1.3 μW/m3 proposed by Wang et al. [51]. The sedimentary layer heat production was the largest in the western sag at up to 7.98 mW/m2, whereas in the central salient and eastern sag it was 5.19–6.36 and 6.82–7.76 mW/m2, respectively, with respective contributions of 13.02%, 6.94–9.68%, and 11.88–14.21% in the western sag, central salient, and eastern sag.
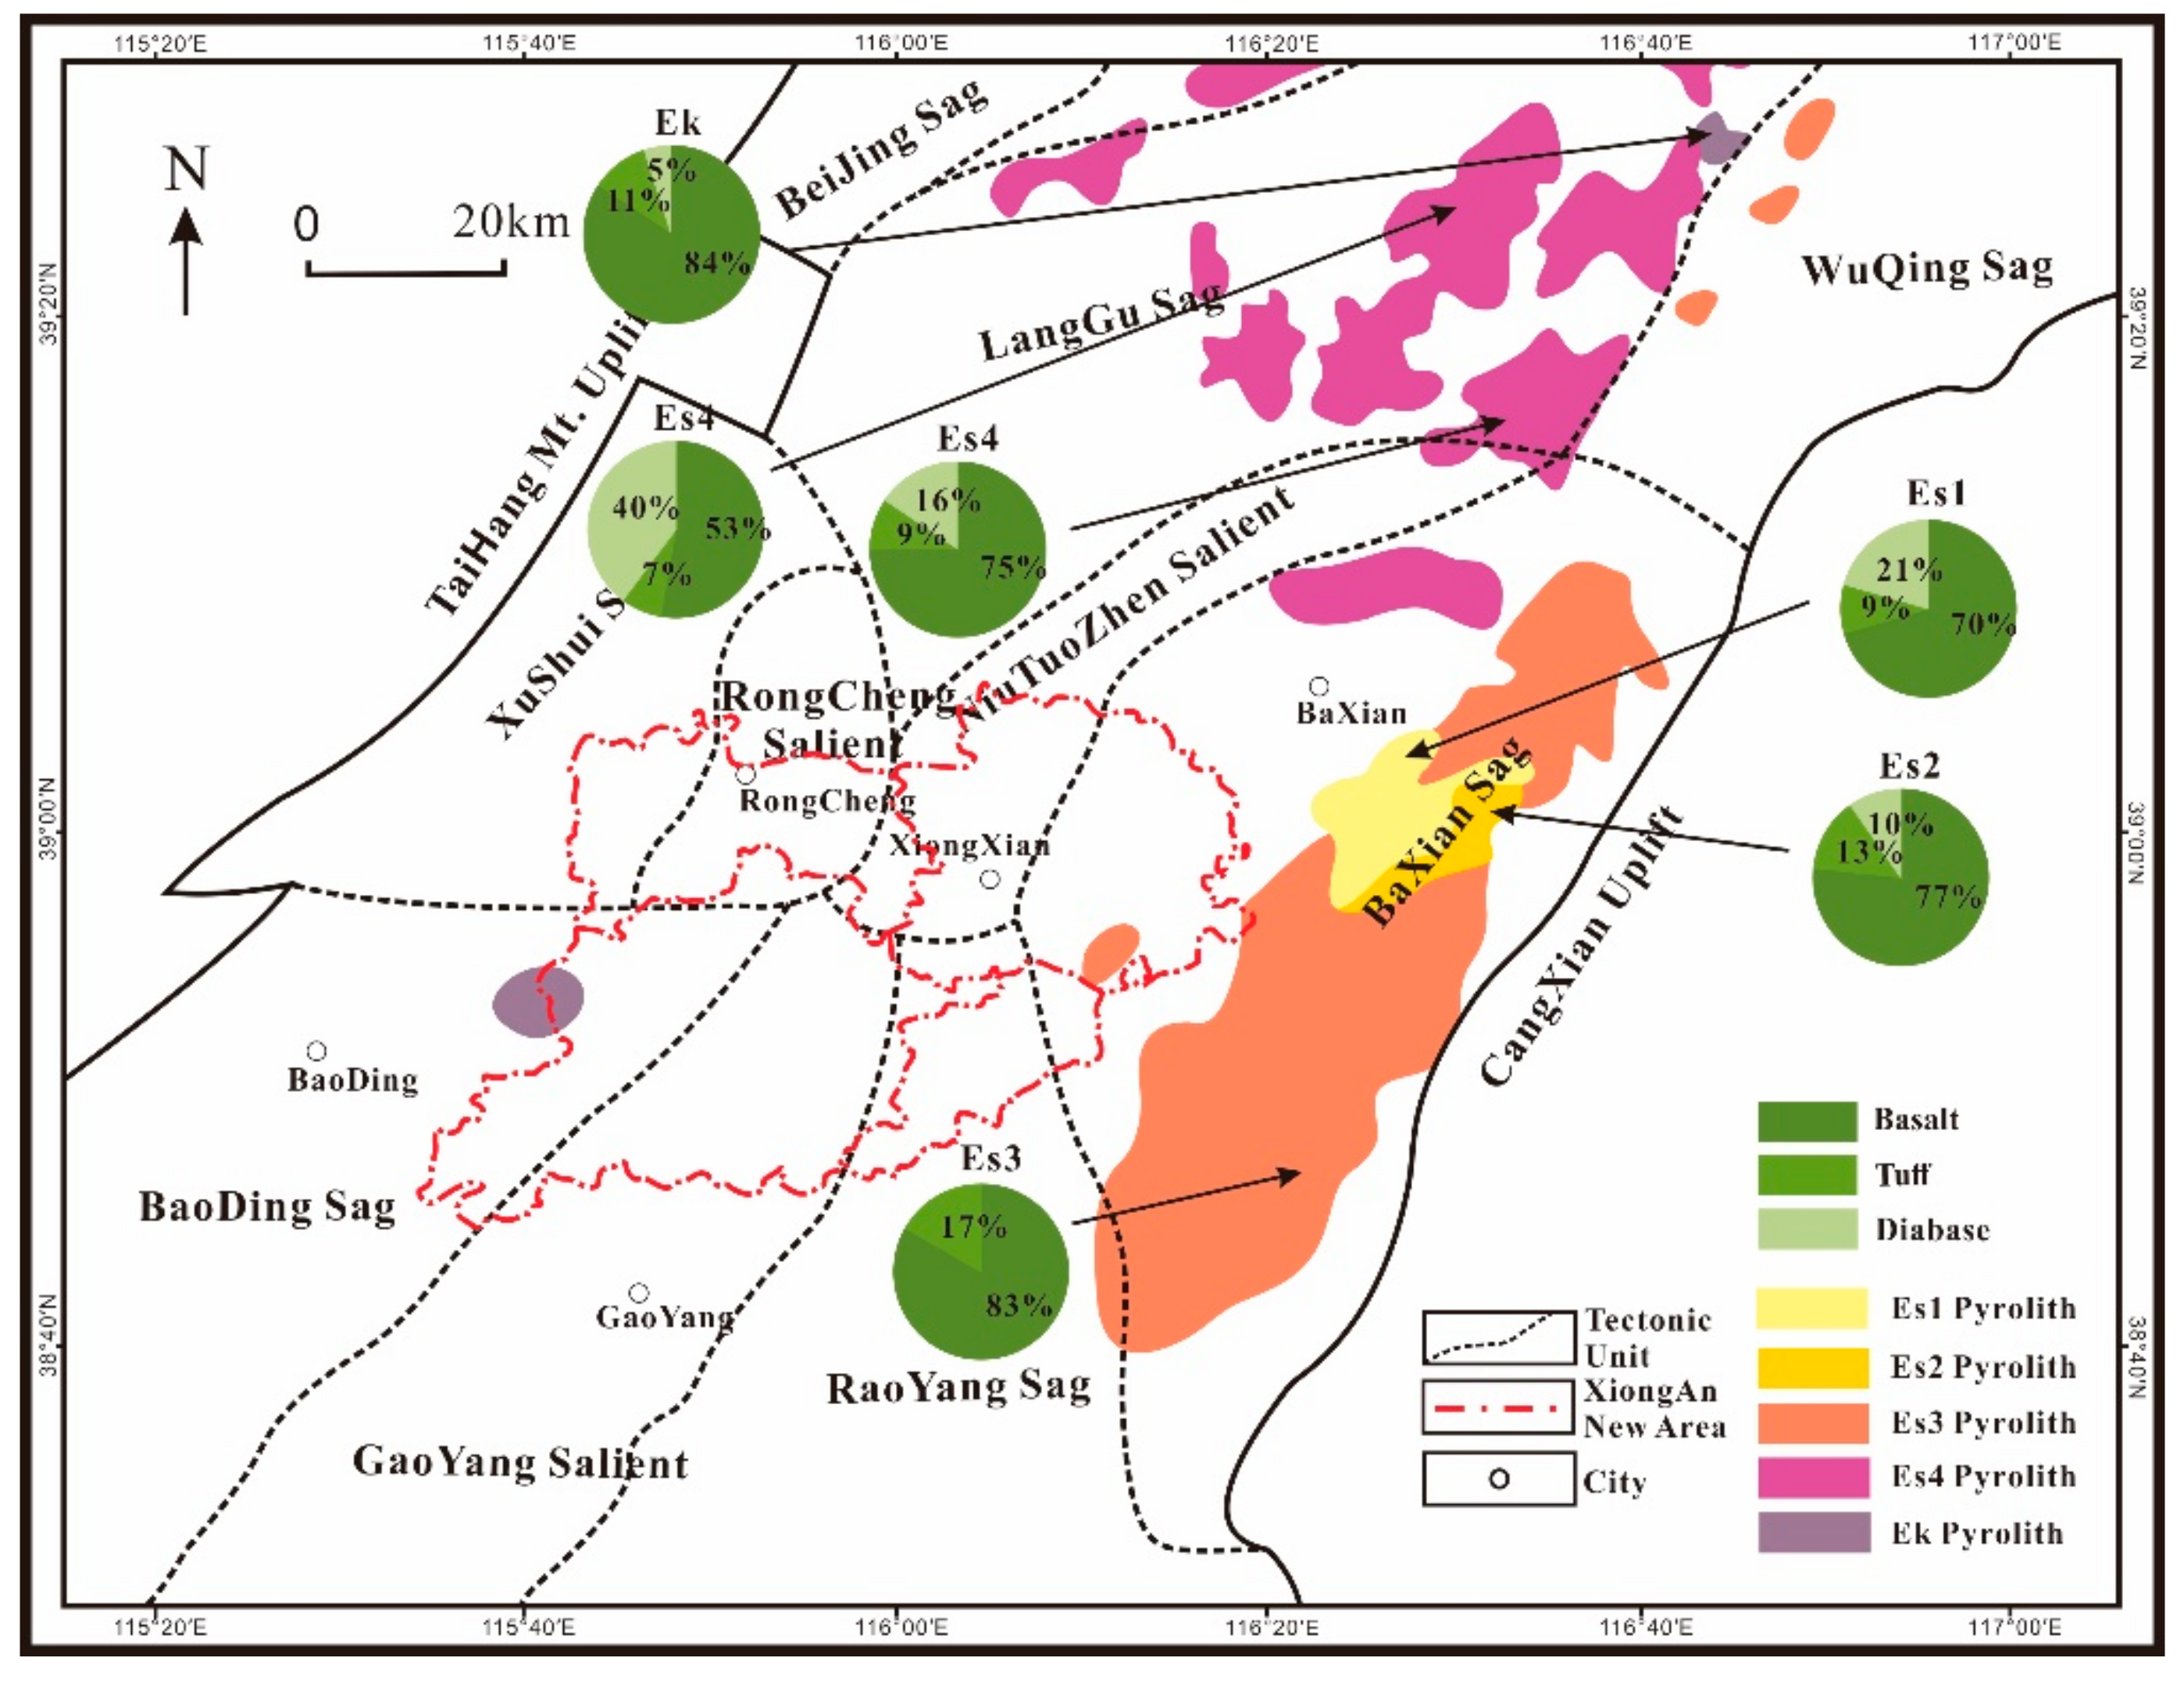
Ancient period igneous rocks were rare in the study area. The basalt and orbite samples from the late Lvliang period (1.65–1.8 Ga) measured herein were significantly thin to affect heat flow in the present sedimentary layers. Cenozoic igneous rocks were mainly from the Shahejie period and were to the east of the Baxian sag and north of the Langgu sag (Figure 5). The thermal effects of these rocks were not large enough to affect the present geothermal field [52,53]. Based on the logging information, these intrusions had a lithology of mainly basalt (Figure 5). Based on the empirical relation between natural gamma-ray logging and heat production, Cenozoic igneous rocks had a heat production of 0.32–0.88 μW/m3, which is lower than that of sandstone and mudstone in the Shahejie formation the igneous rocks intruded. Since these intrusive bodies were usually less than 300 m thick, their thermal contributions were less than 0.26 mW/m2. On the contrary, the minimum thermal contribution of sandstone and mudstone with the same thickness in the same sedimentary layer was 0.38 mW/m2. The Cenozoic igneous intrusion presumably reduced heat flow in the sag to a certain extent. Corresponding to the distribution of Cenozoic igneous rocks and heat flow changes, we found that heat flow tended to be low in developmental areas. However, owing to the small thickness of the igneous rock intrusion, the change in heat flow was also very small; therefore, the influence of igneous rocks was negligible relative to heat production in the sedimentary layers.

4.2. Crust Heat Flow Contribution and Terrestrial Heat Flow

Heat flow in the sedimentary basin mainly comprised heat production due to decay of radioactive elements, such as U, Th, and K, from the shallow crust and heat flow from the upper mantle. Blackwell [54] proposed the concept of lithospheric thermal structure, which was the heat flow distribution ratio of crust and mantle and its relation in one region. Theoretically, there was a linear relation between heat flow and heat production of rock layers in one area with the intercept being mantle heat flow [55]. However, there were still some problems with using this linear relation in sedimentary basins [56]. Therefore, Wang et al. [57] calculated mantle heat flow by establishing a crustal stratification model and adopting a ‘stripping back’ method. The heat flow formula is as in Equation (2) as
qm = q0 − qc = q0 − ∑AiDi,
where qc, qm, and q0 are the heat flow (mW/m2) of crust, mantle, and surface, respectively, Ai is the radioactive heat production of layer i (μW/m3), and Di is the thickness of layer i.
Combined with previous research results, it was found that salient heat flow was higher with the sedimentary layer contributing less, whereas heat flow in the sag was lower with a greater contribution from the sedimentary layer. Due to the study area’s small size, mantle heat flow changed little. Therefore, when assuming consistent mantle heat flow, heat flow differences in the study area depended mainly on heat production of the crust. In general, owing to the magmatic hydrothermal activity, radioactive elements were concentrated from the middle crust to the lower and upper crust [51,58]. Based on research on heat generation in typical continental crust profiles, heat production in the middle and lower crust was approximately 0.2–0.4 μW/m3 [59,60,61]. Therefore, the mean heat production value of the crust of 0.8–1.0 μW/m3 from Wang et al. [51] was used, and mantle heat flow was 32.43 mW/m2, as calculated by Chang et al. [42]. The mean crustal heat flow from the western sag to the central salient to the eastern sag was 16.27–27.97, 33.27–41.07, and 18.17–33.37 mW/m2, respectively, and crustal thickness—i.e., Moho surface depth—was estimated to be 19.2–32.9, 39.1–48.3, and 21.4–39.3 km, respectively. Obviously, the Moho depth in the study area would not change so much, and this result was also inconsistent with Moho surface depths of 30–35 km obtained by deep geophysical detection [60]. Therefore, it is speculated that the current heat flow was affected to some extent by groundwater expect from the conductive terrestrial heat flow, which is lower in the sags and higher in the salient.
Based on drilling data, previous research results [60,61,62,63,64,65], and deep geophysical exploration results “the crust and upper mantle seismic wave velocity structure model v2.0 in North China” (http://www.craton.cn/data), we set up a different tectonic zone crustal structure model for the study area. The Proterozoic strata and strata before they were calculated based on drilling data, and the interface thickness of the upper, middle, and lower crust was determined based on seismic wave velocity distribution and data from Gong [40] and Duan et al. [62]. It was shown that the Moho surface depth had an inverse relation with basement fluctuations in deep physical detection (Figure 4), which is similar to previous research [17].
However, the Jizhong depression, where the study area is located, is in the western portion of the Bohai Bay basin and its west side is adjacent to the Taihang Mountains. The destruction of the NCC in the Mesozoic–Cenozoic caused the lithosphere to undergo tensile thinning, with different degrees of thinning [66]. According to the seismic data, Duan et al. [62] believed that the crust in the Jizhong depression was gradually thinning from west to east.
Therefore, three tectonic area crustal stratification models were proposed, and the average heat production columns of each layer were established (Table 5). Shallow strata heat production was obtained by this measured value, upper crust heat production was determined using measured values of Archaean metamorphic rocks and data from previous research [15,67], and middle–lower crust heat production was quoted from the results of Chi and Yan [68] on deep rocks in north China.
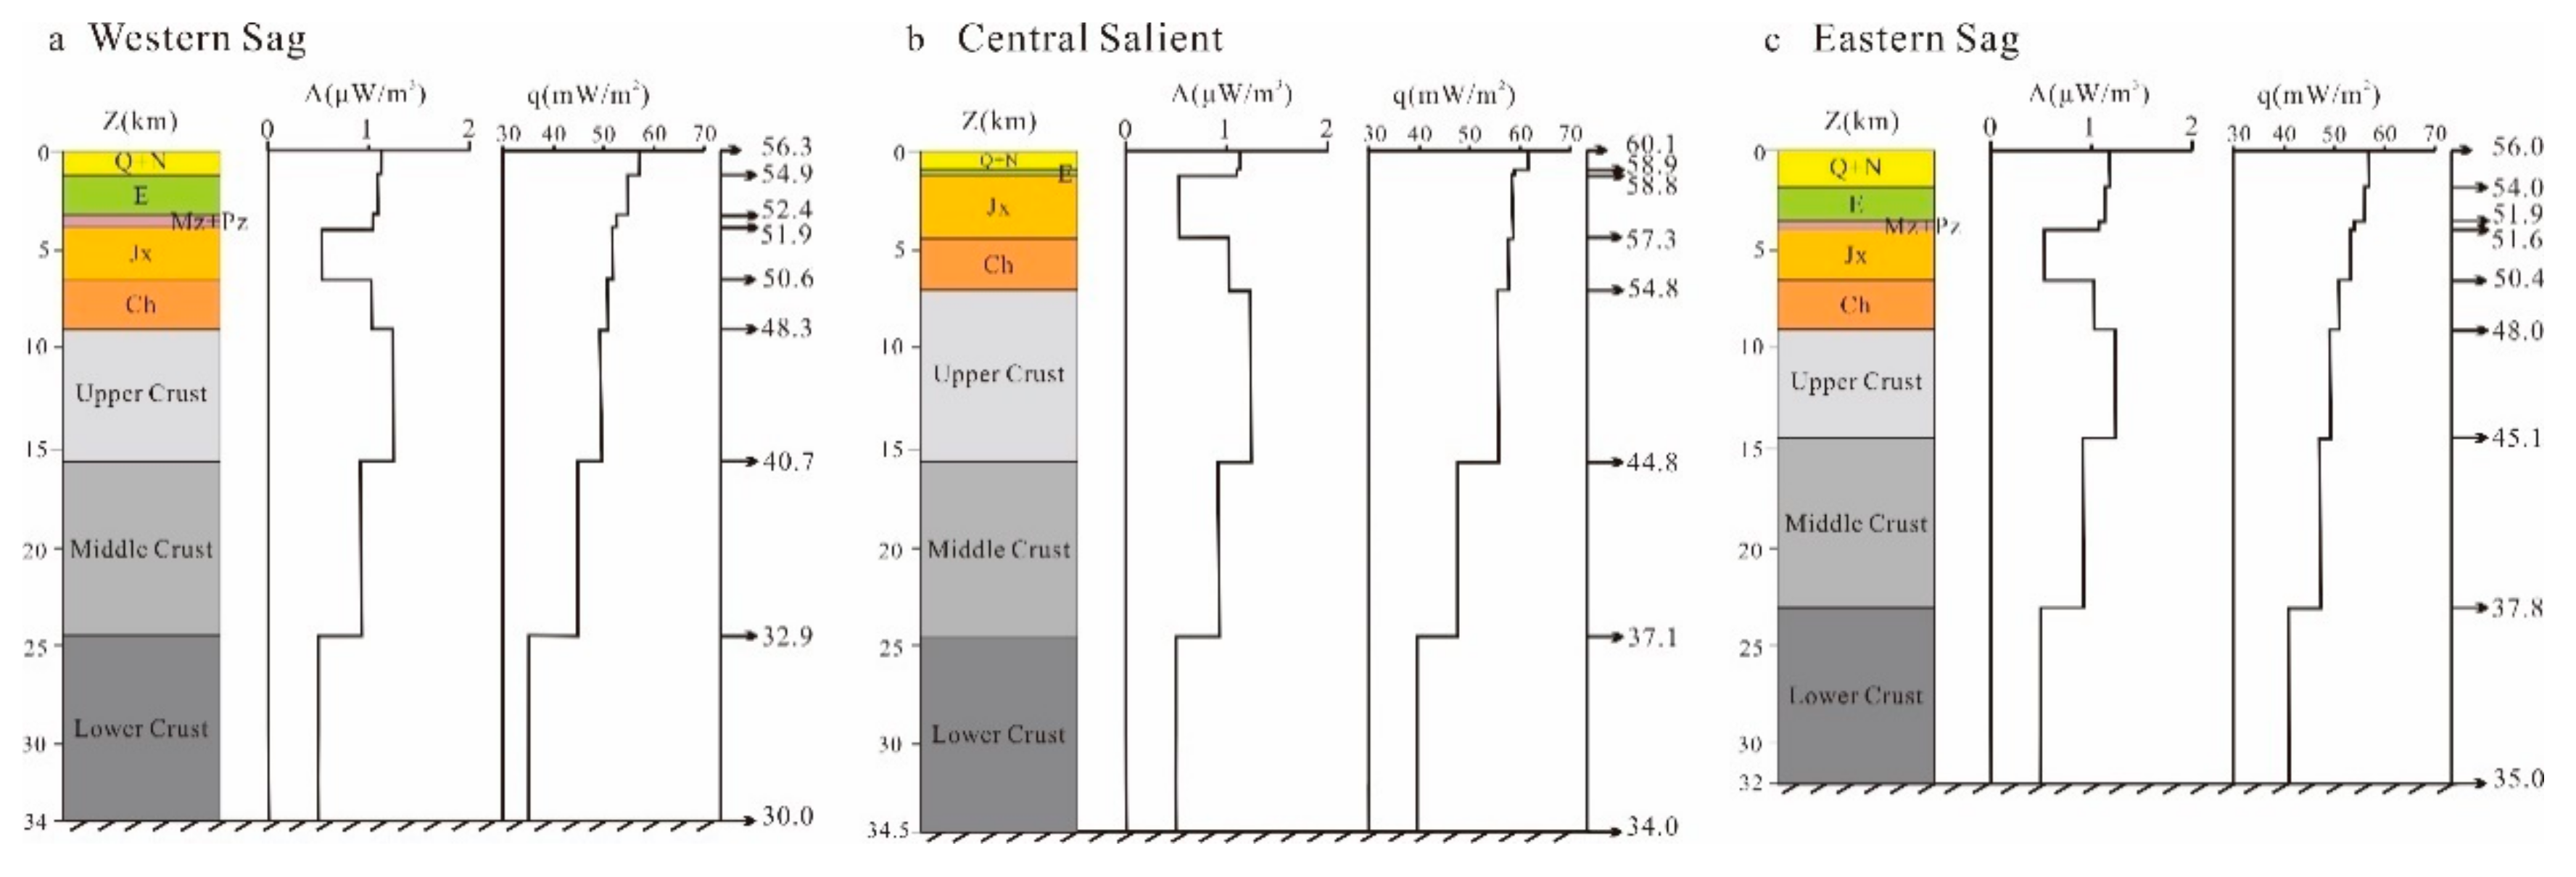
Considering the effects of cold water and underground hot water disturbances on the Langgu sag, Niutuozhen salient, and Rongcheng salient, we used Jizhong depression mantle heat flow values calculated by previous studies when calculating the conductive terrestrial heat flow of the three tectonic areas [40,42,68,69,70] to restore present heat flow without hydrodynamic influence through forward modeling. Zhang simulated the mantle heat flow in the eastern part of the North China Craton and believed that the heat flow increased from west as 24 mW/m2 to east as 44 mW/m2. However, within this small area of Jizhong depression, the mantle heat flow changes not obviously. Therefore, according to the trend of Moho depth gradually shallower from west to east as shown in Figure 4, as well as the value of mantle heat flow of Chang et al. [42], we made a small range of modifications to its model. For mantle heat flow in the three tectonic areas from west to east, values of 32, 34, and 33 mW/m2 were selected. From the parameters provided in Table 5, crustal heat flows in the western sag, central salient, and eastern sag tectonic areas were 27, 26.2, and 25.5 mW/m2, respectively, and the respective conductive terrestrial heat flows were 59, 60.2, and 58.5 mW/m2, respectively (Figure 6).
The observed heat flow distribution in the study area [43,45,47,71] revealed a slight higher heat flow in the Bohai Bay basin comparing to the mainland China, with an average value of 68.9 mW/m2 [43,45], but a normal heat flow in the Jizhong depression, with an average value of 63.1 mW/m2, which may represent the regional thermal background [47]. Specific to the Jizhong depression, low heat flow is obviously distributed in the sub-depressions, the heat flow in the main area of Baxian, Raoyang, Baoding, and Xushui sags are lower than 60 mW/m2 (i.e., 48.9–61.6 mW/m2 in the Baxian sag) [45,47,71] (Figure 1b). Li et al. [47] calculated out the average heat flow of 3 geothermal wells in the Rongcheng salient and considered it (63.81 mW/m2) as the heat flux in the cap layers. Given the enhanced thermal disturbance by water convections in the geothermal field in uplifting areas, the conductive heat flow should be lower. Thus, our calculated conductive heat flows are reasonable and consistent with the observed values in the areas with weak disturbances.
There are some differences between the forward results and measured heat flow—i.e., calculated conductive terrestrial heat flow value in the central salient was lower—whereas the western sag value was higher and eastern sag value was close to measured heat flow. Previous research has pointed out the influence of groundwater activities on geothermal fields in north China [40,71,72] and heat flow measured by drilling did not reflect real geothermal conditions. The heat flow in the Langgu sag was low due to the influence of piedmont cold water, whereas that in the Niutuozhen salient and the Rongcheng salient was high owing to the influence of upwelling of underground hot water along the fault zone [40,71,72]. The difference between these tectonic areas was close to the influence of underground cold water and hot water on geothermal gradients simulated by Chen [69], i.e., the area affected by piedmont cold water in the western sag differed from the measured values by 4 °C/km and central salient area affected by deep hot water differed from the measured values by 7–15 °C/km. Based on a thermal conductivity estimate of 1.72–1.95 W/mK, heat flow differences were 6.88–7.8 and 12.04–29.25 mW/m2, respectively.
By comparing the crustal and other layers bottom heat flow, it was found that the heat flow difference first increased and then decreased with a change in depth. At the bottom of the Paleozoic strata, the heat flow difference was its maximum at up to 6.5 mW/m2. Results demonstrated that the heat flow had a strong relation with the combination of varying thickness and heat production. However, it was found that the tectonic zone near the Taihang Mountain had a smaller degree of crustal thinning; therefore, the crustal heat flow contribution was higher there than in the other two areas.
Based on the heat flow distribution in the mantle and crust, Wang [73] proposed “cold crust-hot mantle” and “hot crust-cold mantle” concepts to explain the basin’s crust-mantle heat flow contribution. When crustal heat flow contribution exceeds 50%, it is considered that the crust is hot and the mantle is relatively cold (i.e., “hot crust-cold mantle”). The reverse situation would thus be considered as “cold crust-hot mantle”. Crustal heat flow in the three tectonic areas herein are all smaller than that of the mantle heat flow with ratios of 0.88, 0.77, and 0.6 from west to east, respectively, which obviously show a “cold crust-hot mantle” type.
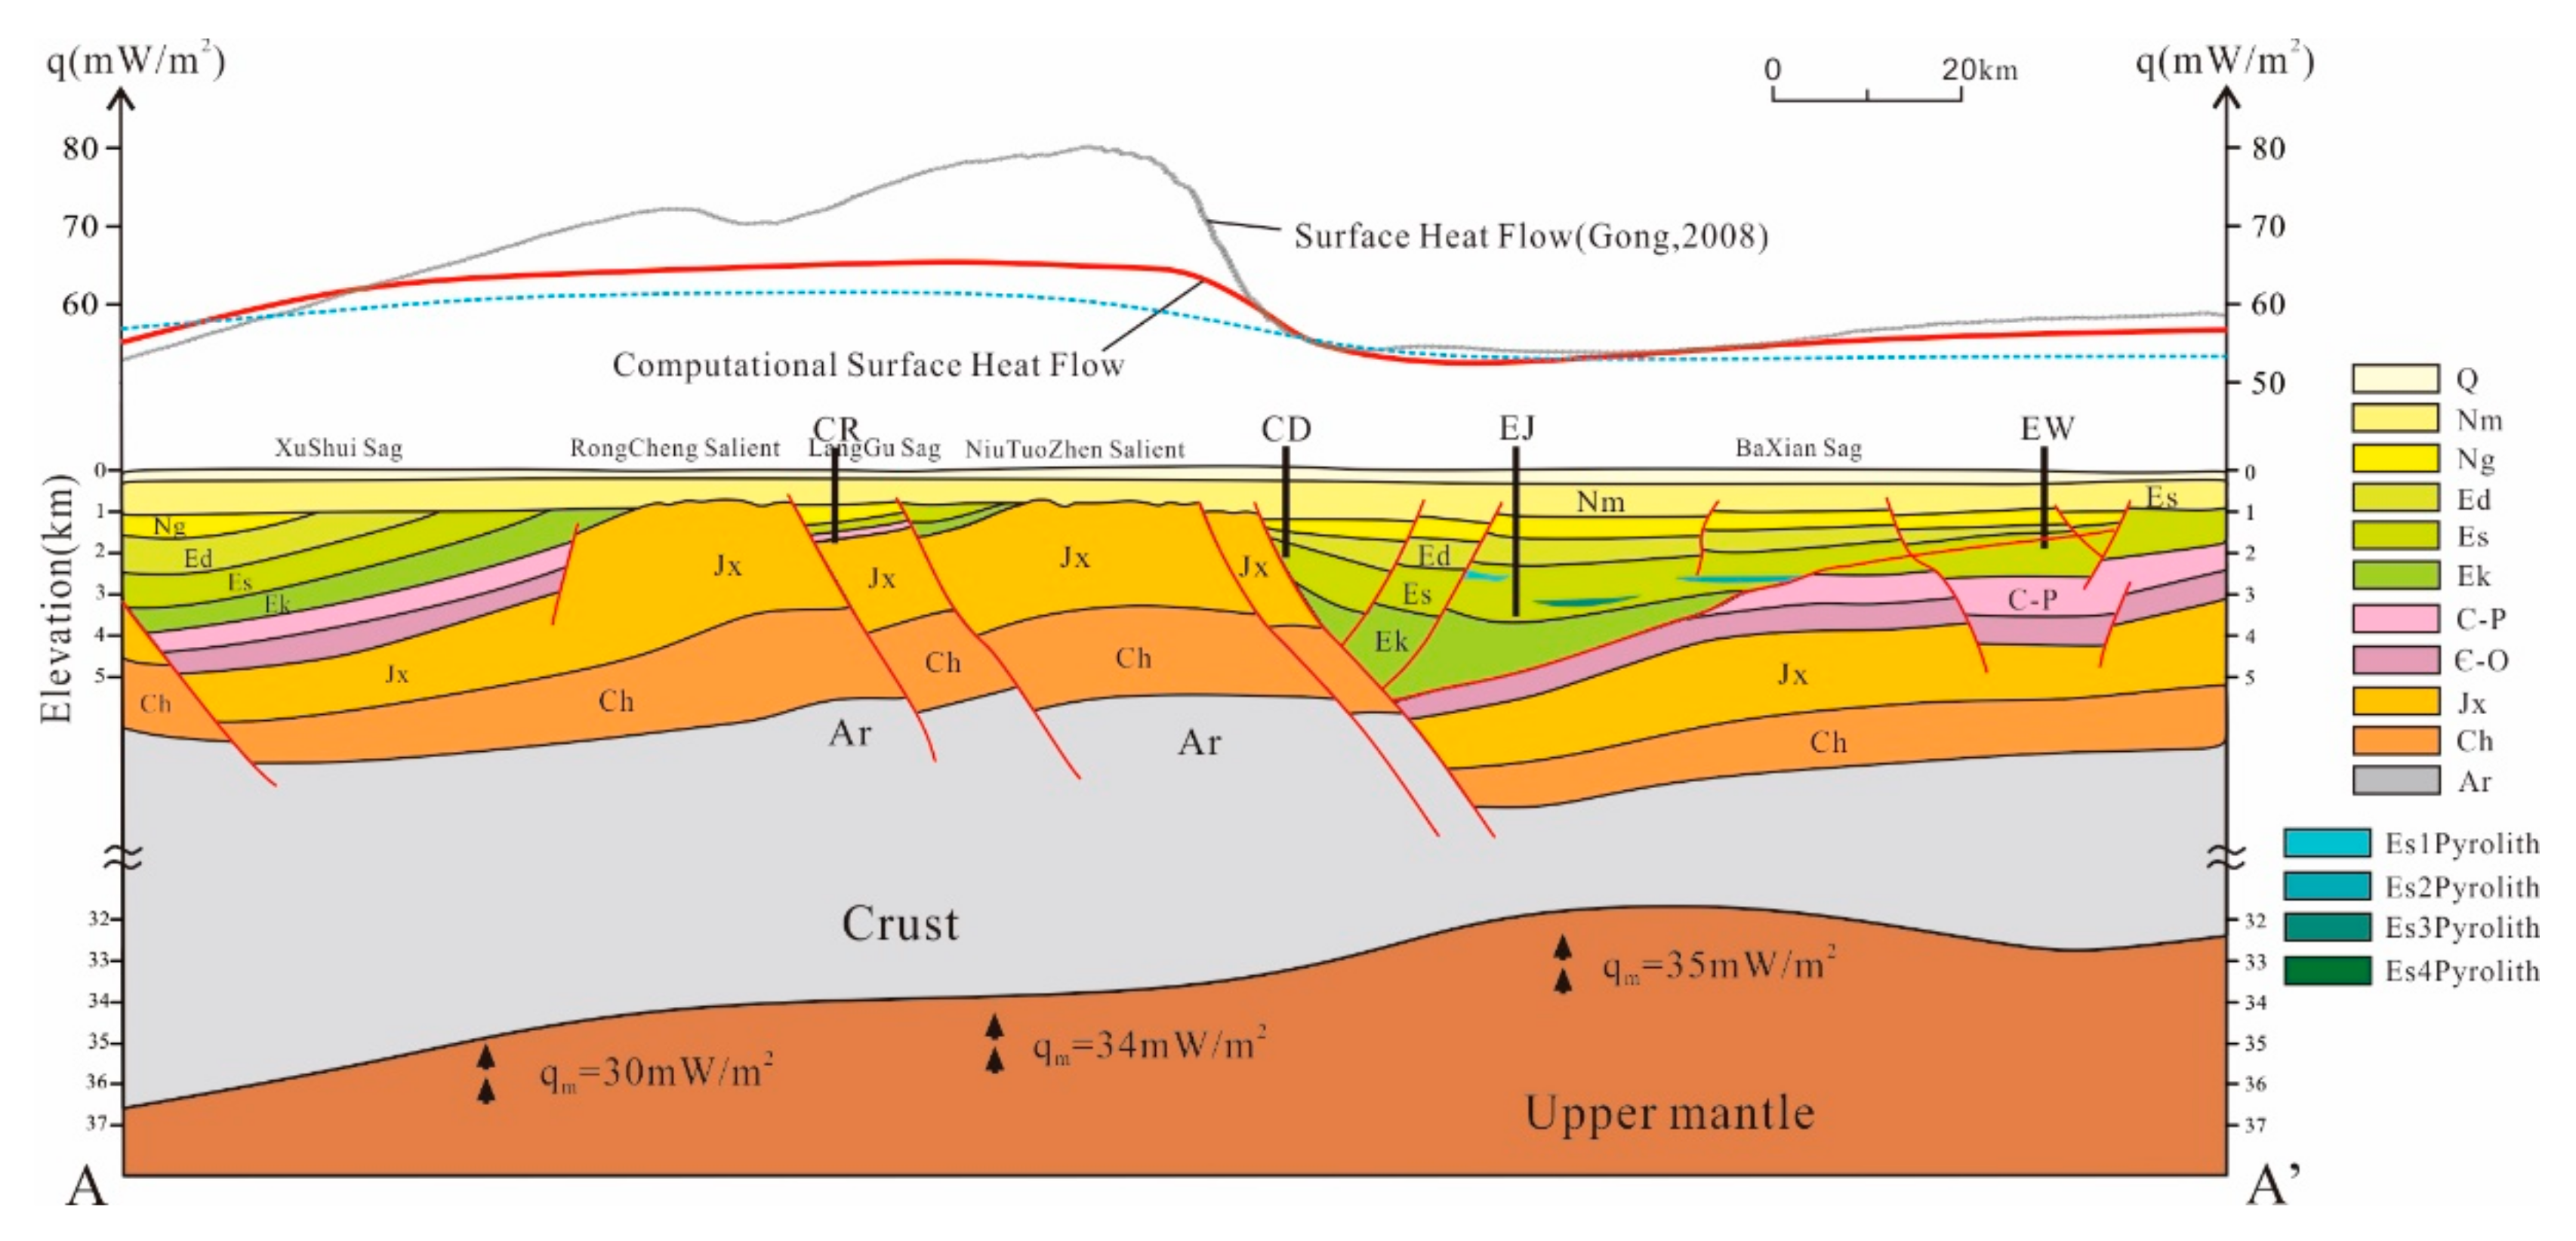
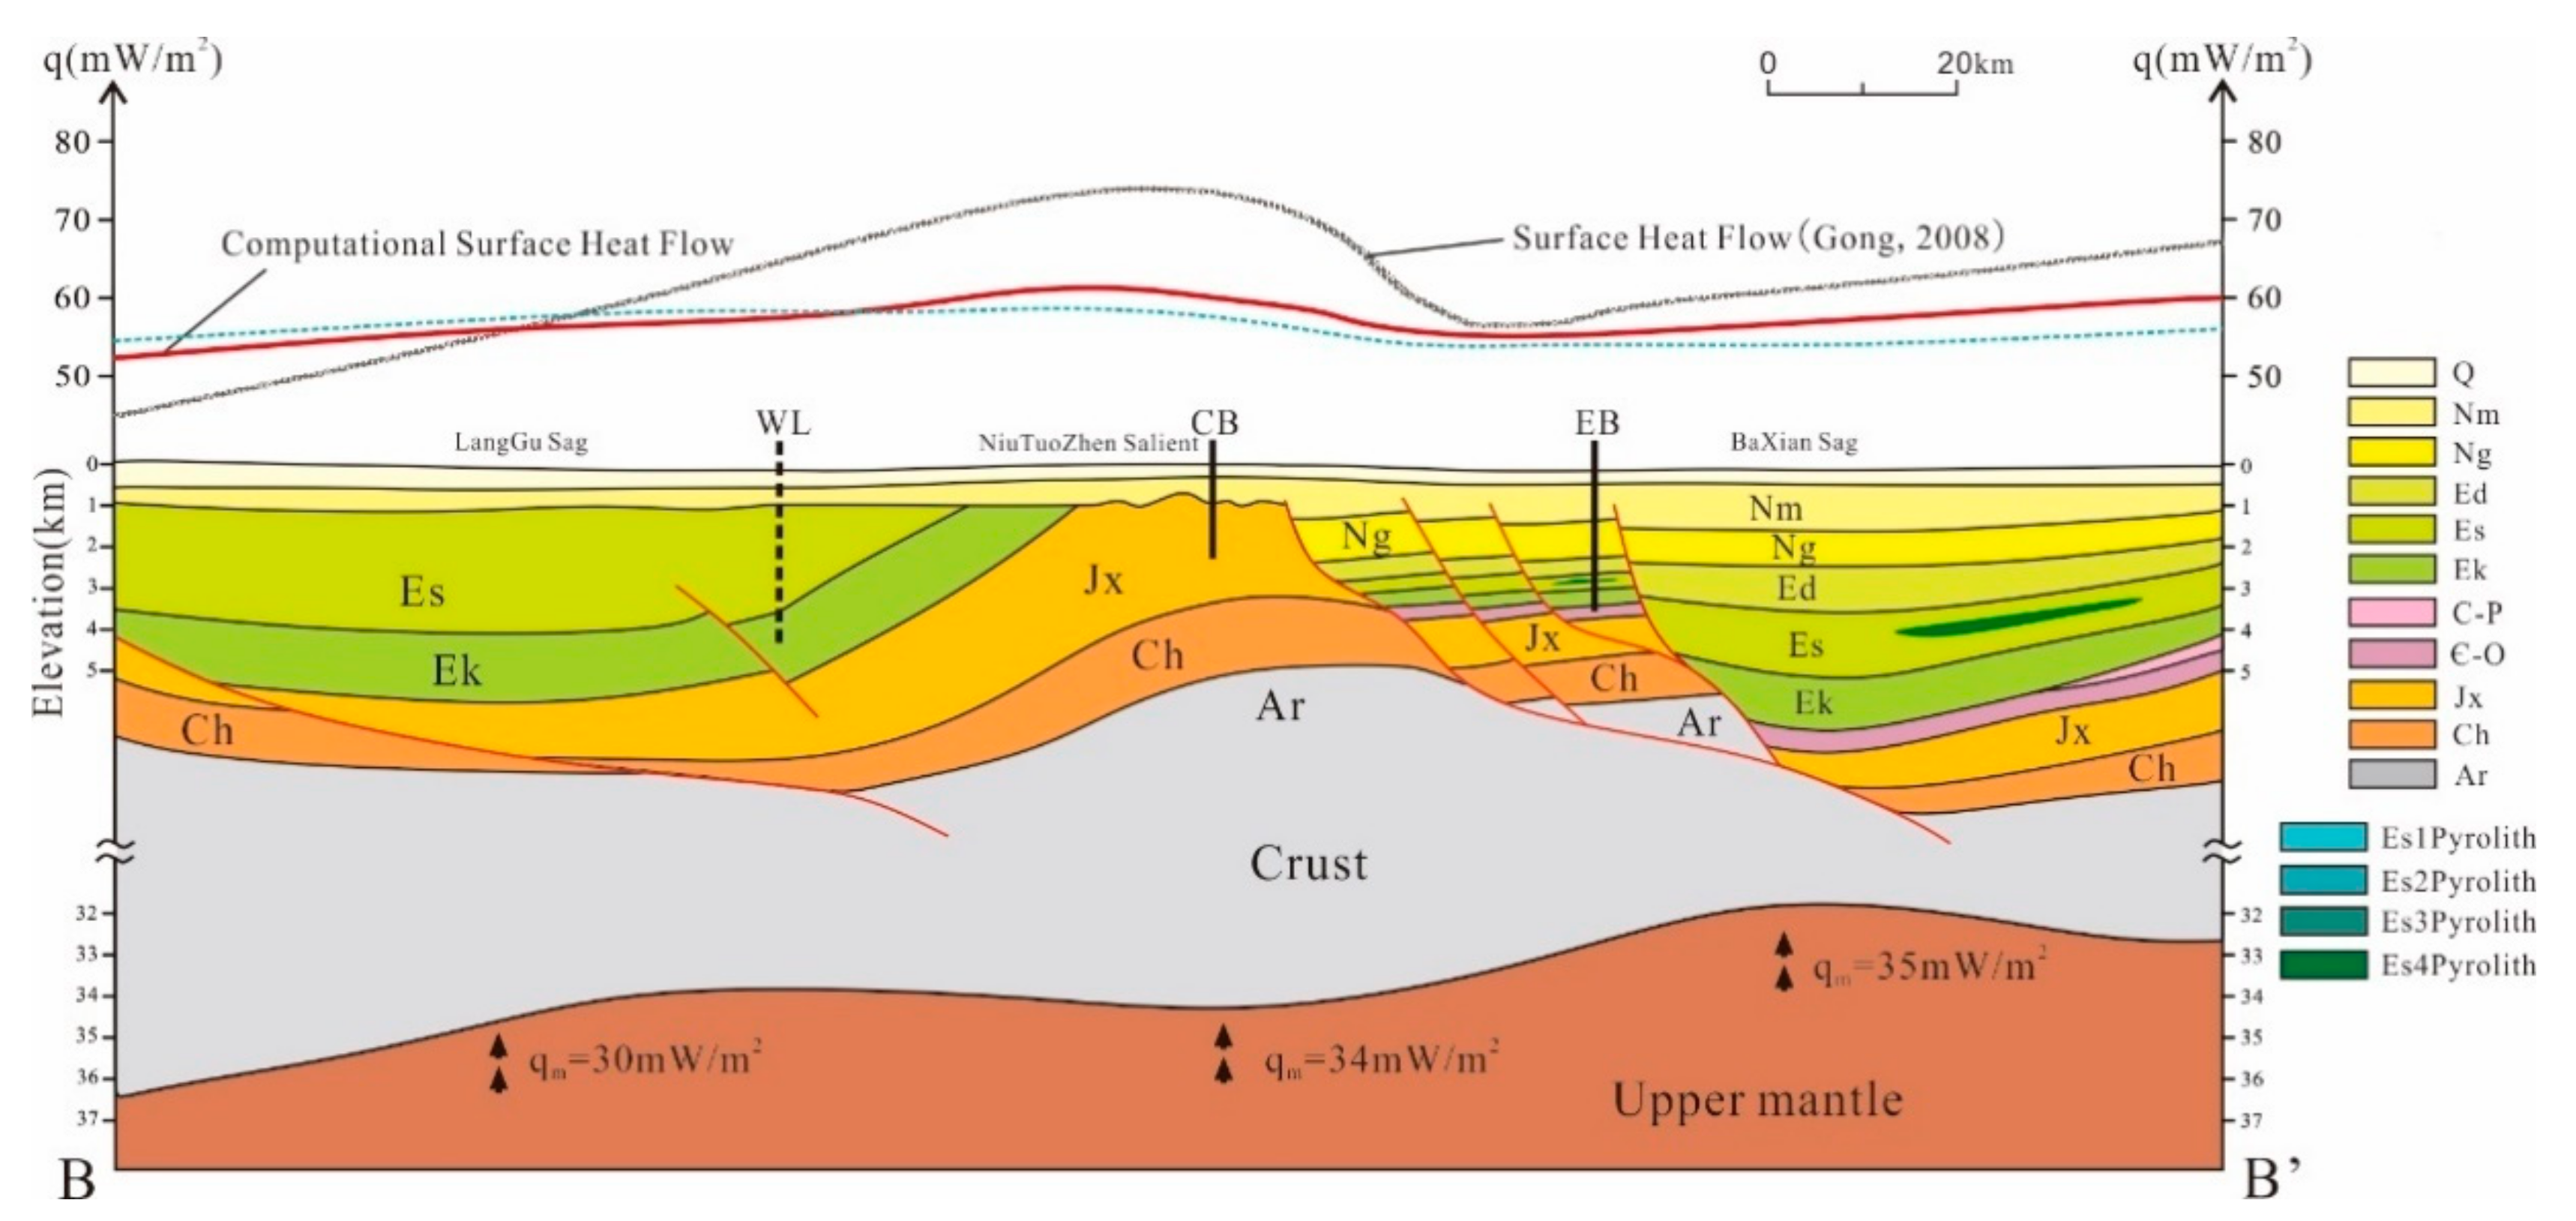
Based on geological models of the AA’ and BB’ sections established by geophysical prospecting data in the study area, conductive terrestrial surface heat flow of these two sections was calculated using heat generation rate parameters shown in Table 5 (Figure 7 and Figure 8). The AA’ section passed through the Xushui sag, Rongcheng salient, Niutuozhen salient, and Baxian sag from west to east. The BB’ section passed through the Langgu sag, Niutuozhen salient, and Baxian sag from west to east. The gray heat-flow lines in Figure 7 and Figure 8 were heat flow data from previously published research, and the heat flow corresponded well with basement fluctuations. The red heat flow lines in Figure 7 and Figure 8 were forward calculation conductive terrestrial data based on mantle heat flow. The blue heat flow lines in Figure 7 and Figure 8 were calculation conductive terrestrial data obtained by assuming that the mantle heat flow was constant as 32 mW/m2. The difference of the heat flow between the red lines and the blue lines are very small, indicating that the difference of mantle heat flow has little influence on the surface heat flow. Moreover, the differences between the grey lines and the red lines reflect ground water activity influence on the geothermal field. In the Langgu sag, due to the proximity of the Taihang and Yanshan mountains, the shallow formation temperature and geothermal gradient were reduced due to the influence of cold water infiltration in front of the mountains, and thus the measured heat flow value was lower [69]. On the contrary, in the Niutuozhen and Rongcheng salients, deep groundwater was heated by deep strata and convection occurred along the well-opening faults and Proterozoic carbonate reservoirs, thus bringing deep heat to the shallow layer [71,72], resulting in a high measured heat flow value in the shallow layer and high heat flow anomaly area, namely a geothermal field.

5. Conclusion

Most sedimentary rocks in the study area had heat production values of less than 1.50 μW/m3. The average heat production values of sandstone, siltstone, and mudstone are 1.43 ± 0.44, 1.27 ± 0.14, and 0.97 ± 0.37 μW/m3, respectively. The heat production of marine clastic rocks is slightly higher than that of continental clastic rocks, and dolomite’s overall heat production is lower, i.e., 0.34 ± 0.47 μW/m3. In continental sedimentary rocks, the contributions of U, Th, and K to heat production are 51–72%, 22–37%, and 6–12%, respectively. The low heat production is mainly related to the sedimentary environment and provenance.
The average heat production of the sedimentary layers in the study area is 0.81–1.06 μW/m3. The western sag produced the greatest contribution at up to 7.98 mW/m2, whereas in the central salient and eastern sag, it is 5.19–6.36 and 6.82–7.76 mW/m2, respectively. The contribution rates of heat production of the sedimentary layer for the western sag, central salient, and eastern sag are 13.02%, 6.04–9.68%, and 11.88–14.21%, respectively.
The Moho depths in the study area are 34, 34.5, and 32 km from west to east, respectively; the mantle heat flows are 30, 34, and 35 mW/m2, respectively; and the conductive terrestrial heat flows obtained by forward calculation are 56.3, 60.1, and 56 mW/m2, respectively. The differences between the conductive terrestrial calculated and measured heat flows are due to the disturbance of groundwater activities on the geothermal field. The crust–mantle heat flow ratios for the western sag, central salient, and eastern sag are 0.88, 0.77, and 0.6 respectively, which reveal a ‘cold crust-hot mantle’ type in the study area.

Author Contributions

Methodology, Y.C.; Investigation, Y.C., B.T., and S.G.; Resources, C.Z.; Data Curation, Y.C.; Writing—Original Draft Preparation, Y.C.; Writing—Review and Editing, Chuanqing Zhu; Visualization, Y.C.; Supervision, C.Z.; Project Administration, C.Z. and N.Q.; Funding Acquisition, C.Z. and N.Q.

Funding

The study was supported by the “National Key Research and Development Program” of China (grant no. 2018YFC0604302), and the Beijing Training Project of Science and Technology Nova and Leading Talent (grant no. Z171100001117163).

Conflicts of Interest

The authors declare no conflict of interest.

Nomenclature

q0Heat flow of surface (mW/m2)
qsHeat flow of sedimentary (mW/m2)
qcHeat flow of crust (mW/m2)
qmHeat flow of mantle (mW/m2)
ρDensity (kg/m3)
ARadioactive heat production (μW/m3)
DThickness (m)
CUContents of U (mg/g)
CThContents of Th (mg/g)
CKContents of K (wt %)

Appendix A

Table A1. Radioactive heat production values of the Xiong’an area
SampleDepth (m)StrataLithologyρ238U232Th40KAUAThAKA
No.Well Name(g/cm3)(μg/g)(μg/g)(%)(μW/m3)(μW/m3)(μW/m3)(μW/m3)
1B213437Odolomite2.490.830.820.140.200.050.010.26
2Bs22480Es1mudstone2.253.028.081.580.650.470.121.24
3B32415Ed3mudstone2.293.258.742.520.710.510.201.42
4G582570Es1siltstone2.444.555.141.141.060.320.101.47
5G73179Eksandstone2.501.156.051.850.270.390.160.82
6Gs1-43807Jxydolomite3.000.320.060.020.090.000.000.10
7Gs1-54275Chgbasalt2.680.632.646.410.160.180.600.94
8Gs1-74938Chtdolomite2.943.0911.209.910.870.841.012.72
9Gs1-85008Chtdolomite3.301.615.773.170.510.490.361.36
10Gs1-95390Chchsiltstone2.841.749.103.530.470.660.351.48
11Gs1-105546Chcsandstone2.831.8712.005.630.500.870.561.93
12B161623Ed1sandstone2.392.1210.502.380.480.640.201.32
13B603014Ed3sandstone2.392.1710.502.380.490.640.201.33
14R4-14011Es2siltstone2.392.4010.702.300.550.650.191.39
15R4-34977Jxwdolomite2.570.610.080.020.150.010.000.16
16R33169Es1siltstone2.351.729.312.000.380.560.161.11
17R9-34190Jxwdolomite2.840.330.080.020.090.010.000.10
18N251256Cdolomite2.184.640.180.030.970.010.000.98
19N28-11222Chmudstone2.254.8826.903.421.051.550.272.86
20N28-21227Chmudstone2.254.6126.403.390.991.520.272.77
21N71218Odolomite2.560.450.830.290.110.050.030.19
22B15586Es4dolomite3.110.240.510.030.070.040.000.12
23B2-15325Es4sandstone2.393.4213.704.040.780.840.341.95
24B2-25988Jxwdolomite3.030.410.720.250.120.060.030.20
25N61089Jxwdolomite2.790.831.550.580.220.110.060.39
26R266-13180Jxwdolomite3.371.843.141.870.590.270.221.08
27R266-23182Jxwdolomite2.580.580.090.030.140.010.000.15
28R266-33201Jxwdolomite2.981.490.180.070.420.010.010.44
29R266-53336Jxwdolomite2.980.180.030.010.050.000.000.05
30R482698Jxwdolomite2.570.640.040.010.160.000.000.16
31B121638Ngsandstone2.392.064.352.850.470.270.240.97
32X1-11048Nmsandstone2.504.9512.501.471.180.800.132.11
33X1-21055Nmdolomite2.390.140.130.060.030.010.000.04
34X31747Ed3dolomite2.650.230.060.020.060.000.000.06
35X42128Es1dolomite2.770.650.250.140.170.020.010.20
36X2-11331Eddolomite2.620.360.040.020.090.000.000.09
37X2-21333Eddolomite2.530.330.090.010.080.010.000.09
38X7-1778Nmmudstone2.251.095.900.930.230.340.070.65
39X7-2806Nmsiltstone2.352.429.942.160.540.600.181.32
40G33-12851Jxwdolomite2.490.330.090.040.080.010.000.09
41G33-22877Jxwdolomite3.261.050.160.110.330.010.010.35
42G33-42918Jxwdolomite3.040.620.180.090.180.010.010.20
43G33-52959Jxwdolomite3.081.260.800.390.370.060.040.47
44G33-63080Jxwdolomite3.190.310.040.010.090.000.000.10
45G602670Es2mudstone2.371.053.741.320.240.230.110.57
46G612732Es1siltstone2.391.868.772.260.420.540.191.15
47G632730Es1siltstone2.392.0512.302.790.470.750.231.45
48G662733Es2siltstone2.711.837.951.990.470.550.191.21
49D17-12645Jxwdolomite2.570.160.050.010.040.000.000.04
50D17-22648Jxwdolomite2.480.320.130.010.080.010.000.09
51D17-42775Argneiss2.820.270.902.290.070.060.220.36
52D17-62872Argneiss2.780.6013.101.610.160.930.161.25
53D17-72991Argranulite2.760.244.674.200.060.330.400.80
54D17-83099Argranulite2.760.221.001.860.060.070.180.31
55D17-93155Argneiss2.710.161.943.880.040.130.370.54
56D17-103268Argranulite2.760.181.572.750.050.110.260.42
57D17-113270Argneiss2.780.210.831.650.050.060.160.27
58D17-123380Argneiss2.850.3213.003.190.090.950.321.35
59D17-133380Argneiss2.850.220.801.300.060.060.130.25
60D17-143475Argneiss2.710.240.532.600.060.040.250.34
61D17-153540Argneiss3.140.441.382.860.130.110.310.55
62D17-163558Argranulite2.760.180.185.350.050.010.510.57
63D17-173691Argranulite2.700.170.422.930.040.030.280.35
64D17-183696Argneiss2.780.270.862.460.070.060.240.37
65D17-193790Argneiss2.780.213.821.460.060.270.140.47
66D17-203880Argneiss2.781.425.895.020.380.420.491.28
67D17-214001Argneiss2.780.171.682.120.040.120.210.37
68D16-11108Jxwdolomite3.120.400.120.090.120.010.010.14
69D16-21002Jxwdolomite2.780.810.320.120.220.020.010.25
70D16-31112Jxwdolomite2.781.111.040.290.290.070.030.40
71D16-41203Jxwdolomite2.780.380.030.020.100.000.000.10
72D16-51312Jxwdolomite2.780.230.020.010.060.000.000.06
73D16-101680Jxwdolomite2.800.891.860.380.240.130.040.41
74D16-111701Jxwdolomite2.800.851.260.300.230.090.030.35
75D16-121750Jxwdolomite3.070.791.020.220.230.080.020.33
76D16-141903Jxwdolomite2.780.320.070.010.080.000.000.09
77D16-161994Jxwdolomite2.340.781.470.190.170.090.020.28
78D16-172040Jxwdolomite2.780.661.530.350.170.110.030.32
79D16-192195Chdolomite3.251.043.871.700.320.320.190.84
80D16-212500Chdolomite2.870.320.040.010.090.000.000.09
81D16-222636Chorbite2.701.495.854.080.380.400.381.17
82D16-242819Chdolomite2.660.600.110.010.150.010.000.16
83D16-273000Chdolomite2.660.811.990.110.200.140.010.35

References

  1. Roy, R.F.; Blackwell, D.D.; Birch, F. Heat generation of plutonic rocks and continental heat flow provinces. Earth Planet. Sci. Lett. 1968, 5, 1–12. [Google Scholar] [CrossRef]
  2. Vigneresse, J.L. Thermal Data and Crustal Structure. Role of Granites and the Depleted Lower Crust. Granul. Crustal Evolut. 1990, 311, 551–568. [Google Scholar]
  3. Vigneresse, J.L.; Cuney, M. Are Granites Representative of Heat Flow Provinces? In Terrestrial Heat Flow and the Lithosphere Structure; Springer: Berlin/Heidelberg, Germany, 1991; pp. 86–110. [Google Scholar]
  4. Ahmed, N.K.; Abbady, A.; Arabi, A.M.E.; Michel, R.; El-kamel, A.H.; Abbady, A.G.E. Comparative Study of the Natural Radioactivity of some Selected Rocks from Egypt and Germany. Indian J. Pure Appl. Phys. 2006, 44, 209–215. [Google Scholar]
  5. Verdoya, M.; Pasquale, V.; Chiozzi, P.; Kukkonen, I.T. Radiogenic heat production in the Variscan crust: new determinations and distribution models in Corsica (northwestern Mediterranean). Tectonophysics 1998, 291, 63–75. [Google Scholar] [CrossRef]
  6. Brady, R.J.; Ducea, M.N.; Kidder, S.B.; Saleeby, J.B. The distribution of radiogenic heat production as a function of depth in the Sierra Nevada Batholith, California. Lithosphere 2006, 86, 229–244. [Google Scholar] [CrossRef]
  7. Ketcham, R.A. An improved method for determination of heat production with gamma-ray scintillation spectrometry. Chem. Geol. 1996, 130, 175–194. [Google Scholar] [CrossRef]
  8. Chiozzi, P.; De Felice, P.; Fazio, A.; Pasquale, V.; Verdoya, M. Laboratory application of NaI (Tl) gamma-ray spectrometry to studies of natural radioactivity in geophysics. Appl. Radiat. Isot. 2000, 53, 127–132. [Google Scholar] [CrossRef]
  9. Abbady, A.G.; El-Arabi, A.M.; Abbady, A. Heat production rate from radioactive elements in igneous and metamorphic rocks in Eastern Desert, Egypt. Appl. Radiat. Isot. 2006, 64, 131–137. [Google Scholar] [CrossRef]
  10. Kumar, P.S.; Menon, R.; Reddy, G.K. The role of radiogenic heat production in the thermal evolution of a Proterozoic granulite-facies orogenic belt: Eastern Ghats, Indian Shield. Earth Planet. Sci. Lett. 2007, 254, 39–54. [Google Scholar] [CrossRef]
  11. Pasquale, V.; Verdoya, M.; Chiozzi, P. Thermal Structure; Springer International Publishing: Berlin/Heidelberg, Germany, 2017. [Google Scholar]
  12. Wang, L.S.; Li, C.; Yang, C. Characteristics of lithosphere thermal structure in Tarim basin. Acta Geophys. Sin. 1996, 6, 794–803. [Google Scholar]
  13. Wang, J.Y.; Xiong, L.P.; Huang, S.P. Heat transfer and groundwater activity in sedimentary basins. Quat. Res. 1996, 2, 147–158. [Google Scholar]
  14. Liu, S.W.; Wang, L.S.; Li, C.; Li, H.; Han, Y.B.; Jia, C.Z.; Wei, G.Q. Lithospheric thermo-rheological structure and geodynamic significance of the north Tarim margin. Sci. Chin. 2003, 9, 852–863. [Google Scholar]
  15. Qiu, N.S.; Zuo, Y.H.; Chang, J.; Xu, W.; Zhu, C.Q. Characteristics of Meso-Cenozoic thermal regimes in typical eastern and western sedimentary basins of China. Earth Sci. Front. 2015, 22, 157–168. [Google Scholar]
  16. Yamaguchi, T.I.; Yamano, M.; Nagao, T.; Goto, S. Distribution of radioactive heat production around an active fault and in accretionary prisms of southwest Japan. Phys. Earth Planet. Inter. 2001, 126, 269–277. [Google Scholar] [CrossRef]
  17. Qiu, N.S. Thermal Status Profile in Terrestrial Sedimentary Basins in China. Adv. Earth Sci. 1998, 5, 34–38. [Google Scholar]
  18. Liu, Q.Z. Distribution and gas-bearing characteristics of the Cenozoic igneous Rocks in the Jizhong Depression. Exp. Pet. Geol. 1992, 2, 188–194. [Google Scholar]
  19. Jin, C.S.; Qiao, D.W.; Dan, W.N. Meso-Cenozoic volcanic rock distribution and reservoir characteristics in the Bohai Bay Basin. Oil Gas Geol. 2012, 33. [Google Scholar] [CrossRef]
  20. Wang, P.X.; Yang, X.; Bian, X.D. Petrologic and Geochemical Characteristics of Igneous Rock in Jizhong Depression. Geol. Sci. Technol. Inf. 2012, 31, 1–10. [Google Scholar]
  21. Rybach, L. Radioactive heat production: a physical property determined by the chemistry of rocks. In The Physics and Chemistry of Minerals and Rocks; John Wiley & Sons Inc.: Hoboken, NJ, USA, 1976; pp. 309–318. [Google Scholar]
  22. McLennan, S.M.; Taylor, S.R. Th and U in sedimentary rocks: crustal evolution and sedimentary ecycling. Nature 1980, 285, 621–624. [Google Scholar] [CrossRef]
  23. Li, P.Q.; Liu, Z.H.; Lu, G.S.; Su, X.M.; Yuan, Y. Determinations of U, Ra, Th, 40K and 137Cs in the surface sediments in the offshore area of western Bohai Sea with Ge(Li) γ spectrometer. Oceanol. Limnol. Sin. 1983, 4, 333–341. [Google Scholar]
  24. Roque, A.; Ribeiro, F.B. Radioactivity and radiogenic heat production in the sediments of the São Francisco sedimentary basin, Central Brazil. Appl. Radiat. Isot. 1997, 48, 413–422. [Google Scholar] [CrossRef]
  25. Ribeiro, F.B.; Roque, A. Vertical distributions of uranium, thorium and potassium and of volumetric eat production rates in the sediments of the São Francisco basin, Central Brazil. Appl. Radiat. Isot. 2001, 55, 393–405. [Google Scholar] [CrossRef]
  26. Abbady, A.G. Evaluation of heat generation by radioactive decay of sedimentary rocks in Eastern Desert and Nile Valley, Egypt. Appl. Radiat. Isot. 2010, 68, 2020–2024. [Google Scholar] [CrossRef] [PubMed]
  27. Cermák, V.; Haenel, R. Geothermics and Geothermal Energy; E. Schweizerbart’sche Verlagsbuchhandlung: Stuttgart, Germany, 1982; p. 299. [Google Scholar]
  28. Cermák, V. Crustal temperature and mantle heat flow in Europe. Tectonophysics. 1982, 83, 123–142. [Google Scholar] [CrossRef]
  29. Shen, P.; Zhu, H.Y.; Xu, Y.C. Distribution characteristics of uranium, thorium and potassium in sedimentary rocks. Acta Sedimentol. Sin. 1983, 3, 109–122. [Google Scholar]
  30. Ehrenberg, S.N.; Svånå, T.A. Use of Spectral Gamma-Ray Signature to Interpret Stratigraphic Surfaces in Carbonate Strata: An Example from the Finnmark Carbonate Platform (Carboniferous-Permian). Barents Sea AAPG Bull. 2001, 85, 295–308. [Google Scholar]
  31. Huang, L.J.; Shou, X.Y.; Wang, R.P. Principle and Application of Natural Gamma Ray Spectrometry Logging; Petroleum Industry Press: Beijing, China, 1995; pp. 179–194. [Google Scholar]
  32. Huang, S.P. Aggregate global scale analysis of relationship between heat flow and heat production. Chin. J. Geophys. 1998, 41, 26–32. [Google Scholar]
  33. Wang, Y. Radioactive heat-production element abundance in the crust of continental China estimated from terrestrial heat flow and the helium isotopic composition of underground fluids. Chin Geol. 2006, 4, 920–927. [Google Scholar]
  34. Haack, U.; Zhou, Y.Q. On the content and vertical distribution of K, Th and U in continental crust. Geol. Geochem. 1985, 1, 46–50. [Google Scholar] [CrossRef]
  35. Artemieva, I.M.; Mooney, W.D. Thermal thickness and evolution of Precambrian lithosphere: A global study. J. Geophys. Res. 2001, 106, 16387–16414. [Google Scholar] [CrossRef] [Green Version]
  36. Zhu, C.Q.; Xu, M.; Qiu, N.S. Heat production of sedimentary rocks in the Sichuan basin, Southwest China. Geochem. J. 2018, 52, 401–413. [Google Scholar] [CrossRef]
  37. Qiu, N.S. Geothermal regime in the Qaidam basin, Northeast Qinghai-Tibet Plateau. Geol. Mag. 2003, 140, 707–719. [Google Scholar]
  38. Qiu, N.S.; Wang, X.L.; Yang, H.B.; Xiang, Y. The characteristics of temperature distribution in the Junggar Basin. Sci. Geol. Sin. 2001, 36, 350–358. [Google Scholar]
  39. Jiang, G.Z.; Gao, P.; Rao, S.; Zhang, L.Y.; Tang, X.Y.; Huang, F.; Zhao, P.; Pang, Z.H.; He, L.J.; Hu, J.; et al. Compilation of Heat Flow Date in the China Continental Area (4th edition). Chin. J. Geophys. 2016, 59, 2892–2910. [Google Scholar]
  40. Gong, Y.L. Thermal Structure and Thermal Evolution of Bohai Bay Basin in East China; Nanjing University: Nanjing, China, 2003. [Google Scholar]
  41. Qiu, N.S.; Wei, G.; Li, C.C.; Zhang, Y.; Guo, Y.H. Distribution features of current geothermal field in the Bohai Sea Waters. Oil Gas. Geol. 2009, 30, 412–419. [Google Scholar]
  42. Chang, J.; Qiu, N.S.; Zhao, X.Z.; Xu, W.; Xu, Q.; Jin, F.-M.; Han, C.-Y.; Ma, X.-F.; Dong, X.-Y.; Liang, X.-J. Presentday geothermal regime of the Jizhong depression in Bohai Bay basin, East China. Chin. J. Geophys. 2016, 59, 1003–1016. [Google Scholar]
  43. Jiang, G.Z.; Hu, S.B.; Shi, Y.Z.; Zhang, C.; Wang, Z.T.; Hu, D. Terrestrial heat flow of continental China: Updated dataset and tectonic implications. Tectonophysics 2019, 753, 36–48. [Google Scholar] [CrossRef]
  44. Pollack, H.N.; Hurter, S.J.; Johnson, J.R. Heat-flow from the earth’s interior -analysis of the global data set. Rev. Geophysics 1993, 31, 267–280. [Google Scholar] [CrossRef]
  45. Wang, Z.T.; Jiang, G.Z.; Zhang, C.; Hu, J.; Shi, Y.Z.; Wang, Y.B.; Hu, S.B. Thermal regime of the lithosphere and geothermal potential in Xiong’an New Area. Energy Explor. Exploit. 2019, 37, 787–810. [Google Scholar] [CrossRef] [Green Version]
  46. Zhang, R.H.; Xie, Z.W.; Wu, J.X.; Xie, Y.Z.; Liu, M. The distribution of heat flow values in Tangshan and its surroundings. Seismol. Geol. 1982, 4, 57–67. [Google Scholar]
  47. Li, W.W.; Rao, S.; Tang, X.Y.; Jiang, G.Z.; Hu, S.B.; Kong, Y.L.; Pang, J.M.; Wang, J.C. Borehole temperature logging and temperature field in the Xiongxian geothermal field, Hebei Province. Chin. J. Geol. 2014, 49, 850–863. [Google Scholar]
  48. Wang, J.Y.; Huang, S.P. Compilation of heat flow data for continental area of China. Sci. Geol. Sin. 1988, 2, 196–204. [Google Scholar]
  49. Wang, J.Y.; Huang, S.P. Compilation of heat flow data for continental area of China (2nd edition). Seismol. Geol. 1990, 12, 351–363+366. [Google Scholar]
  50. Hu, S.B.; He, L.J.; Wang, J.Y. Compilation of heat flow data for continental area of China (3rd edition). Chin. J. Geophys. 2011, 5, 611–626. [Google Scholar] [CrossRef]
  51. Wang, Y.; Wang, J.Y.; Deng, J.F.; Xiong, L.P. Heat Flow Constraint on the Abundance of Uranium, Thorium and Potassium in Crust and Lithosphere of the Continental Area of China. Prog. Geophys. 2001, 3, 21–30. [Google Scholar]
  52. Mongelli, F.; Zito, G.; Lorenzo, S. Thermal effects of long intrusions. Geothermics 2000, 29, 347–365. [Google Scholar] [CrossRef]
  53. Tang, X.Y.; Zhang, C.G.; Yang, J.S.; Yang, S.C.; Rao, S.; Hu, S.B. Influence of igneous instrusions on the temperature field and organic maturity of the Changchang Sag, Qiongdongnan Basin, South China Sea. Chin. J. Geophys. 2013, 56, 159–169. [Google Scholar]
  54. Blackwell, D.D. The thermal structure of the continental crust. In The Structure and Physical Properties of the Earth’s Crust; Heacock, J.G., Ed.; American Geophysical Union: Washington, DC, USA, 1971. [Google Scholar]
  55. Brich, F.; Roy, R.F.; Decker, E.R. Heat flow and thermal history in New England and New York. In Studies of Appalachian Geology: Northern and Maritime; Zen, E.-A., White, W.S., Hadley, J.B., Thompson, J.B., Eds.; Interscience: New York, NY, USA, 1968; pp. 437–451. [Google Scholar]
  56. Zhao, P.; Wang, J.Y. Review on the linear relationship between heat flow and heat production. Prog. Geophys. 1995, 2, 16–31. [Google Scholar]
  57. Wang, J.A.; Wang, J.Y.; Xiong, L.P. Geothermal Characteristics and Petroleum Resources of Liaohe Graben. Bulletin of Institute of Geology; Chinese Academy of Science: Beijing, China, 1992; pp. 1–77. [Google Scholar]
  58. Newton, R.C.; Walther, J.V.; Wood, B.J. Fluid-rock Interactions during Metamorphism. In Fluids of Granulite Facies Metamorphism; Springer: Berlin/Heidelberg, Germany, 1986; pp. 36–59. [Google Scholar]
  59. Allis, R.G. A heat production model for stable continental crust. Tectonophysics 1979, 57, 151–165. [Google Scholar] [CrossRef]
  60. Ashwal, L.D.; Morgan, P.; Kelley, S.A.; Percival, J.A. Heat production in an Archean crustal profile and implications for heat flow and mobilization of heat-producing elements. Earth Planet. Sci. Lett. 1987, 85, 439–450. [Google Scholar] [CrossRef]
  61. Pinet, C.; Jaupart, C. The vertical distribution of radiogenic heat production in the Precambrian crust of Norway and Sweden: geothermal implications. Geophys. Res. Lett. 1987, 14, 260–263. [Google Scholar] [CrossRef]
  62. Duan, Y.H.; Wang, F.Y.; Zhang, X.K.; Lin, J.Y.; Liu, Z.; Liu, B.F.; Yang, Z.X.; Guo, W.B.; Wei, Y.H. Three dimensional crustal velocity structure model of the middle-eastern North China Craton (HBCrust1.0). Sci. Chin. Earth Sci. 2016, 59, 1477–1488. [Google Scholar] [CrossRef]
  63. Zhang, C.K.; Zhang, X.K.; Zhu, Z.P.; Zhang, J.S.; Ruan, H. A study of crust and ipper mantle structure on Wen’an-Weixian-Qanaryouyizhongqi Profile. North Chin. Earthq. Sci. 1997, 3, 18–28. [Google Scholar]
  64. Zhang, C.K.; Zhang, X.K.; Zhao, J.R.; Ren, Q.F.; Zhang, J.S.; Hai, Y. Study and review on crust-mantle velocity structure in Bohai Bay and its vicinity. Acta Seismol. Sin. 2002, 4, 447–455. [Google Scholar] [CrossRef]
  65. Wang, F.Y.; Zhang, X.K.; Chen, Y.; Li, L.; Chen, Q.F.; Zhao, J.R.; Zhang, J.S.; Liu, B.F. 2-D P-wave velocity structure in the mideast segment of Zhangjiakou-Bohai tectonic zone: Anxin-Xianghe-Kuancheng DSS profile. Acta Seismol. Sin. 2004, 1, 32–42. [Google Scholar] [CrossRef]
  66. Qiu, N.S.; Su, X.G.; Li, Z.Y.; Zhang, J.; Liu, Z.Q.; Li, Z.; Zhang, L.Y. The Cenozoic tectono-thermal evolution of depressions along both sides of mid-segment of Tancheng-Lujaing Fault Zone, East China. Chin. J. Geophys. 2007, 50, 1497–1507. [Google Scholar] [CrossRef]
  67. Liu, S.W.; Wang, L.S.; Gong, Y.L.; Li, C.; Li, H.; Han, Y. Thermal-rheological structure of the lithosphere beneath Jiyang Depression: its implications for geodynamics. Sci. Chin. Earth Sci. 2005, 48, 1569–1584. [Google Scholar] [CrossRef]
  68. Chi, Q.H.; Yan, M.C. Radioactive Elements of Rocks in North China Platform and the Thermal Structure and Temperature Distribution of the Modern Continental Lithosphere. Geophys. Geotherm. Explor. 1998, 1, 38–48. [Google Scholar]
  69. Chen, M.X. The Geothermal in North China; Science Press: Beijing, China, 1988. [Google Scholar]
  70. Zhan, L.Y.; Liu, Q.Y.; He, L.J. The different lithospheric thermal structure of North China Carton and its implications. Chin. J. Geophys. 2016, 59, 3618–3626. [Google Scholar]
  71. Guo, S.S.; Zhu, C.Q.; Qiu, N.S.; Tang, B.N.; Cui, Y.; Zhang, J.T.; Zhao, Y.H. Present Geothermal Characteristics and Influencing Factors in the Xiong’an New Area, North China. Energies 2019, 12, 3884. [Google Scholar] [CrossRef] [Green Version]
  72. Zhou, R.L. The activity of deep underground water in the northern part of the North China Plain and its effect on the geothermal field. Bull. 562 Compr. Geol. Brig. Chin. Acad. Geol. Sci. 1987, 6, 17–35. [Google Scholar]
  73. Wang, J.Y. Geothermics in China; Seismological Press: Beijing, China, 1996. [Google Scholar]
Figure 1. (a) The Geological setting of Jizhong Depression in the Bohai Bay basin, China; (b) Observed heat flow distribution and location of research wells; (c) Stratigraphic histogram of the Xiong’an area.
Energies 12 04608 g001
Figure 2. Relation between heat production and sample depth. The dolomite, mudstone, and sandstone sample numbers deviated from normal values.
Energies 12 04608 g002
Figure 3. Contributions of U, Th, and K to sample heat production.
Energies 12 04608 g003
Figure 4. Heat flow contribution of sedimentary layers, basement depth and Moho depth in the Xiong’an area. WL well was outside the BB’ section.
Energies 12 04608 g004
Figure 5. Distribution and lithology of Cenozoic igneous rocks (distribution according to Wang et al. [20]). Lithology was derived from logging data.
Energies 12 04608 g005
Figure 6. Conductive terrestrial heat flow calculation results for each structural layer in three tectonic areas.
Energies 12 04608 g006
Figure 7. The calculated conductive terrestrial heat flow of AA’ section passing through the Xushui sag, Rongcheng salient, Niutuozhen salient, and Baxian sag. qm is the mantle heat flow of different tectonic areas calculated in previous studies. The gray heat flow line is geothermal flow by Gong [40] and red heat flow line is calculation conductive terrestrial data based on mantle heat flow, moreover, the blue heat flow line is obtained by assuming that the mantle heat flow was constant as 32 mW/m2.
Energies 12 04608 g007
Figure 8. The calculated conductive terrestrial heat flow of BB’ section passing through the Langgu sag, Niutuozhen salient, and Baxian sag. qm is the mantle heat flow of different tectonic areas calculated in previous studies. The gray heat flow line is geothermal flow by Gong [40] and red heat flow line is calculation conductive terrestrial data based on mantle heat flow, moreover, the blue heat flow line is obtained by assuming that the mantle heat flow was constant as 32 mW/m2.
Energies 12 04608 g008
Table 1. Sample lithologies from different strata in the Xiong’an area
LithologyQuaternary and Neogene (Q+N)Paleogene (E)Mesozoic and Paleozoic (Mz+Pz)Mesoproterozoic (Jx)Palaeoproterozoic (Ch)Archaeozoic
Dolomite153286——
Mudstone13————2
Siltstone161
Sandstone241
PyrolithOrbite——1
Basalt1
Gneiss——12
Granulite5
Table 2. Average heat production of radioactive elements and the Th/U and Th/K ratios in different lithologies in the study area. Clastic rock (I) was marine facies clastic rock samples, dolomite (I) was marine dolomite samples, and dolomite (II) was continental dolomite samples.
LithologyNUAU (±1σ)ThATh (±1σ)KAK (±1σ)A (±1σ)Th/UTh/K
(μg/g)(μW/m3)(%)(μg/g)(μW/m3)(%)(Wt%)(μW/m3)(%)(μW/m3)
Sandstone72.920.68 ± 0.31468.960.56±0.21392.30.19 ± 0.07151.43 ± 0.443.063.9
Siltstone62.050.47 ± 0.06379.830.61±0.08482.250.19 ± 0.02151.27 ± 0.134.84.37
Mudstone42.10.46 ± 0.22426.620.39±0.11461.590.13 ± 0.05120.97 ± 0.373.154.16
Clastic rock (Ⅰ)43.280.75 ± 0.273318.61.15±0.39503.990.36 ± 0.12182.26 ± 0.585.674.66
Dolomite (Ⅰ)380.950.23 ± 0.21781.220.08±0.16150.980.06 ±0.1770.37 ± 0.491.281.25
Dolomite (Ⅱ)50.340.09 ± 0.05870.110.01±0.0180.050.00 ± 0.0150.10 ± 0.060.322.2
PyrolithOrbite11.490.38335.850.4354.080.38331.173.931.43
Basalt10.630.16172.640.18196.410.6640.944.190.41
Granulite50.20.05 ± 0.01121.570.11 ± 0.11203.420.33 ± 0.12680.49 ± 0.187.850.46
Gneiss120.380.10 ± 0.09173.730.27 ± 0.32342.540.25 ± 0.10490.62 ± 0.409.821.47
Table 3. Lithological compositions of different wells in the study area and thermal contributions of each sedimentary layer. The lithology marks are the same as in Table 2. The lithology mark of the EB well with igneous rock drilled in the E layer has a slightly different lithology combination. Igneous rock accounts for 2%, sandstone accounts for 28%, and the rest of the lithology is present in the same proportion. WL* is a projection from neighboring well onto the through-well section BB’.
StrataThickness(m)LithologyA (μW/m3)qL (mW/m2)
Quaternary and Neogene (Q+N)1230(CR)30%Sandstone1.171.44
1450(CD)20%Siltstone1.7
1400(EJ)50%Mudstone1.64
1380(EW)0%Dolomite (Ⅱ)1.61
900(WL*)1.05
890(CB)1.04
2230(EB)2.61
Paleogene (E)230(CR)30%Sandstone1.160.27
800(CD)23%Siltstone1.14 (EB)0.93
2300(EJ)45%Mudstone2.67
700(EW)2%Dolomite (Ⅱ)0.81
3600(WL*)2%Pyrolith (EB)4.18
0(CB)28%Sandstone (EB)0
1360(EB)1.55
Mesozoic and Paleozoic (Mz+Pz)200(CR)20%Sandstone1.060.21
0(CD)10%Siltstone0
400(EJ)10%Mudstone0.42
900(EW)20%Dolomite (Ⅰ)0.95
0(WL*)20%Dolomite (Ⅱ)0
0(CB)20%Clastic rock (Ⅰ)0
400(EB)0.42
Mesoproterozoic (Jx)3100(CR)5%Clastic rock (Ⅰ)0.461.43
3000(CD)95%Dolomite (Ⅰ)1.38
2500(EJ)1.15
2800(EW)1.29
2300(WL*)1.06
3300(CB)1.52
2100(EB)0.97
Palaeoproterozoic (Ch)2600(CR)30%Clastic rock (Ⅰ)0.942.44
2500(CD)60%Dolomite (Ⅰ)2.35
2000(EJ)1.88
2300(EW)2.16
1800(WL*)1.69
2800(CB)2.63
1700(EB)1.6
Table 4. Sedimentary heat contribution of seven wells in the western, central, and eastern portions of the study area. qS and q0 are the heat flow (mW/m2) of sedimentary and surface. WL* is a projection from neighboring well onto the through-well section BB’.
Areaq0 (mW/m2)qS (mW/m2)qS/q0 (%)AS (μW/m3)
CR73.55.797.880.79
CD65.76.369.680.82
EJ54.67.7614.210.90
EW57.46.8211.880.84
WL*61.37.9813.020.93
CB74.85.196.940.74
EB59.67.1812.050.92
Table 5. Main tectonic layer thickness models and rock heat production in the western sag, central salient, and eastern sag. The data of the standard * was quoted from Chi and Yan [68]. Pre-Ch is the strata in the upper crust before the Changcheng system.
TectosphereThickness/kmA/(μW/m2)
Western SagCentral HighEastern Sag
Upper CrustQ+N1.211.71.17
E2.10.11.81.16
Mz+Pz0.500.31.06
Jx2.73.22.70.46
Ch2.52.72.50.94
Pre-Ch6.58.52.51.17
Middle Crust998.50.86 *
Lower Crust9.51090.31 *
Moho depth3434.532