Fault Ride-Through Characteristics of Small Wind Turbines

Abstract
:
1. Introduction
2. Grid-Connected SWT
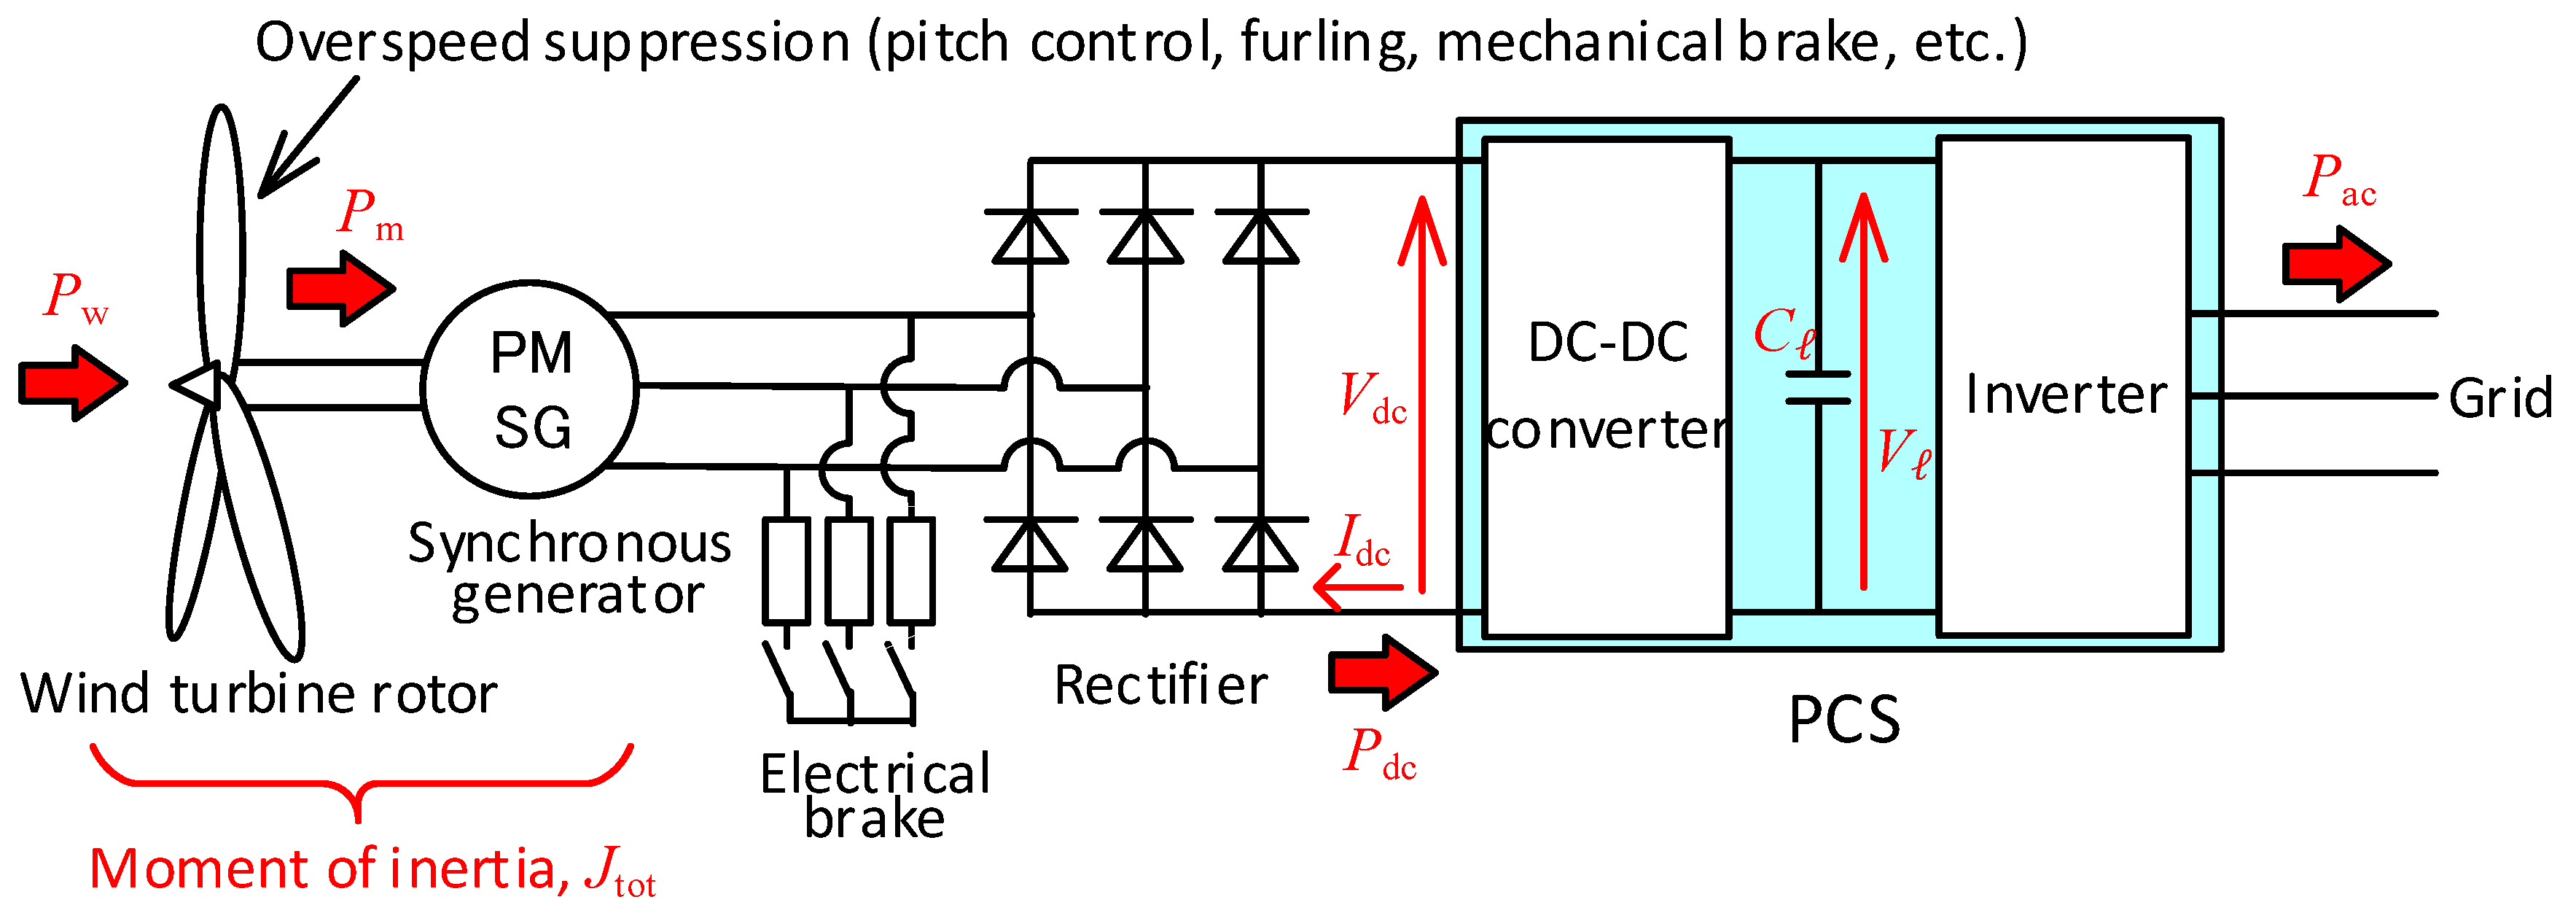
2.1. Typical Configuration
2.2. Rotational Speed Control Under Normal Conditions
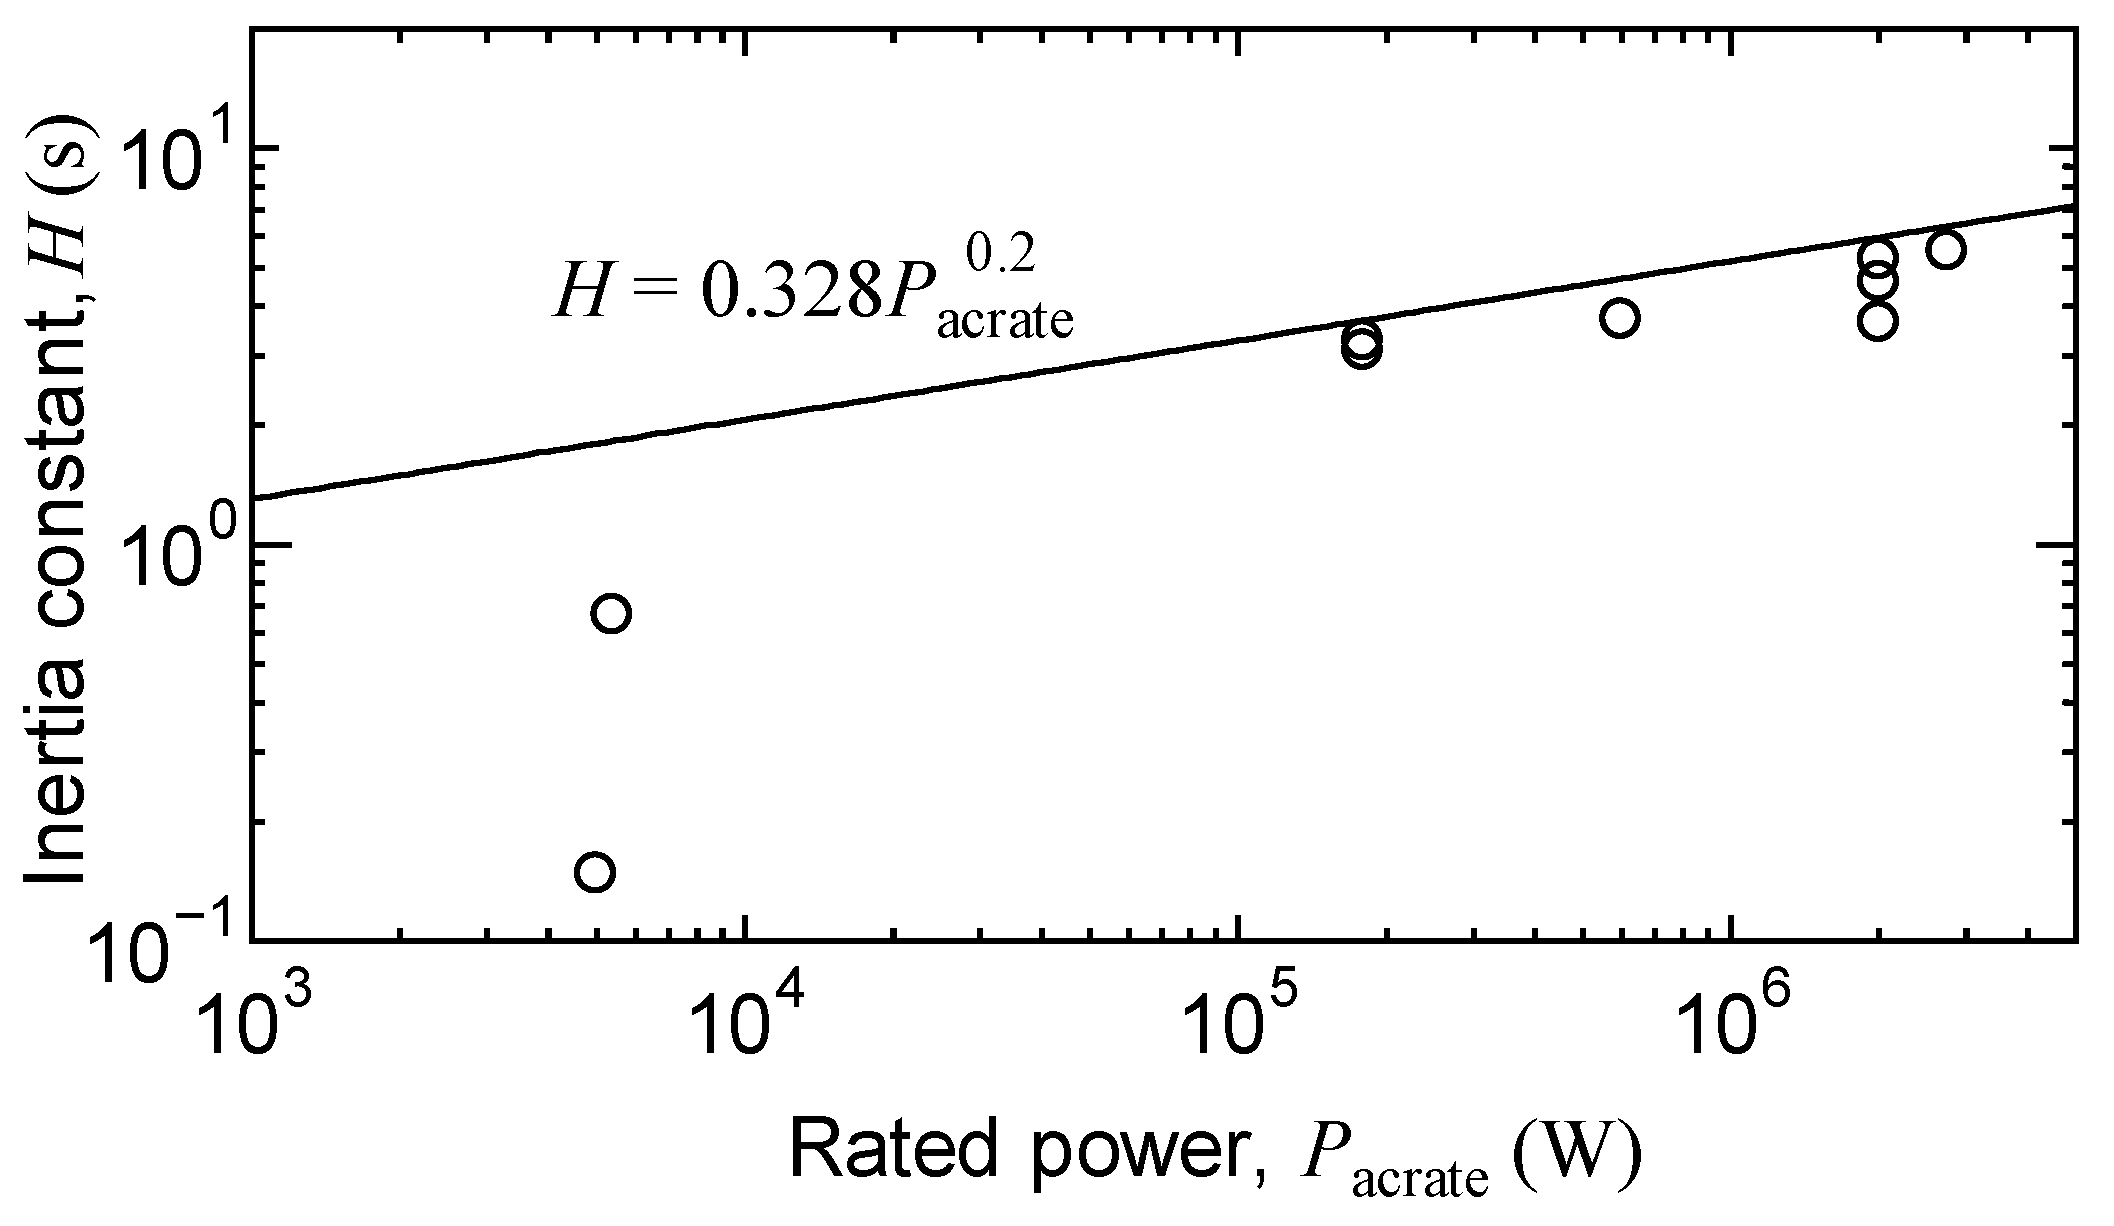
2.3. Rotational Speed Variation at Transient Condition
3. FRT Test of 5-kW SWT
3.1. Specification and Configuration of the SWT System
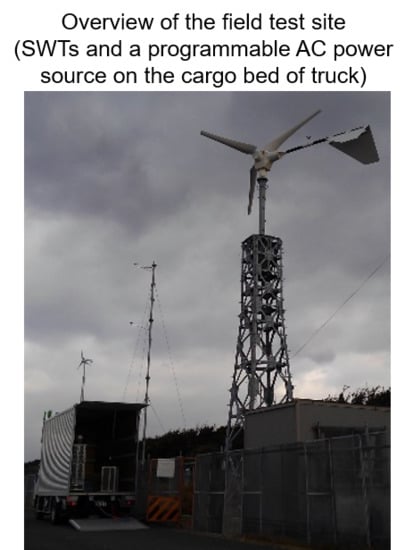
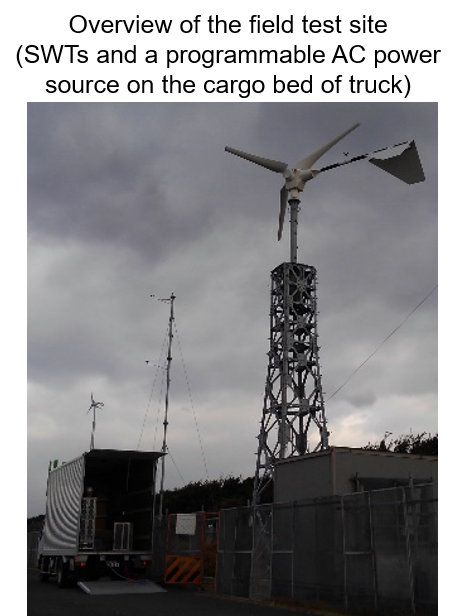
3.2. Configuration of the Test System
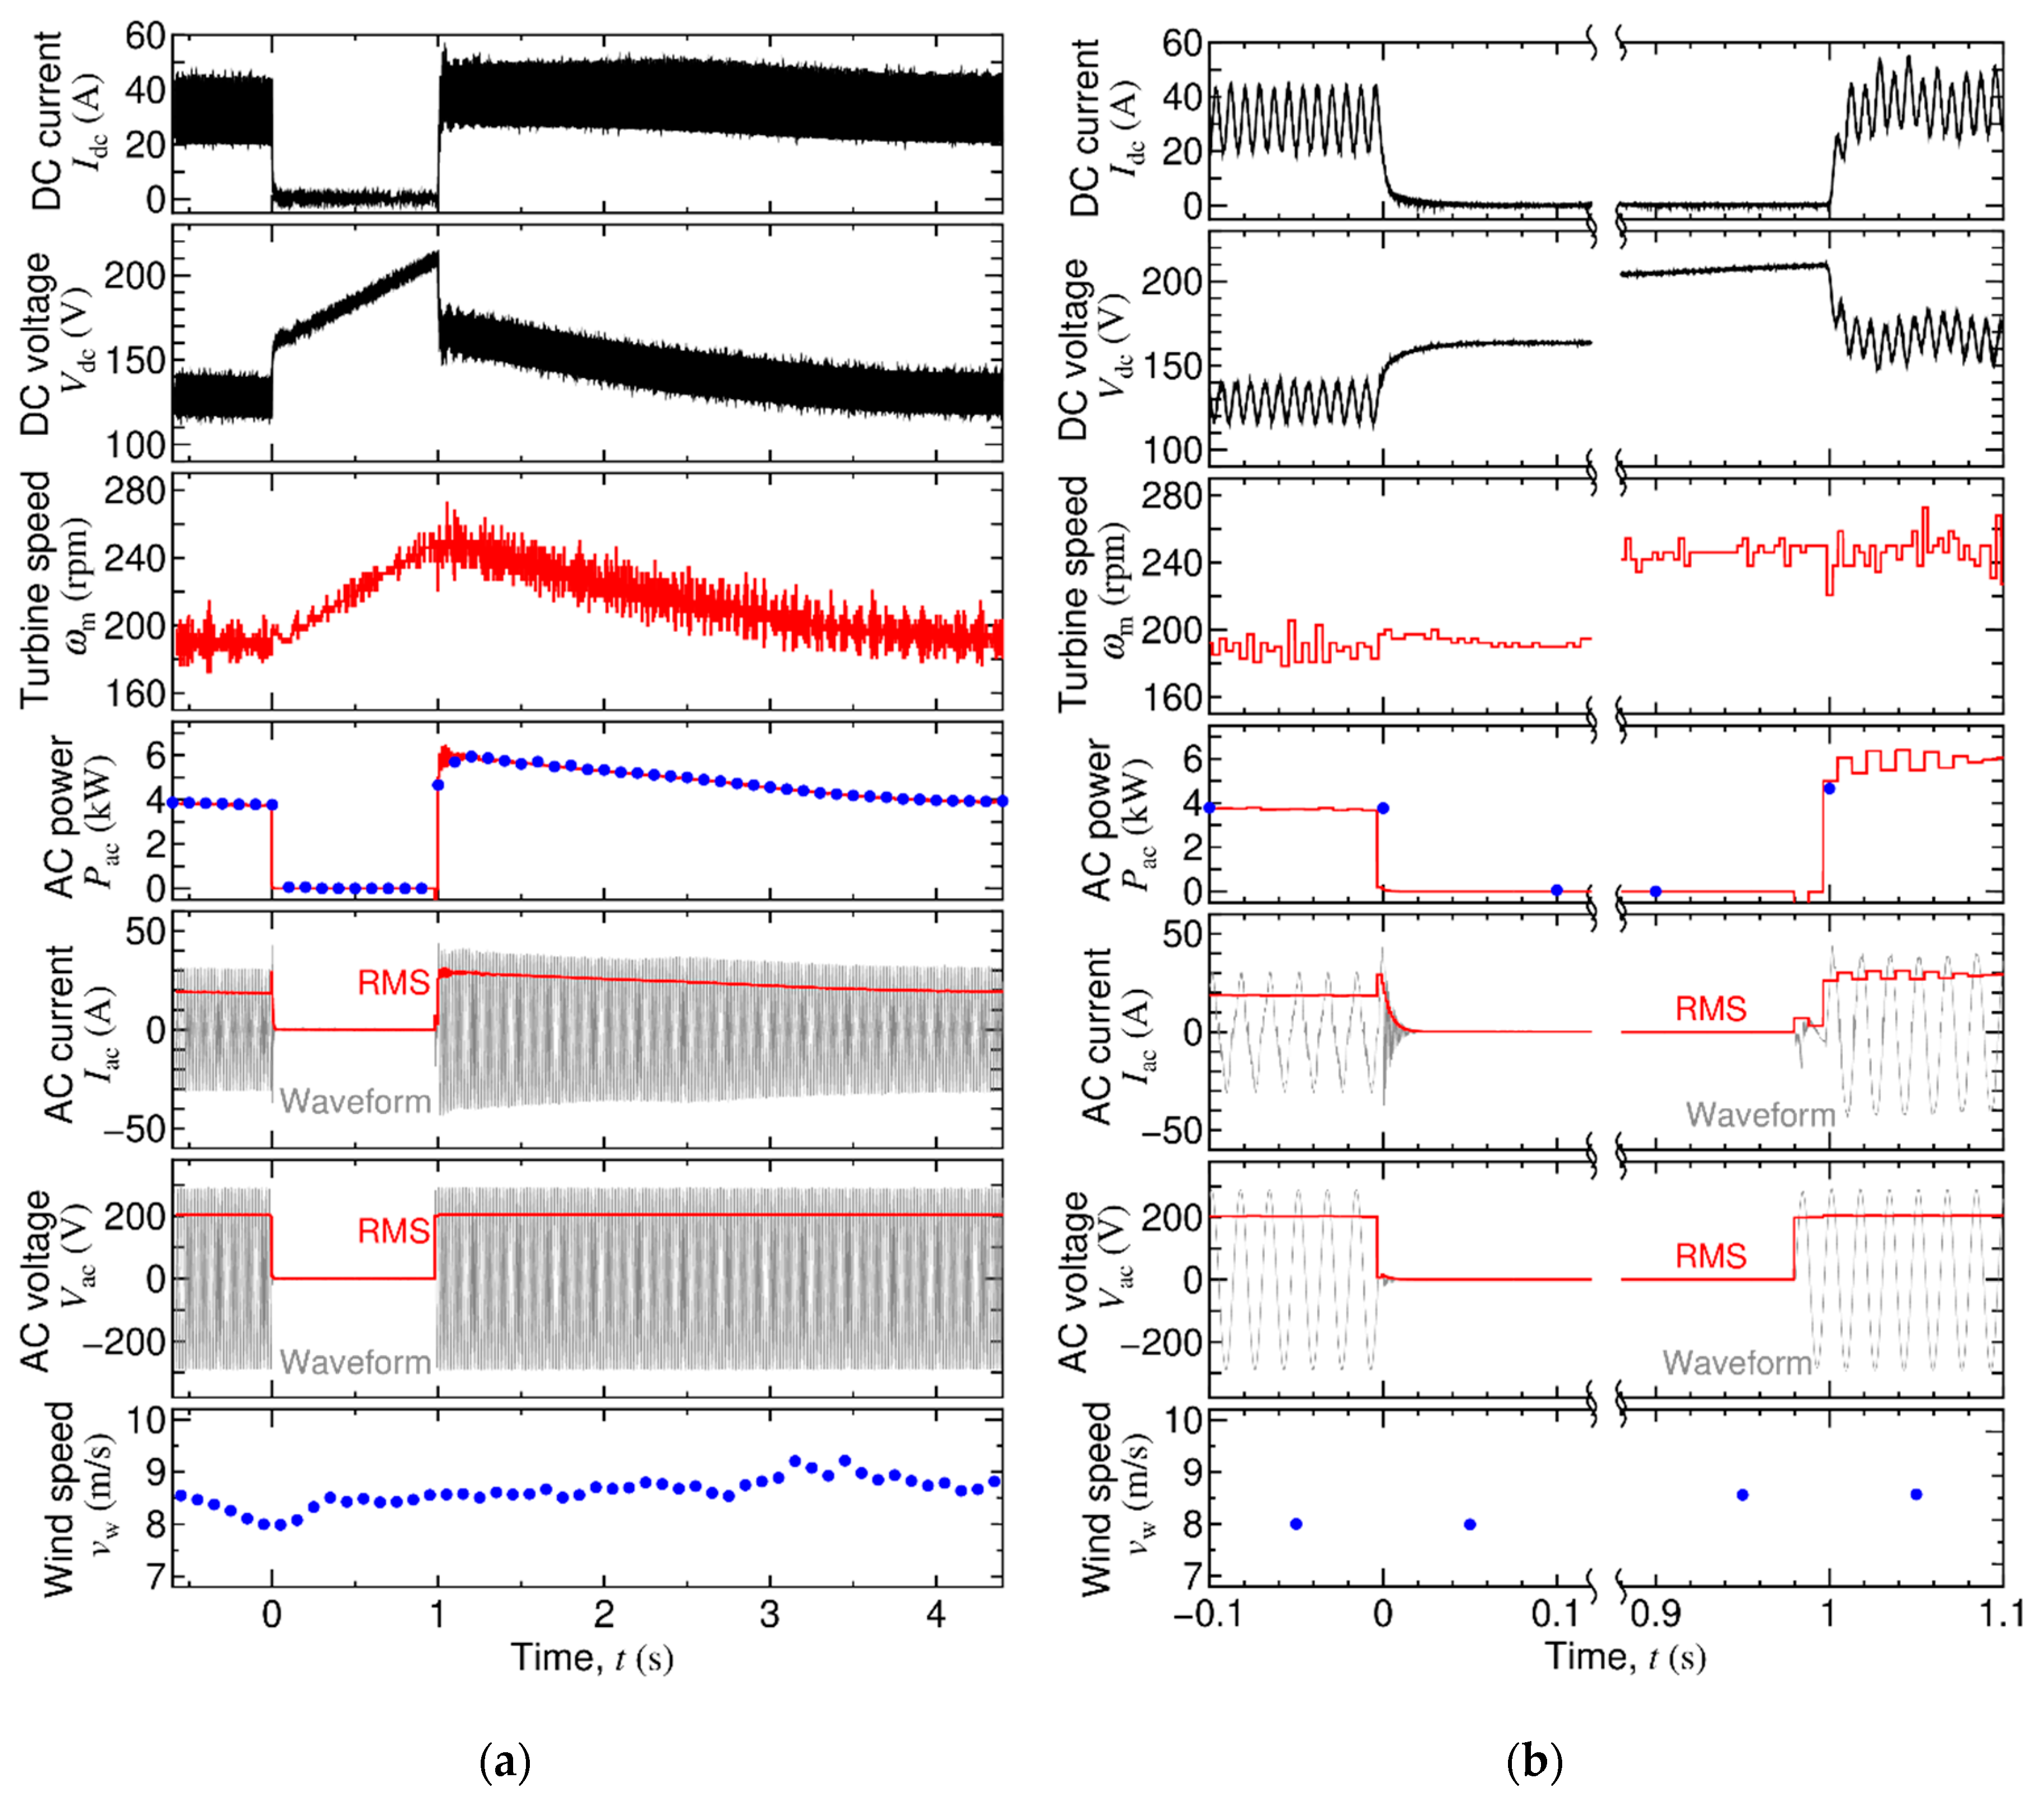
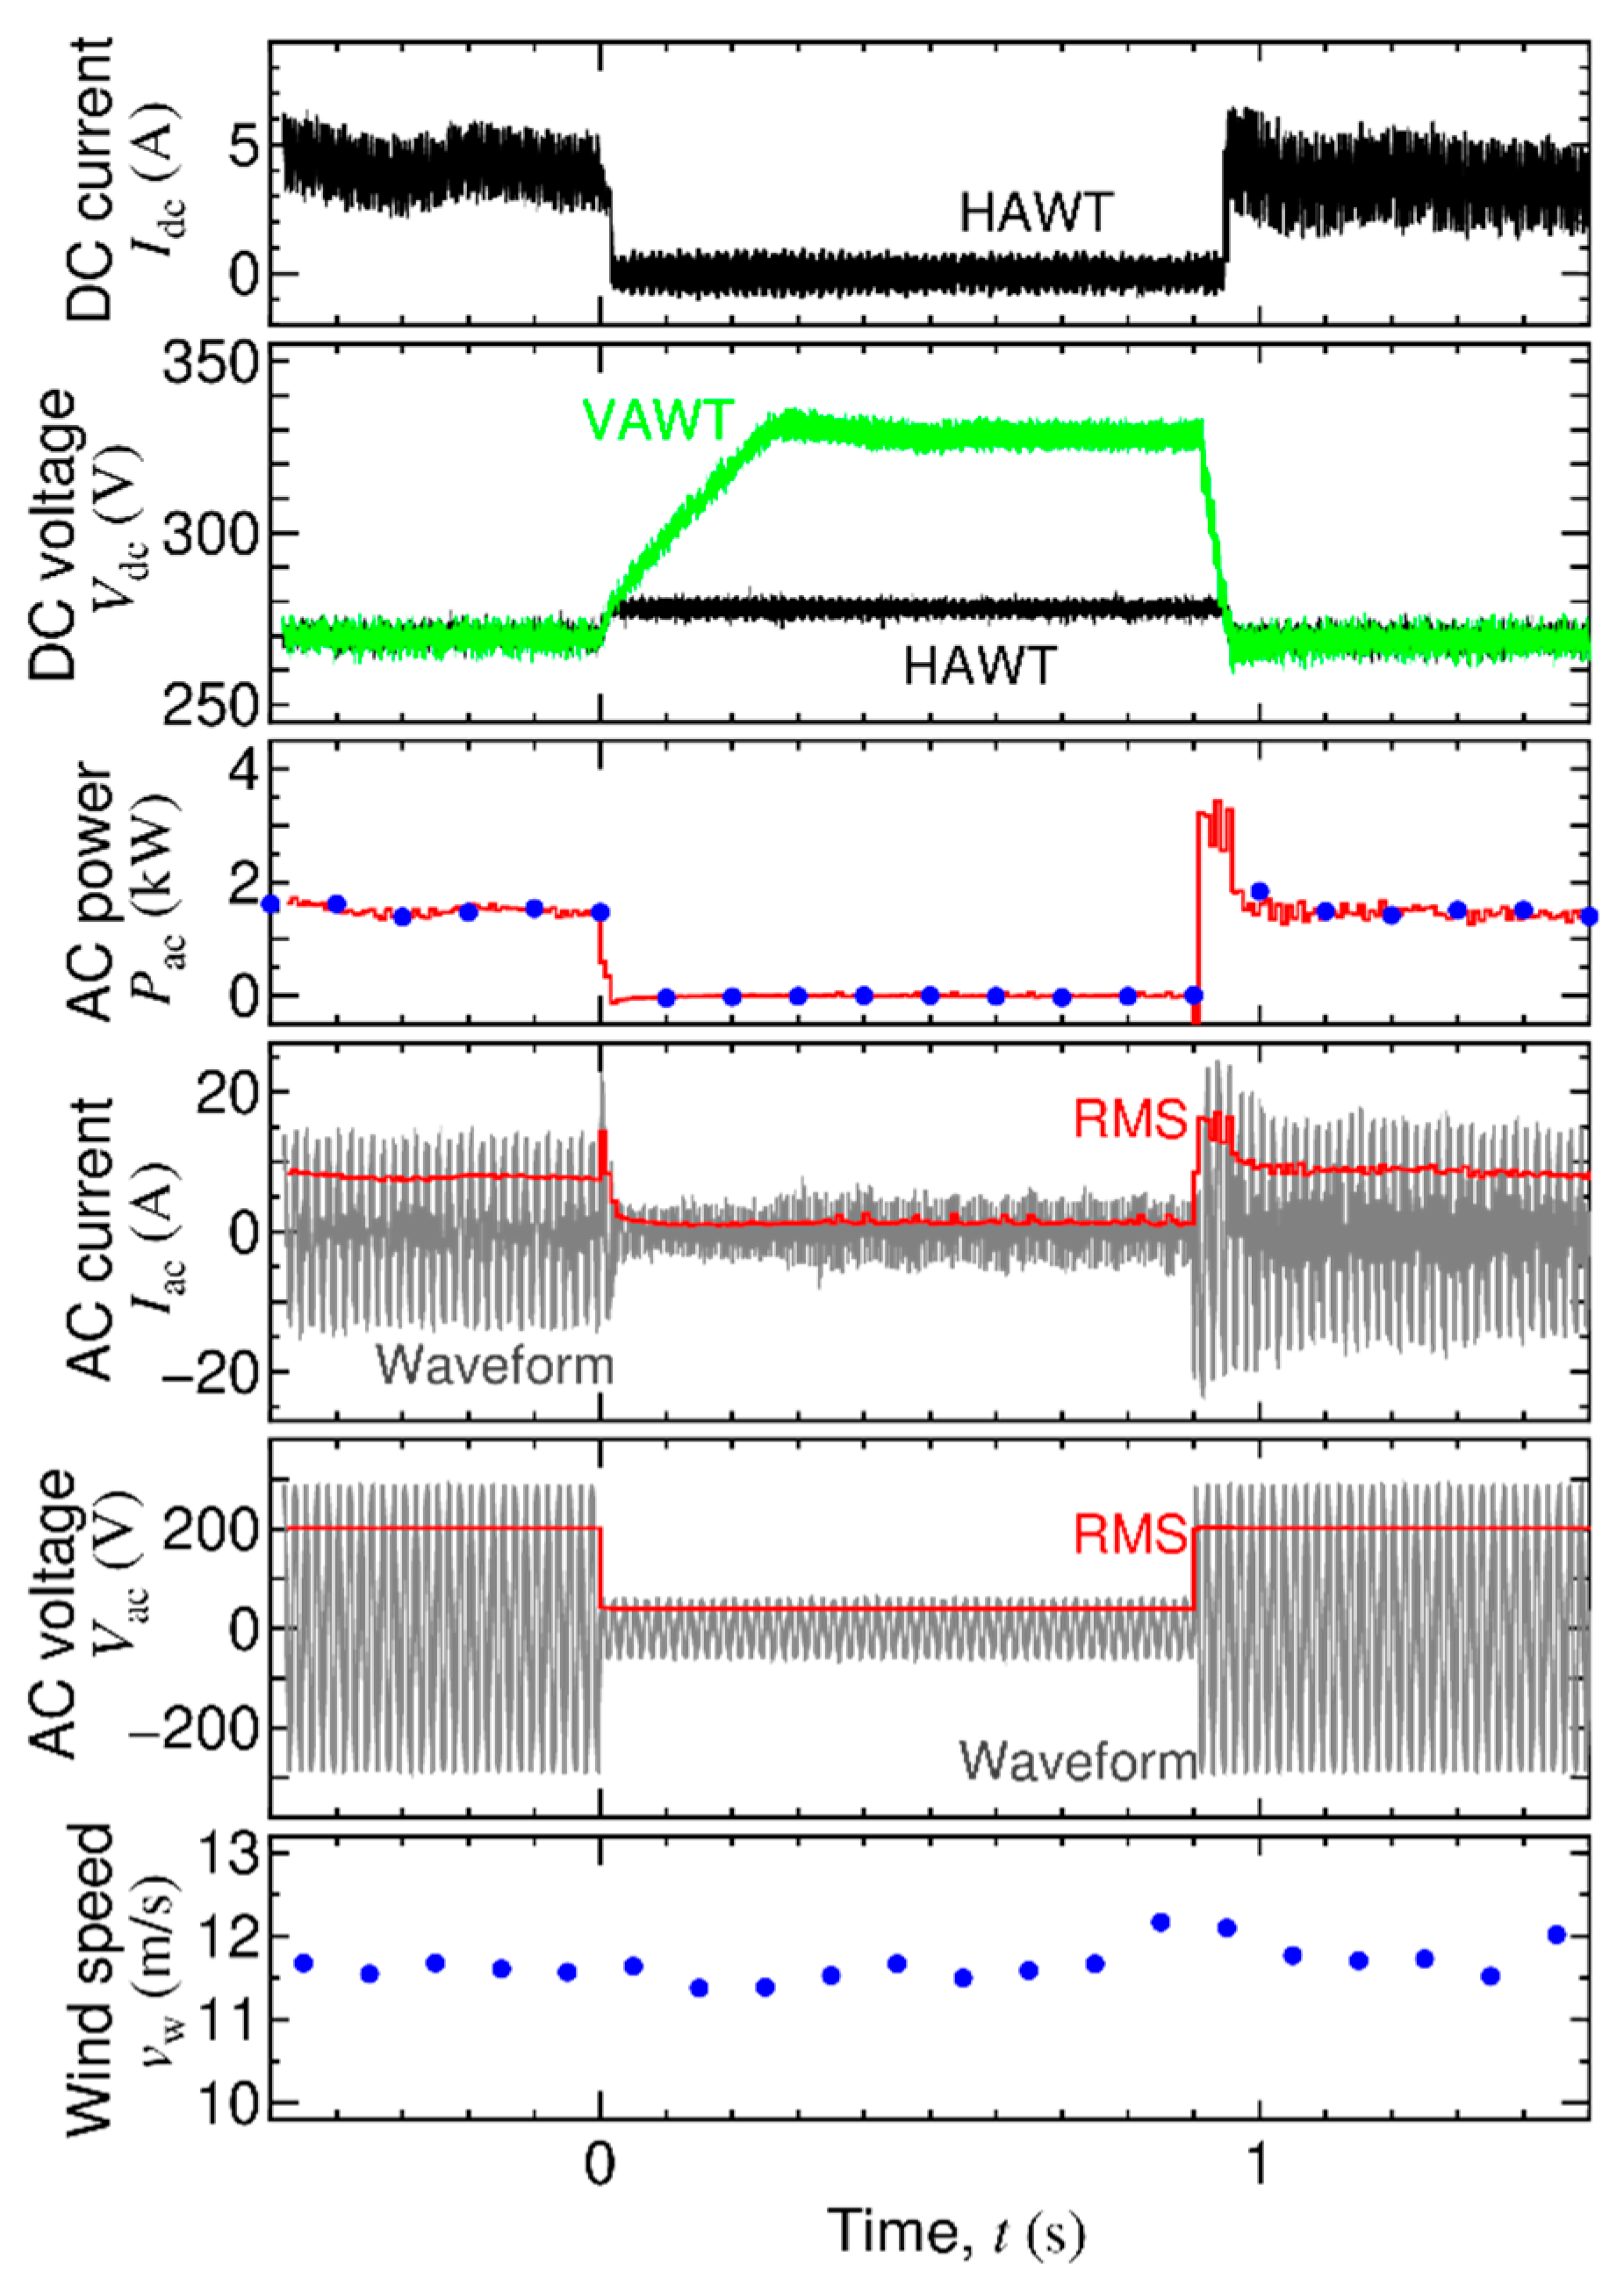
3.3. Test Result
3.4. Discussion
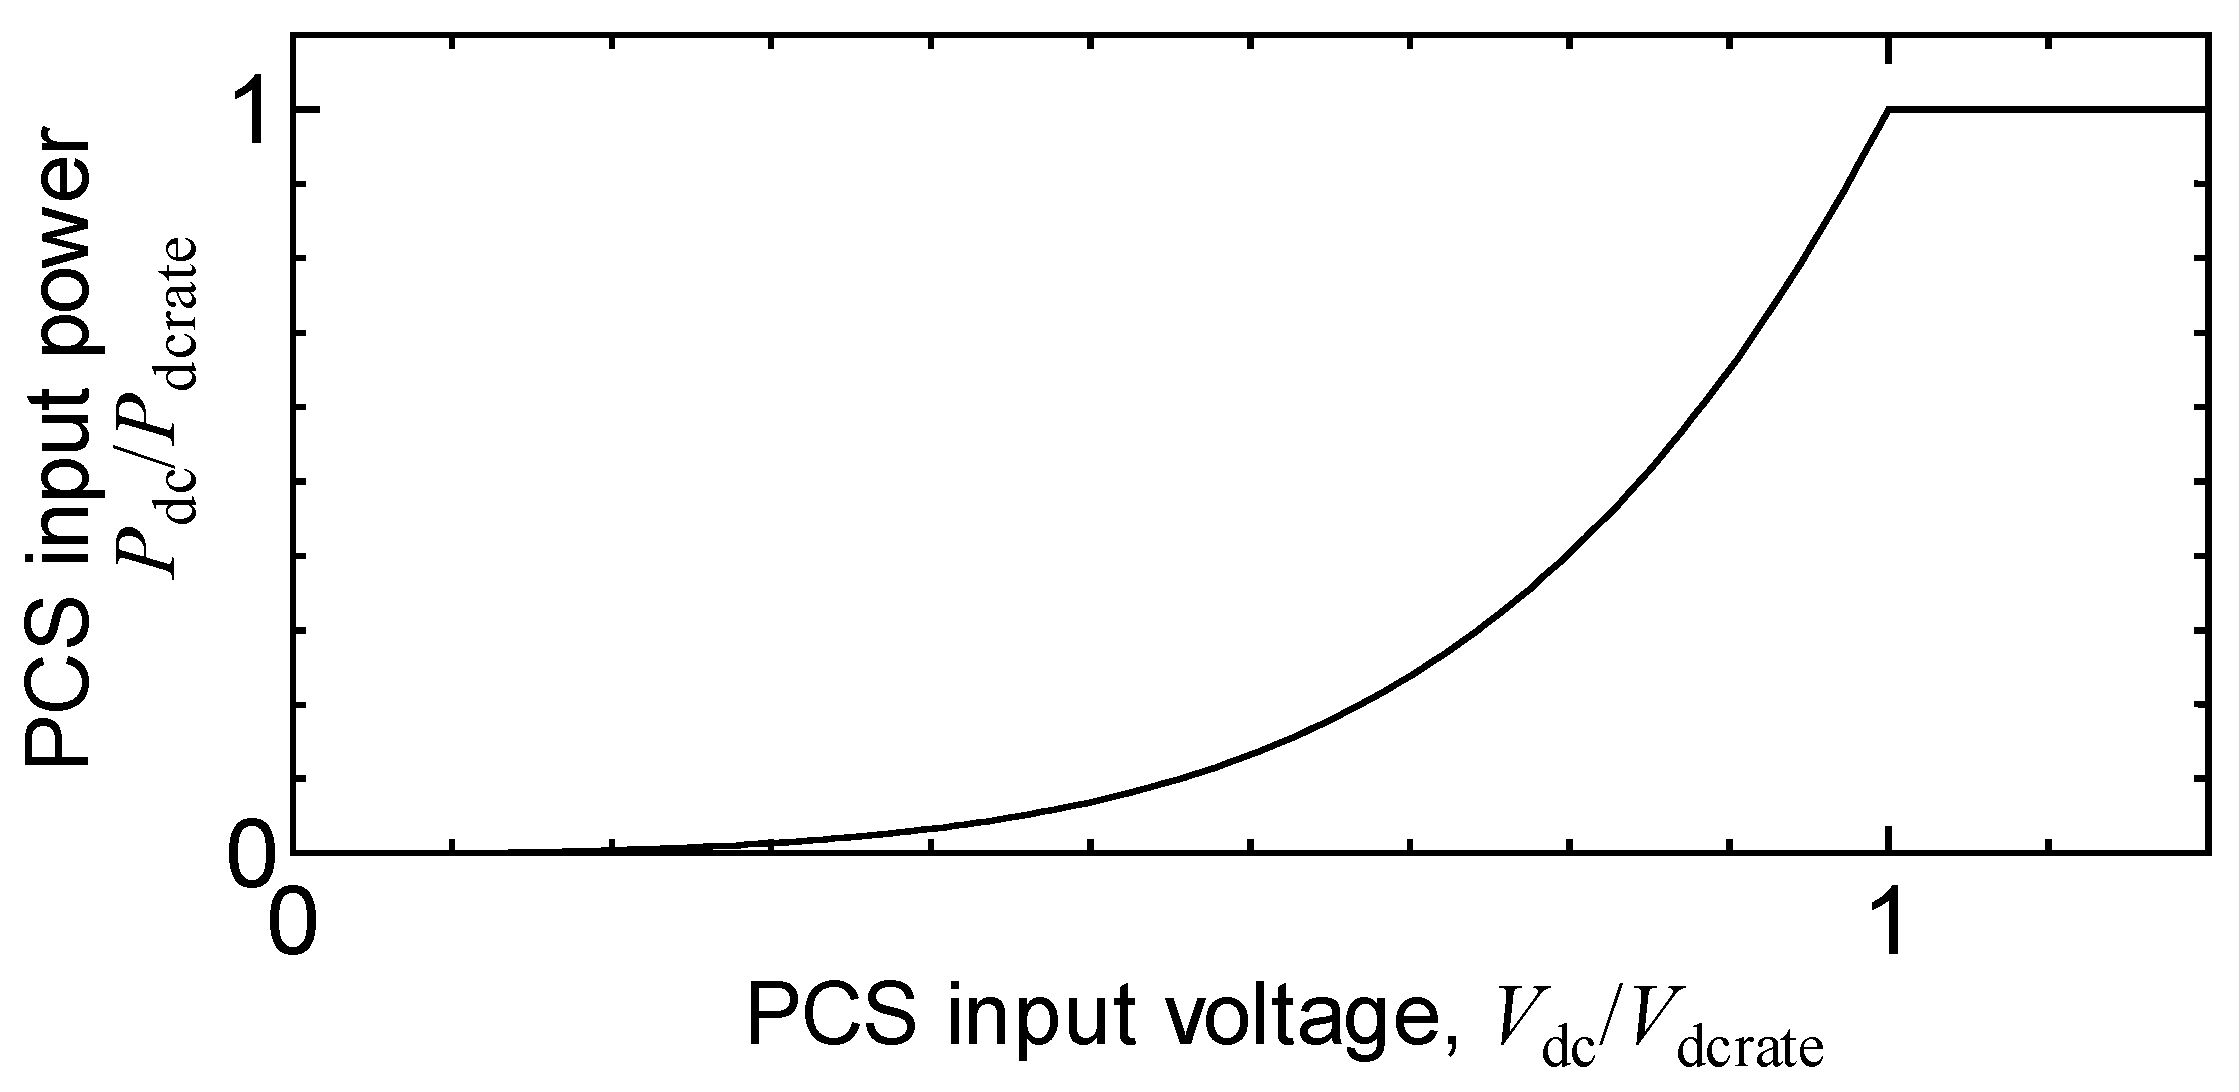
- The mechanical input power is proportional to the cube of turbine angular velocity , as described in Section 2.2, until reaches .
- Losses in the synchronous generator, rectifier, and PCS are neglected ().
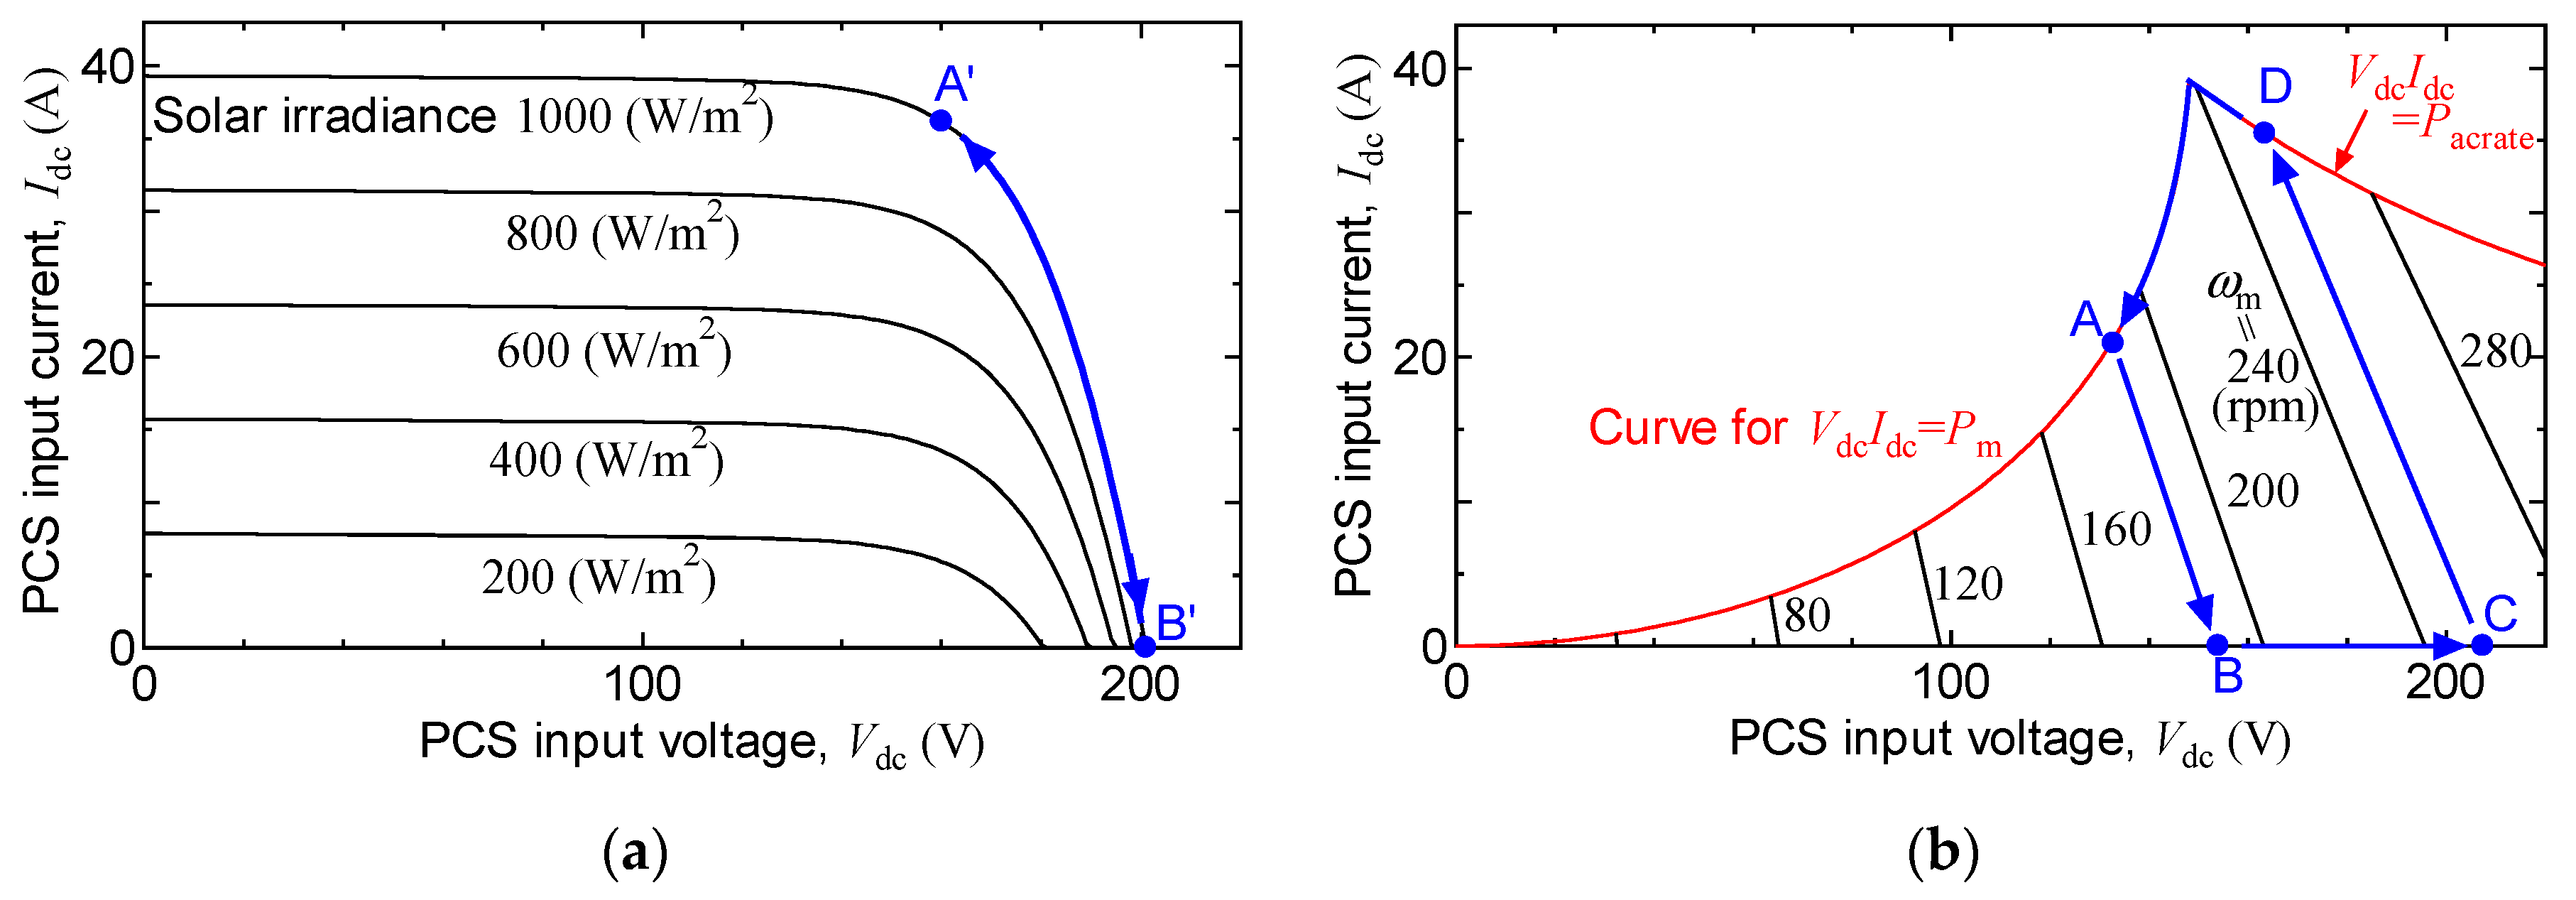
- The input side circuit (including the synchronous generator and the rectifier), which is connected to the input terminal of the PCS, is replaced by a Thevenin equivalent circuit that consists of an equivalent voltage source connected in series with an equivalent impedance .
- The equivalent voltage source , which is at , is proportional to , as the induced voltage of the synchronous generator.
- The equivalent impedance is represented by , where and are related to the armature resistance and synchronous inductance of the synchronous generator, respectively.
4. FRT Test of 1-kW SWTs
5. Conclusions
Author Contributions
Funding
Acknowledgments
Conflicts of Interest
References
- Li, Y.; Gao, W.; Ruan, Y. Performance investigation of grid-connected residential PV-battery system focusing on enhancing self-consumption and peak shaving in Kyushu, Japan. Renew. Energy 2018, 127, 514–523. [Google Scholar] [CrossRef]
- Li, Y.; Gao, W.; Ruan, Y. Quantifying variabilities and impacts of massive photovoltaic integration in public power systems with PHS based on real measured data of Kyushu, Japan. Energy Procedia 2018, 152, 883–888. [Google Scholar] [CrossRef]
- IEA Wind TCP, 2015 Annual Report. 30 Japan. pp. 160–165. Available online: https://community.ieawind.org/publications/ar (accessed on 29 November 2019).
- GWEC. Global Wind Report. Annual Market Update 2017. p. 50. Available online: https://gwec.net/publications/global-wind-report-2/ (accessed on 29 November 2019).
- Ogimoto, K.; Kaizuka, I.; Ueda, Y.; Oozeki, T. A Good Fit: Japan’s Solar Power Program and Prospects for the New Power System. IEEE Power Energy Mag. 2013, 11, 65–74. [Google Scholar] [CrossRef]
- Ding, G.; Gao, F.; Tian, H.; Ma, C.; Chen, M.; He, G.; Liu, Y. Adaptive DC-Link Voltage Control of Two-Stage Photovoltaic Inverter During Low Voltage Ride-Through Operation. IEEE Trans. Power Electron. 2016, 31, 4182–4194. [Google Scholar] [CrossRef]
- Conroy, J.F.; Watson, R. Low-voltage ride-through of a full converter wind turbine with permanent magnet generator. IET Renew. Power Gener. 2007, 1, 182–189. [Google Scholar] [CrossRef]
- Yang, L.; Xu, Z.; Østergaard, J.; Dong, Z.Y.; Wong, K.P. Advanced Control Strategy of DFIG Wind Turbines for Power System Fault Ride Through. IEEE Trans. Power Syst. 2012, 27, 713–722. [Google Scholar] [CrossRef]
- Benbouzid, M.; Beltran, B.; Amirat, Y.; Yao, G.; Han, J.; Mangel, H. Second-order sliding mode control for DFIG-based wind turbines fault ride-through capability enhancement. ISA Trans. 2014, 53, 827–833. [Google Scholar] [CrossRef] [PubMed]
- Wood, D. Small Wind Turbines; Springer: London, UK, 2011; pp. 4–19. [Google Scholar]
- Hansen, A.D.; Michalke, G. Multi-pole permanent magnet synchronous generator wind turbines’ grid support capability in uninterrupted operation during grid faults. IET Renew. Power Gener. 2009, 3, 333–348. [Google Scholar] [CrossRef]
- van der Hooft, E.L.; Schaak, P.; van Engelen, T.G. Wind turbine control algorithms; Netherlands Energy Research Foundation ECN: Petten, The Netherlands, 2013; pp. 1–94. [Google Scholar]
- Knudsen, H.; Nielsen, J.N. Introduction to the Modelling of Wind Turbines. In Wind Power in Power Systems, 2nd ed.; Ackermann, T., Ed.; John Wiley & Sons: Chichester, UK, 2012; pp. 769–797. [Google Scholar]
- Sørensen, P.E.; Hansen, A.D.; Christensen, P.; Mieritz, M.; Bech, J.; Bak-Jensen, B.; Nielsen, H. Simulation and Verification of Transient Events in Large Wind Power Installations; Forskningscenter Risø: Roskilde, Denmark, 2003; Risø-R-1331(EN). [Google Scholar]
- Slootweg, J.G.; Polinder, H.; Kling, W.L. Dynamic modelling of a wind turbine with doubly fed induction generator. In Proceedings of the 2001 IEEE PES Summer Meeting, Vancouver, BC, Canada, 15–19 July 2001; pp. 644–649. [Google Scholar]
- Salman, S.K.; Teo, A.L.J. Windmill modeling consideration and factors influencing the stability of a grid-connected wind power-based embedded generator. IEEE Trans. Power Syst. 2003, 18, 793–802. [Google Scholar] [CrossRef]
- Petru, T.; Thiringer, T. Modeling of Wind Turbines for Power System Studies. IEEE Trans. Power Syst. 2002, 17, 1132–1139. [Google Scholar] [CrossRef]
- Rasila, M. Torque- and Speed Control of a Pitch Regulated Wind Turbine. Master’s Thesis, Chalmers University of Technology, Göteborg, Sweden, 2003. [Google Scholar]
- Aoki, S.; Kogaki, T.; Sakurai, K. Construction of the aero-elastic simulation model (AIST-RAM) for Horizontal Axis Small Wind Turbine. J. JWEA 2017, 41, 40–47. (In Japanese) [Google Scholar]
- Kot, R.; Rolak, M.; Malinowski, M. Comparison of maximum peak power tracking algorithms for a small wind turbine. Math. Comput. Simul. 2013, 91, 29–40. [Google Scholar] [CrossRef]
- Morren, J.; Pierik, J.; de Haan, S.W.H. Inertial response of variable speed wind turbines. Electr. Power Syst. Res. 2006, 76, 980–987. [Google Scholar] [CrossRef]
- Engleitner, R.; Nied, A.; Cavalca, M.S.M.; da Costa, J.P. Dynamic Analysis of Small Wind Turbines Frequency Support Capability in a Low-Power Wind-Diesel Microgrid. IEEE Trans. Ind. Appl. 2018, 54, 102–111. [Google Scholar] [CrossRef]
- Japan Electrical Safety & Environment Technology Laboratories. Individual Test Method of Grid-Connected Protective Equipment etc. for Multi-Unit Grid-Connected PV Power Generating Systems, JET GR 0003-4-3.0; Japan Electrical Safety & Environment Technology Laboratories: Japan, 2014. (In Japanese) [Google Scholar]
- Funamoto, T.; Matsumoto, K.; Mizuno, H.; Tuyen, N.D.; Kondoh, J. Development of an FRT test system for a small wind turbine on real field (1) A resistor with automatic load control. Natl. Conv. Rec. IEE Jpn. 2016, 7-072, 105–106. (In Japanese) [Google Scholar]
- Specialized sectional committee regarding Grid Interconnection. Grid-Interconnection Code. JEAC 9701-2012; The Japan Electric Association: Tokyo, Japan, 2013. (In Japanese) [Google Scholar]
- Ikeno, T.; Utsumi, A.; Hirachi, K.; Nakagawa, S. MPPT method based on I-V characteristics Estimation by equivalent circuit model of PV module. IEEJ Trans. Power Energy 2018, 138, 514–520. (In Japanese) [Google Scholar] [CrossRef]
- Airdolphin GTO. Available online: https://www.zephyreco.co.jp/en/products/airdolphin_gto.jsp (accessed on 20 September 2019).
- The Compact Wind Turbine Generator. Available online: https://www.power-generator.jp/en/product/wind_power/n1000.html (accessed on 20 September 2019).
- Kwon, J.M.; Kwon, B.H.; Nam, K.H. Grid-Connected Photovoltaic Multistring PCS with PV Current Variation Reduction Control. IEEE Trans. Ind. Electron. 2009, 56, 4381–4388. [Google Scholar] [CrossRef]


| Rated Power | Turbine Inertia | Generator Inertia | Gear Ratio | Num. of Pole Pairs | Freq. of Generator Voltage 1 | Inertia Constant | Source |
|---|---|---|---|---|---|---|---|
| [12] | |||||||
| [13] | |||||||
| [14] | |||||||
| [15] | |||||||
| [16] | |||||||
| [17] | |||||||
| [18] | |||||||
| [19] 2 | |||||||
| [20] 3 | |||||||
© 2019 by the authors. Licensee MDPI, Basel, Switzerland. This article is an open access article distributed under the terms and conditions of the Creative Commons Attribution (CC BY) license (http://creativecommons.org/licenses/by/4.0/).
Share and Cite
Kondoh, J.; Mizuno, H.; Funamoto, T. Fault Ride-Through Characteristics of Small Wind Turbines. Energies 2019, 12, 4587. https://doi.org/10.3390/en12234587
Kondoh J, Mizuno H, Funamoto T. Fault Ride-Through Characteristics of Small Wind Turbines. Energies. 2019; 12(23):4587. https://doi.org/10.3390/en12234587
Chicago/Turabian StyleKondoh, Junji, Hidetoshi Mizuno, and Takuji Funamoto. 2019. "Fault Ride-Through Characteristics of Small Wind Turbines" Energies 12, no. 23: 4587. https://doi.org/10.3390/en12234587
APA StyleKondoh, J., Mizuno, H., & Funamoto, T. (2019). Fault Ride-Through Characteristics of Small Wind Turbines. Energies, 12(23), 4587. https://doi.org/10.3390/en12234587