Reputation and Trust Approach for Security and Safety Assurance in Intersection Management System

 , , , , , , and
Abstract
:
1. Introduction
2. Related Work
2.1. VANETs
- Dynamic topology of the system. As described above, the VANETs should support communication between nodes in the conditions of their high mobility. For this reason, traditional authentication methods cannot be applied. Even though scientific papers propose solutions to these challenges, several issues remain unsolved [22].
- Time limits. The system safety depends on the time of data delivery and decision making based on the received data. To ensure safe operation, it is necessary to adhere to strict limits on the time of delivery, processing, and sending data, since the high dynamics of the system leaves critically little time for data processing.
- Network scale. Prospects for the development of VANETs imply a large number of nodes interacting with each other, and the number of nodes constantly changes. Safe and stable operation of the entire system requires a scalable network infrastructure that can operate in an ever-changing network topology.
- Ability to counter malicious network attacks. As in any network, VANETs are prone to malicious attacks. Since the functioning of VANETs is directly related to the participation of people, the implementation of an attack on VANETs can lead to critical consequences. Necessary mechanisms to counter attacks should include authentication procedures, non-repudiation, access control, privacy protection, confidentiality, integrity, and accessibility assurance. Classification of attacks to which AVs in VANETs are exposed is given in [5].
- Fault-tolerance. ITS collects and processes data obtained from vehicle sensors and uses it to optimize traffic and broadcast emergency and informational messages. The transmission of incorrect data due to a malfunctioning vehicle sensor, for example data on the speed or current location, can lead to traffic accidents and endanger other road users.
2.2. Trust and Reputation Models and Approaches in VANETs
3. Trust and Reputation Approach Description
3.1. Truth, Trust and Reputation Models
- Passive knowledge represents the current knowledge about the environment that is not the result of collaborative actions.
- Active knowledge is the knowledge gained in the process of collaborative actions.
- , where is the truth of data, received from agent ;
- , where is the reputation of the agent , calculated by agent ; and
- , where is the trust value to agent of agent .
3.1.1. Truth
3.1.2. Reputation
3.1.3. Trust
4. Empirical Study
4.1. Software Simulation
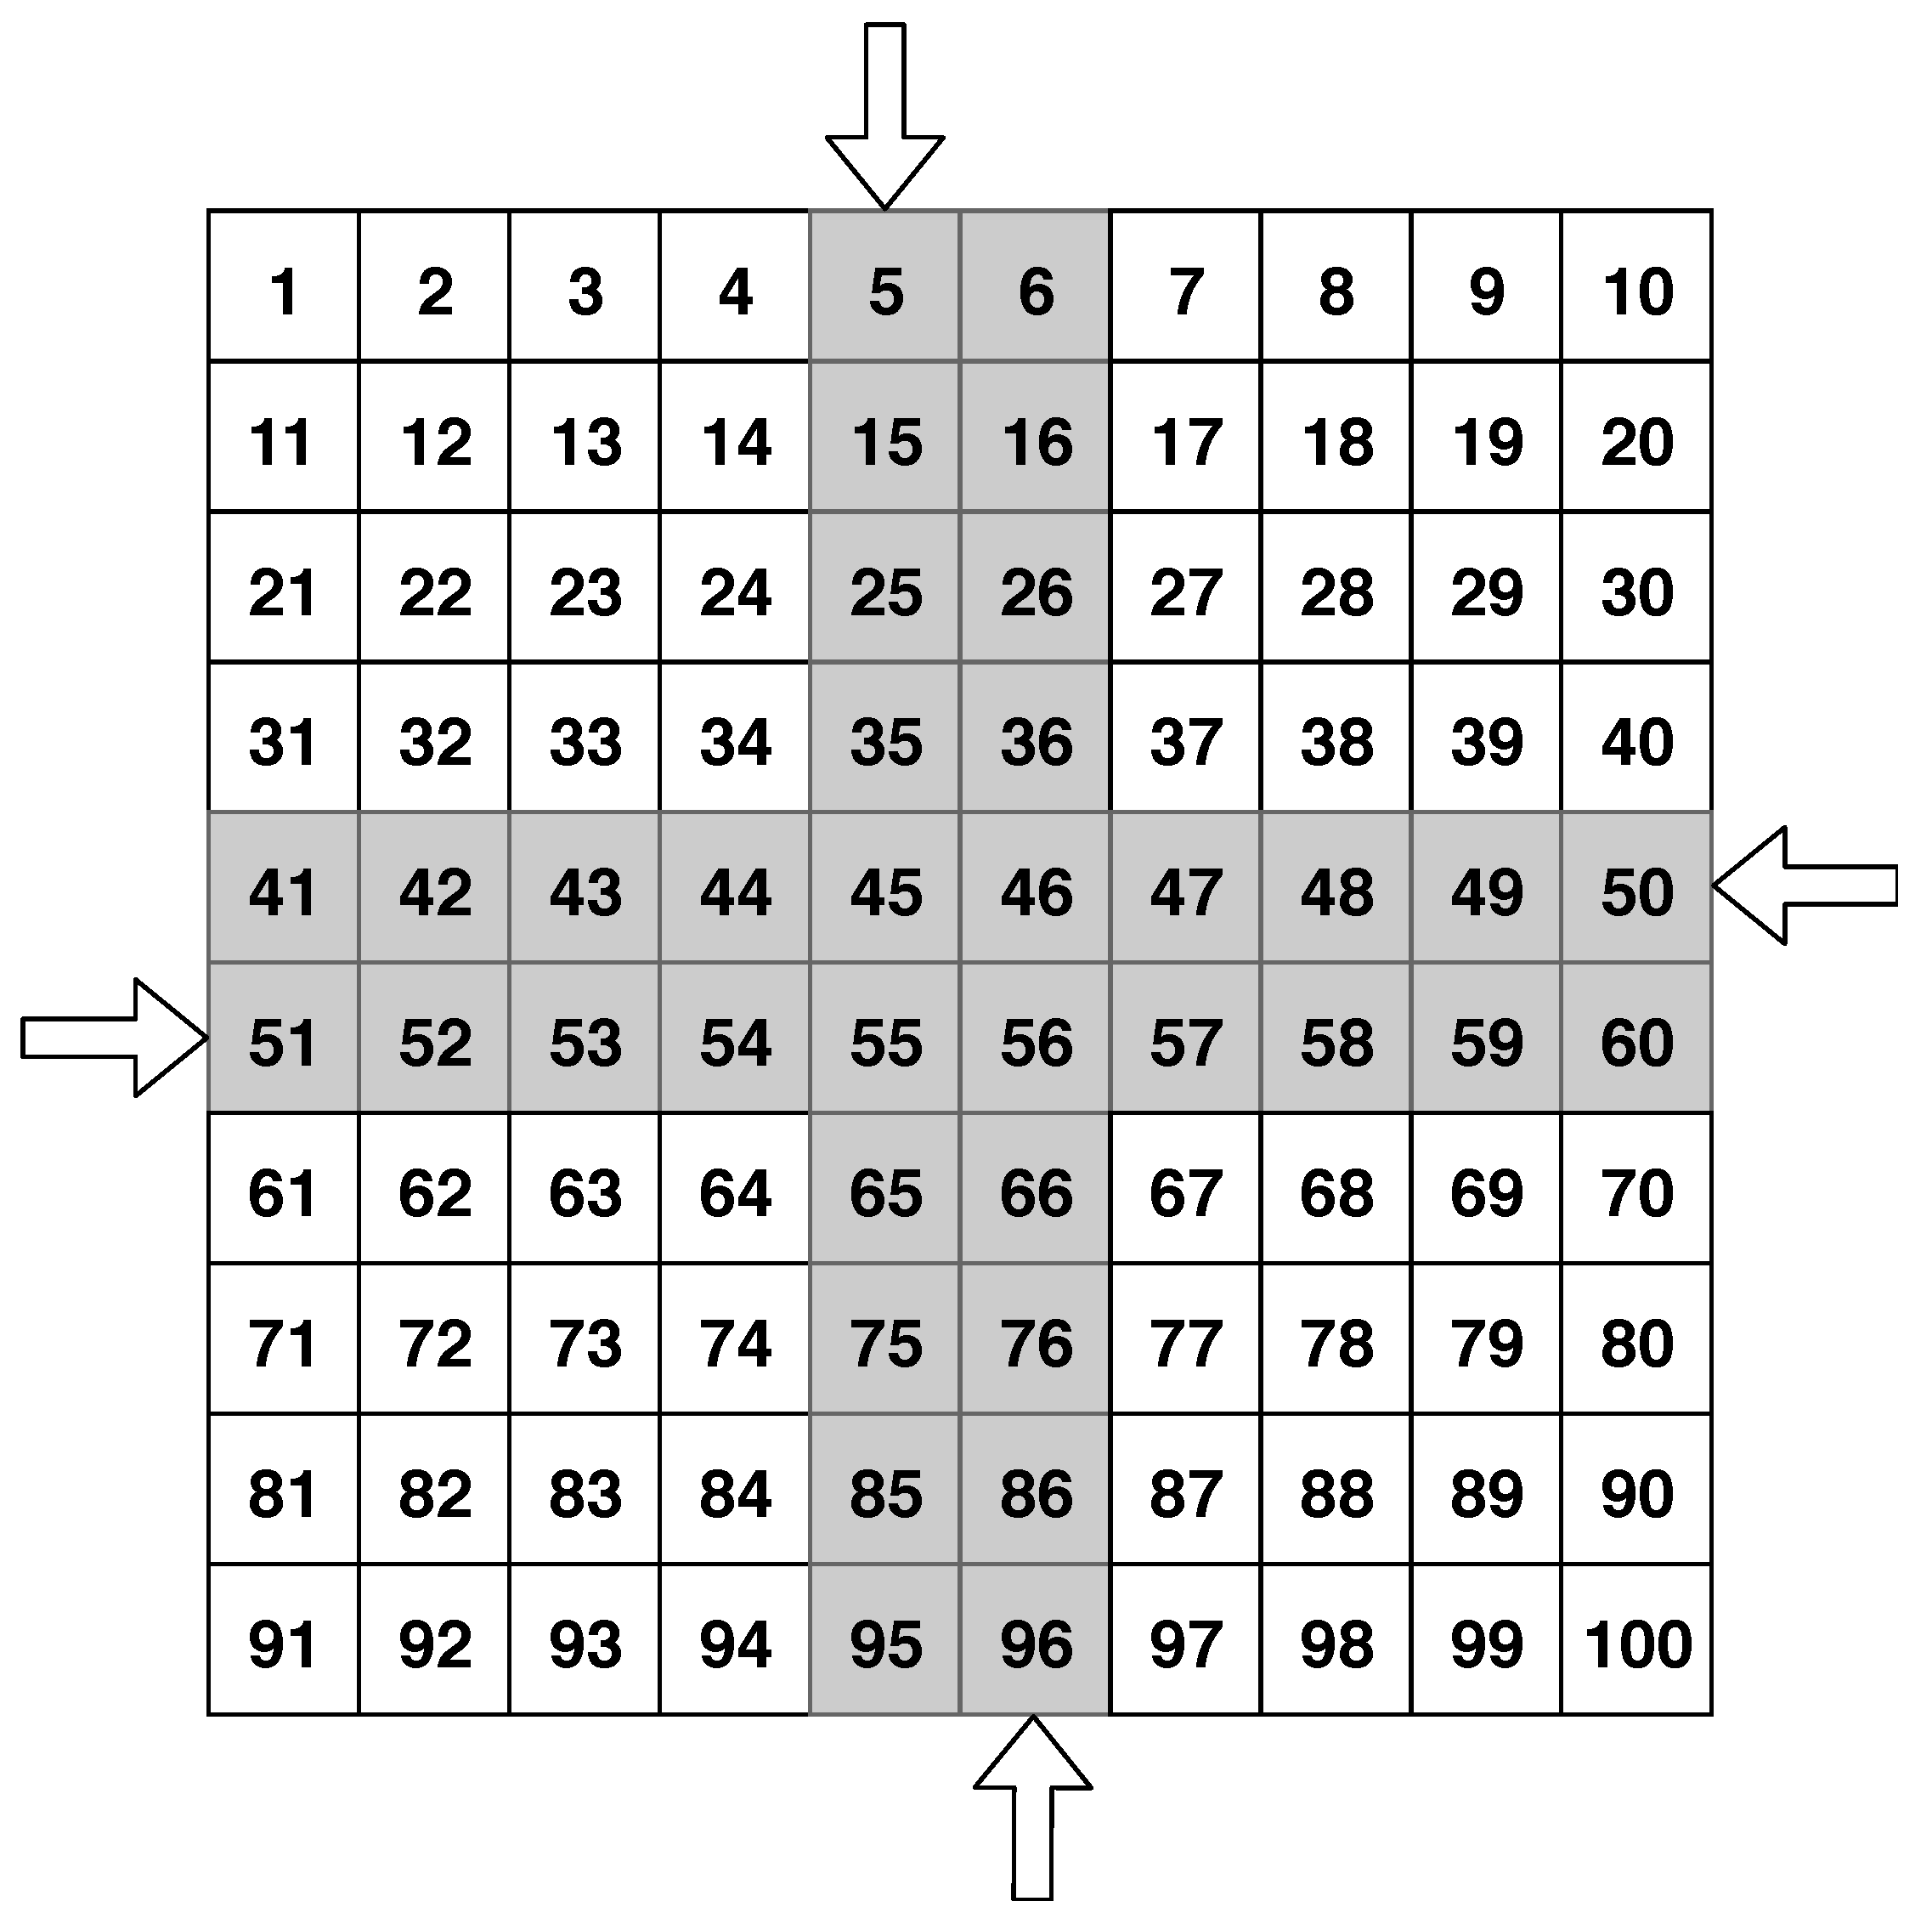
- The software testing ground is represented as matrix and is divided into square elementary sectors.
- The road map is known to all the AVs.
- There are only straight roads and their coordinates coincide with the coordinates of the elementary sectors located in the same row or column.
- Each road must belong to either vertical or horizontal type.
- m is the set of elementary sectors, based on a road map, and the planned start and final positions of the MAV.
- s is the speed; speed is understood as the amount of elementary sectors crossed by a MAV per one conditional discretized time segment.
- is the sequence of steps for the MAV to go through the planned path (calculated on the basis of m and s; one step is passed in one conditional discretized time segment).
- There is an array of reputation values of other MAVs for each discretized time segment t from the beginning of the interaction to the discretized time segment preceding the current interval : .
4.1.1. Experiments Setup
Movement
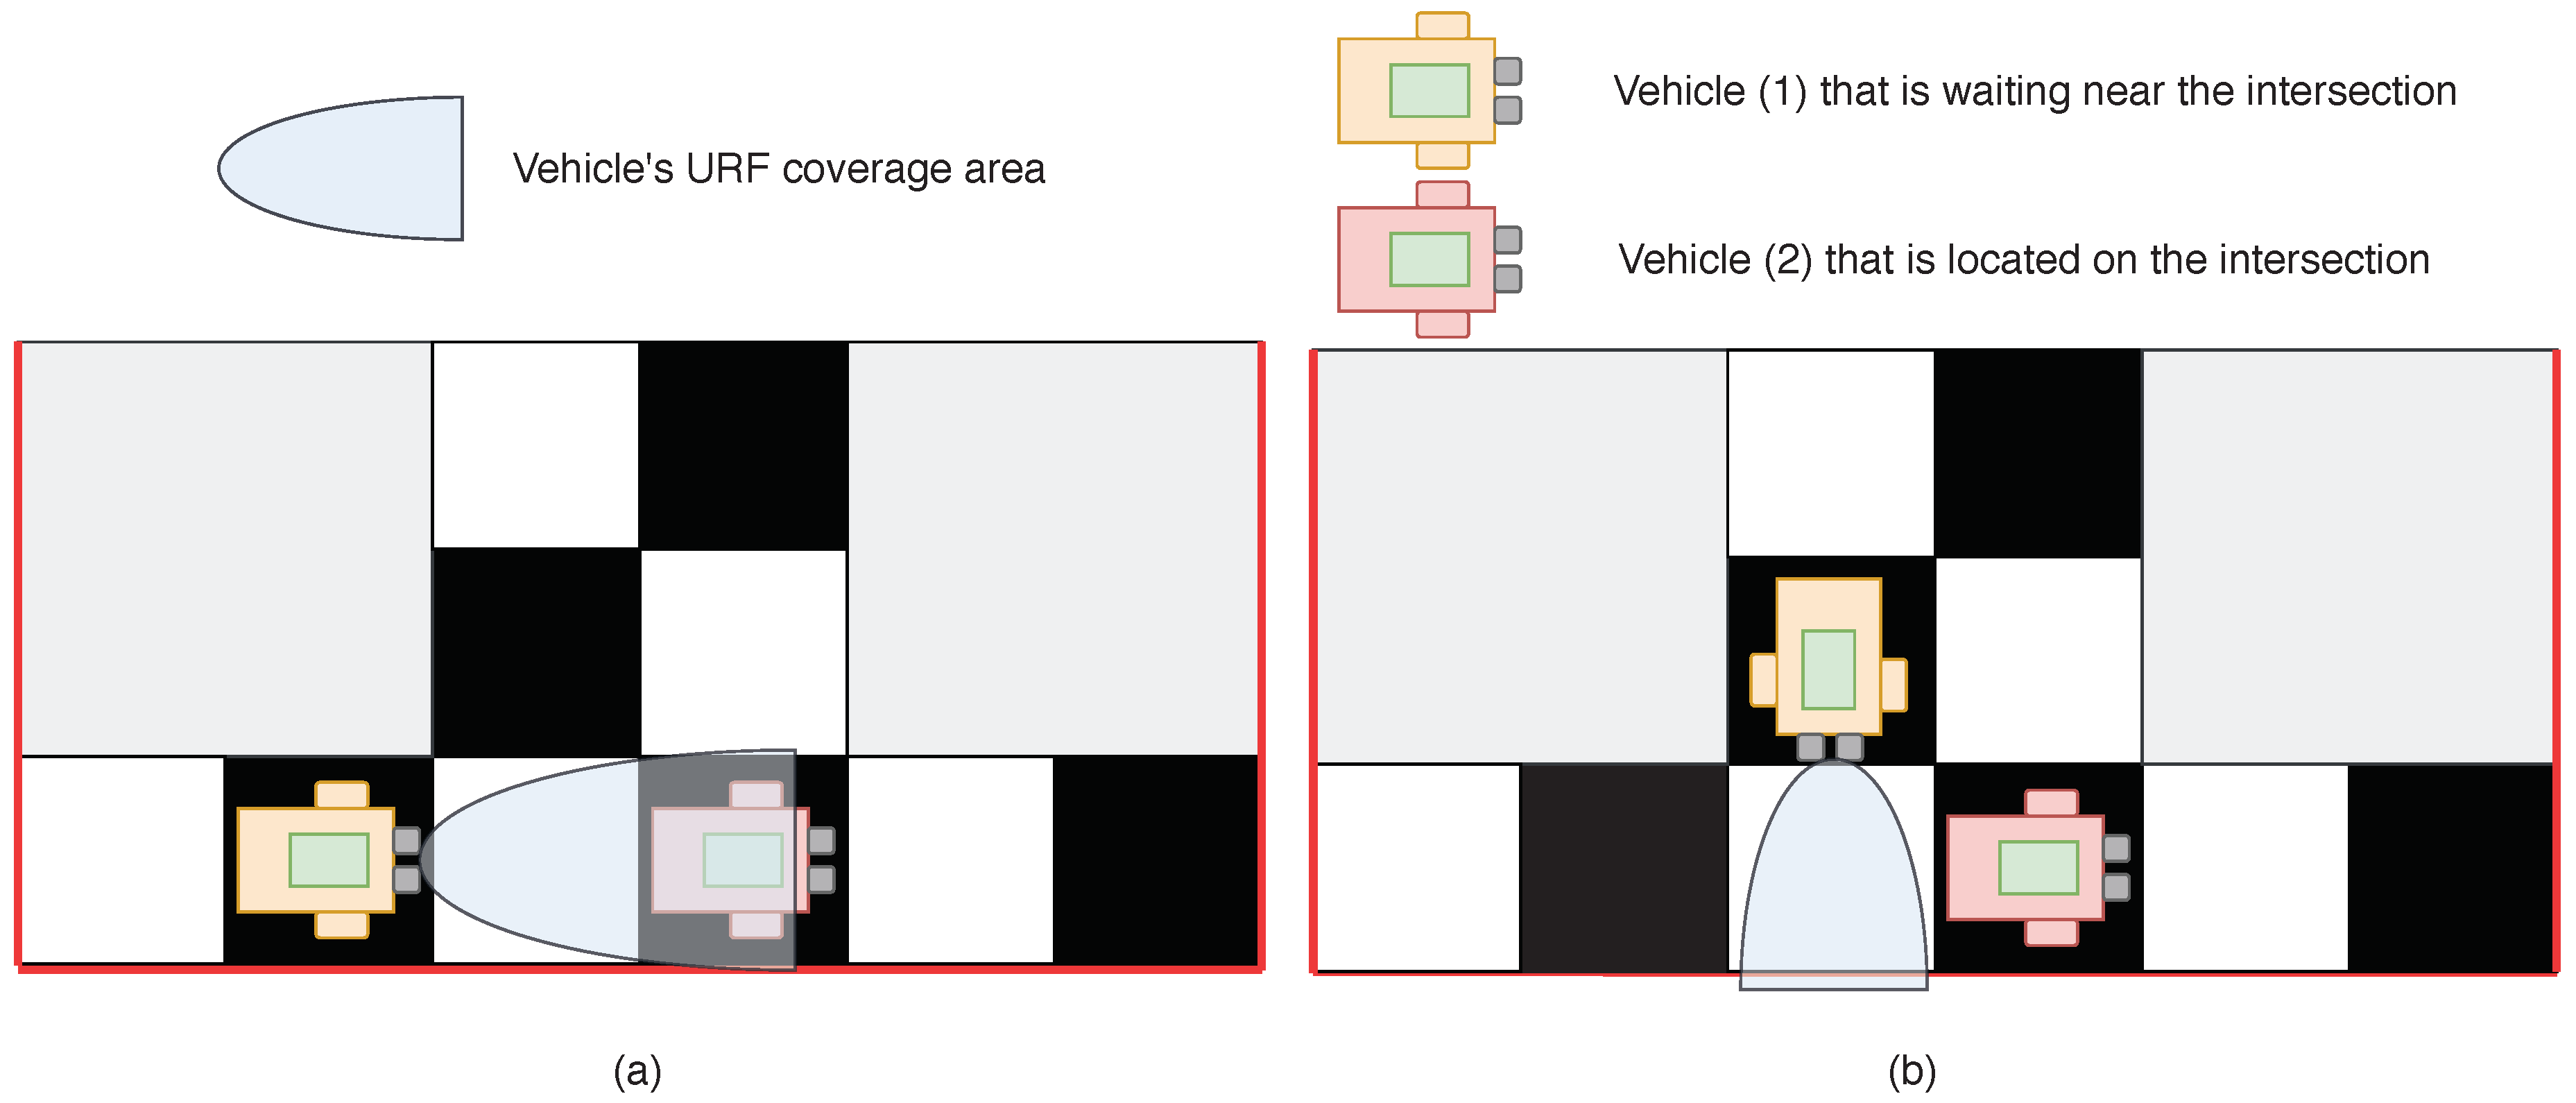
- Testing ground: elementary sectors; 4 lanes for AVs driving: 2 vertical (oncoming and passing), 2 horizontal (oncoming and passing); an example of the software testing ground is represented in the Figure 1.
- MAVs can drive in any direction within the roadway, according to the direction of the roads.
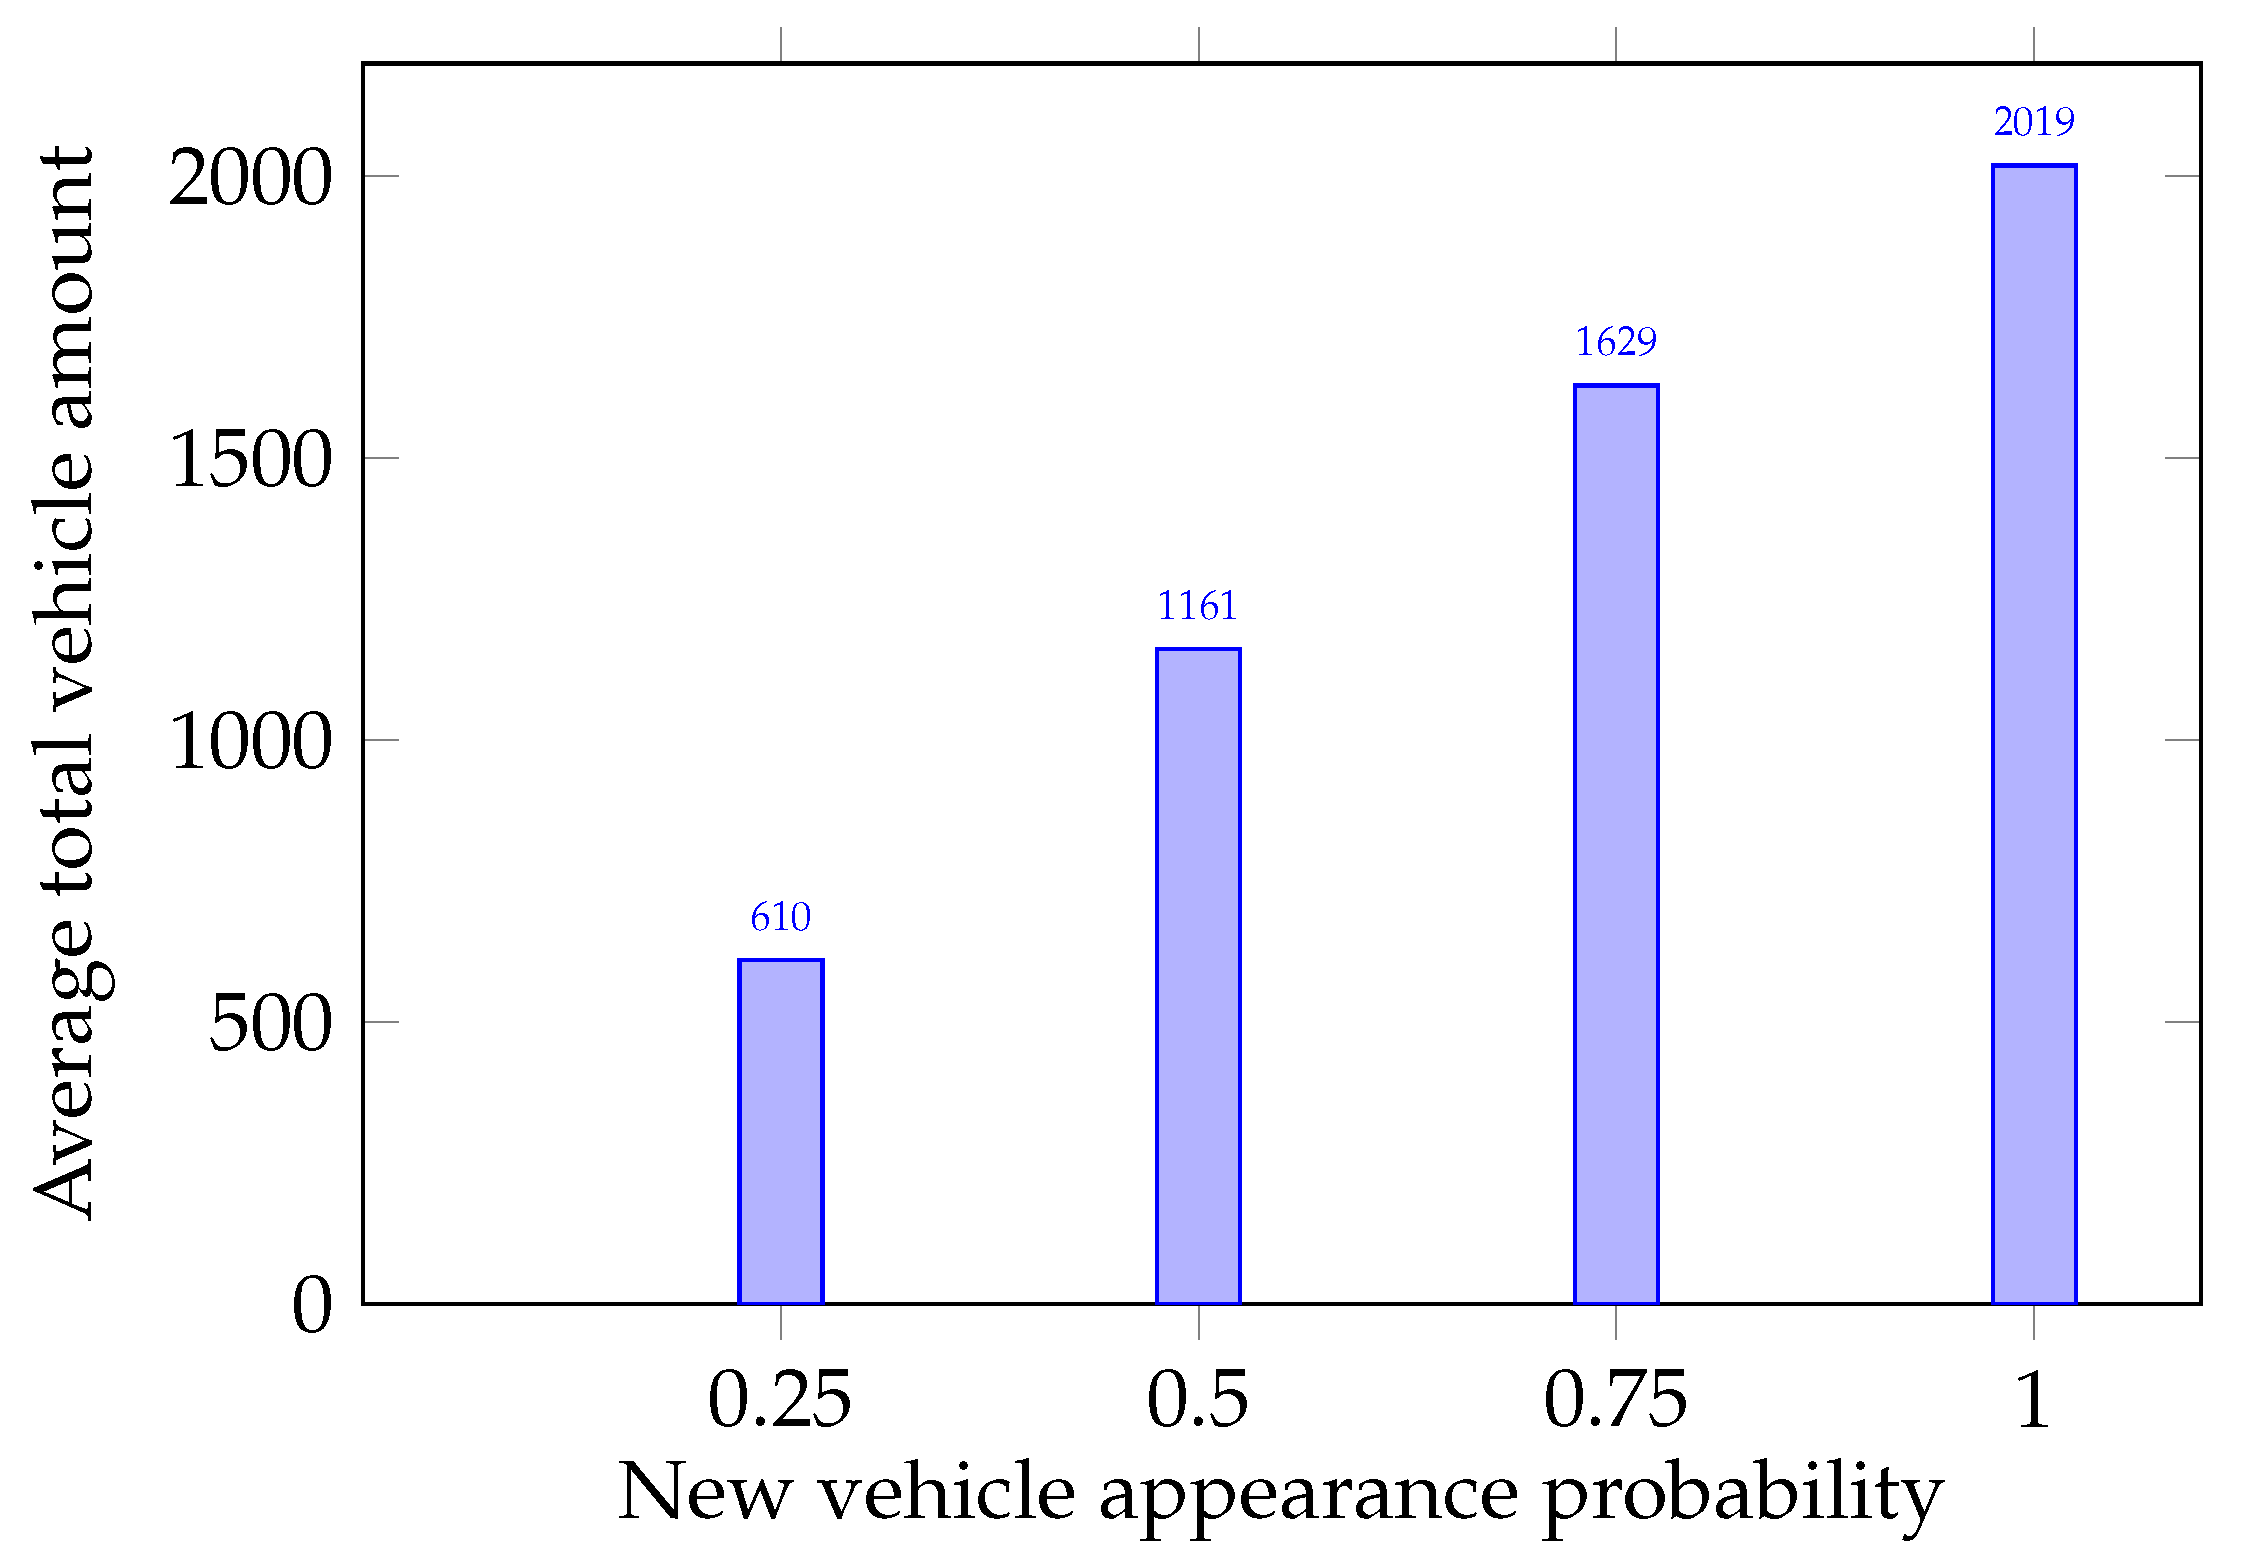
- On the testing ground, the probability of the appearance of new MAVs is given in advance, while the number of appearing MAVs is determined randomly.
- MAVs speed is constant and equal to 1.
- The testing ground is spatially limited.
- In the case more than one MAVs pretend to be in the same elementary section contemporaneously, the MAVs give way to each other, taking into account the maximization of the intersection capacity, as in Equation (13):where N is the number of MAVs, passing the intersection; L is the number of elementary sections at the intersection; and M is the number of discretized time segments, for which N vehicles passed the intersection.
Simulation Organization
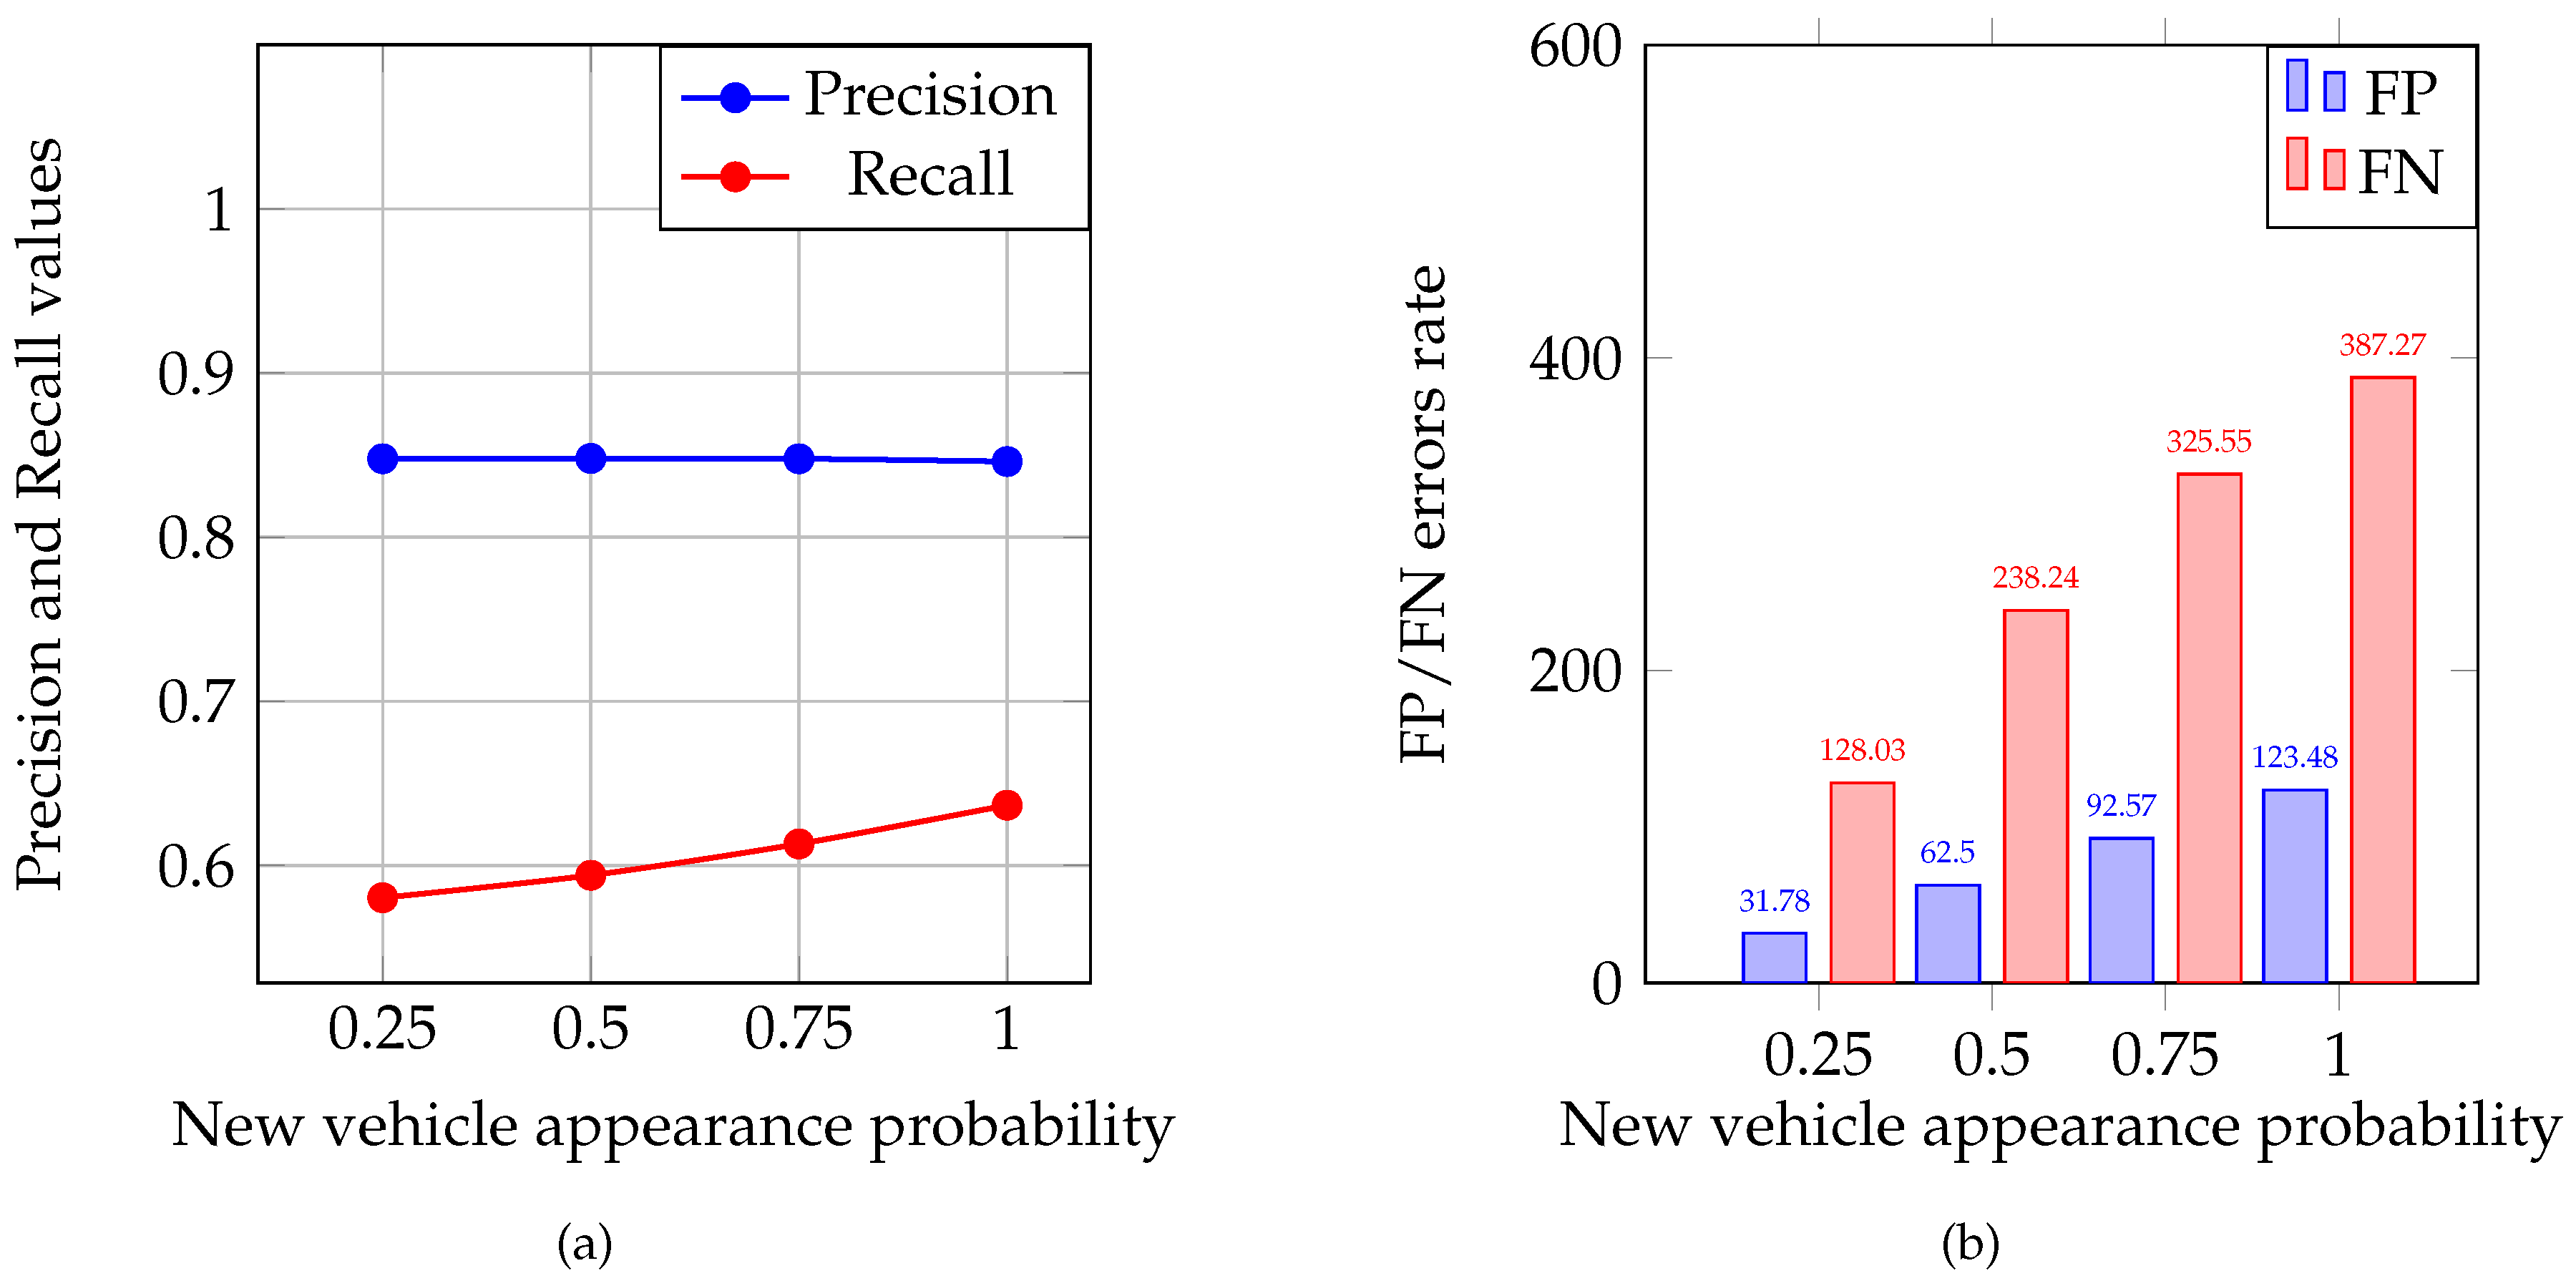
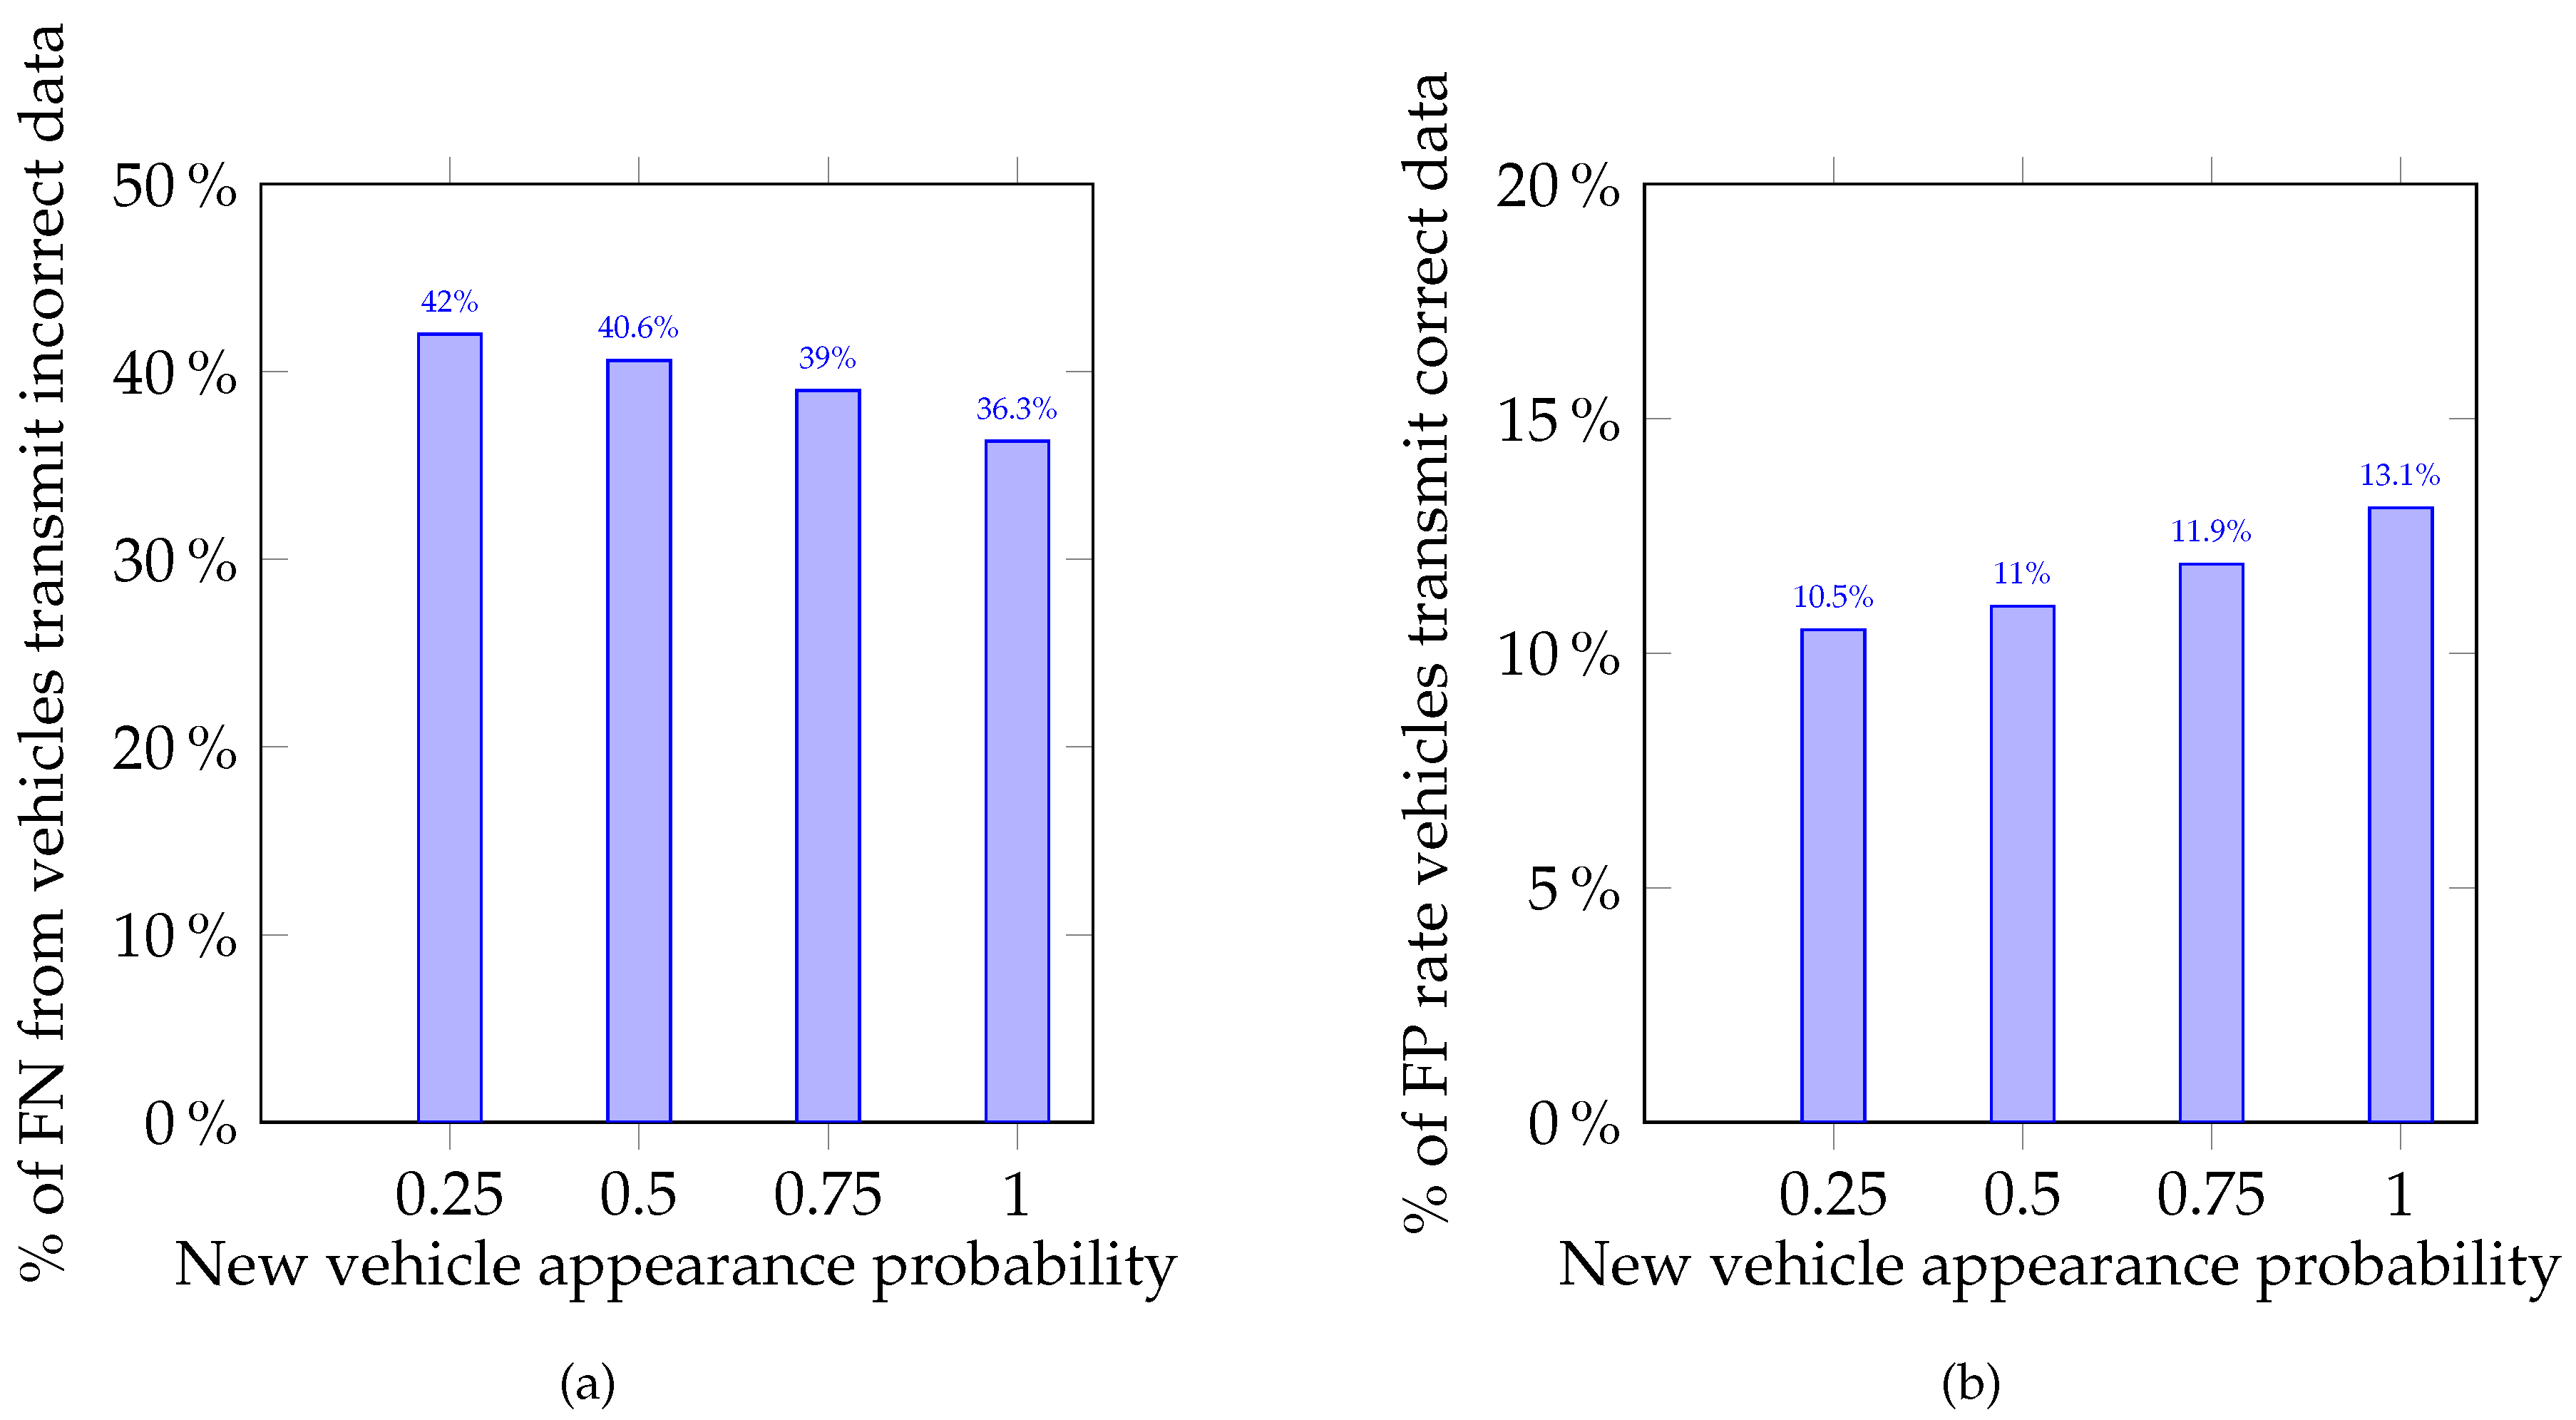
- The experiment was divided into four groups with the probability of a new vehicle appearance with the values equal to 0.25, 0.5, 0.75, and 1, respectively.
- Each experiment group had 1000 tests with a duration of 1000 discretized time segments.
Reputation Calculation
- The initial value of MAV reputation was set as 0.5.
- The probability that new MAV was a saboteur (could transmit bogus data) was 0.5.
- A saboteur, depending on the situation, could transmit either correct or incorrect data.
- The legitimate MAV also could transmit incorrect data due to technical failures; the probability of MAV technical fail occurrence was set as 10%.
- If the vehicle transmitted incorrect data, then its value was equal to 0, otherwise .
- The MAV was detected as saboteur if its reputation was equal to or less than 0.25; such a strict threshold meant that neither saboteurs nor legitimate MAVs with technical problems should not leave the road, because they can quickly cause traffic collapses and provoke fatal consequences.
Limitations
- The simulation was conducted in the traffic area without pedestrians.
- No vehicle had the priority except maximum intersection capacity value.
- No external obstacles were situated on the roads.
Results Validation
- To assess the results, four parameters were calculated: true positive (TP), false positive (FP), true negative (TN), and false negative (FN):
- -
- TP is the case when data transmitted by a MAV were bogus, and its MAV was classified by another group as a saboteur.
- -
- FP is the case when data transmitted by a MAV were correct and its MAV was classified by another group as a saboteur.
- -
- TN is the case when data transmitted by a MAV were correct and its MAV was classified by another group as legitimate.
- -
- FN is the case when data transmitted by a MAV were bogus and its MAV was classified by another group as legitimate.
4.1.2. Results
4.2. Physical Simulation
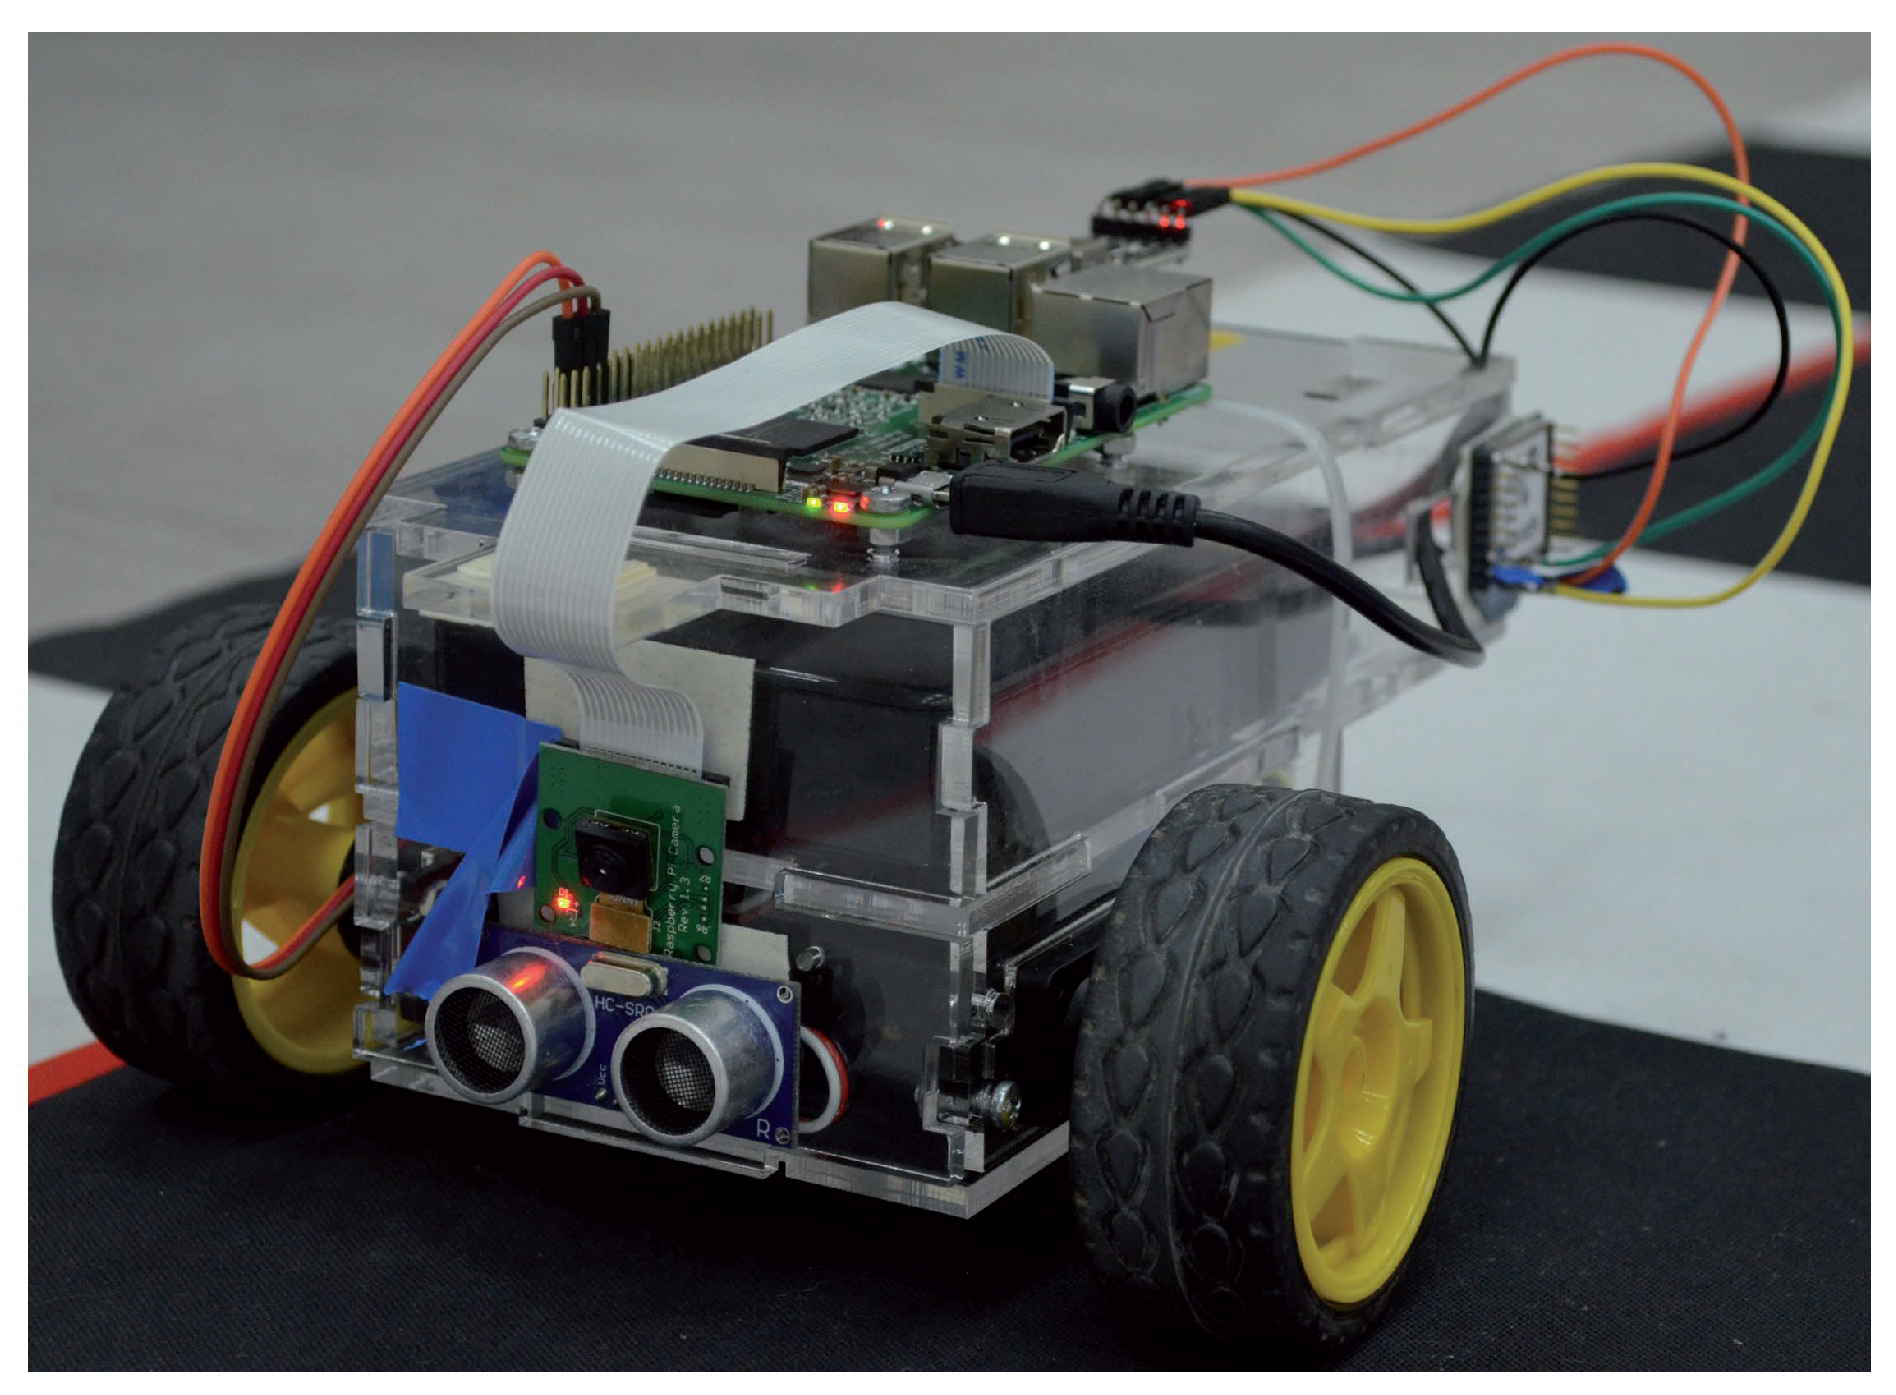
4.2.1. Description of the Physical Testing Ground
- single on-board computer;
- servos’ control module;
- two servos;
- video-camera;
- ultrasonic range finder (URF);
- wireless module; and
- power supply unit.
4.2.2. Physical Simulation Setup
4.3. Results
5. Discussion
6. Conclusions and Future Work
Author Contributions
Funding
Conflicts of Interest
References
- An, S.H.; Lee, B.H.; Shin, D.R. A survey of intelligent transportation systems. In Proceedings of the 2011 Third International Conference on Computational Intelligence, Communication Systems and Networks, Bali, Indonesia, 26–28 July 2011; pp. 332–337. [Google Scholar]
- World Health Organization. Global Status Report on Road Safety 2018: Summary; Technical Report; World Health Organization: Geneva, Switzerland, 2018. [Google Scholar]
- Sugiyama, Y.; Fukui, M.; Kikuchi, M.; Hasebe, K.; Nakayama, A.; Nishinari, K.; Tadaki, S.i.; Yukawa, S. Traffic jams without bottlenecks—Experimental evidence for the physical mechanism of the formation of a jam. New J. Phys. 2008, 10, 033001. [Google Scholar] [CrossRef]
- Dresner, K.; Stone, P. A multiagent approach to autonomous intersection management. J. Artif. Intell. Res. 2008, 31, 591–656. [Google Scholar] [CrossRef]
- Petit, J.; Shladover, S.E. Potential cyberattacks on automated vehicles. IEEE Trans. Intell. Transp. Syst. 2014, 16, 546–556. [Google Scholar] [CrossRef]
- Erol, R.; Sahin, C.; Baykasoglu, A.; Kaplanoglu, V. A multi-agent based approach to dynamic scheduling of machines and automated guided vehicles in manufacturing systems. Appl. Soft Comput. 2012, 12, 1720–1732. [Google Scholar] [CrossRef]
- Viksnin, I.I.; Zikratov, I.A.; Shlykov, A.A.; Belykh, D.L.; Komarov, I.I.; Botvin, G.A. Planning of Autonomous Multi-agent Intersection. In ITM Web of Conferences; EDP Sciences: Les Ulis, France, 2016; Volume 8, p. 01007. [Google Scholar]
- Chuprov, S.; Viksnin, I.; Kim, I.; Nedosekin, G. Optimization of Autonomous Vehicles Movement in Urban Intersection Management System. In Proceedings of the 2019 24th Conference of Open Innovations Association (FRUCT), Moscow, Russia, 8–12 April 2019; pp. 60–66. [Google Scholar]
- Toh, C.K. Ad Hoc Mobile Wireless Networks: Protocols and Systems; Pearson Education: London, UK, 2001. [Google Scholar]
- Zanjireh, M.M.; Shahrabi, A.; Larijani, H. Anch: A new clustering algorithm for wireless sensor networks. In Proceedings of the 2013 27th International Conference on Advanced Information Networking and Applications Workshops, Barcelona, Spain, 25–28 March 2013; pp. 450–455. [Google Scholar]
- Lu, N.; Cheng, N.; Zhang, N.; Shen, X.; Mark, J.W. Connected vehicles: Solutions and challenges. IEEE Internet Things J. 2014, 1, 289–299. [Google Scholar] [CrossRef]
- Ezell, S. Intelligent Transportation Systems; The Information Technology & Innovation Foundation: Washington, DC, USA, January 2010. [Google Scholar]
- Azmat, M.; Kummer, S.; Moura, L.T.; Gennaro, F.D.; Moser, R. Future Outlook of Highway Operations with Implementation of Innovative Technologies Like AV, CV, IoT and Big Data. Logistics 2019, 3, 15. [Google Scholar] [CrossRef]
- Miller, H.J.; Shaw, S.L. Geographic Information Systems for Transportation: Principles and Applications; Oxford University Press on Demand: Ottawa, ON, Canada, 2001. [Google Scholar]
- Hartenstein, H.; Laberteaux, L. A tutorial survey on vehicular ad hoc networks. IEEE Commun. Mag. 2008, 46, 164–171. [Google Scholar] [CrossRef]
- Uzcátegui, R.A.; De Sucre, A.J.; Acosta-Marum, G. Wave: A tutorial. IEEE Commun. Mag. 2009, 47, 126–133. [Google Scholar] [CrossRef]
- Mahmassani, H.S. 50th anniversary invited article—Autonomous vehicles and connected vehicle systems: Flow and operations considerations. Transp. Sci. 2016, 50, 1140–1162. [Google Scholar] [CrossRef]
- Yang, X.; Liu, L.; Vaidya, N.H.; Zhao, F. A vehicle-to-vehicle communication protocol for cooperative collision warning. In Proceedings of the First Annual International Conference on Mobile and Ubiquitous Systems: Networking and Services (MOBIQUITOUS 2004), Boston, MA, USA, 26 August 2004; pp. 114–123. [Google Scholar]
- Isaac, J.T.; Zeadally, S.; Camara, J.S. Security attacks and solutions for vehicular ad hoc networks. IET Commun. 2010, 4, 894–903. [Google Scholar] [CrossRef]
- Engoulou, R.G.; Bellaïche, M.; Pierre, S.; Quintero, A. VANET security surveys. Comput. Commun. 2014, 44, 1–13. [Google Scholar] [CrossRef]
- Mejri, M.N.; Ben-Othman, J.; Hamdi, M. Survey on VANET security challenges and possible cryptographic solutions. Veh. Commun. 2014, 1, 53–66. [Google Scholar] [CrossRef]
- Karnadi, F.K.; Mo, Z.H.; Lan, K.c. Rapid generation of realistic mobility models for VANET. In Proceedings of the 2007 IEEE Wireless Communications and Networking Conference, Kowloon, China, 11–15 March 2007; pp. 2506–2511. [Google Scholar]
- Hasrouny, H.; Samhat, A.E.; Bassil, C.; Laouiti, A. VANet security challenges and solutions: A survey. Veh. Commun. 2017, 7, 7–20. [Google Scholar] [CrossRef]
- Prasan, U.; Murugappan, S. An Analysis on Vehicular Ad-Hoc Networks: Research Issues, Challenges and Applications. Int. J. Appl. Eng. Res. 2016, 11, 4569–4575. [Google Scholar]
- Al-Kahtani, M.S. Survey on security attacks in Vehicular Ad hoc Networks (VANETs). In Proceedings of the 2012 6th International Conference on Signal Processing and Communication Systems, Gold Coast, Australia, 12–14 December 2012; pp. 1–9. [Google Scholar]
- Lo, N.W.; Tsai, H.C. Illusion attack on vanet applications-a message plausibility problem. In Proceedings of the 2007 IEEE Globecom Workshops, Washington, DC, USA, 26–30 November 2007; pp. 1–8. [Google Scholar]
- Patel, N.J.; Jhaveri, R.H. Trust based approaches for secure routing in VANET: A Survey. Procedia Comput. Sci. 2015, 45, 592–601. [Google Scholar] [CrossRef]
- Yang, N. A similarity based trust and reputation management framework for vanets. Int. J. Future Gener. Commun. Netw. 2013, 6, 25–34. [Google Scholar]
- Lu, Z.; Wang, Q.; Qu, G.; Liu, Z. Bars: A blockchain-based anonymous reputation system for trust management in vanets. In Proceedings of the 2018 17th IEEE International Conference On Trust, Security And Privacy in Computing and Communications/12th IEEE International Conference on Big Data Science And Engineering (TrustCom/BigDataSE), New York, NY, USA, 1–3 August 2018; pp. 98–103. [Google Scholar]
- Liu, Z.; Ma, J.; Jiang, Z.; Zhu, H.; Miao, Y. LSOT: A lightweight self-organized trust model in VANETs. Mob. Inf. Syst. 2016, 2016, 7628231. [Google Scholar] [CrossRef]
- Li, W.; Song, H. ART: An attack-resistant trust management scheme for securing vehicular ad hoc networks. IEEE Trans. Intell. Transp. Syst. 2015, 17, 960–969. [Google Scholar] [CrossRef]
- Truong, N.B.; Lee, G.M. Trust Evaluation for Data Exchange in Vehicular Networks. In Proceedings of the 2017 IEEE/ACM Second International Conference on Internet-of-Things Design and Implementation (IoTDI), Pittsburgh, PA, USA, 18–21 April 2017; pp. 325–326. [Google Scholar]
- Primiero, G.; Raimondi, F.; Chen, T.; Nagarajan, R. A proof-theoretic trust and reputation model for VANET. In Proceedings of the 2017 IEEE European Symposium on Security and Privacy Workshops (EuroS&PW), Paris, France, 26–28 April 2017; pp. 146–152. [Google Scholar]
- Primiero, G. A calculus for distrust and mistrust. In Proceedings of the IFIP International Conference on Trust Management; Springer: Cham, Switzerland, 2016; pp. 183–190. [Google Scholar]
- Javaid, U.; Aman, M.N.; Sikdar, B. DrivMan: Driving Trust Management and Data Sharing in VANETs with Blockchain and Smart Contracts. In Proceedings of the 2019 IEEE 89th Vehicular Technology Conference (VTC2019-Spring), Kuala Lumpur, Malaysia, 28 April–1 May 2019; pp. 1–5. [Google Scholar]


| Number of the Iteration | Reputation Value | Time (s) |
|---|---|---|
| 1 | 0.5 | 0 |
| 2 | 0.367 | 30 |
| 3 | 0.11 | 41 |
| 4 | - | - |
© 2019 by the authors. Licensee MDPI, Basel, Switzerland. This article is an open access article distributed under the terms and conditions of the Creative Commons Attribution (CC BY) license (http://creativecommons.org/licenses/by/4.0/).
Share and Cite
Chuprov, S.; Viksnin, I.; Kim, I.; Marinenkov, E.; Usova, M.; Lazarev, E.; Melnikov, T.; Zakoldaev, D. Reputation and Trust Approach for Security and Safety Assurance in Intersection Management System. Energies 2019, 12, 4527. https://doi.org/10.3390/en12234527
Chuprov S, Viksnin I, Kim I, Marinenkov E, Usova M, Lazarev E, Melnikov T, Zakoldaev D. Reputation and Trust Approach for Security and Safety Assurance in Intersection Management System. Energies. 2019; 12(23):4527. https://doi.org/10.3390/en12234527
Chicago/Turabian StyleChuprov, Sergey, Ilya Viksnin, Iuliia Kim, Egor Marinenkov, Maria Usova, Eduard Lazarev, Timofey Melnikov, and Danil Zakoldaev. 2019. "Reputation and Trust Approach for Security and Safety Assurance in Intersection Management System" Energies 12, no. 23: 4527. https://doi.org/10.3390/en12234527
APA StyleChuprov, S., Viksnin, I., Kim, I., Marinenkov, E., Usova, M., Lazarev, E., Melnikov, T., & Zakoldaev, D. (2019). Reputation and Trust Approach for Security and Safety Assurance in Intersection Management System. Energies, 12(23), 4527. https://doi.org/10.3390/en12234527