Article

Geochemistry Exploration and Geothermometry Application in the North Zone of Seulawah Agam, Aceh Besar District, Indonesia

1
Department of Chemistry, Faculty of Mathematics and Natural Sciences, Universitas Syiah Kuala, Banda Aceh 23111, Indonesia
2
Department of Informatics, Faculty of Mathematics and Natural Sciences, Universitas Syiah Kuala, Banda Aceh 23111, Indonesia
3
Department of Chemical Engineering, Faculty of Engineering, Universitas Syiah Kuala, Banda Aceh 23111, Indonesia
4
Department of Geophysic Engineering, Faculty of Engineering, Universitas Syiah Kuala, Banda Aceh 23111, Indonesia
5
School of Information, Systems and Modelling, University of Technology Sydney, Sydney, New South Wales 2007, Australia
*
Author to whom correspondence should be addressed.
Energies 2019, 12(23), 4442; https://doi.org/10.3390/en12234442
Submission received: 9 September 2019 / Revised: 15 October 2019 / Accepted: 16 October 2019 / Published: 22 November 2019

Abstract

:
A geochemistry study has been done in four geothermal manifestations—Ie-Seu’um, Ie-Brôuk, Ie-Jue and the Van-Heutz crater—located in the north zone of Seulawah Agam mountain (Aceh Besar District, Indonesia). The study was performed through water and gas analysis. Water analysis were done for all geothermal manifestations, but gas analysis was only done for the Ie-Jue manifestation that has fumaroles. Cation and anion contents were analyzed by ion chromatography, ICP-OES, alkalimetry titrations, and spectrophotometry, meanwhile isotopes were measured by a Liquid Water Isotope Analyzer. The resulting data were used for fluid and gas geothermometry calculations, and plotted in a FT-CO2 Cross-Plot and a CH4-CO2-H2S triangle diagram to obtain reservoir temperatures. The data were also plotted by a Cl-HCO3-SO4 triangle and Piper diagram to obtain the water type and dominant chemical composition, a Na-K-Mg triangle diagram to obtain fluid equilibria, the isotope ratio in the stable isotope plot to obtain the origin of water, and a N2-He-Ar triangle diagram to establish the origin of fumaroles. The water analysis results showed that (1) Ie-Seu’um has an average reservoir temperature of 241.9 ± 0.3 °C, a chloride water type, a dominant Na-K-Cl chemical composition, a mature water fluid equilibrium, and water of meteoric origin; (2) Ie-Brôuk has an average reservoir temperature of 321.95 ± 13.4 °C, a bicarbonate water type, a dominant Na-Ca-HCO3chemical composition, an immature water fluid equilibrium, and water of meteoric origin; (3) Ie-Jue has an average reservoir temperature of 472.4 ± 91.4 °C, a sulphate water type, a dominant Ca-SO4 chemical composition, an immature water fluid equilibrium and water of meteoric origin; and (4) the Van-Heutz crater has an average reservoir temperature of 439.3 ± 95.3 °C, a sulphate water type, a dominant Ca-SO4 chemical composition, an immature water fluid equilibrium and water of magmatic origin. The results of our gas analysis showed that Ie-Jue has an average reservoir temperature of 258.85 °C, and water of meteoric origin. Based on the reservoir temperatures, the geothermal manifestation of the north zone of Seulawah Agam mountain is considered as a high-temperature geothermal system suitable for power plant development.

1. Introduction

The environmental impact due to global warming has reaching a point from which there is no return. According to researchers the main culprit of global warming are the greenhouse gases, especially carbon dioxide, released by energy consumption for human activities [1]. One of the ways to solve this problem is by using renewable energy sources for energy generation, and many countries have successfully implemented renewable energy policies [2]. Some countries have successfully implemented solar energy as an electricity source to support daily life activities [3,4], however, the problem with solar energy sources is that it is only available for certain periods and therefore energy storage devices must be used. The only storage devices commercially available at this moment are batteries, which have very limited capacity and therefore scientists are attempting to find new energy storage materials [5,6]. Like some other countries Malaysia and Indonesia have successfully implemented biodiesel energy policies to power their transport sector [7,8,9]. However, this policy has been claimed by some researchers to create conflicts with food production and destroy the tropical rain forest. Therefore, Indonesia is trying to encourage the use of cleaner energy sources such as geothermal energy for electricity generation to replace fossil fuels.
Since 1970, Indonesia has undertaken geothermal explorations in order to discover and develop high-temperature geothermal energy sources [10]. Indonesia contains 13% of the total world’s volcanoes, of which 80% are estimated to possess geothermal energy production potential [11]. Those volcanoes are spread over 312 locations [12] with an average estimated geothermal potential of around 28.617 MWe which is equal to 40% of the total world’s geothermal potential [13]. Nevertheless, only 4.7% of them have been explored and exploited for electrical energy resources, providing a capacity of 1340 MWe from 10 geothermal wells [12]. They are: Darajat (260 MWe), Dieng (60 MWe), Kamojang (200 MWe), Salak Mountain (377 MWe), Sibayak (12 MWe), PLTP Wayang Windu (227 MWe), Lahendong (87 MWe), Ulu Belu-Sumatera Selatan (110 MWe), Ulumbu-Flores (5 MWe) and Mataloko (2.5 MWe). Apart from the stated above, there are an additional 440 MWe of geothermal energy under construction in Sarulla and Lumut Balai. However, the geothermal energy capacity that is under exploitation is considered small compared to Indonesia’s short-medium term development target of geothermal electrical capacity for 2025, which is around 6000 MWe, equal to 5% of the national energy demand [12].
A geothermal system location can be exploited if the exploration results data are previously determined. Geothermal exploration and modeling cover three components, which are geological, geophysical and geochemical studies. The main objective of geochemical research is to estimate the temperature that can be obtained from the geothermal system. A high-temperature geothermal system can provide a high geothermal energy capacity. To obtain such information, it is necessary to carry out fluid-geochemistry analysis, which includes hydro-geochemical, gas-geochemical and isotope analyses. Apart from geothermal temperature, the geochemical study also informs the origin of the geothermal system and geochemical processes that affect the fluid’s temperature. Recently, geochemical studies on geothermal systems have been many conducted in various sites around the world, including Kangding in the eastern Himalayas [14]; the Icelandic high-temperature geothermal areas [15]; the western sector of the Sabatini Volcanic District and the Tolfa Mountains (Italy) [16]; the Xining basin on the northeastern Tibetan Plateau [17]; Mapamyum in Western Tibet, China [18]; the Tang-Bijar oilfield springs in the Zagros region of Iran [19]; southern Saint Lucia, in the Lesser Antilles island arc [20]; the Southern Sula graben in Honduras [21]; and the Nevşehir (Kozakli) area in Central Turkey [22].
Almost half of the geothermal potential in Indonesia is found on the island of Sumatra, one which is in Seulawah Agam in Aceh Province. Seulawah Agam’s geothermal site has several manifestations, that are Ie-Su’um, Ie-Brôuk, Ie-Jue and the Van-Heutz crater in the north zone, and the Aleu Ie Su’um, Alue Ie Masam, Alue PU and Alue Teungku manifestations in the south zone. Some studies have been done in this area. Geophysical studies of geothermal resource imagery [23] and deep and shallow structures of geothermal sites [24] have been done in the Seulawah Agam area. Preliminary geochemical studies have also done at three manifestations of the North Zone, which are the Ie Su’um [25], Ie Ju [26] and Ie-Brôuk [27] ones. Estimated depth temperature, type of geothermal water, chemical composition and fluid equilibrium of the three manifestations is predicted with hydro-geothermometry in calculating cations and anions analyzed by atomic absorption spectrophotometry (AAS) and UV-Vis spectrophotometry.
Geothermal potential determination is a complex process. There are many hydrogeochemical processes that affect the fluid emigrating from the source to the surface. This causes the unreliableness of reservoir temperature predictions based on only a single geothermometry method. Thus, hydro-geothermometry, gas-geothermometry, and isotopic methods (if available) should be applied together. Besides, the chemical identification needs to be accurate using a sensitive instrument. Especially for atomic analysis, spectra identification in a plasma gives more precise and reliable results [28,29]. The accuracy of the measurement determines the geothermometry calculations, hence determining the estimated temperature of the manifestation reservoir.
Refractory compound formation always deserves attention in elemental analysis. The sample may contain constituents that form a refractory (heat-stable) compound with the analyte element of interest, and is avoided by addition of a chemical competitor or use of very high temperatures such as in inductively coupled plasma (ICP). ICP uses a 3–4× higher temperature, is 100–1000× more sensitive and has a 2–3× higher linear range than flame spectrometry. In nature there are many metal oxides. The low temperatures of flame atomic spectrometry sometimes cause the spectrum to be the result of metal oxide molecules, not the desired atomic line spectrum. This is very disturbing for the accuracy.
In this study, a geochemical exploration has been conducted on some geothermal areas in the north zone of Seulawah Agam mountain, which are the Ie-Seu’um, Ie-Brôuk, Ie-Jue, and the Van Heutz-crater manifestations. The study includes in-situ, liquid geothermal, gas geothermal, and isotope analysis. Ions in the liquid and gas were analyzed with ICP-OES, ion-chromatography, UV-Vis spectrophotometry and alkalimetry titration. Isotope analysis was carried out by laser spectroscopic analysis. Several geothermometry methods were applied to obtain geochemical data, including hydro-geothermometry, gas-geothermometry, and stable isotope plots to provide information on the types, chemical composition and liquid equilibrium, reservoir temperature predictions and the origin of the geothermal fluid.

2. Study Area

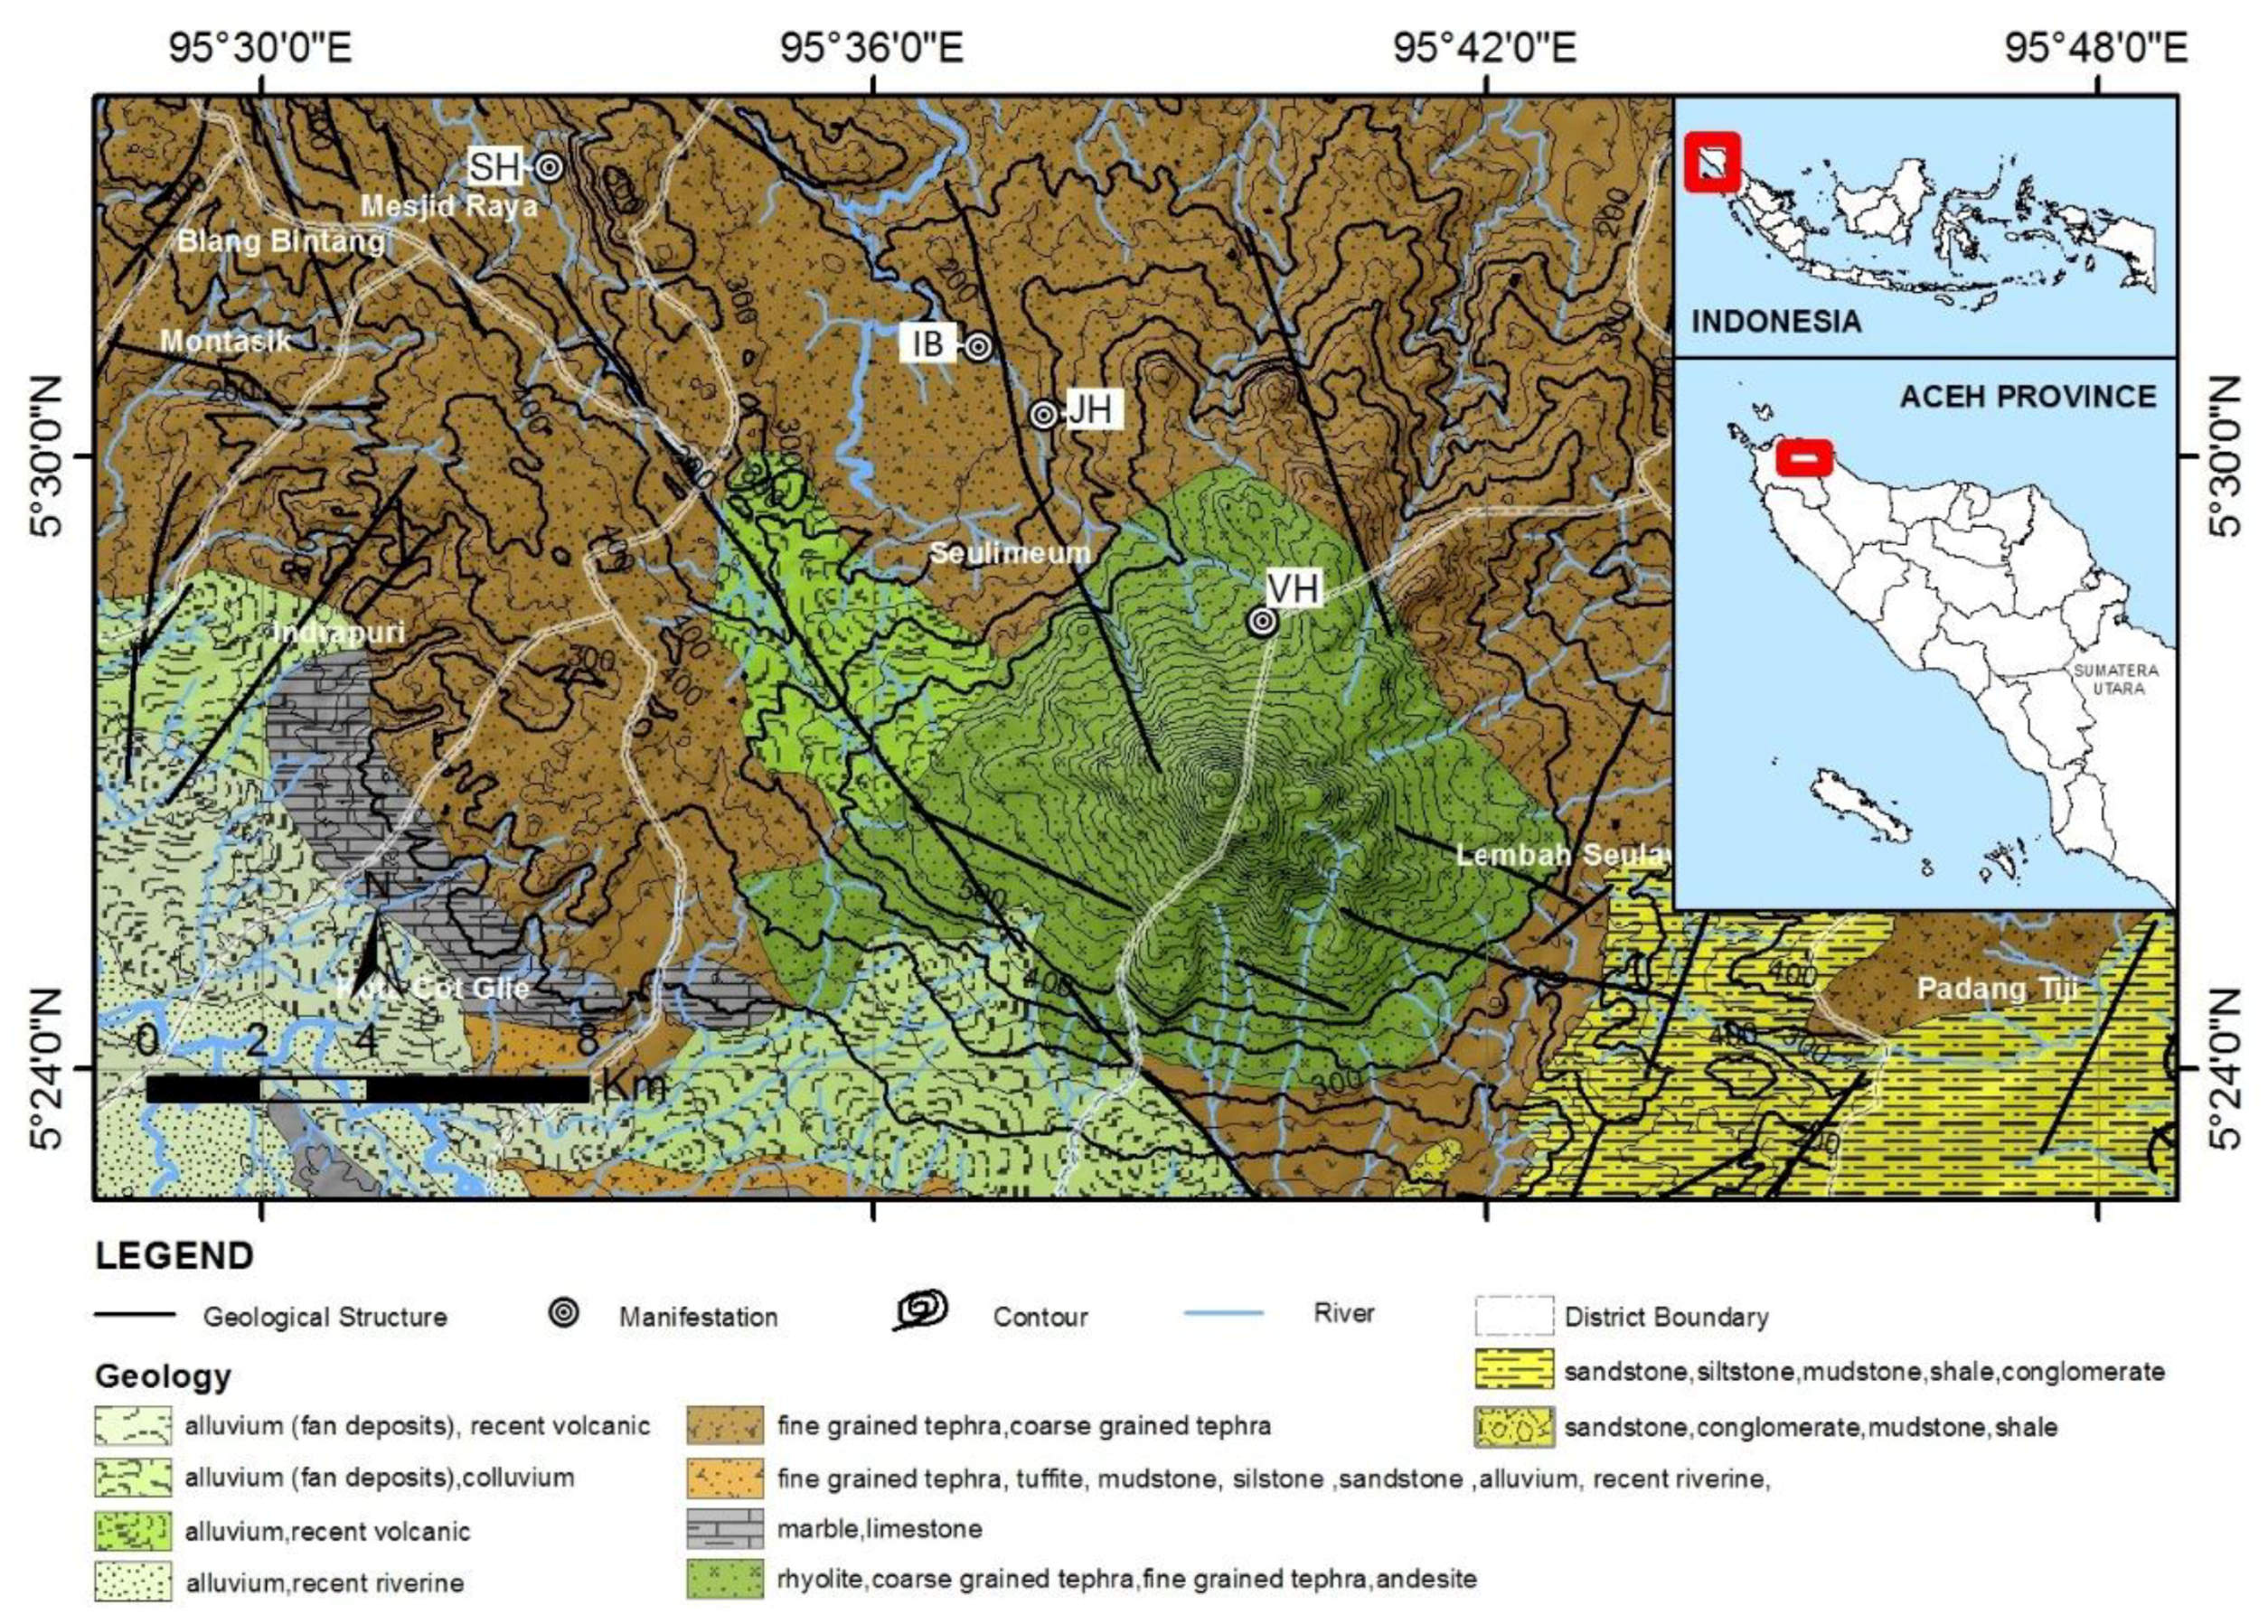
This study covers the area in the north zone of Selawah Agam mountain (Figure 1). At this location, there are four geothermal system manifestations, which are Ie-Seu’um, Ie-Brôuk, Ie-Jue, and the Van-Heutz crater manifestations.
Sampling points were established at each geothermal system manifestation, which were SH1, SH2, and SH3 in Ie-Seu’um; IB1 and IB2 in Ie-Brôuk; JH1, JH2, JH3 and JH4 in Ie-Jue; and VH1, VH2, and VH3 in the Van-Heutz crater. Based on the physical observation of the condition of the north zone in the Ie-Seu’um manifestation, it appears to have clear spring water. It is found that the water discharge at SH2 is bigger than at SH1 and SH3. The surface characteristic is observed to have sediment on the brown color rocks that resembles silica sinter. In the Ie-Jue manifestation, the hot spring is found to be muddy and full of gases. Meanwhile in the Ie-Brôuk manifestation, a moderate hot spring is found to be around the puddle and have a few air bubbles, where several aquatic species, such as leeches, are found. In the Van-Heutz crater manifestation the water output appears to have high turbidity and acidic pH. The manifestation is located in a crater, thus being a source of solfatara output gas with a light yellow color that is found around the manifestation.

3. Materials and Methods

3.1. Field Observation Equipment

The observation equipment (general equipment) used, which included latex gloves, waterproof markers, compass, notebooks, camera, trekking poles, sulphur detector, boots, and a first-aid kit, follows Nicholson [30].

3.2. Water Sampling and Analysis

Water sample collection was carried out at the four manifestations of the north zone: the Ie-Seu’um, Ie-Jue, Ie-Brôuk and Van-Heutz crater manifestations. The coordinates and elevation data of each sampling point was marked by GPS (62S, Garmin, Olathe, KS, USA). Water samples were collected and put in polyethylene (PE) bottles. The bottles are then placed in a cooling box and transported to the laboratory for cation, anion, SiO2, and isotope (δD dan δ18O) analysis.
During the placement of the water samples into the bottles, 6 N HNO3 was added to the samples for cation analysis until the pH reached <2 (acidified). On the other hand, for anion analysis, nothing is added to the samples (non-acidified). Samples for SiO2 analysis were diluted in deionized water to prevent the precipitation of silica. Before the analysis, water samples were filtered with Whatmann 0.45 μm filter paper.
An in-situ analysis is done at the hot spring sampling locations. The analysis includes the determination of water surface temperature using a thermometer (Fisher Scientific Traceable, Fisher Scientific, Hampton, NH, USA), acidity level using a pH meter (Schott Instruments, Xylem Analytics, Mainz, Germany), conductivity using a conductometer (Schott Instrument) and Total Dissolved Solids (TDS) using a TDS meter (Hanna, Hanna Instruments, Woonsocket, RI, USA). Each determination is repeated five times to obtain average values and uncertainty values (standard deviations).
Cation analysis (K, Na, Mg, Ca, Li, B) was carried out by Inductively Coupled Plasma-Optical Emission Spectrometry (ICP-OES, iCAP 7400 instrument, Thermo Fisher Scientific, Waltham, MA, USA) in a wavelength range from 166 to 847 nm with argon as combustion gas. Anion analysis (SO4, F, Cl, NO3) was carried out by ion chromatography (IC Plus 883, Metrohm, Herisau, Switzerland) using a Metrosep A Supp 5–150/4.0 column, eluent composition 1 mmol L−1 NaHCO3 + 3.2 mmol L−1 Na2CO3 dissolved in aquabidest and acetone (980 mL aquabidest and 20 mL acetone), 0.700 mL min−1 flow rate and 9.63 MPa pressure. SiO2 analysis is carried out with a UV-Vis spectrophotometer (Genesys 10S, Thermo Scientific) employing a standard method [31]. HCO3- ion analysis is conducted by the alkalimetry titration method. Isotope (δD and δ18O) analysis is carried out by laser spectroscopic analysis (LGR DT−100 Liquid Water Stable Isotope Analyzer, Los Gatos Research, Inc., San Jose, CA, USA). The liquid samples are measured according to the calibration standard and control standard. The obtained isotope ratio is correlated with the Vienna Standard Mean Ocean Water (VSMOW) international standard plot, with analysis precision standard under 0.6‰ for δD and 0.1 ‰ for δ18O [32].

3.3. Gas Sampling and Analysis

Gas (also known as fumarole gas) samples were collected from fumarole sources at the Ie-Jue manifestation location. Gas was collected in Giggenbach flasks using the standard gas sampling technique method as explained by Giggenbach and Goguel [33]. An evacuated Giggenbach bottle containing 100 mL NaOH 4 N and a little CdCl2 indicator was used. First the hose that connects the gas source and Giggenbach bottle was checked for leaks to avoid any contamination by outside air. The valve of the Giggenback bottle was opened to let the gas enter the bottle while shaking to accelerate the gas dissolution process in the NaOH/CdCl2 solution. The process is ended by closing the valve when the vacuum in the Giggenbach bottle is about to run out. The collected gas sample is then transported to the laboratory for analysis. The analysis of the gaseous samples is conducted using two methods: a gas chromatography method for unreactive gases (H2, Ar, N2, and CH4) using a GC-TCD (HP−5890 system company, Agilent Technologies, Santa Clara, CA, USA) equipped with a Porapak column, and a titration method for reactive gases (CO2, NH3 and H2S).

3.4. Geothermometry Applications

3.4.1. Hydro-Geothermometry

The depth temperature is calculated by the Na-K geothermometer equation [34,35,36,37,38,39] and Na-K-Ca geothermometry [
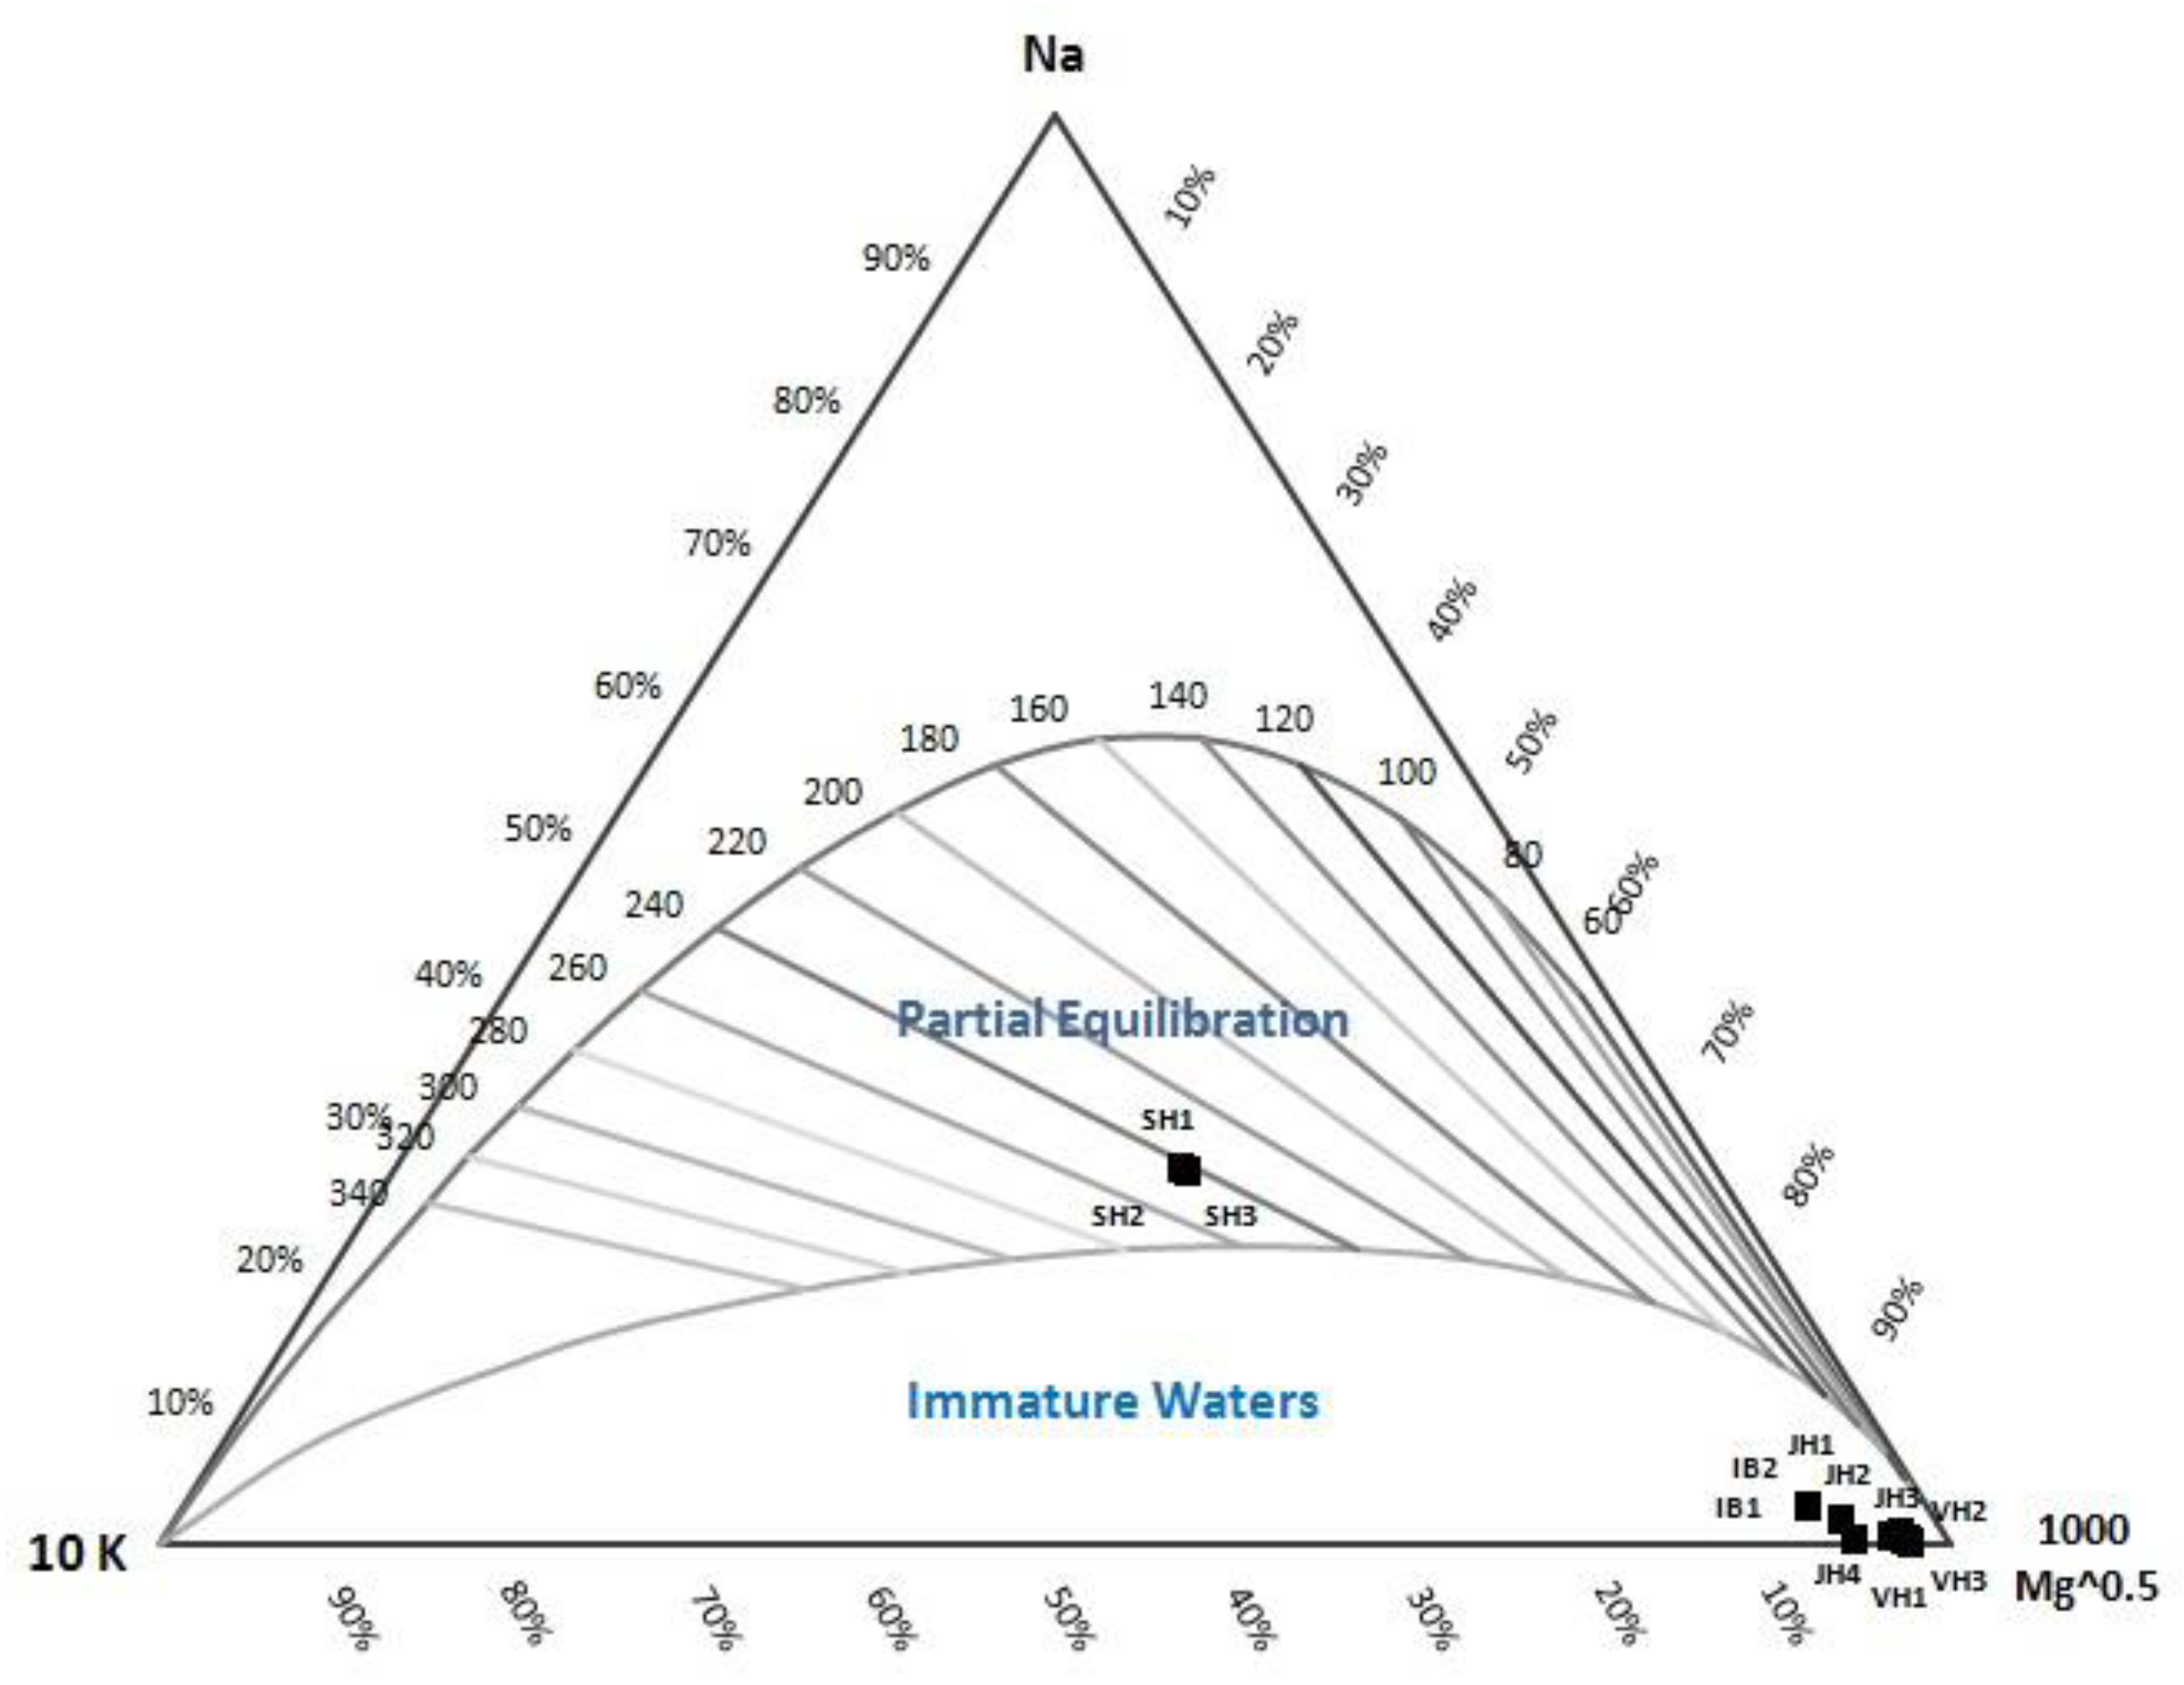
40]. The dissolved chemical equilibrium is determined by a Na-K-Mg triangle diagram [
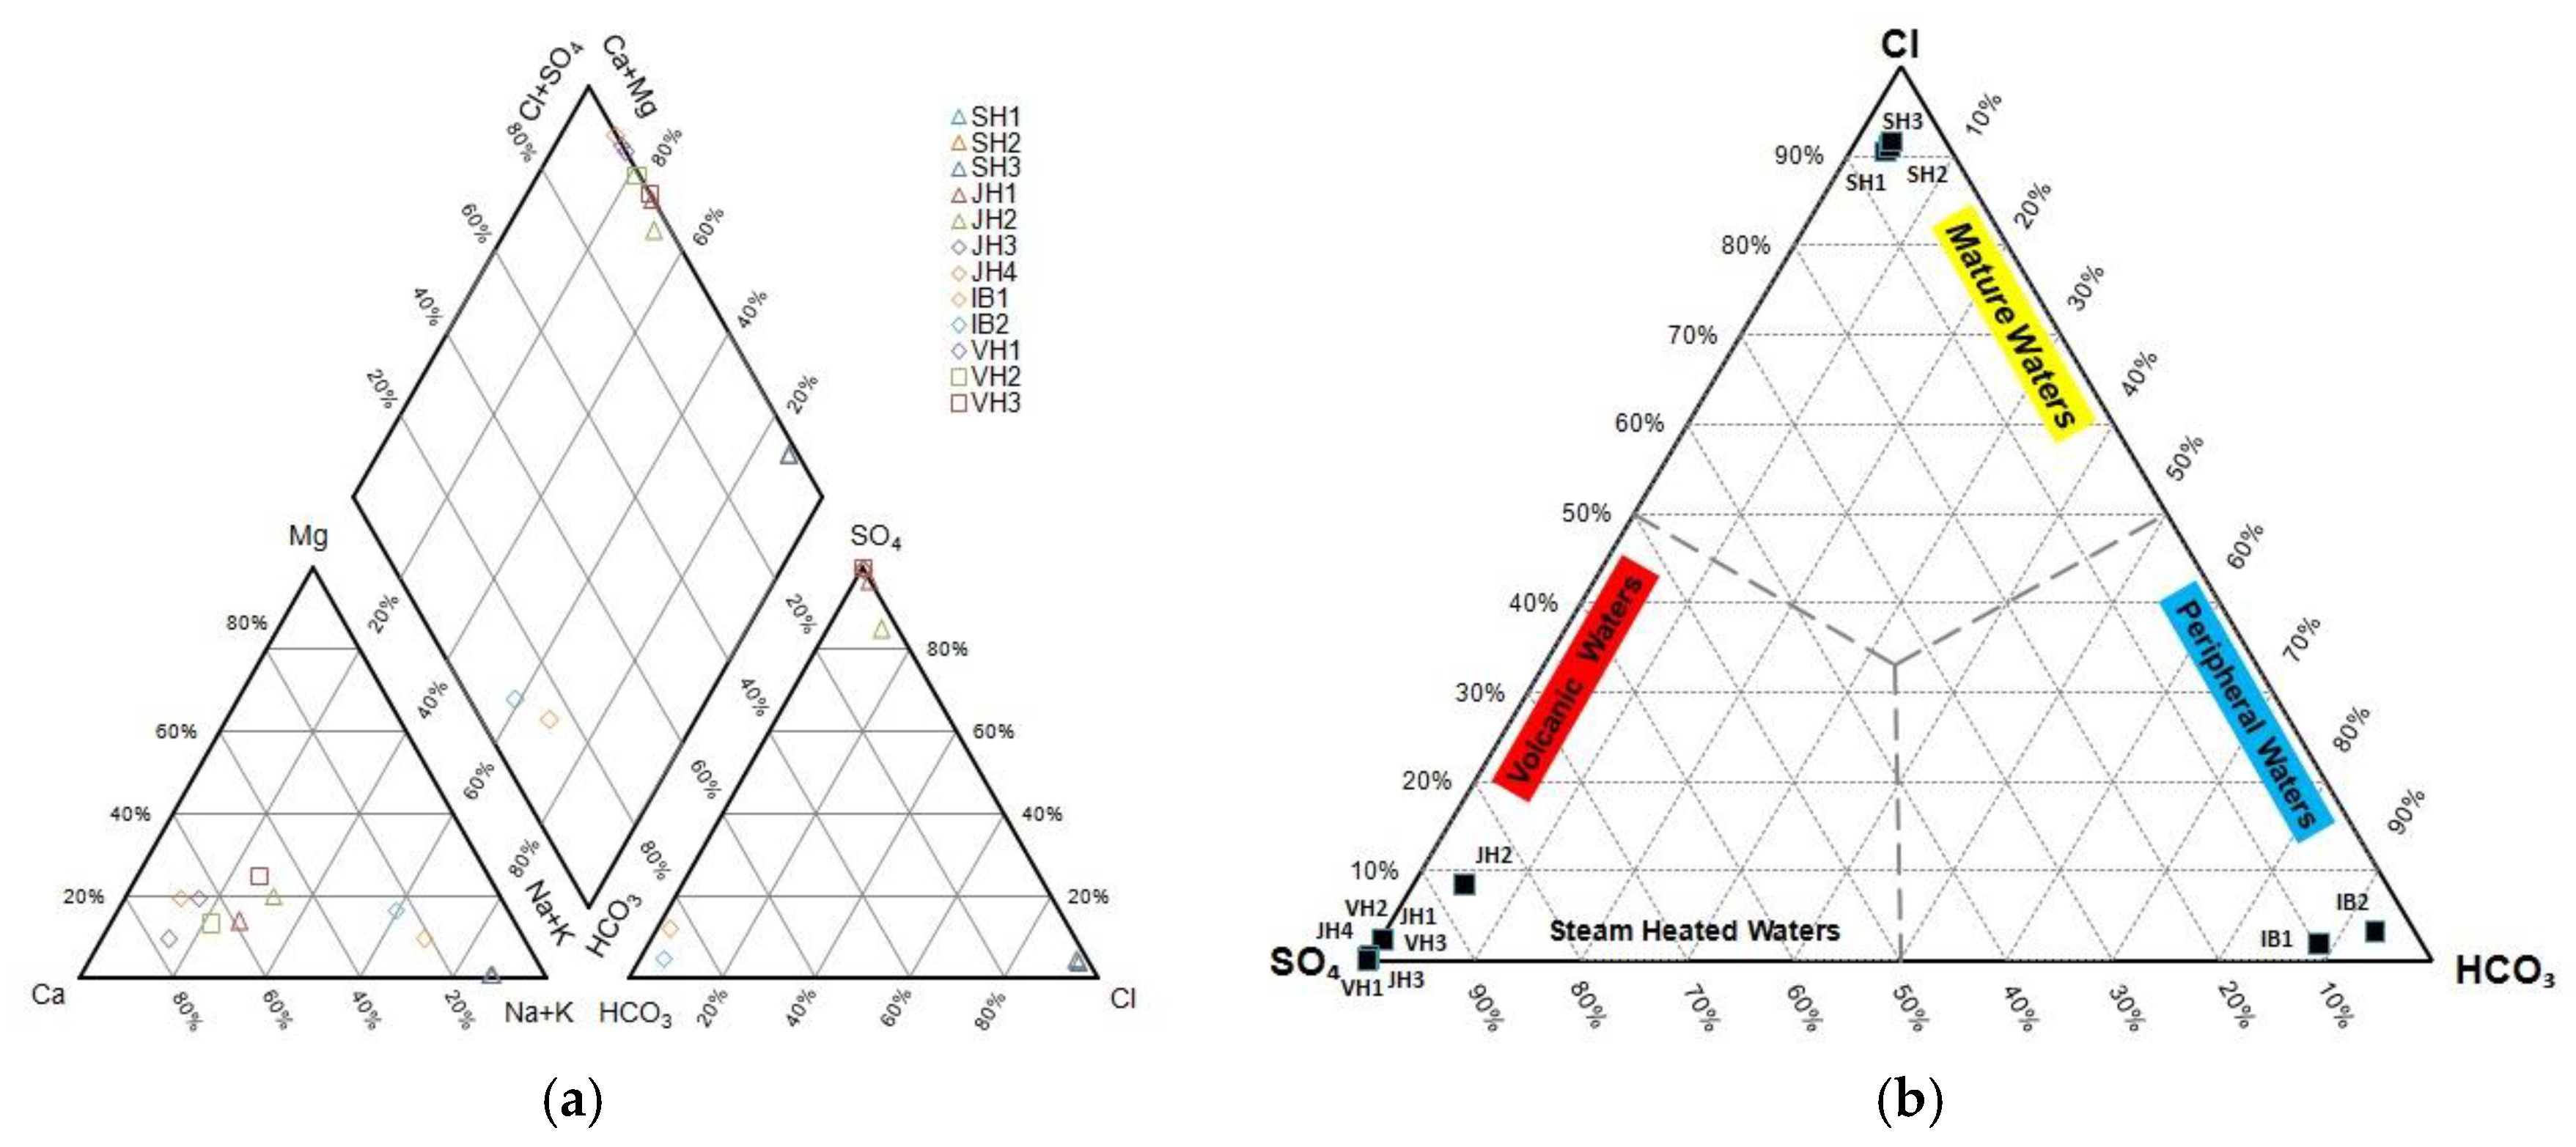
34]. Dominant cation-anion content is estimated by a Piper diagram [41]. The geothermal water type is determined by a Cl-SO4-HCO3 triangle diagram [42]. The equations of each geothermometry technique used are presented in Table 1.

3.4.2. Gas Geothermometry

The depth temperature is estimated by the gas geothermometry equations shown in 
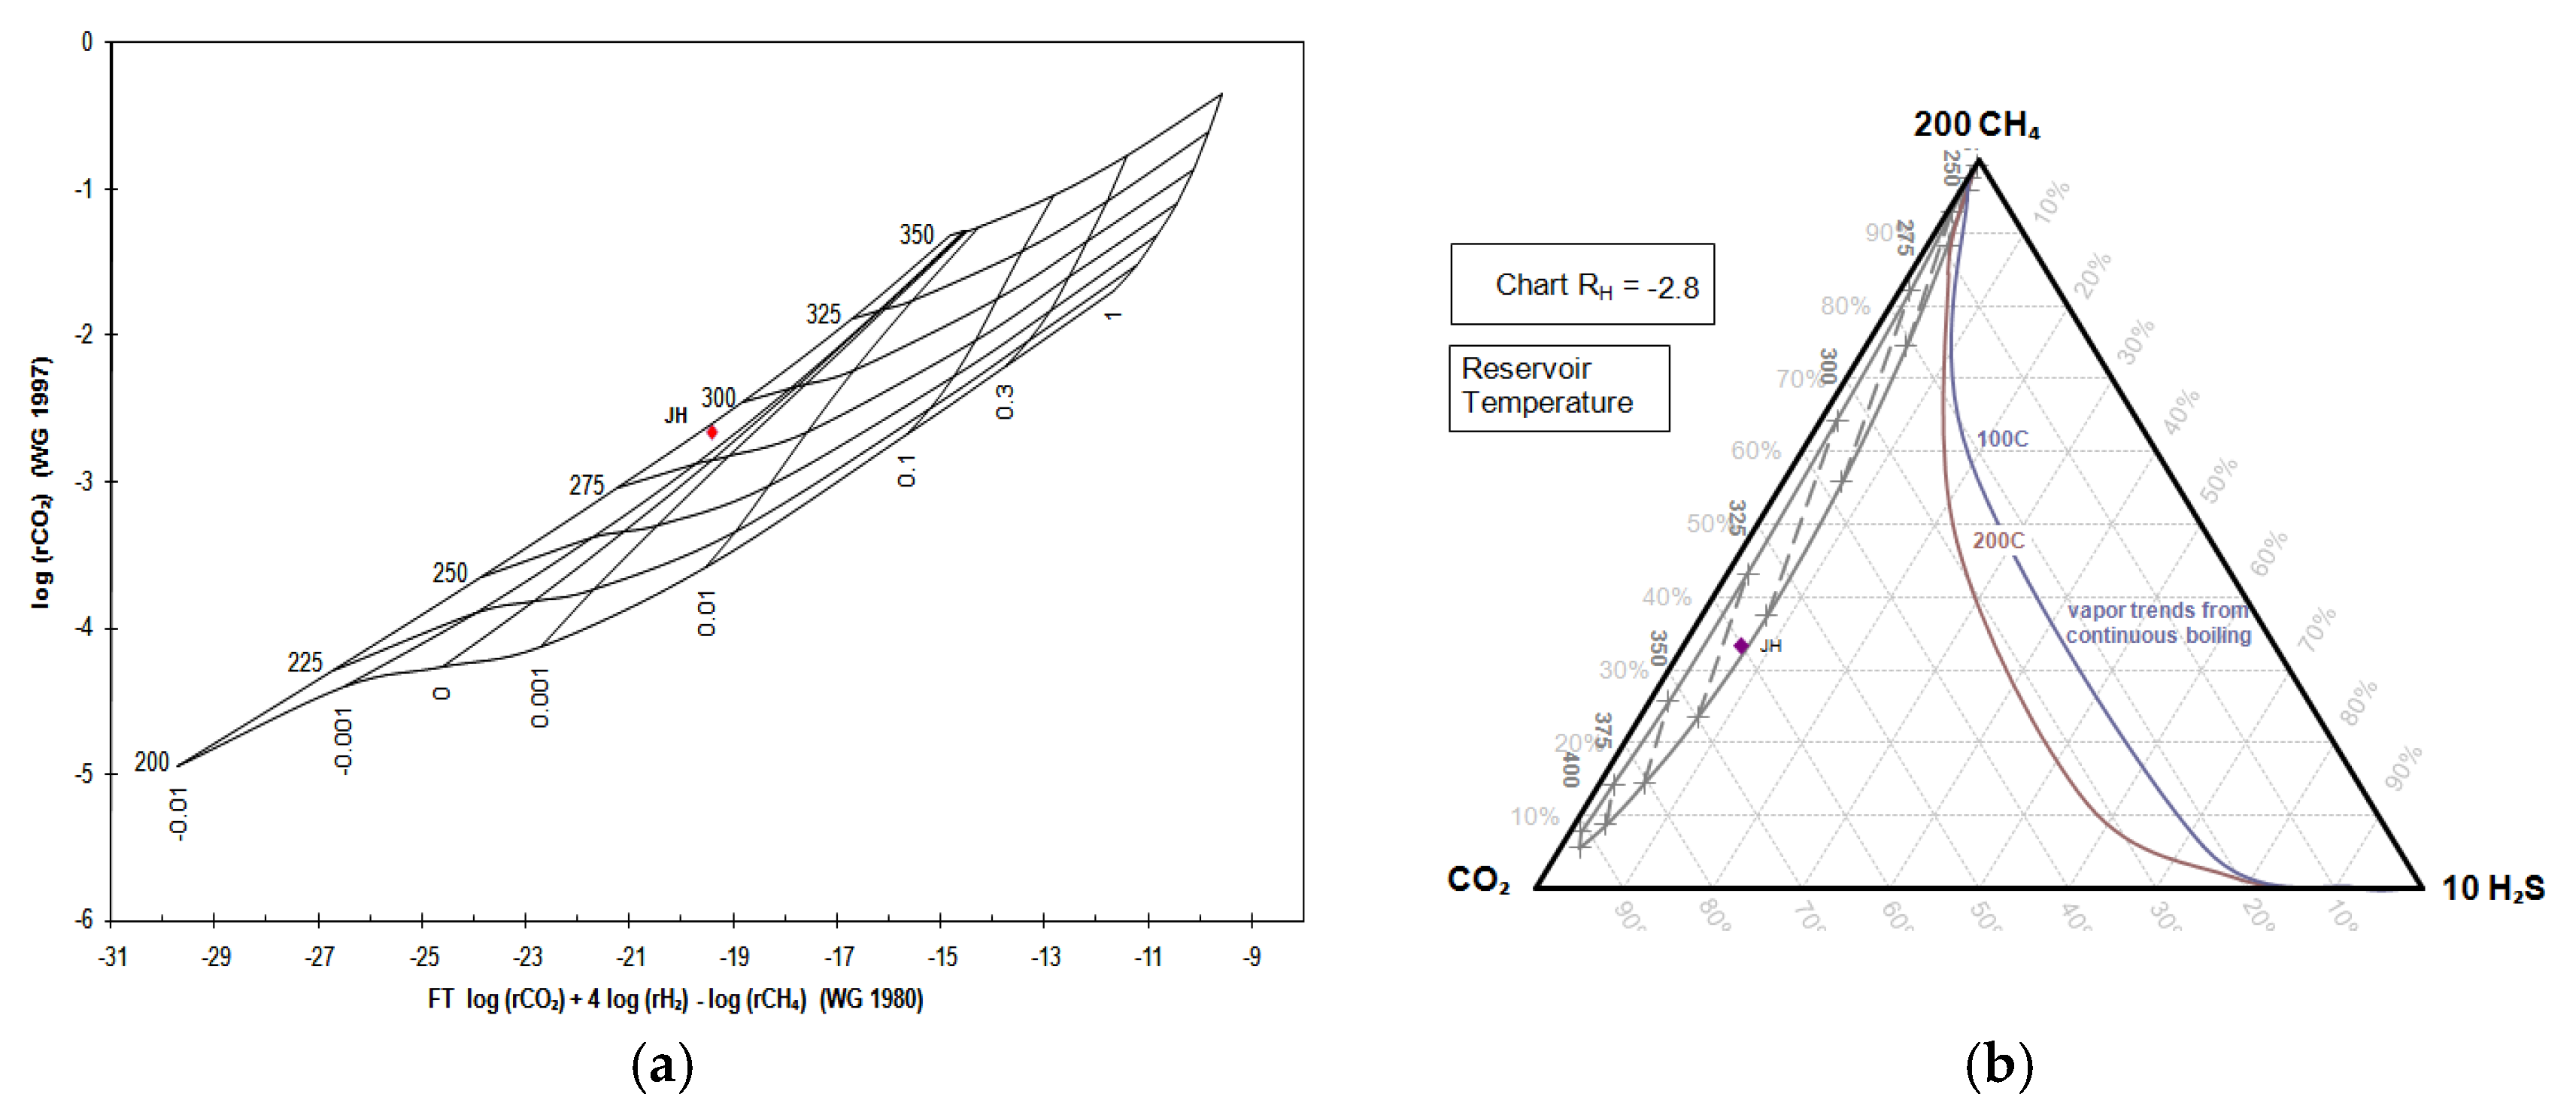
Table 2. The depth temperature is also estimated by a Grid Fischer-Tropsch CO2 (FT-CO2) diagram [42] and CH4-CO2-H2S diagram grid [
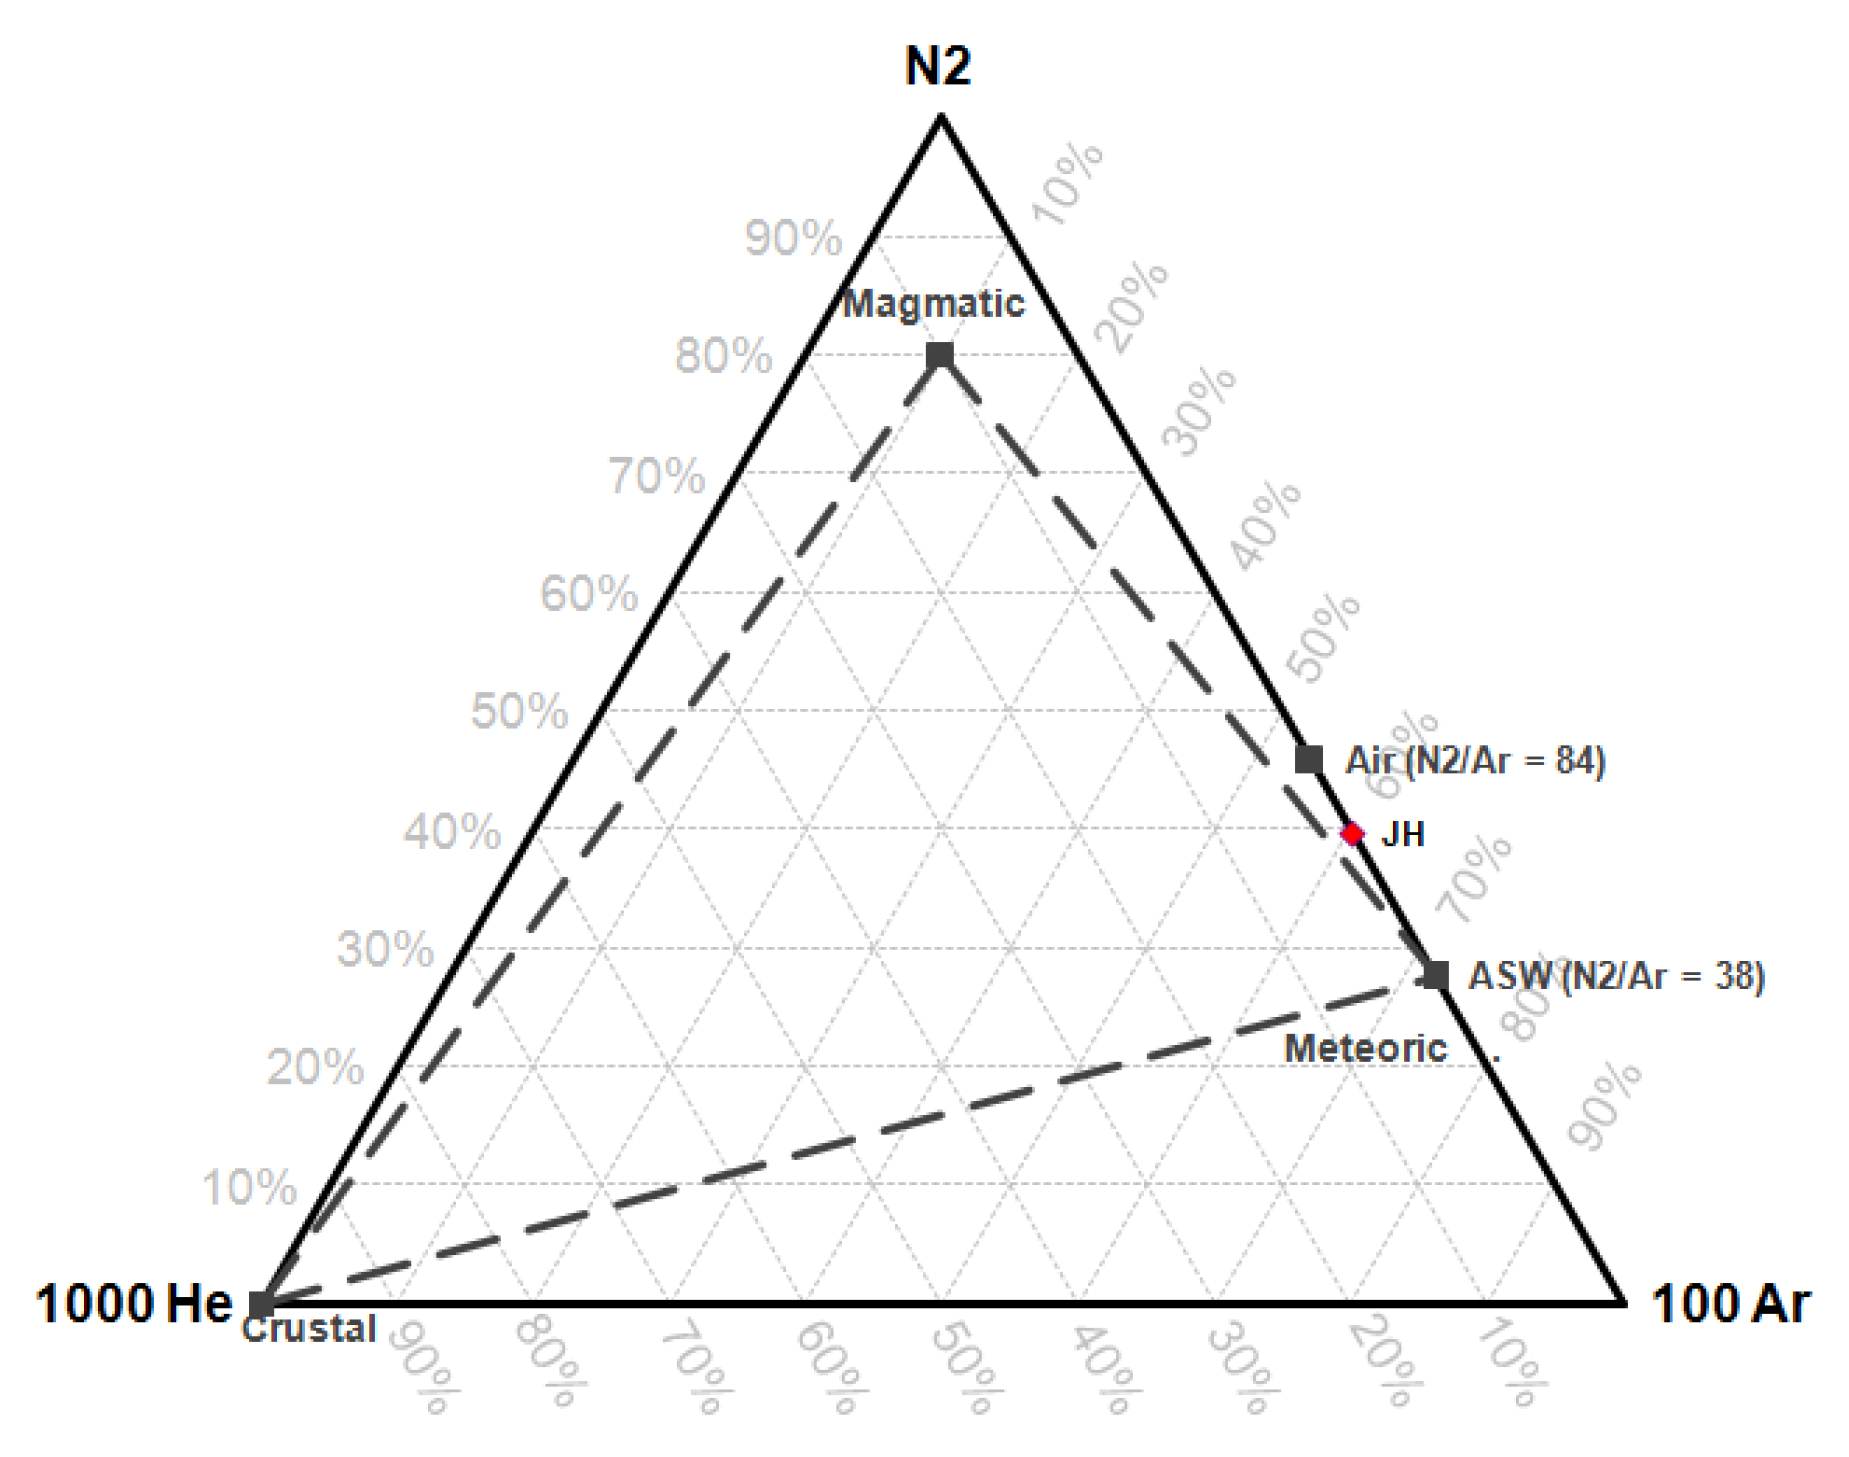
43]. The origin of the gas fluid is estimated by a N2-He-Ar triangle diagram [34].

3.5. Uncertainty of Measurement

All data analysis was carried out using Spreadsheet Version 3 of Powell Geoscience Ltd. (3 September 2012) by Powell and Cumming (Microsoft Corporation, Redmond, WA, USA). Uncertainty of the concentration measurements of each parameter is presented in standard deviation values and several statistical function data using the LINEST method in Microsoft Excel (Microsoft Corporation, Redmond, WA, USA) The calculation results obtained the statistical function data including slope (m), standard deviation of slope (Sm), intercept (b), standard deviation of intercept (Sb), determination coefficient (R), standard deviation of regression (Sr) and standard deviation of the concentration (SC) [45]. The equations used in the calculation of standard deviations and statistic functions are presented in Table 3.

4. Results and Discussion

4.1. Measurement Data

4.1.1. Hydrothermal Characteristics

The results of in-situ measurements such as temperature, pH, conductivity, and total dissolved solids (TDS) as the representative surface characteristic data of the hot spring manifestations in the north zone of Seulawah Agam mountain are listed in Table 4. The obtained data suggest variations for each manifestation point. The manifestation temperature range is from warm (40.04 °C) to hot (98.62 °C). The acidity of the Ie-Seu’um and Ie-Brôuk manifestations is in the pH 6.66–7.40 range (neutral), the Ie-Jue manifestation is at pH 3.95–5.93 (acidic), while the Van Heutz crater manifestation is in the pH range of 1.81–1.44 (highly acidic). The conductivity and TDS of Ie-Seu’um, Ie-Jue and Ie-Brôuk are high, in the range of 14.02–215.78 mV and 237.60–1766 mg L−1, respectively, while the conductivity and TDS of the Van-Heutz crater manifestation is very low, in the range of 7.28 – 9.67 mV and 3.64 – 4.85 mg L−1, respectively.

4.1.2. Hydrothermal Chemical Composition

Table 5 and Table 6 show the cation and anion concentration analysis results. This data is further used to estimate the depth temperature using Na-K-Ca and Na-K geothermometry equations, the chemical equilibrium determination of the geothermal water, and the type of geothermal water. The use of ICP to quantify the metal ions in this research showed a significant increase in precision compared to the use of flame ionization in previous research [25,26,27]. The Sc value resulting from repetitive measurements using ICP is much lower than with flame ionization, especially the alkali metal measurements. This the Sc value of potassium and sodium resulting from measurement using ICP was in the 0.001–0.008 range, whereas for flame ionization it was in the 0.110–0.260 range.

4.1.3. Chemical Composition of Gases

The analysis results for condensable and non-condensable fumarole gases (Table 7) are calculated in the form of a dry gas percentage (%). The fumarole gas content of the Ie-Jue manifestation suggests CO2 as a dominant gas (93.9%) followed by H2S (1.02%) and N2 (3.80%), and minor amount gases (NH3, Ar, CH4, and H2) with ≤ 1% content.

4.2. Hydrochemical Processes

4.2.1. Chemical Composition and Geothermal Water Type

The determination of the dominant chemical components in the geothermal water is presented as a Piper diagram (Figure 2a). Based on the diagram, it is suggested that the Ie-Seu’um manifestation at points SH1, SH2 and SH3 has a dominant sodium-potassium-chloride (Na-K-Cl) chemical composition. The Ie-Jue manifestation at points JH1, JH2, JH3 and JH4, and the Van Heutz crater manifestation at points VH1, VH2 and VH3 have a dominant calcium-sulphate (Ca-SO4) chemical composition. Meanwhile, the Ie-Brôuk manifestation at points IB1 and IB2 has a dominant sodium-calcium-bicarbonate (Na-Ca-HCO3) chemical composition.
The type of geothermal water is determined based on the dominant anion content of the water, described by the Cl-HCO3-SO4 triangle diagram (Figure 2b). The diagram indicates that the Ie-Seu’um manifestation on average has a chloride type water, Ie-Brôuk has on average a bicarbonate type water and Ie-Jue and Van-Heutz crater manifestation on average has sulphate type water. The sulphate type water in Ie-Jue manifestation suggests a steam-heated water nature. Meanwhile, the sulphate type water along with high acidity of the Van-Heutz crater manifestation is associated with the interaction between magmatic volatility (steam) and groundwater [42].

4.2.2. Na–K–Mg Triangle Diagram

The Na-K-Mg triangle diagram is an indicator used to describe the water equilibrium at high temperature, the process effect of shallow water and the possibility of water equilibria at low temperature [42] Figure 3 indicates that the Ie-Seu’um (SH1, SH2, and SH3) area is under partial equilibration conditions, which is a characteristic of mature water. This may be ascribed to the dissolution equilibrium of Na-K and K-Mg minerals in the deep reservoir, hence unaffected by the other mineral dissolution when reaching the surface [34]. Generally, this equilibrium is often found at chloride dominant reservoir types, such as Salton-California’s seawater [30].
In contrast with Ie-Jue, in the Ie-Brôuk, and Van-Heutz crater manifestations, the geothermal water equilibrium is located at an immature waters condition, indicating that the geothermal water is not in equilibrium. This condition also suggests the presence of surface water influence that is mixed at the formation of the hot springs and the interaction between water and rocks in heated conditions [34].

4.3. Estimation of Depth Temperature with Geothermometer

4.3.1. Hydrothermal Geothermometry

Na-K geothermometry is used to estimate a reservoir’s temperature based on the Na and K contents in the geothermal fluids. Many studies have developed geothermometers such as Fournier [40], Truesdell [37], Giggenbach [34], Tonani [36], Nieva and Nieva [38], and Arnorsson [38]. This geothermometry technique can be applied well for geothermal fluids with a 180–350 °C reservoir temperature and with low calcium content (CCa½/Can < 1), as well as for low temperatures (less than 120 °C [30]).
Table 8 is the estimation of the reservoir depth temperature of a geothermal manifestation employing some Na-K geothermometers. Based on the Giggenbach Na-K geothermometer [34], the reservoir’s temperatures of the Ie-Seu’um and Ie-Brôuk manifestations are at 241.9–242.2 °C (with the an average temperature of 241.9 ± 0.3 °C) and 312.5–331.4 °C (with an average temperature of 321.95 ± 13.4 °C), respectively, whereas the reservoir temperature of Ie-Jue and the Van-Heutz crater manifestations are on average >350 °C. For the stated conditions, according to Nicholson [30], it is suggested to use the Fournier Na-K geothermometer [35]. Based on the Fournier Na-K geothermometer [35], the reservoir temperatures of Ie-Jue and the Van-Heutz crater manifestations are 374.5–555.4 °C (with the average temperature of 472.4 ± 91.4 °C) and 331.2–511.3 °C (with the average temperature of 439.3 ± 95.3 °C), respectively.

4.3.2. Gas Geothermometry

Gas Geothermometer

Gas geothermometry has been developed to estimate a reservoir’s temperature based on the CO2, H2S, NH3, CH4, N2, H2, and Ar contents in fumarole gas. Some gas geothermometers have been developed by D’Amore and Panichi [44]; Giggenbach and Goguel [34]; Giggenbach [42]. The Ie-Jue manifestation is a fumarole type manifestation from the north zone of Seulawah Agam mountain. Based on the gas geothermometer calculations, the temperature of the fumarole reservoir of the Ie-Jue manifestation is at 201.6–312.7 °C (with an average temperature of 258.85 °C) (Table 9).

FT-CO2 Cross-Plot and CH4-CO2-H2S Triangle Diagram

Reservoir temperatures can be estimated with a FT-CO2 cross-plot and a CH4-CO2-H2S triangle diagram [46]. The reservoir temperature estimation with FT-CO2 cross-plot is conducted based on the dominant CO2 gas, while for the CH4-CO2-H2S triangle diagram, the estimation is done based on the degassing process of a geothermal fluid when reaching the surface [47]. Based on the FT-CO2 cross-plot (Figure 4a), the Ie-Jue fumarole manifestation points (JH) are located on an imaginary line with a temperature range between 275–300 °C. This also indicates that the reservoir is liquid-dominated. Based on the CH4-CO2-H2S triangle diagram, the Ie-Jue fumarole manifestation has a reservoir temperature of 300–325 °C. Based on the estimation of both the FT-CO2 cross-plot and CH4-CO2-H2S triangle diagram, it can be concluded that the reservoir temperature of the manifestation is around 275–325 °C.

N2-He-Ar Triangle Diagram

The N2-He-Ar triangle diagram is a mixing diagram model used to portray the relative contribution of the gas sources, whether the gas is magmatic, meteoric, or Earth’s crust sourced. The content proportions of N2, He and Ar have been combined by Giggenbach [34] for the identification of dominant gas sources in a fumarole gas manifestation [30]. The triangle diagram of N2-He-Ar (Figure 5) shows that the point position of the Ie-Jue fumarole gas manifestation (JH) is adjacent to water vapor content at a N2/Ar ratio near 84. This indicates that the source of Ie-Jue fumarole gas is of meteoric origin.

4.4. Isotope Analysis

The results of the determination of oxygen (δ18O) and deuterium (δ2H) isotopes for the geothermal area in the north zone of Seulawah Agam can be seen in Table 10. The values of both isotopes are then correlated against the V-SMOW international standard lines to describe the origins of the geothermal water, whether it is meteoric, magmatic or a mixture of both.
Based on the isotope ratio in the stable isotope plot (Figure 6), the Ie-Seu’um, Ie-Jue, Ie-Brôuk, and Ie-Jue (only JH4), manifestations are originated from meteoric water. This is indicated by the manifestation points, which are adjacent to the local meteoric water line (LMWL). Only some points present on the mixing line water, such as the JH1, JH2 and JH3 sampling points of the Ie-Jue manifestation display positive values for the isotope δ18O, while the Van-Heutz crater manifestation (VH1, VH2, and VH3) is of magmatic water origin. This is indicated by the positive value of the isotope δ18O. The shift of isotope δ18O value to a positive direction is due to the heavier isotope exchange reaction, leading to a contribution of magmatic water in a hot spring.
This phenomenon also occurs in Ijen crater (Jawa Timur) with a prediction that some magmatic water is discharged through fumaroles up until 70% from the geothermal water composition [10,43].

5. Conclusions

This study concerns the four geothermal system manifestations (Ie-Seu’um, Ie-Brouk, Ie-Jue, and Van-Heutz crater) of the Selawah Agam volcano, located in northwestern Sumatra, Indonesia. The analysis of the Cl-HCO3-SO4 triangle diagram and Piper diagram suggests that the water type and dominant chemical composition of the fluids of each manifestation are as follows: (1) chloride and Na-K-Cl for Ie-Seu’um, (2) bicarbonate and Na-Ca-HCO3 for Ie-Brouk and (3) sulphate and Ca-SO4 for Ie-Jue and the Van-Heutz crater.
The analysis of the Na-K-Mg triangle diagram suggests that the fluid equilibrium of Ie-Brôuk, Ie-Jue, and Van-Heutz crater manifestations presents an immature water state. Only the fluid from the Ie-Seu’um manifestation is in a mature water state.
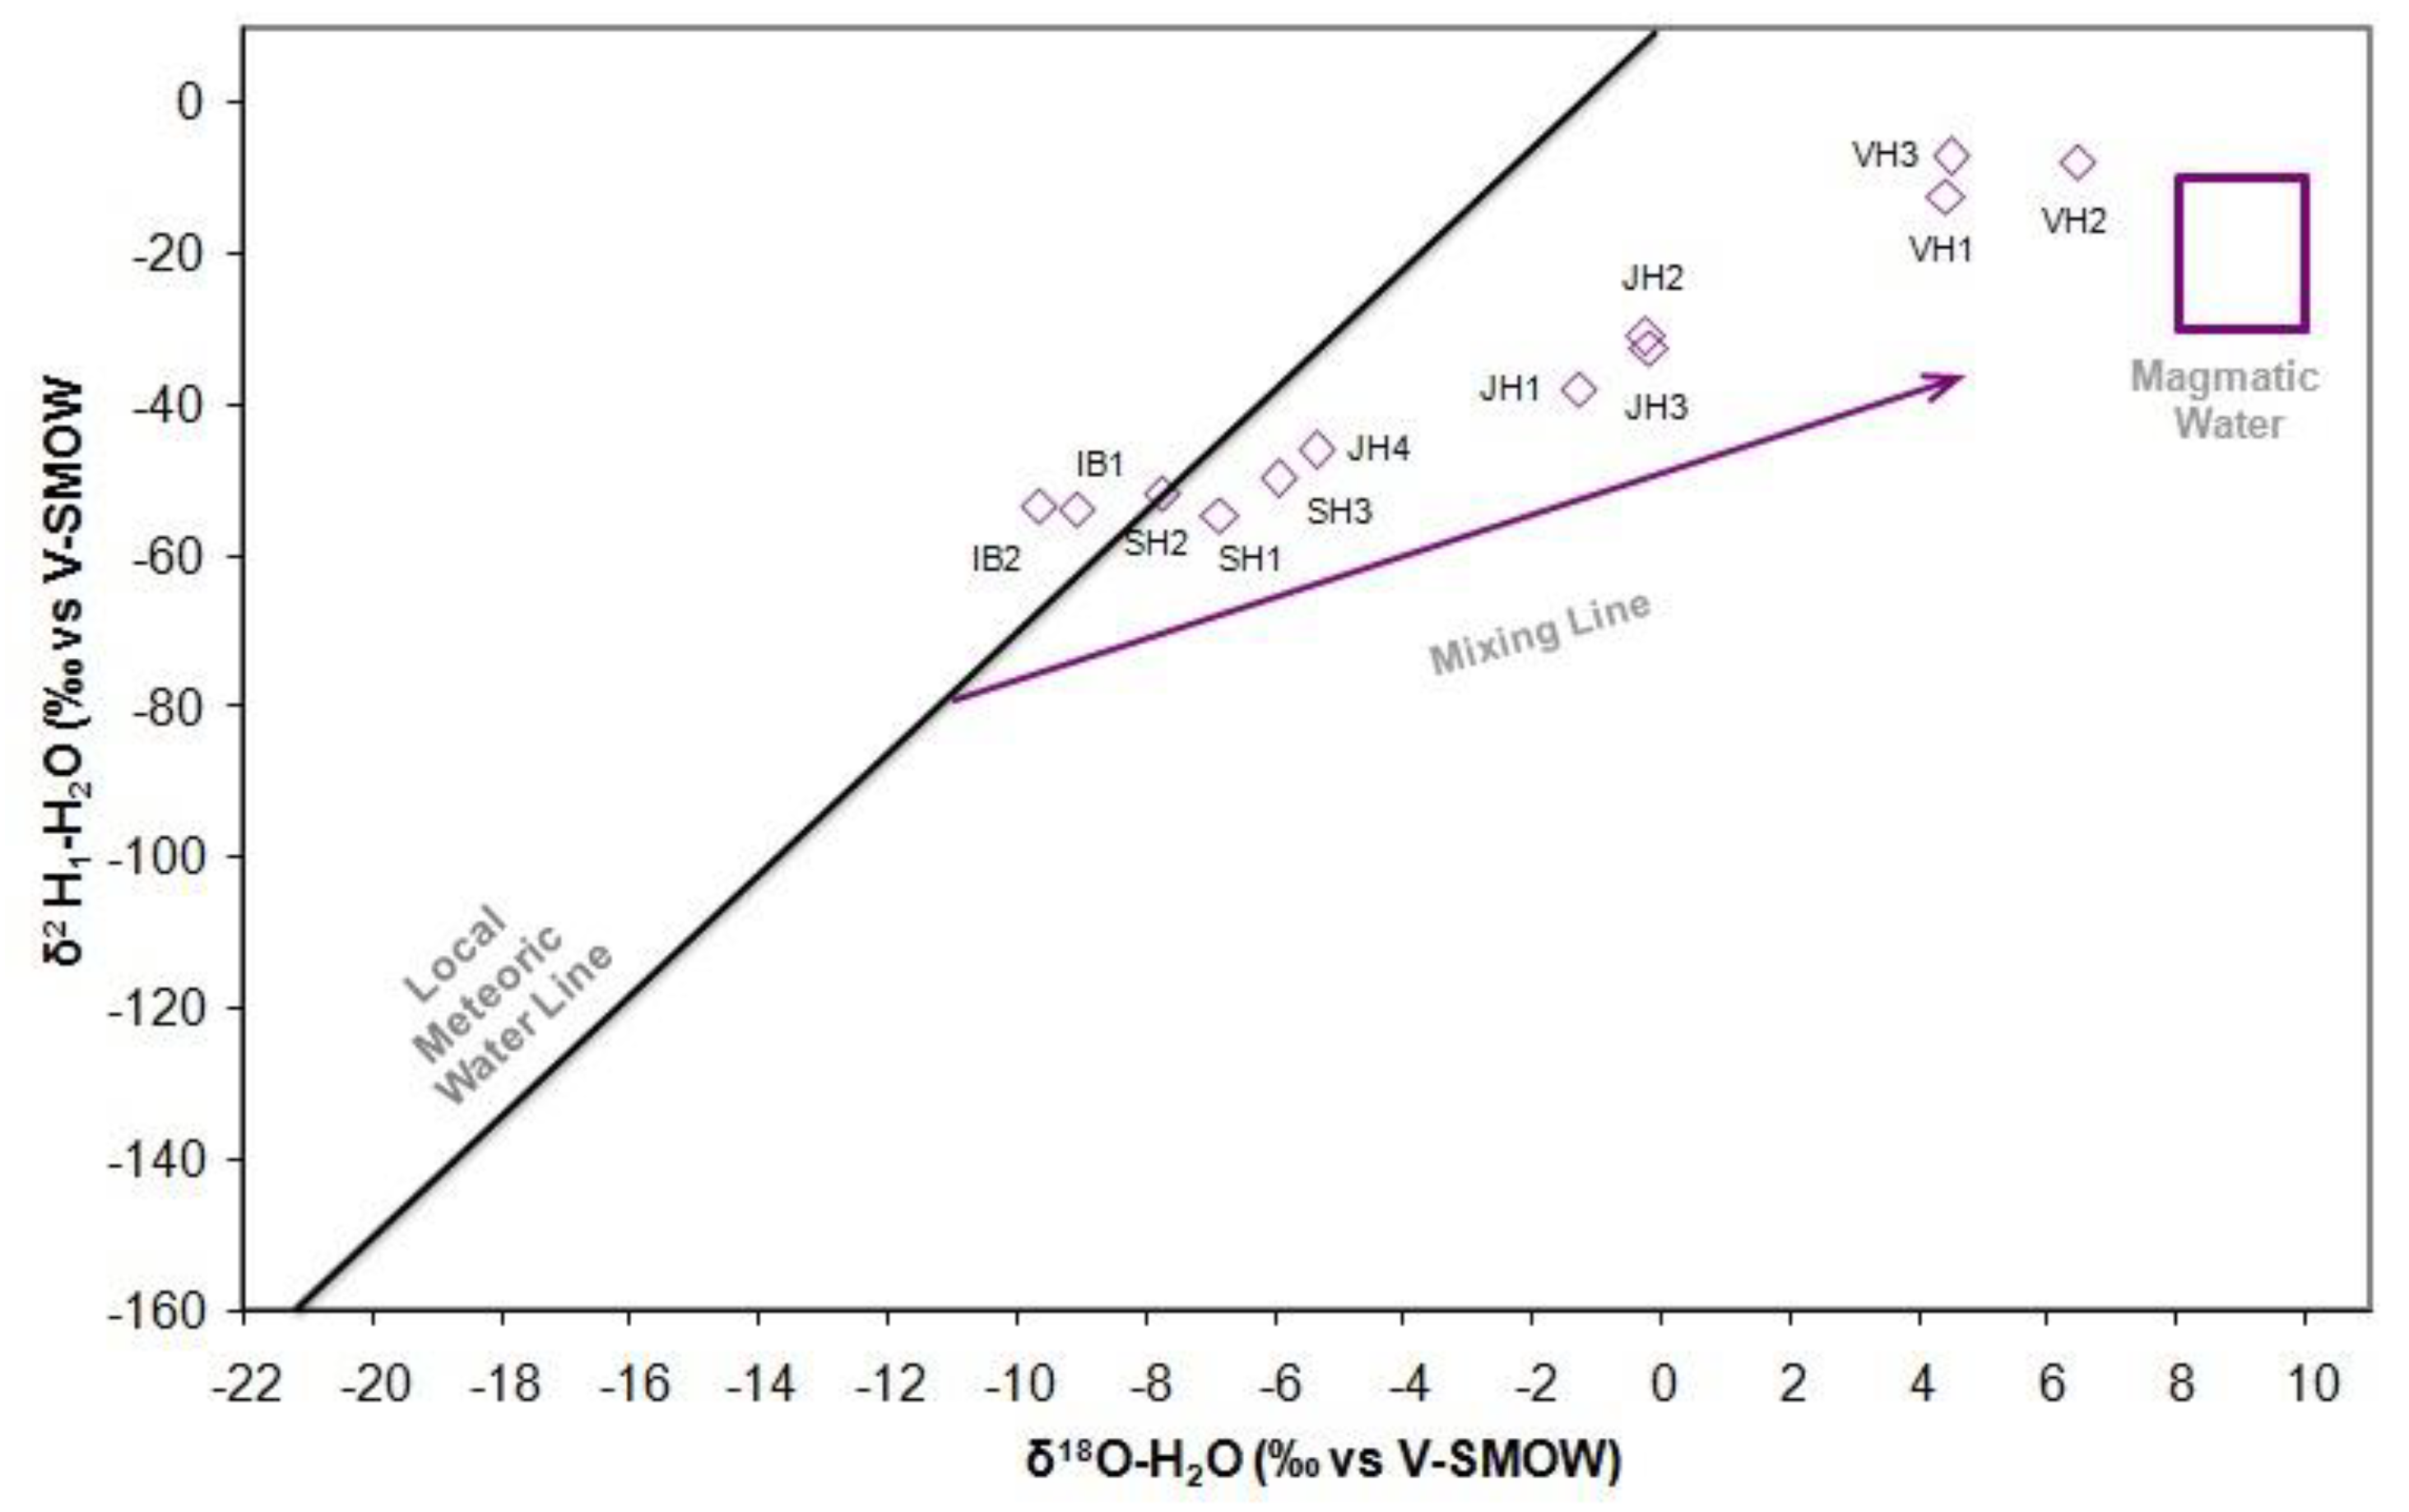
The analysis of the isotope ratio in the stable isotope plot showed that the water of Ie-Seu’um, Ie-Jue, Ie-Brôuk, and Ie-Jue are originated from meteoric water. While the Van-Heutz crater manifestation is originated from magmatic water.
The Giggenbach Na-K hydrothermal geothermometer [34] indicates that the Ie-Seu’um and Ie-Brôuk manifestations have average reservoir temperatures of 241.9 ± 0.3 °C a d 321.95 ± 13.4 °C, respectively, wheras the Fournier Na-K hydrothermal geothermometer [35] indicates that the Ie-Jue and Van-Heutz crater manifestations have average reservoir temperatures of 472.4 ± 91.4 °C and 439.3 ± 95.3 °C, respectively.
Gas geothermometry indicates that the Ie-Jue fumarole manifestation has a reservoir temperature of 201.6–312.7 °C. The analysis of the FT-CO2 Cross-Plot and CH4-CO2-H2S triangle diagram on the fumarole manifestation shows the reservoir temperature to be 275–325 °C. The analysis of the N2-He-Ar triangle diagram suggests that the Ie-Jue fumarole gas is of meteoric water origin.
Based on the reservoir temperatures, that can be estimated well using gas geothermometry and fluid geothermometry, the geothermal manifestations of the north zone of Seulawah Agam mountain are considered to constitute a high-temperature geothermal system (high enthalpy) in accordance with Hochstein, which is indicated by the average measured temperature > 225 °C. This condition suggests that the geothermal area is suitable for power plant development. In accordance with Kasbani [48] regarding the estimation of the energy potential for different geothermal types in Indonesia, the estimated capacity of the power plant production based on this temperature is above 100 MW and is estimated to have a reservoir with a system type dominated by steam and water or a mixture of both.

Author Contributions

Conceptualization, R.I. and T.M.I.M.; Data curation, M.Y., M.A., S.S. (Subhan Subhan ), A.L., G.M.I. and M.M. (Marwan Marwan ); Formal analysis, R.I., M.Y., M.A., S.S. (Subhan Subhan ) and A.L.; Funding acquisition, R.I. and T.M.I.M.; Investigation, R.I.; Methodology, R.I. and S.S. (Saiful Saiful ); Resources, M.M. (Marwan Marwan ); Software, R.S. and G.M.I.; Supervision, R.I.; Validation, M.M. (Muslem Muslem ); Visualization, R.S.; Writing—original draft, M.Y.; Writing—review & editing, R.I., M.M. (Muslem Muslem ) and T.M.I.M.

Funding

This research was funded by Kementerian Riset, Teknologi dan Pendidikan Tinggi through “Penelitian Dasar” scheme, grant number: 215/SP2H/LT/DPRM/2019 and the University of Technology Sydney under Grants 321740.2232397.

Acknowledgments

We would like to thank PT. Thermochem Indonesia, Badan Tenaga Nuklir Nasional (BATAN), and Institute for Research and Community Services (LPPM) Universitas Syiah Kuala for supporting this research.

Conflicts of Interest

The authors declare no conflict of interest.

References

  1. Ong, H.C.; Masjuki, H.H.; Mahlia, T.M.I.; Silitonga, A.S.; Chong, W.T.; Yusaf, T. Engine performance and emissions using Jatropha curcas, Ceiba pentandra and Calophyllum inophyllum biodiesel in a CI diesel engine. Energy 2014, 69, 427–445. [Google Scholar] [CrossRef]
  2. Silitonga, A.S.; Masjuki, H.H.; Mahlia, T.M.I.; Ong, H.C.; Chong, W.T. Experimental study on performance and exhaust emissions of a diesel engine fuelled with Ceiba pentandra biodiesel blends. Energy Conversion and Management 2013, 76, 828–836. [Google Scholar] [CrossRef]
  3. Ismail, M.S.; Moghavvemi, M.; Mahlia, T.M.I. Techno-economic analysis of an optimized photovoltaic and diesel generator hybrid power system for remote houses in a tropical climate. Energy Convers. Manag. 2013, 69, 163–173. [Google Scholar] [CrossRef]
  4. Ismail, M.S.; Moghavvemi, M.; Mahlia, T.M.I. Characterization of PV panel and global optimization of its model parameters using genetic algorithm. Energy Convers. Manag. 2013, 73, 10–25. [Google Scholar] [CrossRef]
  5. Amin, M.; Putra, N.; Kosasih, E.A.; Prawiro, E.; Luanto, R.A.; Mahlia, T.M.I. Thermal properties of beeswax/graphene phase change material as energy storage for building applications. Appl. Eng. 2017, 112, 273–280. [Google Scholar] [CrossRef]
  6. Mehrali, M.; Latibari, S.T.; Mehrali, M.; Mahlia, T.M.I.; Metselaar, H.S.C.; Naghavi, M.S.; Sadeghinezhad, E.; Akhiani, A.R. Preparation and characterization of palmitic acid/graphene nanoplatelets composite with remarkable thermal conductivity as a novel shape-stabilized phase change material. Appl. Eng. 2013, 61, 633–640. [Google Scholar] [CrossRef]
  7. Silitonga, A.S.; Mahlia, T.M.I.; Kusumo, F.; Dharma, S.; Sebayang, A.H.; Sembiring, R.W.; Shamsuddin, A.H. Intensification of Reutealis trisperma biodiesel production using infrared radiation: Simulation, optimisation and validation. Renew. Energy 2019, 133, 520–527. [Google Scholar] [CrossRef]
  8. Silitonga, A.; Mahlia, T.M.; Ong, H.C.; Riayatsyah, T.M.; Kusumo, F.; Ibrahim, H.; Dharma, S.; Gumilang, D. A comparative study of biodiesel production methods for Reutealis trisperma biodiesel. Energy Sources Part A Recover. Util. Environ. Eff. 2017, 39, 2006–2014. [Google Scholar] [CrossRef]
  9. Silitonga, A.S.; Masjuki, H.H.; Ong, H.C.; Sebayang, A.H.; Dharma, S.; Kusumo, F.; Siswantoro, J.; Milano, J.; Daud, K.; Mahlia, T.M.I.; et al. Evaluation of the engine performance and exhaust emissions of biodiesel-bioethanol-diesel blends using kernel-based extreme learning machine. Energy 2018, 159, 1075–1087. [Google Scholar] [CrossRef]
  10. Hochstein, M.P.; Sudarman, S. History of geothermal exploration in Indonesia from 1970 to 2000. Geothermics 2008, 37, 220–266. [Google Scholar] [CrossRef]
  11. Maryanto, S.; Dewi, C.N.; Syahra, V.; Rachmansyah, A.; Foster, J.; Nadhir, A.; Santoso, D.R. Magnetotelluric-geochemistry investigations of blawan geothermal field, East Java, Indonesia. Geosciences 2017, 7, 41. [Google Scholar] [CrossRef]
  12. Bertani, R. Geothermal power generation in the world 2010–2014 update report. Geothermics 2016, 60, 31–43. [Google Scholar] [CrossRef]
  13. Nasruddin; Alhamid, M.I.; Daud, Y.; Surachman, A.; Sugiyono, A.; Aditya, H.B.; Mahlia, T.M.I. Potential of geothermal energy for electricity generation in Indonesia: A review. Renew. Sustain. Energy Rev. 2016, 53, 733–740. [Google Scholar] [CrossRef]
  14. Guo, Q.; Pang, Z.; Wang, Y.; Tian, J. Fluid geochemistry and geothermometry applications of the Kangding high-temperature geothermal system in eastern Himalayas. Appl. Geochem. 2017, 81, 63–75. [Google Scholar] [CrossRef]
  15. Ármannsson, H. The fluid geochemistry of Icelandic high temperature geothermal areas. Appl. Geochem. 2016, 66, 14–64. [Google Scholar] [CrossRef]
  16. Cinti, D.; Procesi, M.; Tassi, F.; Montegrossi, G.; Sciarra, A.; Vaselli, O.; Quattrocchi, F. Fluid geochemistry and geothermometry in the western sector of the Sabatini Volcanic District and the Tolfa Mountains (Central Italy). Chem. Geol. 2011, 284, 160–181. [Google Scholar] [CrossRef]
  17. Tan, H.; Zhang, W.; Chen, J.; Jiang, S.; Kong, N. Isotope and geochemical study for geothermal assessment of the Xining basin of the northeastern Tibetan Plateau. Geothermics 2012, 42, 47–55. [Google Scholar] [CrossRef]
  18. Wang, A.; Padula, A.; Sirota, M.; Woodruff, T.J. Environmental influences on reproductive health: The importance of chemical exposures. Fertil. Steril. 2016, 106, 905–929. [Google Scholar] [CrossRef]
  19. Rafighdoust, Y.; Eckstein, Y.; Harami, R.M.; Gharaie, M.H.M.; Griffith, E.M.; Mahboubi, A. Isotopic analysis, hydrogeochemistry and geothermometry of Tang-Bijar oilfield springs, Zagros region, Iran. Geothermics 2015, 55, 24–30. [Google Scholar] [CrossRef]
  20. Joseph, E.P.; Fournier, N.; Lindsay, J.M.; Robertson, R.; Beckles, D.M. Chemical and isotopic characteristics of geothermal fluids from Sulphur Springs, Saint Lucia. J. Volcanol. Geotherm. Res. 2013, 254, 23–36. [Google Scholar] [CrossRef]
  21. Capaccioni, B.; Franco, T.; Alberto, R.; Orlando, V.; Marco, M.; Salvatore, I. Geochemistry of thermal fluids in NW Honduras: New perspectives for exploitation of geothermal areas in the southern Sula graben. J. Volcanol. Geotherm. Res. 2014, 280, 40–52. [Google Scholar] [CrossRef]
  22. Pasvanoğlu, S.; Chandrasekharam, D. Hydrogeochemical and isotopic study of thermal and mineralized waters from the Nevşehir (Kozakli) area, Central Turkey. J. Volcanol. Geotherm. Res. 2011, 202, 241–250. [Google Scholar] [CrossRef]
  23. Marwan; Yanis, M.; Idroes, R.; Ismail, N. 2D inversion and static shift of MT and TEM data for imaging the geothermal resources of Seulawah Agam Volcano, Indonesia. Int. J. Geomate 2019, 17, 173–180. [Google Scholar] [CrossRef]
  24. Marwan; Syukri, M.; Idroes, R.; Ismail, N. Deep and shallow structures of geothermal Seulawah Agam based on electromagnetic and magnetic data. Int. J. Geomate 2019, 16, 141–147. [Google Scholar] [CrossRef]
  25. Idroes, R.; Yusuf, M.; Alatas, M.; Lala, A.; Suhendra, R.; Idroes, G.M. Geochemistry of hot springs in the Ie Seu’um hydrothermal areas at Aceh Besar district, Indonesia. In Proceedings of the International Conference on Chemical Engineering Sciences and Applications, Banda Aceh, Indonesia, 21 September 2017; IOP Conference Series: Materials Science and Engineering. IOP Publishing: Bristol, UK, 2018; Volume 334. [Google Scholar]
  26. Idroes, R.; Yusuf, M.; Alatas, M.; Subhan; Lala, A.; Muhammad; Suhendra, R.; Idroes, G.M.; Marwan. Geochemistry of sulphate spring in the Ie Jue geothermal areas at Aceh Besar district, Indonesia. In Proceedings of the Annual International Conference, Banda Aceh, Indonesia, 12 September 2018; IOP Conference Series: Materials Science and Engineering. IOP Publishing: Bristol, UK, 2019; Volume 523, p. 012012. [Google Scholar]
  27. Idroes, R.; Yusuf, M.; Alatas, M.; Subhan; Lala, A.; Muslem; Suhendra, R.; Idroes, G.M.; Suhendrayatna; Marwan; et al. Geochemistry of warm springs in the Ie Brôuk hydrothermal areas at Aceh Besar district. In Proceedings of the Annual International Conference, Banda Aceh, Indonesia, 12 September 2018; IOP Conference Series: Materials Science and Engineering. IOP Publishing: Bristol, UK, 2019; Volume 523, p. 012010. [Google Scholar]
  28. Lahna, K.; Idroes, R.; Idris, N.; Abdulmadjid, S.N.; Kurniawan, K.H.; Tjia, M.O.; Pardede, M.; Kagawa, K. Formation and emission characteristics of CN molecules in laser induced low pressure He plasma and its applications to N analysis in coal and fossilization study. Appl. Opt. 2016, 55, 1731. [Google Scholar] [CrossRef]
  29. Marpaung, A.M.; Ramli, M.; Idroes, R.; Suyanto, H.; Lahna, K.; Abdulmadjid, S.N.; Idris, N.; Pardede, M.; Hedwig, R.; Lie, Z.S. A comparative study of emission efficiencies in low-pressure argon plasmas induced by picosecond and nanosecond Nd:YAG lasers. Jpn. J. Appl. Phys. 2016, 55, 116101. [Google Scholar] [CrossRef]
  30. Nicholson, K. Geothermal Fluids; Springer: Berlin/Heidelberg, Germany, 1993; ISBN 978-3-642-77846-9. [Google Scholar]
  31. APHA. Standard Methods for the Examination of Water and Wastewater, 21st ed.; American Public Health Association/American Water Works Association/Water Environment Federation: Washington, DC, USA, 2005.
  32. Craig, H. The isotopic geochemistry of water and and carbon in geothermal areas. In Nuclear Geology in Geothermal Areas, Spoleto; Tiongiorgi, E., Ed.; Consiglio Nazional delle Ricerche, Laboratorio di Geologia Nucleare, Pias: Rome, Italy, 1963; pp. 17–53. [Google Scholar]
  33. Giggenbach, W.F.; Goguel, R.L. Collection and Analysis of Geothermal and Volcanic Water and Gas Discharges, 4th ed.; Report CD2401; Chemistry Division, DSIR: Petone, New Zealand, 1989.
  34. Giggenbach, W.F. Geothermal solute equilibria. Derivation of Na-K-Mg-Ca geoindicators. Geochim. Cosmochim. Acta 1988, 52, 2749–2765. [Google Scholar] [CrossRef]
  35. Fournier, R.O. A revised equation for the Na/K Geothermometer. Geotherm. Resour. Council Trans. 1979, 3, 221–224. [Google Scholar]
  36. Tonani, F.B. Some Remarks on the Application of Geochemical Techniques in geothermal exploration. In Advances in European Geothermal Research; Springer Netherlands: Dordrecht, The Netherlands, 1980; pp. 428–443. [Google Scholar]
  37. Truesdell, H. Geochemical Techniques in Exploration: Summary of Section III. In Proceedings of the Second UN Symposium on the Development and Use of Geothermal Resources, San Francisco, CA, USA, 20 May 1976; pp. 53–79. [Google Scholar]
  38. Nieva, D.; Nieva, R. Developments in geothermal energy in Mexico—part twelve. A cationic geothermometer for prospecting of geothermal resources. Heat Recover. Syst. CHP 1987, 7, 243–258. [Google Scholar] [CrossRef]
  39. Arnorsson, S. Chemical equilibria in icelandic geothermal systems—Implications for chemical geothermometry investigations. Geothermics 1983, 12, 119–128. [Google Scholar] [CrossRef]
  40. Fournier, R.O.; Truesdell, H. An empirical Na-K-Ca geothermometer for natural waters. Geochimica et Cosmochimica Acta 1973, 37, 1255–1275. [Google Scholar] [CrossRef]
  41. Piper, A.M. A graphic procedure in the geochemical interpretation of water-analyses. Trans. Am. Geophys. Union 1944, 25, 914. [Google Scholar] [CrossRef]
  42. Giggenbach, W.F. Chemical techniques in geothermal exploration. In Applications of Geochemistry in Geothermal Reservoir Development; D’Amore, F., Ed.; UNITAR/UNDP: Rome, Italy, 1991; pp. 119–144. [Google Scholar]
  43. Giggenbach, W.F. Isotopic shifts in waters from geothermal and volcanic systems along convergent plate boundaries and their origin. EPSL 1992, 113, 495–510. [Google Scholar] [CrossRef]
  44. D’ Amore, F.; Panichi, C. Evaluation of deep temperatures of hydrothermal systems by a new gas-geothermometer. Geochim. Cosmochim. Acta 1980, 44, 549–556. [Google Scholar] [CrossRef]
  45. Douglas, A.S.; Donald, M.W.; Holler, F.; Crouch, S. Fundamentals of Analytical Chemistry. Saunders Golden Sunburst Series; Thomson-Brooks/Cole: Hampshire, UK, 2004. [Google Scholar]
  46. Giggenbach, W.F.; Glover, R.B. Tectonic regime and major processes governing the chemistry of water and gas discharges from the rotorua geothermal field, New Zealand. Geothermics 1992, 21, 121–140. [Google Scholar] [CrossRef]
  47. Powell, T.; Cumming, W. Spreadsheets for Geothermal Water and Gas Geochemistry. In Proceedings of the Thirty-Fifth Workshop on Geothermal Reservoir Engineering Stanford University, Stanford, CA, USA, 1–3 February 2010; pp. 408–417. [Google Scholar]
  48. Kasbani. Tipe sistem panas bumi di Indonesia dan estimasi potensi energinya. Buletin Sumber Daya Energi 2009, 4, 3. [Google Scholar]
Figure 1. Geological Map of Seulawah Agam Mountain, Aceh Besar district, Indonesia. Sampling point codes; SH (Ie-Seu’um); IB (Ie-Brôuk); JH (Ie-Jue); VH (Van-Heutz crater).
Energies 12 04442 g001
Figure 2. (a) Piper diagram for the dominant composition of anion and cation contents; (b) Cl-HCO3-SO4 triangle diagram for the geothermal water type in the north zone of Seulawah Agam Mountain.
Energies 12 04442 g002
Figure 3. Triangle diagram of Na-K-Mg in Seulawah Agam Mountain Area.
Energies 12 04442 g003
Figure 4. (a) FT-CO2 cross-plot diagram and (b) CH4-CO2-H2S triangle diagram.
Energies 12 04442 g004
Figure 5. N2-He-Ar triangle diagram.
Energies 12 04442 g005
Figure 6. δ18O dan δ2H stable isotope plot.
Energies 12 04442 g006
Table 1. Temperature equations (°C) for geothermometry.
GeothermometerEquationsReferences
Na–KT = [855.6 / (0.857 + log(Na/K))] − 273.15[37]
Na–KT = [833 / (0.780 + log(Na/K))] − 273.15[36]
Na–KT = [1319 / (1.699 + log(Na/K))] − 273.15[39]
Na–KT = [1217 / (1.483 + log(Na/K))] − 273.15[35]
Na–KT = [1178 / (1.470 + log(Na/K))] − 273.15[38]
Na–KT = [1390 / (1.750 + log(Na/K))] − 273.15[34]
Na-K-Ca T = 1647 log N a K + β   [ log ( C a ½ N a ) + 2 , 06 ] 273 .15
for: β = 4/3, if T < 100 °C
β = 1/3, if T > 100 °C
[40]
Table 2. Temperature equations (°C) for gas geothermometers.
GeothermometerFormula (°C)Reference
CO2/H2S/CH4/H2 T = 24775 [ 2 log ( CH CO ) 6 log ( H CO ) 3 log ( H S CO ) + 7 log P CO 2 + 36.05 ] 273.15 [44]
H2/Ar T = 70 [ 2.5 + log ( m H / m Ar ) ] [33]
CH4/CO2 T = 4625 10.4 + log ( CH CO ) 273.15 [42]
CO2/H2 T = 341.7 + 28.57   log m CO / H [42]
Table 3. Calculation formula of measurement uncertainty.
NameFormulaReference
Standard deviation of regression S r = S y y m 2 S x x N 2 [45]
Standard deviation of slope S m = S y 2   ( X ¯ X i ) 2 = S y 2   x i 2 (   X i ) 2 / N
Standard deviation of intercept S b = S y S y   2   X i 2 N   X i 2 ( X i ) 2 =   S y 1 N (   X i ) 2 /   X i 2
Standard deviation of the concentration S c = S r m 1 M + 1 N + ( Y c Y a v e   ) 2 m 2 S x x
Table 4. Characteristics of surface manifestation of the north zone, Seulawah Agam mountain.
NoLocationsSampling PointsCoordinatesElevation (m)Twater (°C)pHConductivity (mV)TDS (mg L−1)
NE
1Ie Seu’umSH15°32.842’95°32.918’7086.02 ± 0.0196.66 ± 0.00024.6 ± 0.221558 ± 8.37
SH25°32.834’95°32.924’7286.09 ± 0.0056.66 ± 0.01224.5 ± 0.281766 ± 8.94
SH35°32.821’95°32.926’7283.63 ± 0.0756.68 ± 0.00423.0 ± 0.961578 ± 5.70
2Ie JueJH15°30.397’95°37.683’26498.62 ± 0.1515.93 ± 0.00576.24 ± 0.74530.2 ± 5.93
JH25°30.414’95°37.736’26593.62 ± 0.2844.18 ± 0.10718.86 ± 0.23891.8 ± 2.58
JH35°30.403’95°37.743’26593.49 ± 0.1723.95 ± 0.048215.78 ± 1.48997.0 ± 1.73
JH45°30.383’95°37.743’26997.61 ± 0.0584.92 ± 0.034149.96 ± 0.981125.4 ± 5.55
3Ie BrôukIB15°31.077’95°37.034’21040.04 ± 0.0137.24 ± 0.00414.02 ± 1.01265.0 ± 1.58
IB25°31.048’95°36.948’19747.49 ± 0.1337.40 ± 0.05822.44 ± 0.61237.60 ± 0.54
4Van HeutzVH15°28.227’95°39.491’72376.6 ± 0.081.57 ± 0.019.67 ± 0.104.85 ± 0.01
VH25°28.234’95°39.494’72368.5 ± 0.041.81 ± 0.018.79 ± 0.014.39 ± 0.01
VH35°28.237’95°39.494’72046.8 ± 0.111.44 ± 0.017.28 ± 0.013.64 ± 0.01
Table 5. Cation concentration of the geothermal manifestation in Seulawah Agam mountain.
Code[K⁺] ± Sc (mg L−1)[Na⁺] ± Sc (mg L−1)[Mg²⁺] ± Sc (mg L−1)[Ca²⁺] ± Sc (mg L−1)[Li⁺] ± Sc (mg L−1)[B⁺] ± Sc (mg L−1)[SiO₂] ± Sc (mg L−1)
SH1219.26 ± 0.0021948.8 ± 0.00810.84 ± 0.125234.80 ± 0.0178.03 ± 0.000329.10 ± 0.02615.28 ± 3.69
SH2218.92 ± 0.0011951.6 ± 0.00710.64 ± 0.124233.51 ± 0.0167.99 ± 0.000129.03 ± 0.02818.37 ± 1.22
SH3216.95 ± 0.0021922.2 ± 0.00810.13 ± 0.008234.60 ± 0.0187.88 ± 0.000229.02 ± 0.02723.95 ± 2.23
JH112.10 ± 0.00111.71 ± 0.0075.01 ± 0.12435.56 ± 0.018nd0.02 ± 0.02624.21 ± 2.26
JH25.44 ± 0.00213.54 ± 0.0065.59 ± 0.12322.51 ± 0.016nd0.07 ± 0.02519.56 ± 1.49
JH37.56 ± 0.0029.91 ± 0.0079.22 ± 0.12350.40 ± 0.018nd0.03 ± 0.02722.04 ± 1.94
JH421.87 ± 0.00148.66 ± 0.00852.22 ± 0.125304.56 ± 0.017nd0.06 ± 0.02621.03 ± 1.77
IB118.30 ± 0.00176.88 ± 0.0066.29 ± 0.12423.73 ± 0.018nd0.232 ± 0.02619.72 ± 1.53
IB218.97 ± 0.00267.21 ± 0.00711.58 ± 0.12527.74 ± 0.017nd0.251 ± 0.02712.82 ± 3.48
VH18.74 ± 0.4334.11 ± 0.7213.49 ± 0.63180.86 ± 1.550.39 ± 0.010.03 ± 0.0190.05 ± 3.13
VH23.47 ± 0.375.61 ± 0.542.41 ± 0.5820.18 ± 0.670.01 ± 0.010.03 ± 0.0127.27 ± 2.65
VH34.01 ± 0.374.18 ± 0.533.29 ± 0.5810.69 ± 0.580.03 ± 0.020.23 ± 0.0299.87 ± 3.21
Table 6. Anion concentration of geothermal manifestation in Seulawah Agam mountain.
Code[Cl] ± Sc (mg L−1)[SO42−] ± Sc (mg L−1)[F] ± Sc (mg L−1)[NO3−] ± Sc (mg L−1)[HCO3−] ± Sd (mg L−1)
SH12713.26 ± 0.193182.46 ± 0.178ndnd104.99 ± 0.55
SH22657.77 ± 0.194160.92 ± 0.177ndnd103.87 ± 0.65
SH32671.42 ± 0.193143.66 ± 0.176ndnd101.09 ± 0.38
JH13.34 ± 0.16811.71 ± 0.007nd1.21 ± 0.330.54 ± 0.03
JH29.74 ± 0.17513.54 ± 0.006nd0.25 ± 0.345.45 ± 0.29
JH30.80 ± 0.1659.91 ± 0.007ndndnd
JH41.41 ± 0.16648.66 ± 0.008nd46.75 ± 0.42nd
IB15.31 ± 0.17176.88 ± 0.006nd5.21 ± 0.34262.81 ± 0.88
IB28.66 ± 0.17467.21 ± 0.0070.03 ± 0.0914.68 ± 0.34255.11 ± 0.62
VH112.38 ± 0.123127.15 ± 3.06ndndnd
VH20.51 ± 0.102641.64 ± 2.82ndndnd
VH30.77 ± 0.102597.73 ± 2.79ndndnd
Table 7. Analysis data of fumarole gas from Ie-Jue manifestation.
SourceLocationCoordinatesElevation (M)Dry gas mol percentage (%)
NECO2H2SNH3ArN2CH4H2
FumaroleIe-Jue5°30.037’95°37.809’27393.91.020.7790.0583.800.2590.139
Table 8. Estimation of reservoir’s temperature of geothermal areas in north zone Seulawah Agam mountain.
Sampling PointNa-K-Ca Fournier & Truesdell (1973) (◦C)Na/K Fournier (1979) (◦C)Na/K Truesdell (1976) (◦C)Na/K Giggenbach (1988) (◦C)Na/K Tonani (1980) (◦C)Na/K Nieva & Nieva (1987) (◦C)Na/K Arnorsson (1983) (◦C)
SH1210.7227.3200.6241.9237.6213.9207.3
SH2210.6227.0200.6241.6237.2213.6207.0
SH3210.6227.6200.9242.2238.0214.1207.7
JH169.2555.4741.7527.6879.9536.0680.1
JH255.9374.5409.5374.6477.7358.1398.5
JH347.3487.2604.5471.1710.6468.9567.0
JH458.3391.8437.1389.6510.1375.1423.0
BH1115.1304.6304.7312.5356.1289.6304.1
BH2110.7325.7335.1331.4391.1310.2331.8
VH141.3331.2343.3336.3400.6315.7339.2
VH239.2475.4582.4461.2683.8457.3548.3
VH349.0511.3651.1491.3767.6492.6605.9
Table 9. Estimation of depth temperature using gas geothermometer.
LocationGas Geothermometer (T = °C)
CO2/H2S/CH4/H2H2/ArCH4/CO2CO2/H2
Ie Jue256.2201.6316.7260.9
Table 10. Value of δ18O and δ2H stable isotopes.
Sampling Pointδ18O (‰)δ2H (‰)
SH1−6.85 ± 0.05−54.7 ± 2.3
SH2−7.75 ± 0.23−51.7 ± 0.8
SH3−5.95 ± 0.32−49.9 ± 0.3
JH1−1.29 ± 0.55−37.8 ± 2.9
JH2−0.23 ± 0.24−31.0 ± 0.7
JH3−0.19 ± 0.37−32.4 ± 0.8
JH4−5.34 ± 0.18−46.0 ± 0.4
IB1−9.09 ± 0.27−53.7 ± 2.1
IB2−9.66 ± 0.57−53.4 ± 0.5
VH14.42 ± 0.28−12.4 ± 2.1
VH26.44 ± 0.16−7.7 ± 4.8
VH34.50 ± 0.14−7.1 ± 0.9

