1. Introduction
For the purpose of environmental protection and sustainable development, green innovation has been gained worldwide attention. Zisopoulou et al. [
1] pointed out that green economic growth is involved in the framework of WEF Nexus (Water, Energy, and Food Nexus) and Aghion et al. [
2] claimed that no green growth is possible without innovation. Abernathy and Clark [
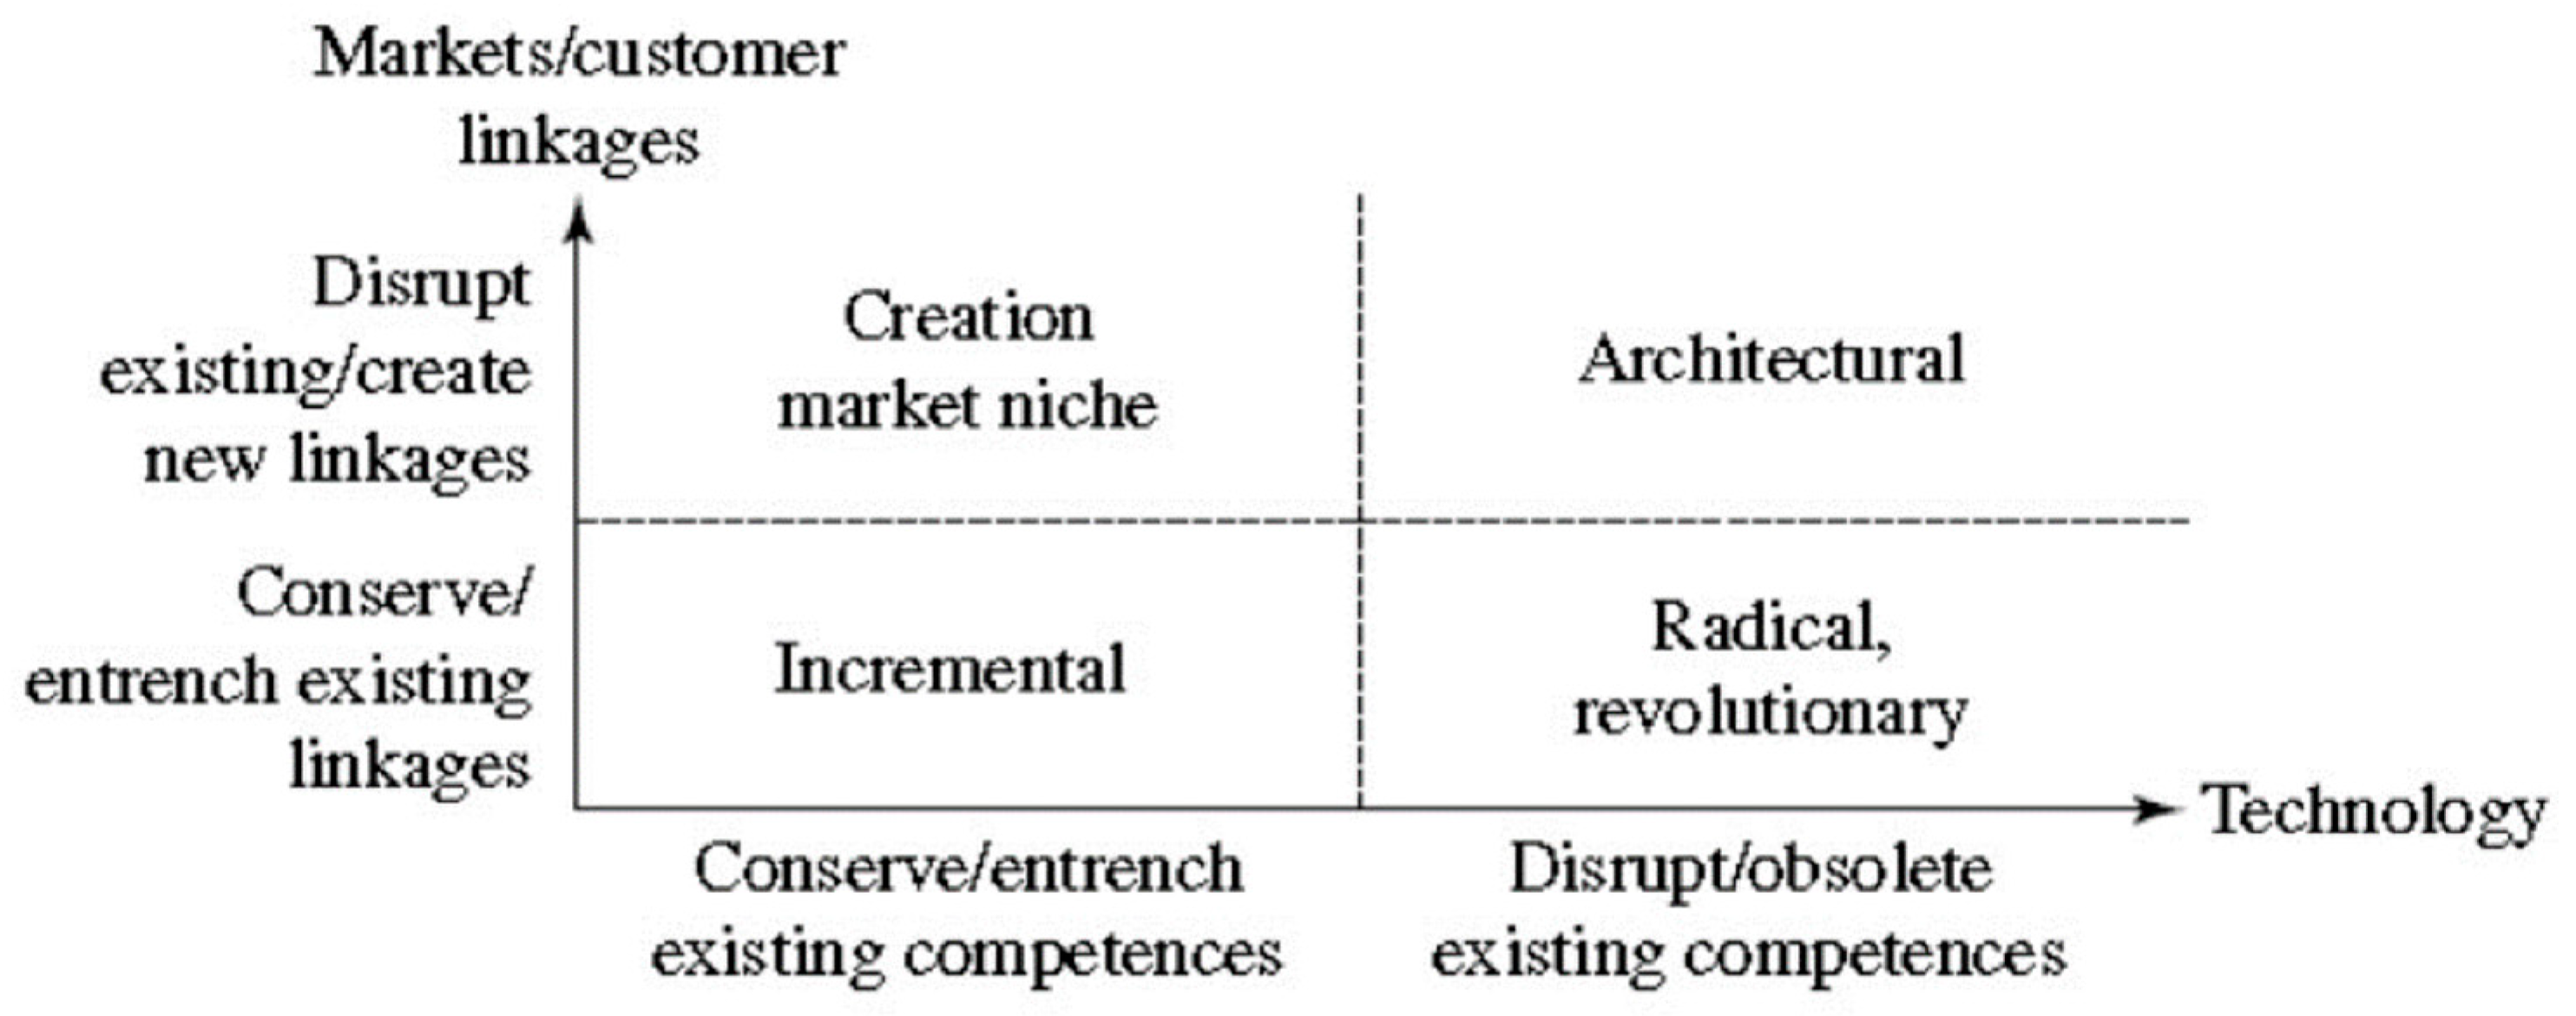
3] developed a framework for analyzing the competitive implications of innovation. A diagrammatic topology of innovation is found in their work as
Figure 1. Diamond Jr [
4] introduced the Schumpeter ‘creative destruction’ nature of innovation by a review of evidence. A relatively pragmatic definition of green innovation given by Driessen and Hillebrand [
5] explains that green innovation should produce significant environmental benefits. Another definition of green innovation, given by Chen et al. [
6], consider it as hardware and software innovation relevant to green products. Technical innovation involving in energy saving, pollution prevention, waste recycling, design for green products, and environmental management are all essential parts of green innovation. As shown by Schiederig et al. [
7], green innovation management is getting more and more important in both practice and academic research in the past several years. The shortage of resources allows us to consider more on the construction of green innovation and promotion of green innovation performance since they play key roles in sustainable development. For instance, Chang and Chen [
8] explored the positive effect of green organizational identity on green innovation performance. Besides, they verified that both environmental commitment and environmental organizational legitimacy mediate between green organizational identity and green innovation performance. From the strategic management perspective, green innovation allows the industries, banks, and governments to coordinate development with each other. These facts drive us focusing on the study of green innovation. Works by Dutz and Sharma [
9], Janicke [
10], Lewis [
11] show in the open economy, green innovation of a country or an industry is increasingly influenced by the external environment, especially the performance of banks and governments.
Much literature concentrates on financial resource influence on innovation development. Aghion et al. [
12] investigated whether financing choices differ systematically with R&D intensity and found a nonlinear relationship between R&D intensity and debt/asset ratio. Bartoloni [
13] offered a twofold contribution to the empirical debate on the financing of innovation, the causality, and determinants. The results support the pecking order theory, as well as the existence of credit constraints, which seem to affect small innovative firms when compared with larger enterprises. Magri [
14] shed light on special features in financial structure of small innovative firms and showed that small innovators rely less on financial debts and more on internal financial resources. Another finding is that small innovative firms show a lower investment sensitivity to cash flow. O’Brien [
15] supported that financial slack should be a particularly critical strategic imperative for firms pursuing a competitive strategy premised on innovation. Schäfer et al. [
16] investigated whether young, small and medium-sized enterprises classified as innovative firms, favor equity financing, and explored the factors determining their choices of financing mode. Del Río et al. [
17] built a framework to incorporate the impact of firm internal factors such as resources, capabilities and competencies, and their interactions with external drivers on the development and adoption of eco-innovation. Marín-Vinuesa et al. [
18] contributed empirically to the understanding of the impact that eco-innovation has on financial performance within the framework of the resource-based view. This literature focus on the relationship between capital structure and innovation performance. Some authors like Coad et al. [
19] and D’Este et al. [
20] investigated the barriers to innovation. The work of Coad et al. [
19] contributes to the literature on barriers to innovation by accounting for heterogeneous effects that each barrier has on firms across the productivity distribution. D’Este et al. [
20] argued that it is necessary to distinguish two kinds of barriers to innovation, revealed barriers and deterring barriers.
For green innovation, in this paper, the authors focus on the effect of the specific financing resource, the green loan, on the innovation performance. Some works, for example, by Benfratelloe et al. [
21], Brown et al. [
22], Kenney [
23], Qamruzzaman and Wei [
24] have shown that external financing, where banks play key roles, has a major impact on technical activities of enterprises. Small and medium-sized enterprises are usually with weak financial strength. Green loans provide them start-up funds of green innovation so that they are more competitive with peer companies. Benfratelloe et al. [
21] verified that the process innovation can be affected by banking development, particularly for high-tech companies and those depending more on external finance. Concentrating on a provincial and industry-level innovation data set and regional lending structure in China’s credit market from 1999 to 2007, Xin et al. [
25] found that the level of innovation has been improved by bank loans. Works Hawkins and Kuang [
26], Hsu et al. [
27] showed that more external financing dependent or a more high-tech intensive industry tends to exhibit a disproportionately higher innovation level in countries with better-developed equity markets. The work of Amore et al. [
28] shows that banking development plays an important role in technical progress and deregulation admits a significantly positive impact on quantity and quality of innovation activity. Kim and Park [
29] pointed out that financial development leads to a reduction of CO
2 emission by addressing the role of the financial market in deploying renewable energy. Later, Nanda and Nicholas [
30], Zhuang [
31] show the positive correlation between green loans and the innovation of enterprises.
Most existing literature on green loans concentrates on the influence of banking development and financial performance on green production and green innovation. Few pieces of literature care for quantitative analysis of green loans, particularly the role played by the loaning scale. Li et al. [
32] started to explore problems relevant to loaning scales in their work. Enterprises are considered as principal objects in green innovation activities, where enterprises showed that the loaning scale is a crucial factor to stimulate green innovation by constructing series game models. By analyzing the profit of the enterprise through green innovation, they derived the loaning scale-dependent condition to stimulate green innovation. Besides, they obtained a threshold of the green loaning scale, which determines the green effect of the innovation project. Subsequently, following the work of Li et al. [
32], Huang et al. [
33] improved their results by considering the case that the success of green innovation also depends on the green loaning scale. They assumed that the larger capital input would enhance the success possibility of the green innovation project. Actually, this hypothesis is consistent with practice. In addition to similar results of Li et al. [
32], they obtained a threshold of the green lending interest rate, which provides a reference when stimulating green innovation.
Energy consumption plays an important role in industrial production. The inefficient energy consumption is the main origin of environmental pollution, as some hazardous substances will be let out into the environment. Improving the energy efficiency by technology input, as a green technical innovation project, is an effective approach to reduce emission of hazardous substances. Thus, motivated by the works of Li et al. [
32] and Huang et al. [
33], in this paper, the authors devote to the further study on appropriate loaning scales and interest rates for green innovation projects to improve the energy efficiency. Comparing with the works of Li et al. [
32] and Huang et al. [
33], the promotion of the current paper is summarized as follows. Firstly, the authors introduce the initial fund demand for the innovation project. As long as the investment exceeds this fund demand, the green innovation will take effect. This part of capital is thought as the acquisition cost of basic equipment. Secondly, the improved energy efficiency through green innovation, depending on the green loaning scale, is set to be a hyperbolic type rather than an exponential type as that by Li et al. [
32] and Huang et al. [
33]. This modification will not lead to any robust problems in the model. With the hyperbolic typesetting for improved energy efficiency, the authors present explicit formulas for some specific loaning scales in green innovation. Explicit formulas for important quantities in engineering problems are usually preferred since it is convenient to apply and analyze the theoretical results. Thirdly, a uniform threshold of lending interest rate is shown independent of the loaning scale, which is different from that in Huang et al. [
33] in which the threshold of lending interest rate depends on the loaning scale. In general, the loaning scale was found to be negatively related to interest spread [
34]. Thus, the threshold of lending interest rate provides a meaningful reference for decision on the green loan and is more appropriate to be uniform with respect to the loaning scale. Fourthly, the incentive of green innovation depends on both the interest rate and the scale of the green loan. Moreover, dependence admits an order. The incentive first depends on the lending interest rate. If the lending interest rate is lower than the threshold, then the incentive depends on the loaning scale. The green innovation way considered in this paper also belongs to environmental innovation. Ghisetti and Rennings [
35] separated the environmental innovation into two categories, those that reduce negative externalities and those targeting efficiency increases and cost savings. We claim that this paper targets both these categories.
Following the work of Huang et al. [
33], to look at the stimulation of green innovation, the authors introduce the role of government into the game. The government subsidy is considered as an approach to stimulate green innovation projects. In reality, government subsidies are the result of bilateral Pigouvian taxation [
36]. Governments have a social responsibility in environmental protection and sustainable development. Governments can encourage enterprises to transform from high-level consumption and high-pollution process flows to sustainable green innovative mode through regulatory and incentive measures. To accelerate the development of green innovation system and improve the quantity and quality of green innovation, enhancement of intensity and range of government subsidies are necessary. Paramati et al. [
37] showed that governments and policymakers of emerging markets should provide favorable incentives to encourage green innovations. Berrone et al. [
38] believed that regulation pressure shows a positive influence on green innovation of enterprises. Monasterolo and Raberto [
39] showed the promotion of green growth by green public policies in a way of developing the EIRIN flow-of-funds behavioral model to simulate the introduction of green fiscal policies. Gerlach and Zheng [
40] believed that the benefits of providing green production and effective incentives for the business are the two things to weigh in incentive management. Van Leeuwen and Mohnen [
41] showed that environmental regulation has contribution to ecological investment and ecological innovation. As shown by Acemoglu et al. [
42], Chen and Nie [
43], Dzonzi-Undi and Li [
44], subsidy provided by governments can promote the development of green innovation and alleviate environmental pressure directly for enterprises. Thus, enterprises are willing to conduct green innovation with reduced costs because of subsidies. Wang et al. [
45] pointed out that the intention of enterprises to conduct innovation can be improved by a green insurance subsidy and government subsidy. Kemfert and Schmalz [
46] illustrated that energy-intensive industries with poor production structure will be restrained by green loan policies. Tsai and Liao [
47] showed that a high level of government subsidy will encourage enterprises to improve the ecological quality by applying environmental strategies. In the setting of this paper, the government provides subsidies for enterprises that apply for loan to perform green innovation. Huang et al. [
33] claimed that government subsidy is indeed an effective approach to stimulate green innovation and green production, but they did not provide any information on the subsidy scale. The problem relevant to appropriate government subsidy scales is addressed in the current paper. Meanwhile, three kinds of government subsidy are considered, including a subsidy for the bank which issues green loans, subsidy for the enterprise before implementing green innovation, and subsidy for the enterprise after implementing green innovation. Thus, this section is also a further exploration of the results in the work of Huang et al. [
33].
The methodology used in this paper is from game theory. Game theory has been widely used to discuss decisions between governments and enterprises in environmental protection. Huang et al. [
48] investigated the influences of projects such as product design, supplier selection, transportation modes and pricing strategies on profit and greenhouse gas emission by game models. Tian et al. [
49] analyzed the interest relation among the government, enterprises, and consumers by dynamic game theory, which interprets that subsidy is benefic to the diffusion of green supply chain management. Hafezalkotob et al. [
50] considered the influences of environmental policies on green production and supply chains by multi-level game methods. They pointed that the government can reduce negative impacts of supply chains on the environment and encourage green production through tax and subsidy.
The rest of this paper is organized as follows. In
Section 2, we propose some baseline models, including the environmental effect of the enterprise through green innovation, the energy efficiency of the enterprise depending on the green loaning scale, and the profit functions of the enterprise after green innovation with and without government subsidy. Enterprises are the most primary participants in green innovation activities. Green innovation should improve the environmental effect and increase the profits of enterprises. In
Section 3, a threshold of the lending interest rate and three thresholds of the green loaning scales are derived. The threshold of the lending interest rate generates a precondition to stimulate green innovation. If the lending interest rate is lower than this threshold, then the incentive of green innovation depends on the loaning scale, which is subject to the thresholds. The green effect of the innovation project is also determined by the loaning scale. As long as the loaning scale is lower than some threshold, the innovation project will show its green effect. In
Section 4, we focus on the government subsidy scales. Huang et al. [
33] prove that government subsidy is an effective approach to stimulate green innovation. The following problem addressed in this paper is the determination of appropriate government subsidy scales. In
Section 5, we give a conclusion and some suggestions.
2. Baseline Models
We consider a representative enterprise in the market. We construct the models under free competition and assume that the industry is energy-intensive and depends heavily on energy consumption. We fix other inputs since we focus on the energy input and the environmental effect of energy usage in the production process. We denote the energy input
. The output of the enterprise in the production is given as
where
is the energy efficiency, which depicts the percent conversion of unit energy, satisfying
.
is the production efficiency, which depicts the output of a unit input, satisfying
. In this way, according to Huang et al. [
33], define a measure to capture the environmental effect made by the enterprise in the production as
The measure (1) is interpreted as the inefficient usage of energy. The energy emission is proportional to the inefficient usage of the energy and leads to environmental problems, except for green inputs such as wind and solar power. For instance, the emission of CO
2 from producing activities leads to global warming. Since
and
, low energy efficiency and high energy input lead to poor environmental effects. Although reducing the energy input and the production scale may be benefit to the environment, it does not contribute to the economic development. Technical innovation to improve energy efficiency is an effective approach. Banks provide financial support to companies to conduct technical innovations and they are encouraged to issue green loans for environmentally friendly projects. Denote
the improved energy efficiency after the enterprise implements technical innovation with loaning scale
. The unit of the loaning scale can be thought as thousand dollars of hundred dollars. It depends on the practical applications of the model. The parameter
represents the original energy efficiency before technical innovation. The improved energy efficiency depends heavily on the loaning scale. In this paper, the relation between energy efficiency and the loaning scale is supposed to satisfy the following formula
The parameter
represents the technical maturity. The energy efficiency can be improved with a low cost in the innovation process if the enterprise possesses a high technical maturity. The enterprise with a high technical maturity can achieve an expected level of energy efficiency by technical innovation with a relatively small loaning scale. The parameter
is interpreted as the threshold effect of capital input in technical innovation. The energy efficiency cannot be improved through technical innovation until the capital input exceeds the threshold
. This capital input is considered as the acquisition cost of initial equipment. The setting of the improved energy efficiency (2) seems ad hoc. Actually, it is motivated by the logistic form, as seen in Dafermos et al. [
51]. Since we focus on the effect of loaning scales in the green innovation project, the loaning scale should be a variable influencing the improvement of energy efficiency through technological innovation. In general, the improved energy efficiency depending on the loaning scale should be increasing with respect to the loaning scale. Meanwhile, with the investment increases, the improvement of energy efficiency will encounter a choke point, namely that if the energy efficiency has been at a high level, then even though a sufficiently large investment cannot lead to a remarkable improvement. We claim that the logistic form setting for improved energy efficiency can well capture these characteristics. One can see this from the marginal change of
with respect to the loaning scale
It is easy to see that
and
as
, meaning the existence of chokepoint with a sufficiently large capital input in the innovation project. A similar setting for energy efficiency of an energy-intensive enterprise depending on investment can refer to Wang et al. [
45]. We emphasize that the improved energy efficiency will play a key role in the decision on the green loaning scales.
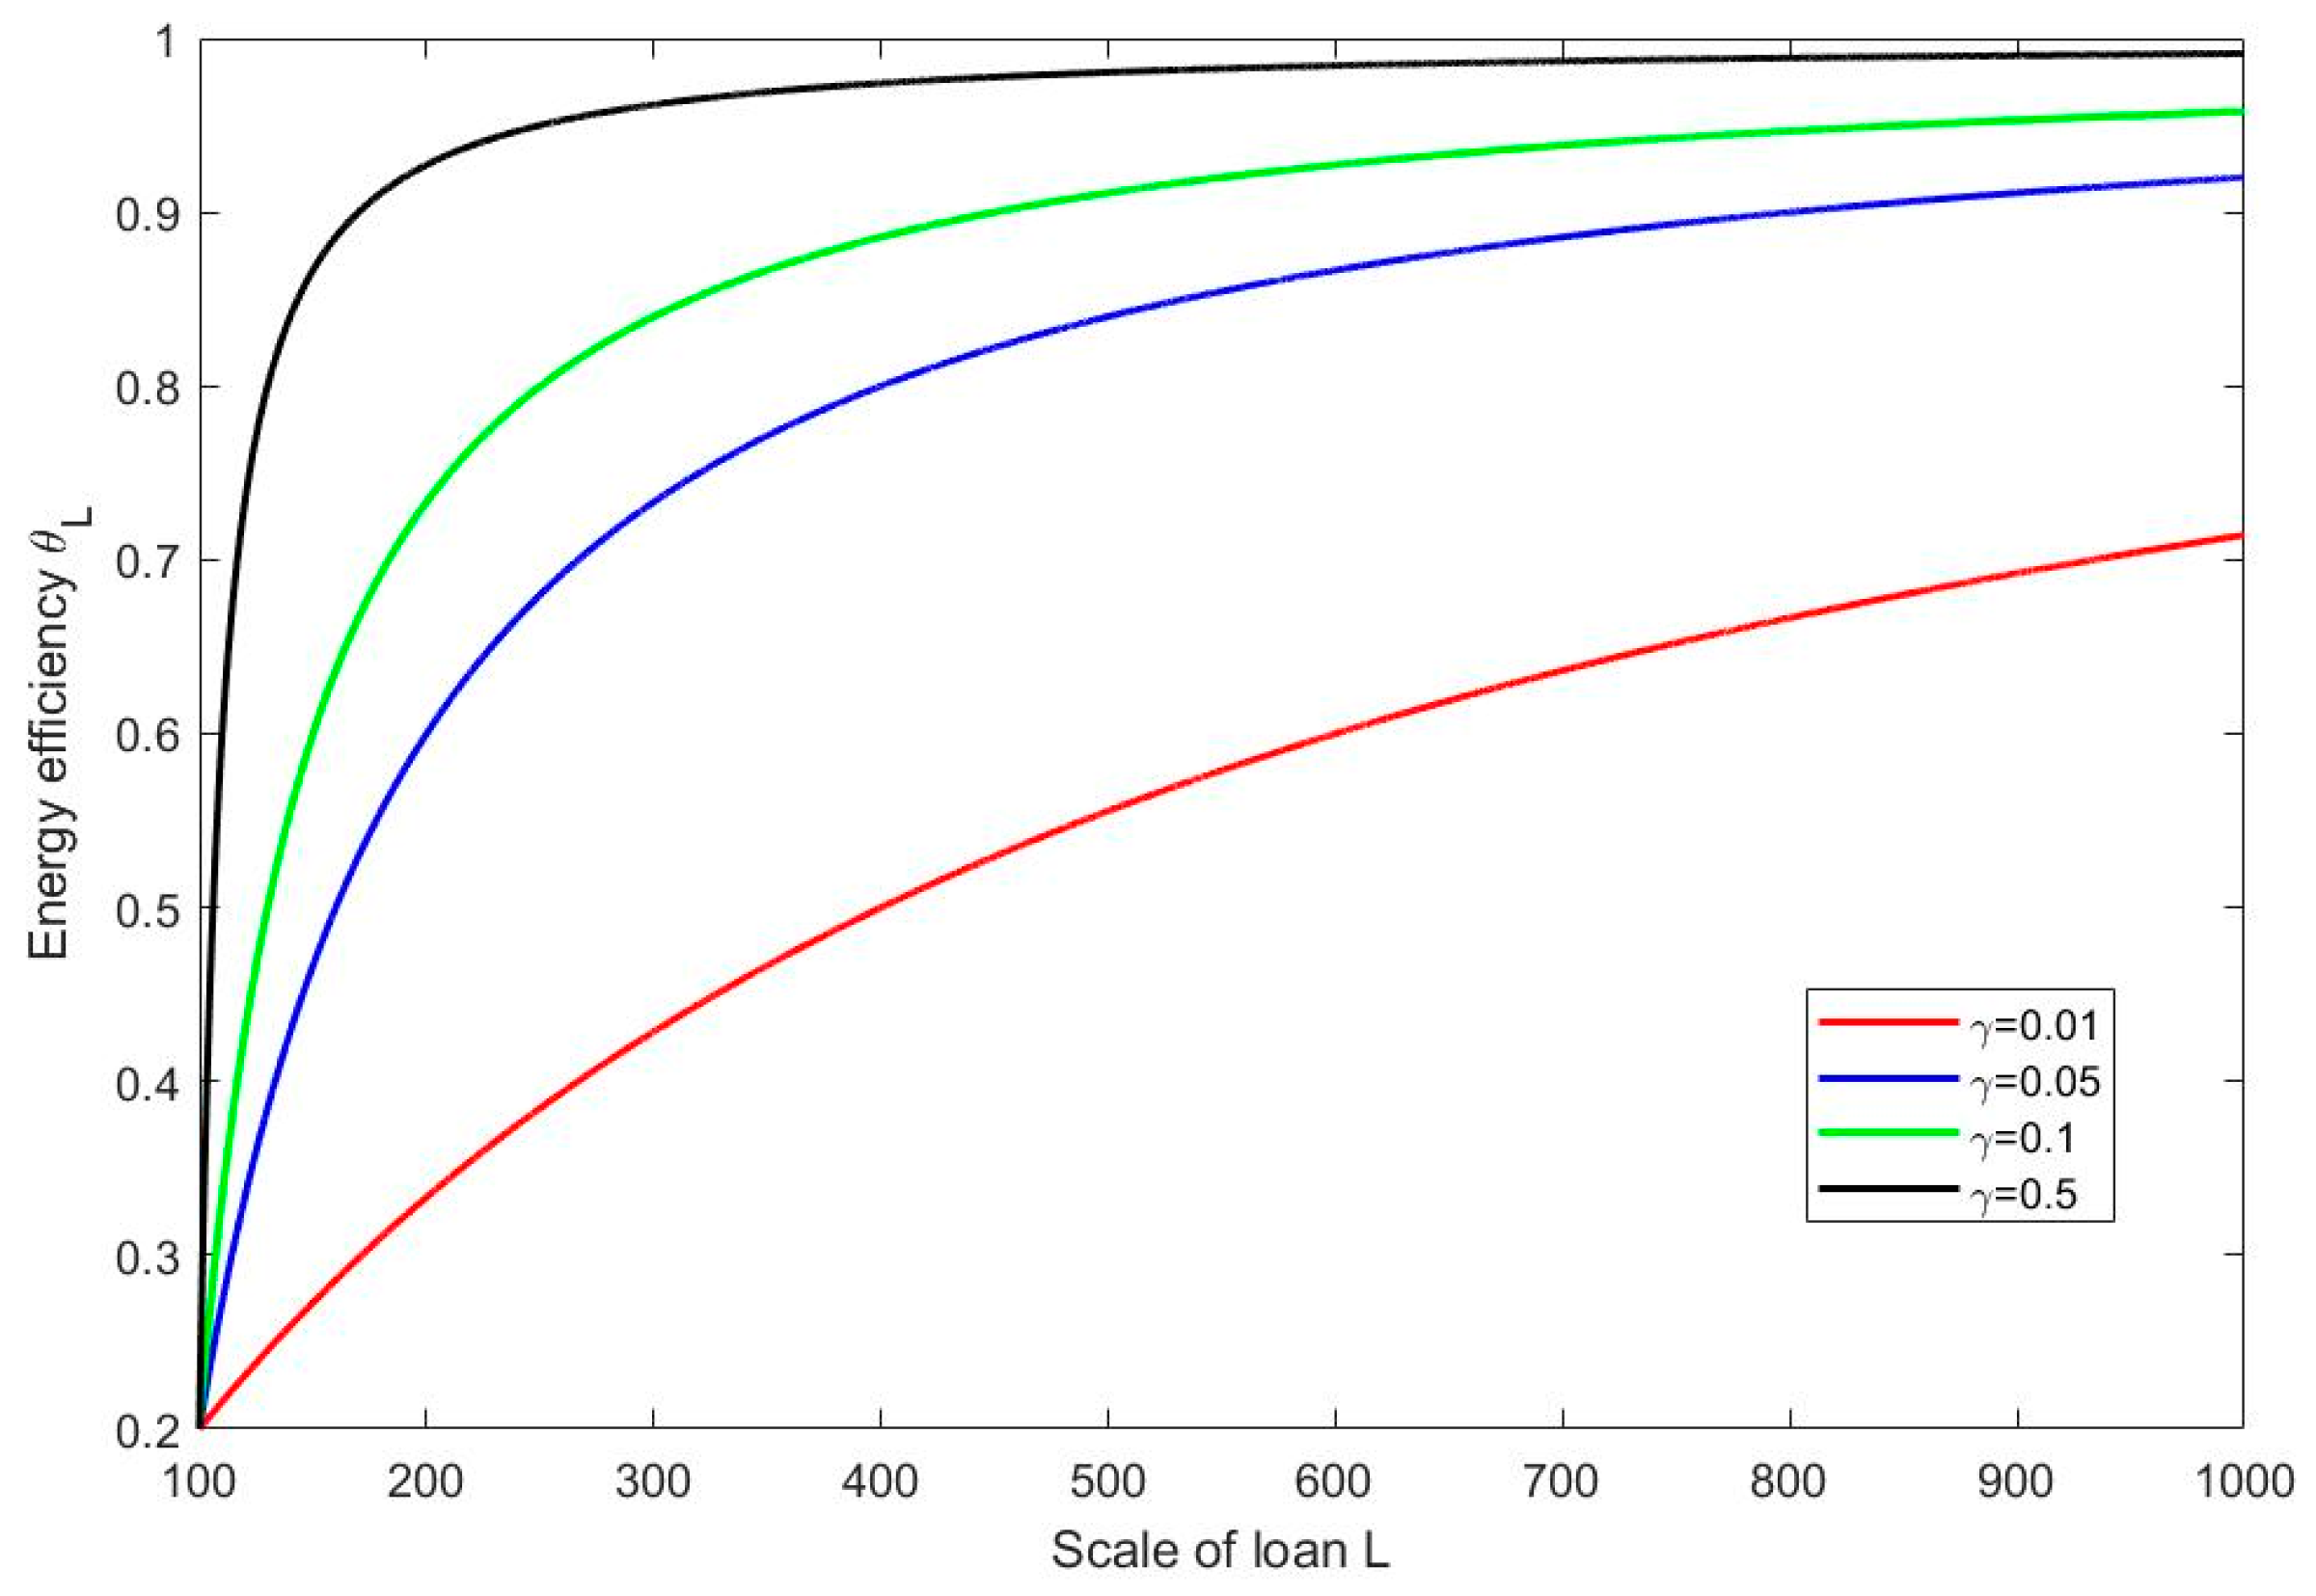
Figure 2 shows the shapes of the energy efficiency
depending on the loaning scale
with different values of the technical maturity
. The threshold of initial capital input
is set to be
and the initial energy efficiency
is set to be
. From the figure, we can see that for the same loaning scale, enterprise with high technical maturity can achieve a better result of technical innovation than an enterprise with low technical maturity. For instance, we suppose that the capital input for technical innovation is given as
. When the technical maturity
, then
. When
, then
.
Remark 1. The setting of the improved energy efficiency (2) is motivated by the logistic form, but where the exponential part in the logistic form is substituted by a linear part . The improved energy efficiency should be increasing and concave with respect to the loaning scale, which implies the choke point of technical promotion. The logistic form can satisfy these characteristics. Then a problem may arise, asking why we give up the use of the exponential part in the logistic form, because, with the linear part, some explicit formulas of the important quantities including the lending interest rate, green loaning scales, and government subsidy scales in the technical innovation process can be derived, which can be seen in the following sections. However, with the exponent part, we fail to solve the explicit formulas. In general, explicit solutions are usually preferred in some practical settings and engineering problems, since an explicit formula can show clear relations between objective variables and model parameters. Then it is conducive to understand the marginal changes of the objective variables with respect to the model parameters and put forward some effective control strategies for decision-makers. Meanwhile, we claim that the substitute of the exponent part by the linear part in the logistic form will not bring essential influence. It will not cause any additional trouble in the robust of the model. In addition, the parameter in (2), meaning the technical maturity, is considered in the abstract. One can refer to Accenture [52] for a suitable definition tailored to innovation. Technical innovation is an effective approach to reduce energy emission and improve environmental quality. The enterprise is encouraged to implement technical innovation with green loans. However, the enterprise pursues profit and focuses on whether technical innovation could bring higher profit. Thus, to stimulate the technical innovation project, we need to consider the profit function of the enterprise. Denote
the unit price of the final product in the production. Then according to Huang et al. [
33], the enterprise can earn a return as
Since we focus our attention on the energy input and fix other inputs, the cost function in the production is supposed to depend only on the energy input. Apparently, the cost is proportional to the input, namely that the larger input leads to a higher cost. Meanwhile, as the input increases, the marginal cost with respect to the input increases as well. Thus, the cost function should be increasing and convex with respect to the energy input. Accordingly, a quadratic polynomial is selected to capture the shape of the cost function, written as
where
is the fixed cost
is the cost for energy input and
represents the cost incurred by production [
45]. The enterprise needs to consider the profits before and after technical innovation and then make a decision on the innovation project. If the enterprise carries out conventional production, it will get a profit
If the enterprise decides to implement the technical innovation by applying for a green loan from the bank, then the energy efficiency is improved from
to
with the capital support. Meanwhile, the enterprise pays the loaning interest to the bank. Thus, through technical innovation, the enterprise will get a profit
where
is the green lending interest rate. The improvement of energy efficiency can stimulate energy input and bring a higher return to the enterprise. Meanwhile, more energy input, as well as the lending interest, leads to higher cost of the enterprise. This implies that technical innovation does not always bring a higher profit. The increase in profit depends heavily on the loaning scale. We believe that there should exist some loaning scales such that the profit with conventional production equals the profit with innovation, namely that
. These significant scales, which mean a zero profit through technical innovation, are thought of as boundaries separating two cases
and
. The case
, meaning a less profit through technical innovation, may happen due to two reasons. One is the initial investment, namely that the acquisition cost. The increased return of the enterprise through technical innovation cannot cover the initial acquisition cost. The other is lending interest. The enterprise has to assume a large interest for a large loaning scale or a not enough low-interest rate. Thus, to stimulate the enterprise to implement technical innovation, the appropriate loaning scales, leading to an increased profit
, should be focused on.
For environmental protection and sustainable development, the government stimulates green innovation through effective approaches. The government subsidy for green innovation projects is considered in this paper. It has been proved by [
33] that the government subsidy is an effective approach to stimulate green innovation, but there is no information on the subsidy scales. The problem on the government subsidy scales will be addressed in the following argument. With the objective to stimulate green innovation and green production, two kinds of government subsidy are involved in this paper, subsidy for the enterprise and subsidy for the bank. The enterprise needs financial support if it carries out technical innovation to improve energy efficiency. The bank provides capital for the green innovation project by issuing green loans with low-interest rates. To encourage the bank issuing green loan with a low-interest rate, the government provides subsidies for the bank. The enterprise expects a higher profit through technical innovation. However, as explained in the last paragraph, technical innovation cannot guarantee a higher profit. The enterprise might lose the confidence to implement innovation. Thus, to stimulate green innovation and improve environmental quality, the government subsidizes the enterprise if it decides to improve energy efficiency through technological innovation. Furthermore, the subsidy for the enterprise is divided into two parts, subsidies before and after technical innovation. Denote the subsidy scale for the bank by
. If the bank issues the green loan for the green innovation project, then the government provides the subsidy with the scale
for the bank. On the other hand, denote the subsidy scales for the enterprise before the technical innovation and after the technical innovation by
and
respectively. Recall the profit function (4), the profit of the enterprise with government subsidy before implementing the technical innovation is written as
If the enterprise received the government subsidy before the technical innovation, the subsidy is involved in the investment of the innovation project, which leads to a further improvement of energy efficiency. The profit of the enterprise with government subsidy after implementing technical innovation is written as
The subsidy is added to the profit of the enterprise directly. Apparently, both these two ways of government subsidy will increase the profit of the enterprise. However, with the same subsidy scales, it is difficult to determine which way of subsidy will lead to a higher profit for the enterprise. It might depend on each model parameter, as well as the loaning scale and interest rate. If necessary, these two ways of government subsidy can be provided together to stimulate the green innovation project of the enterprise.
With the objective to stimulate green innovation and implement green production, basing on the models constructed above, in this paper, we consider three problems. Firstly, what loaning scale can lead to a higher profit of the enterprise. The enterprise improves energy efficiency through technical innovation, which results in a higher return. However, the enterprise should notice the lending interest results in a higher cost. The enterprise is willing to implement technical innovation as long as it can get a higher profit. From (4), we can see that the profit function of the enterprise depends heavily on the scale of the capital input. Secondly, what loaning scale can realize the green effect of the innovation. Although technical innovation can improve the energy efficiency of the enterprise, it will cause an increase in energy input and then an increase in energy emission. Thus, technical innovation may not show a green effect. We believe that there should be an appropriate loaning scale leading to green innovation. Thirdly, what government subsidy scale can stimulate green innovation. The government implements environmental protection and sustainable development through effective approaches. The government subsidy is an effective approach to stimulate green innovation. The subsequent problem concentrates on the subsidy scales. The government expects to provide subsidies with appropriate scales.
3. Interest Rate and Green Loan Scale
Green innovation needs financial support. The bank provides green loans for the enterprise to implement technical innovation. According to the baseline models constructed in
Section 2, the technical innovation depends heavily on the loaning scale, as well as the lending interest rate. In this section, with the objective to stimulate the green innovation project, we explore problems on the green loaning scales and the lending interest rate. For instance, the enterprise would like to achieve an increase in profit through technical innovation. The bank issues green loans to support green innovation. The green effect of the innovation project lies on the loaning scale. Meanwhile, the lending interest rate is also an important factor in stimulating green innovation. In general, green loan admits a low-interest rate. Some threshold of the lending interest rate is derived in this section.
3.1. Conventional Production Mode
We first consider the conventional production mode of the enterprise, regarded as the benchmark in the decision on the technical innovation project, as well as the loaning scale. According to the profit function in conventional production mode (3), the enterprise maximizes the derivative of profit as the marginal profit with respect to the energy input equals to zero, namely that
from which we can solve the optimal energy input as
Since
is the unit energy price, in practice, it should be much lower than the price of the final product
. In addition, the production efficiency satisfies
. Hence, the optimal energy input is indeed larger than zero, which is consistent with the practice and acknowledged in the following argument. With this optimal scale of energy input, the maximum profit of the enterprise is given as
In conventional production, the effect made by the enterprise on the environment is given as
The profit is proportional to the square of the energy efficiency. Higher energy efficiency leads to a higher profit of the enterprise. The environmental effect through technical innovation is concave with respect to energy efficiency. It is easy to see that the enterprise makes the most negative effect on the environment when energy efficiency satisfies .
3.2. Green Innovation with Green Loan
The enterprise pursues a higher profit. The motivation driving the enterprise to apply for a loan and implement technical innovation is the increase in profit after implementing the innovation. The profit function through technical innovation (4) depends heavily on the loaning scale, as well as the lending interest rate. In this section, we derive some specific loaning scales, which play important roles in stimulating green innovation.
This is a two-stage process. In the first stage, the enterprise applies for a loan from the bank with scale . The loaning scale might be zero, which means the veto of the application. In the case of a zero loaning scale, the enterprise performs conventional production. In the second stage, the enterprise carries out green innovation and green production and then achieves the profit captured by (4). The process is addressed by a backward induction strategy.
In the second stage, given the loaning scale, the enterprise selects the optimal energy input to maximize its profit. The optimal energy input satisfies the first-order condition
which can be solved as
With this input scale, the maximum profit is given as
In the first stage, the decision-makers of the enterprise make a decision to apply for a loan with an expected scale. The expected loaning scale should guarantee an increase in profit, namely that
. Comparing the difference between
and
, one can get
where
,
,
and
satisfy
and
respectively. From (5), it is easy to see that
and
Letting
, one can get
Recalling the formulas of
,
,
and
, (6) is equivalent to
where
and
One can solve a threshold of the lending interest rate as
where
Figure 3 presents the tendency of the profit gap
with respect to the loaning scale
, where the initial energy efficiency
, the production efficiency
, the unit price of the final product
, the unit price of energy input
, the cost coefficient
, the initial capital input
, the technical maturity
. Accordingly, the polynomial
and
are calculated as
and
from which we can solve the threshold of the interest rate as
. If the lending interest rate satisfies
, then the profit gap
is tangent with the zero line at some loaning scale, where the profit gap touches the maximum. Thus, if the lending interest rate satisfies
, then for any loaning scale, it always holds that
, namely that technical innovation cannot bring higher profit for the enterprise than conventional production. If the lending interest rate satisfies
, then from
Figure 2, we can know that there exist two loaning scales, whose formulas are given as
where
If the loaning scale satisfies , then it holds that , which means that the enterprise can achieve an increase in profit through technical innovation. Otherwise, it holds that . The technical innovation cannot increase the profit of the enterprise. We set the values of the model parameters as above, namely that , , , , , , . Then, we set the lending interest rate . Accordingly, , are calculated as , , namely that if the lending interest rate is 0.04, then the loaning scale between 2963 and 11,277 can stimulate the enterprise to implement technical innovation. By summarizing the above quantitative analysis, we have the following proposition.
Proposition 1. If the lending interest rate is smaller than the threshold given in (8), then there exist two specific loaning scales given in (9). If the loaning scale received by the enterprise from the bank is between these two loaning scales given in (9), then the enterprise can achieve an increase in the profit through technical innovation. Thus, the green innovation project can be stimulated. Otherwise, if the loaning scale received by the enterprise is outside of the range between the two loaning scales given in (9), the enterprise fails to achieve an increase of the profit through technical innovation. If the lending interest rate is larger than the threshold given in (8), then the enterprise fails to achieve an increase of the profit through technical innovation with any loaning scale.
Firstly, the incentive for green innovation depends on the lending interest rate. In general, the current funding level of the enterprise cannot well support the technical innovation project. Hence, the enterprise has to apply for a loan from the bank. Since pursuing profit is always the objective of the enterprise, a high lending interest rate might increase the cost of innovation such that the enterprise fails to achieve an increase in profit. Thus, the high lending interest rate goes against the incentive of green innovation. An appropriate lending interest rate should be focused on. Proposition 1 provides a threshold of the lending interest rate as a benchmark. The lending interest rate for the enterprise should be lower than the given threshold such that the green innovation will be stimulated. If the lending interest rate is higher than the threshold, the enterprise has to pay an overlarge cost of innovation such that it is impossible to get a higher profit than the conventional production.
Secondly, supposing that the lending interest rate for the enterprise is lower than the threshold in Proposition 1, the incentive of green innovation also depends on the loaning scale. Proposition 1indicates that even though the lending interest rate is lower than the given threshold, the enterprise still cannot guarantee a higher profit through green innovation. Furthermore, it is determined by the loaning scale. From Proposition 1, if the loaning scale received by the enterprise is between the two given specific scales, the enterprise can return a higher profit than conventional production through green innovation. Otherwise, it fails to increase profit. Therefore, an appropriate loaning scale should be focused on as well when stimulating green innovation. Both the appropriate lending interest rate and appropriate loaning scale will succeed to stimulate the green innovation.
3.3. Green Loan Improving Environmental Effect
The objective of the green loan is to improve the environmental effect of some production and innovation activities. It should play an important role in supporting green projects. In this paper, the bank provides capital for the enterprise to carry out the green innovation project and improve energy efficiency by issuing green loans. The improvement of energy efficiency will reduce energy emission and improve environmental quality. Meanwhile, the improvement of energy efficiency will lead to larger energy input. As a result of larger energy emission, it is adverse to the environment. According to the measure of environmental effect (1), the loaning scale plays a key role in controlling the energy emission. Hence, an appropriate loaning scale in stimulating green innovation not only increases the profit of the enterprise but also improves the environmental quality. In this section, we focus on the green loaning scale. The environmental effect made by the enterprise which implements green innovation with a loaning scale
is measured by
for
and
for
. With the objective to improve the environmental effect of the enterprise, an appropriate green loaning scale should guarantee the relation
. Comparing the difference between
and
gives
where
If the original energy efficiency satisfies
, then we can solve a loaning scale by letting
, whose formula is given as
In this case, if the loaning scale satisfies
, then the environmental effect satisfies
. If the loaning scale satisfies
, then the environmental effect satisfies
. On the other hand, if the original energy efficiency satisfies
, then it is easy to understand that any loaning scale larger than the initial capital input
can guarantee the relation
.
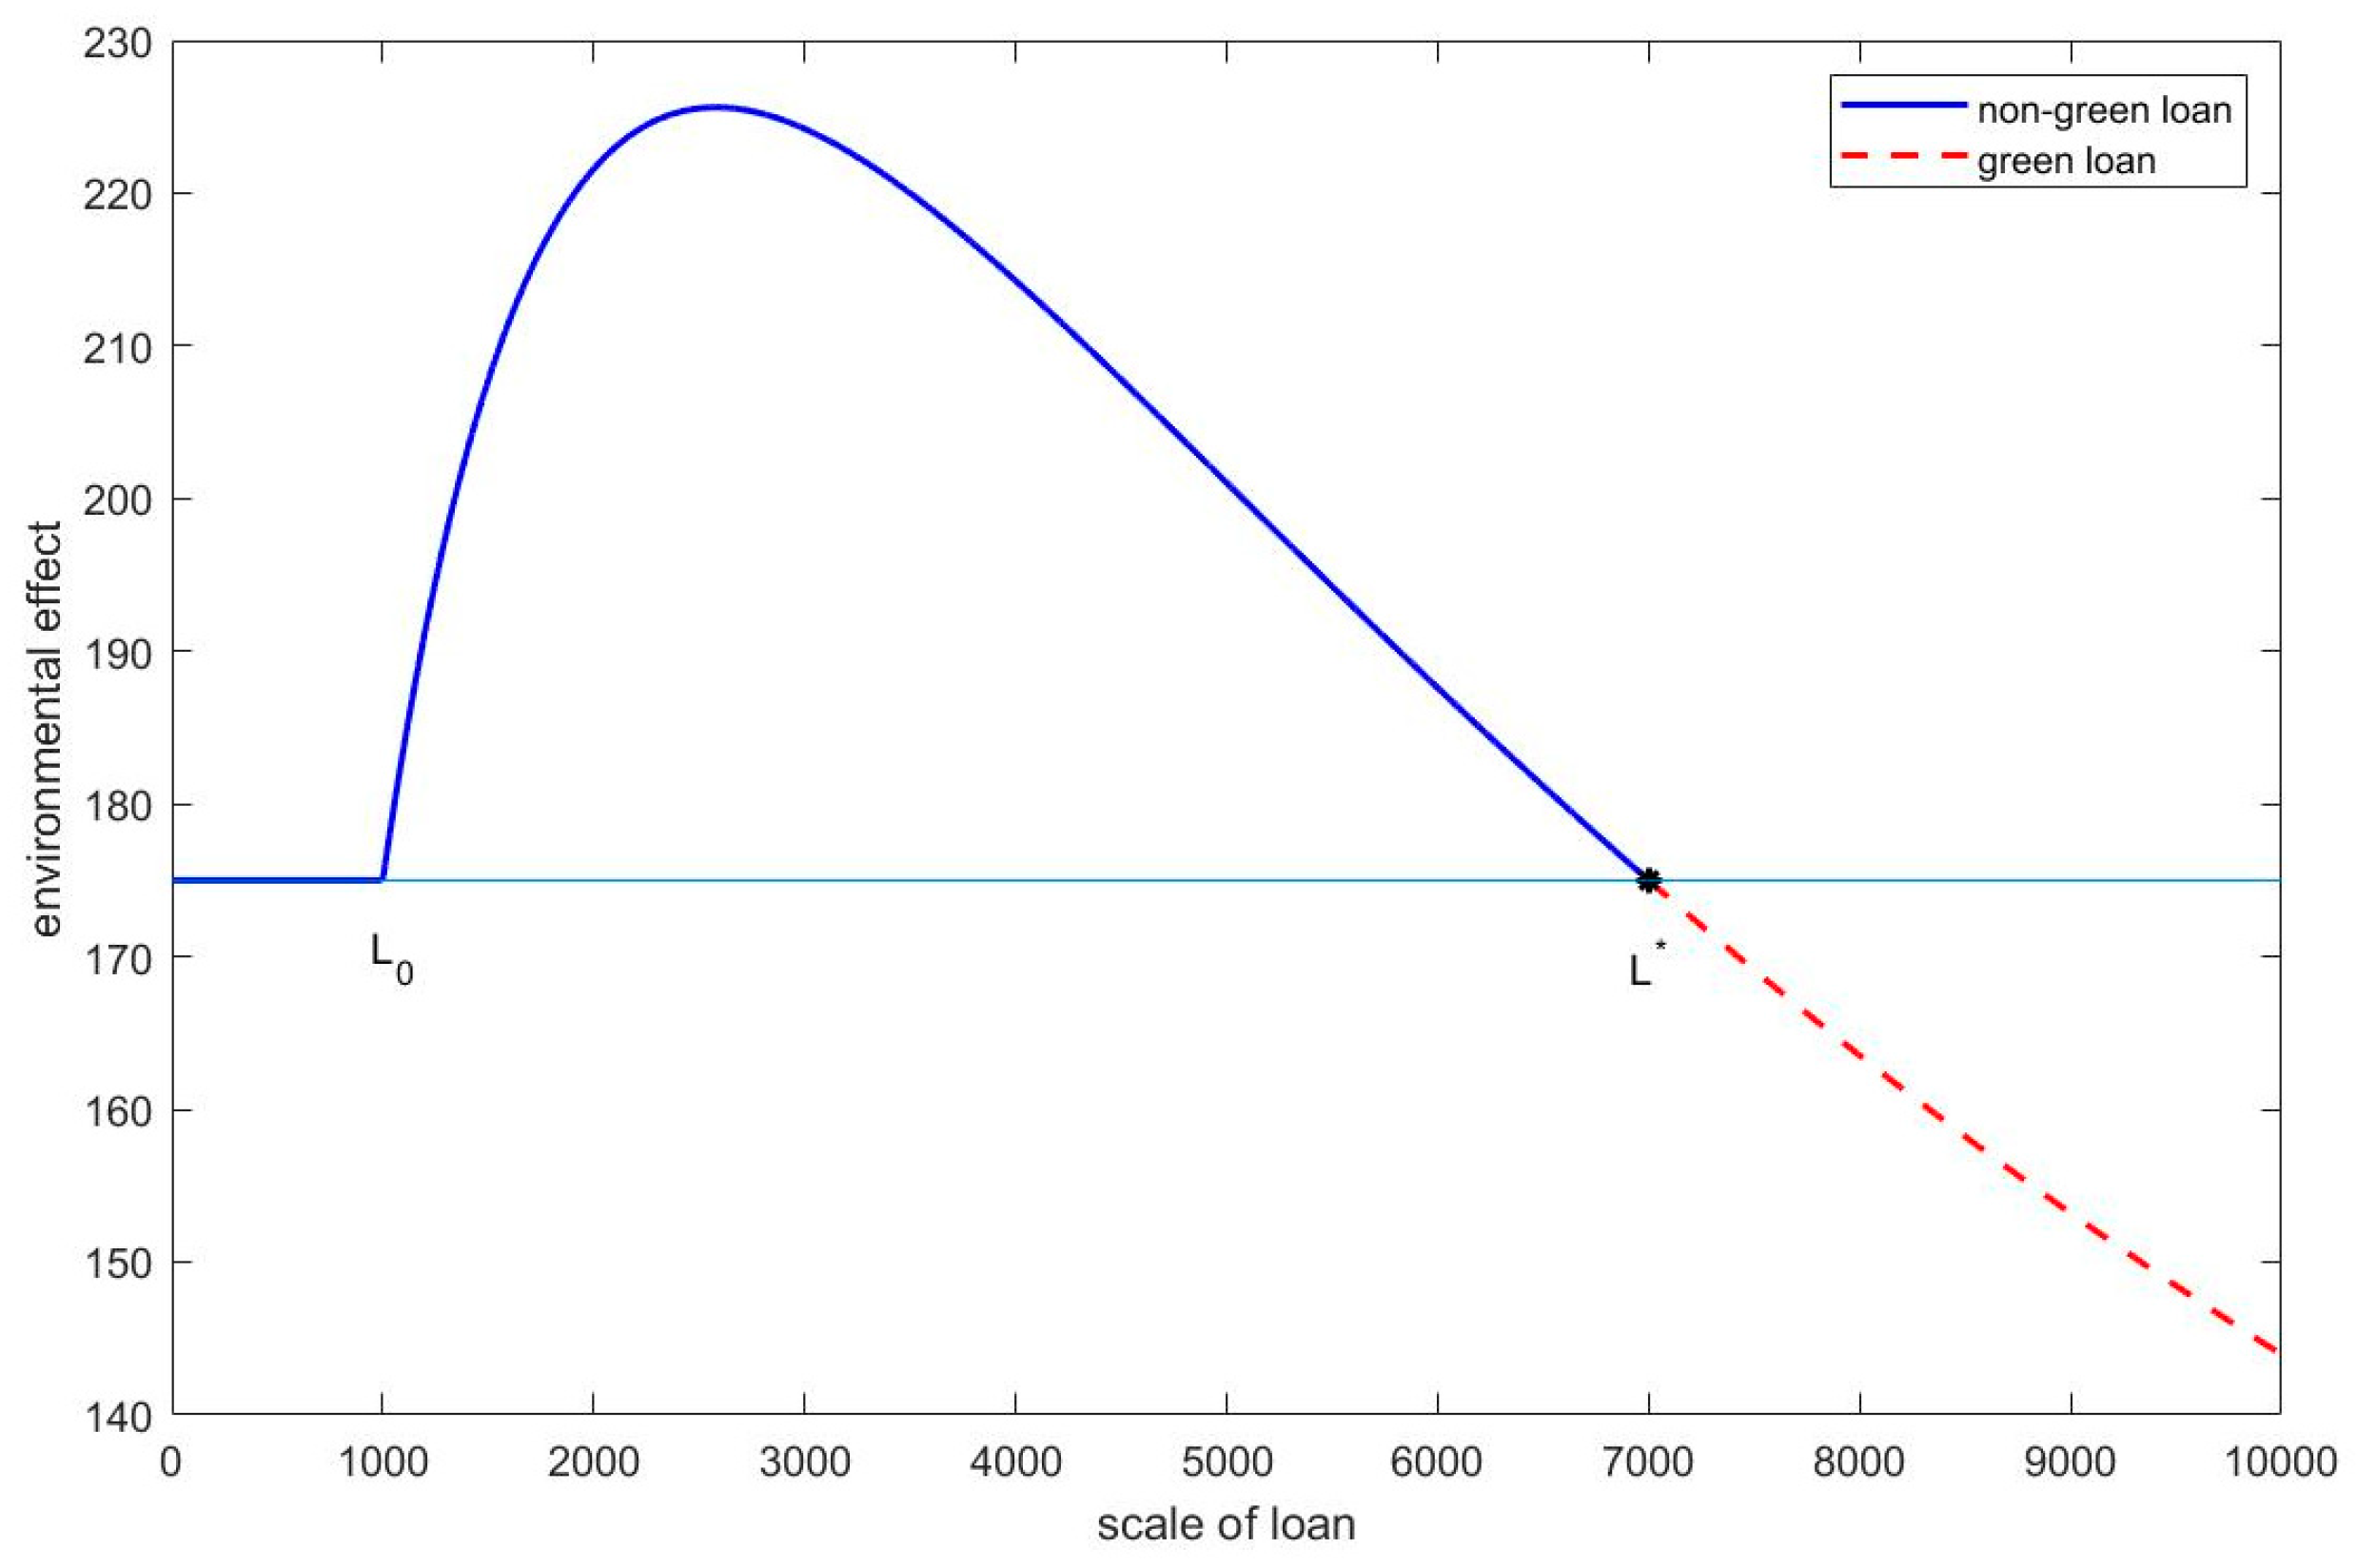
Figure 4 and
Figure 5 show the tendency of the environmental effect
depending on the loaning scale
. The model parameters are set to be
,
,
,
,
,
. Thus,
. In
Figure 4, the original energy efficiency is set to be
. Then the threshold of loaning scale
exists, satisfying
. We can see that for
, it holds that
, the red part of the line in
Figure 3. In
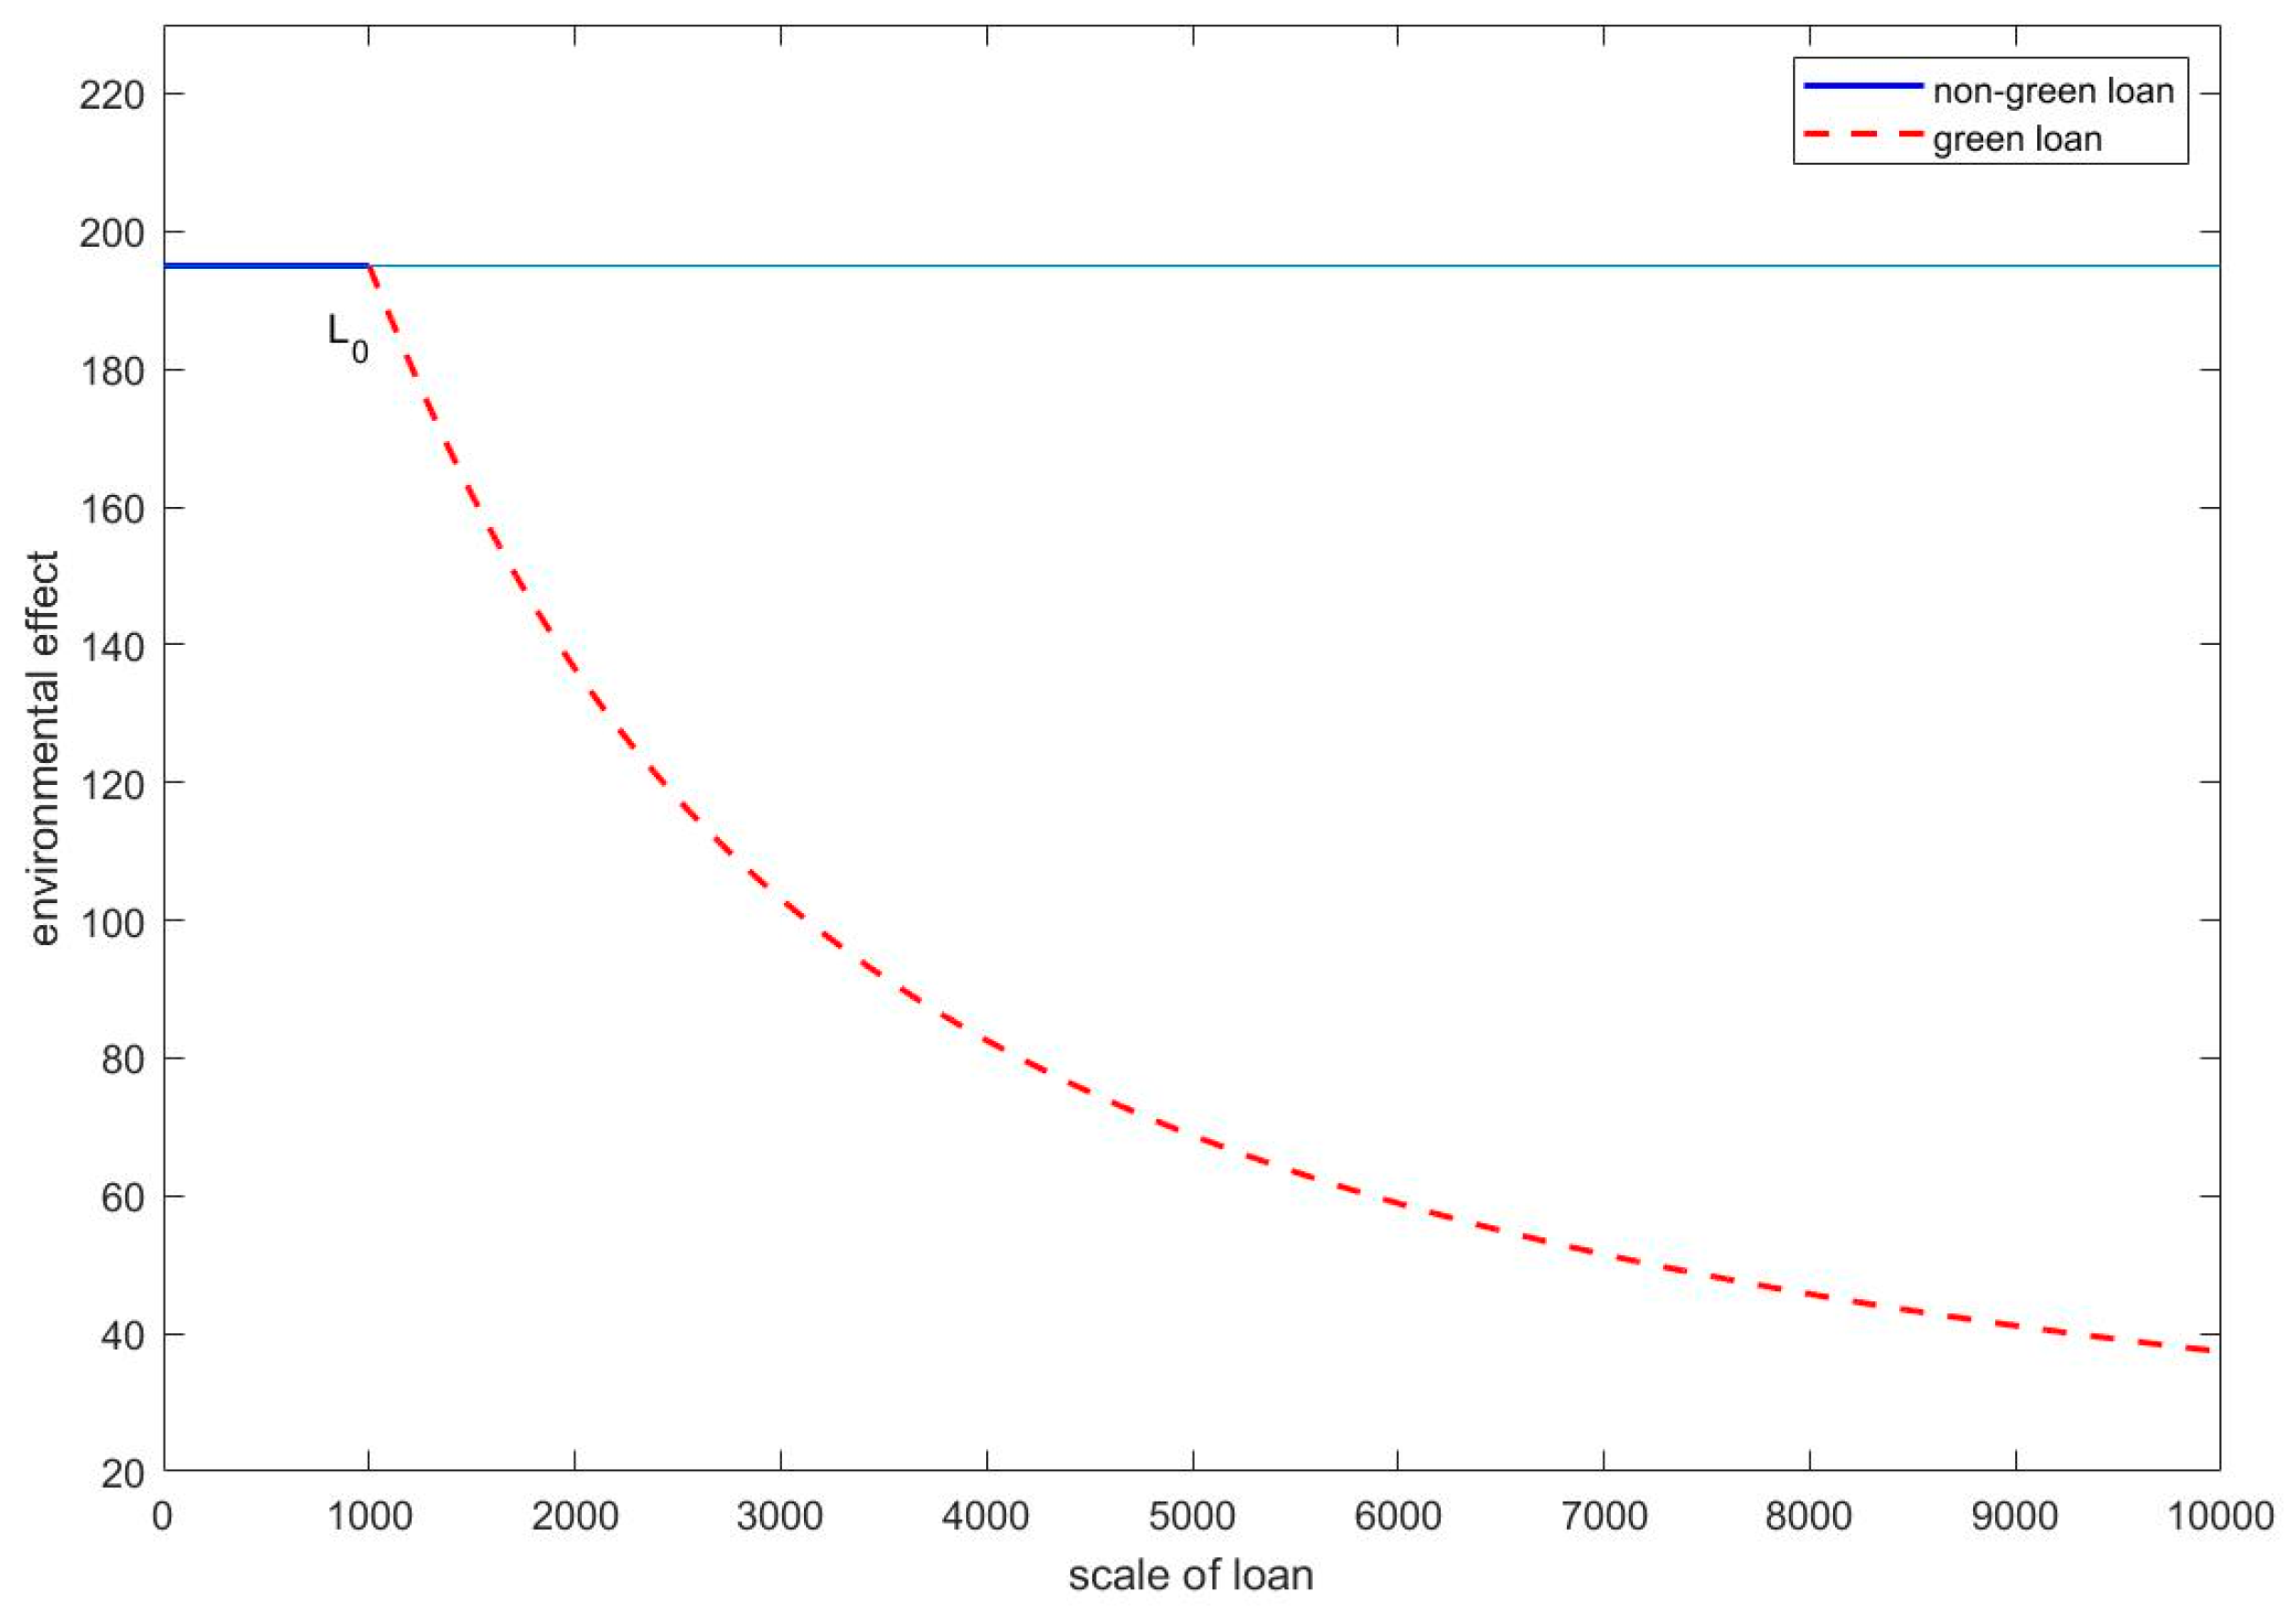
Figure 5, the original energy efficiency is set to be
. Thus, any loaning scale larger than
will lead to
. Summarizing the above quantitative analysis, we have the following proposition.
Proposition 2. If the original energy efficiency is lower than the specific value , then there exists a threshold of the loaning scale given in (10). If the loaning scale received by the enterprise is larger than this threshold, then the energy emission can be reduced through the green innovation and the environmental effect made by the enterprise is improved. If the loaning scale is smaller than the threshold, then more energy emission comes into being due to the technical innovation and the environmental effect made by the enterprise becomes worse than conventional production. If the original energy efficiency is higher than the specific value , then besides the initial acquisition cost of equipment, with any loaning scale for the green innovation, the environmental effect made by the enterprise can be improved.
The enterprise with a lower original energy efficiency needs a larger loaning scale to improve the environmental effect through green innovation. On the contrary, if the enterprise admits a high original energy efficiency, then a small loaning scale can improve the environmental effect. Firstly, Proposition 2 indicates that if the original energy efficiency of the enterprise is larger than some specific value, then any loaning scale larger than the initial capital input can improve the environmental effect of the enterprise. Otherwise, some appropriate loaning scale should be needed to show the green effect. Secondly, Proposition 2 presents a threshold of the green loaning scale, following the case where the original energy efficiency of the enterprise is smaller than the given specific value. If the loaning scale received by the enterprise is larger than the threshold given in Proposition 2, then the technical innovation project can show the green effect on the environment. Otherwise, the technical innovation fails to be a green project.
Associating the results in Proposition 1 with Proposition 2, some suggestions on the green loaning scale stimulating the enterprise to implement green innovation are summarized as follows.
Firstly, if the original energy efficiency of the enterprise is smaller than the specific value , and in addition, the threshold scale given in (10) lies between the scales and given in (9), then a loaning scale larger than the threshold but smaller than the upper scale is appropriate. Thus, the scale between scale and not only increases the profit of the enterprise but also improves the environmental quality.
Secondly, if the original energy efficiency of the enterprise is higher than the specific value , then any loaning scale between the scales and given in (9) is appropriate. Moreover, from the viewpoint of green production, a loaning scale between and but close to is more preferred, since it will result in better environmental effect.
Thirdly, if the original energy efficiency of the enterprise is lower than the specific value and the threshold scale given in (10) is lower than the scale given in (9), then a scale of loan close to the scale is more preferred as well.
Fourthly, if the original energy efficiency of the enterprise is lower than the specific value and the threshold scale given in (10) is higher than the scale given in (9), then there does not exist an appropriate loaning scale to improve the environmental effect of the enterprise. In this case, the government subsidy should play an important role, which will be discussed in the following section.
5. Conclusions
In this paper, three participants, the enterprise, the bank, and the government, are involved in the green innovation decision. The enterprise, which is supposed to be a profit seeker, plays a principal role. This is different from most existing literature, where the role of the enterprise is subordinate. In our setting, the energy-intensive enterprise would like to increase the profit through technical innovation, improving energy efficiency. The technical innovation is beneficial to the environment and hence, is green. The financing way is applying for loans from the bank. The bank evaluates the application and makes a decision on the approval of the green loans. To stimulate green innovation development, the government provides necessary subsidies for the enterprise or the bank. We recall the objective of the paper looking for appropriate loaning scales, interest rate and subsidy scales in the green innovation performance. The appropriateness means that the innovation activity should be stimulated and the innovation should be green with these financial resources. By constructing series of models according to game theory and taking analysis, we achieve some useful results as follows.
The stimulation of the technical innovation improving energy efficiency is captured by a two-step strategy. In the first step, the innovation stimulation depends on the lending interest rate. In Proposition 1, we present a threshold of the lending interest rate. If the lending interest rate exceeds this threshold, then the enterprise will not implement the green innovation project improving its energy efficiency, since the innovation cost is higher than the return after innovating. Thus, the enterprise cannot increase its profit by technical innovation project and the innovation cannot be stimulated. On the other hand, if the lending interest rate is lower than the threshold, then the green innovation stimulation turns into the second step. In the second step, following that the lending interest rate is lower than the given threshold in the first step, the innovation stimulation depends on the green loaning scale. In Proposition 1, we present two thresholds of loaning scale. If the loaning scale for the innovation project lies between these two threshold scales, then the enterprise can increase its profit by technical innovation and thus the green innovation can be stimulated. Otherwise, green innovation fails to be stimulated. If the loaning scale for the innovation project is lower than the small threshold scale, it means that the capital investment is lacking and the profit increase is not remarkable. If the loaning scale for the innovation project exceeds the large threshold scale, it means that excessive capital investment leads to high pressure of debt repayment, which results in the profit decrease. Summarily, as the enterprise is the principal role in the green innovation activity in this paper, hence, from the viewpoint of the enterprise, if, and only if, the lending interest rate is lower than the given threshold and the loaning scale lies between the two threshold scales, the green innovation can be stimulated.
The green effects of technical innovation also depend on the loaning scale. Green innovation and green loans should show their green effects on the environment. The improvement of energy efficiency through technical innovation might lead to more energy input, which results in more energy emission into the environment. Thus, the innovation might lose its green effect. In this paper, to prevent this event, we have the following consequence, according to Proposition 2. If the original energy efficiency is larger than some specific value related to unit prices of energy input and final product, and the production efficiency (see Proposition 2), then any loaning scale for the technical innovation larger than the initial acquisition cost will lead to a reduction of emission from the enterprise. Thus, technical innovation shows a green effect. However, if the original energy efficiency is lower than the specific value, then the green effect of innovation depends on the loaning scale. In Proposition 2, we present another threshold of loaning scale. If the loaning scale for the innovation project exceeds this threshold scale, then the emission from the enterprise will be reduced after technical innovation. The technical innovation and the loan show their green effects on the environment. If the loaning scale for technical innovation is lower than the given threshold scale, then the emission from the enterprise increases after technical innovation. Thus, the technical innovation, as well as the loan, cannot show any green effect. Summarily, an energy-intensive enterprise with lower original energy efficiency needs an adequate investment to improve its energy efficiency and realize the green effect of the innovation. On the contrary, an energy-intensive enterprise with higher original energy efficiency only needs a moderate investment to realize the green innovation. Associating with those two thresholds of loaning scale in Proposition 1, these three thresholds of loaning scale should play important roles in green innovation decisions. They provide valuable references for the enterprise and the bank when making decisions on the application for loans to implement technical innovation or evaluating the innovation loans. Some appropriate loaning scales in the green innovation performance can be determined by taking the analysis of the comparison among these three threshold scales (see the analysis behind Proposition 2). We have to emphasize that there exists a special case, that the threshold scale in Proposition 2 might be larger than the large threshold scale in Proposition 1. This leads to a result that there does not exist any appropriate loaning scale in the green innovation decision. To fit this case, government subsidy is introduced and shows its effectiveness.
Government subsidy is an effective approach to stimulate green innovation. The effectiveness is embodied through the subsidy scales. Three forms of government subsidy are considered in the paper, including a subsidy for the bank issuing green loans, subsidy for the enterprise before green innovation, and subsidy for the enterprise after green innovation. In general, green loans are accompanied by low-interest rates. The government compensates for the possible potential loss for the bank due to the issue of green loans with a low-interest rate. In this paper, the subsidy scale for the bank from the government is determined according to Proposition 3. It is the difference between the lending interest with the threshold rate and the practical interest of the enterprise. For the enterprise, the subsidy strategy is a little complicated, since it is dependent on the relations among the three thresholds of loaning scale in Propositions 1 and 2. If the government subsidizes the enterprise before implementing innovation projects, the subsidy will be invested in the innovation project such that the enterprise has more initial capital. Differently, if the government subsidizes the enterprise after implementing innovation project, the subsidy is a pure addition to the profit of the enterprise. The government subsidy strategy is summarized in Proposition 4. We conclude that the subsidy strategy is a branching tree pattern. The first branching depends on the original energy efficiency of the enterprise and the second branching depends on the loaning scale. The government subsidy strategy can provide policymakers with some auxiliary suggestions on the subsidy ways and subsidy scales. According to our government subsidy strategy, the government can provide appropriate loaning scales for the bank and the enterprise through appropriate ways to stimulate green innovation.
In this paper, we focus on appropriate loaning scales and interest rates, as well as appropriate government subsidy scales in green innovation development. Some explicit formulas of loaning scales and interest rates, government subsidy scales are derived, which may provide some valuable references and suggestions for the green innovation stimulation and performance. We achieve these results through constructing game models according to game theory. The enterprise is the principal participant in the game, who is supposed to be completely profit-driven. Hence, the utility function is governed by profit. In general, green innovation is accompanied by high risk. The effect of green innovation shows uncertainty. Thus, when making a decision on the green innovation project, the enterprise should consider the innovation risk. The utility function is governed not only by the profit but also by the innovation risk. Both the bank and the government should also care for the risk when stimulating green innovation. We believe that this uncertainty will affect the green loaning scales and interest rate, and the government subsidy scales, which can be embodied by the explicit formulas in our models. The innovation risk will be focused in our forthcoming work. Meanwhile, some empirical results will be involved.


