Article

Lead-Acid Battery Sizing for a DC Auxiliary System in a Substation by the Optimization Method

1
Department of Electrical Engineering, University of Maribor, Faculty of Electrical Engineering and Computer Science, 2000 Maribor, Slovenia
2
Electric Transmission Power Operator, ELES, 1000 Ljubljana, Slovenia
3
Faculty of Mechanical Engineering, Department of Power, Process and Environmental Engineering, University of Maribor, 2000 Maribor, Slovenia
*
Author to whom correspondence should be addressed.
Energies 2019, 12(22), 4400; https://doi.org/10.3390/en12224400
Submission received: 18 October 2019 / Revised: 11 November 2019 / Accepted: 18 November 2019 / Published: 19 November 2019

Abstract

:
Lead-acid batteries are the most frequently used energy storage facilities for the provision of a backup supply of DC auxiliary systems in substations and power plants due to their long service life and high reliability. It is possible to define the load in these systems, therefore the IEEE 485 Standard can be used for the selection of batteries according to the conventional method of selection. Special attention is paid in the paper to the technical selection of a lead-acid battery, which depends on its operational reliability that decreases with battery aging. It is defined by the extent of maintenance during its service life. A cost analysis was also carried out, which took into consideration maintenance and procurement costs, as well as the costs of the related air conditioning that keeps the prescribed temperature and ventilates the battery room. The impact is shown of selecting a lead-acid battery on the battery room’s operating safety when charging. The final selection of lead-acid battery is performed using an optimization algorithm of differential evolution. Using the optimization process, the new battery selection method includes the technical sizing criteria of the lead-acid battery, reliability of operation with maintenance, operational safety, and cost analysis. Two cases of selection of lead-acid batteries for the backup supply of a DC auxiliary system in a transmission substation are presented in the paper, where the input data were determined based on measurements in an existing substation. A comparison is made between the existing conventional and new lead-acid battery selection method based on optimization.

1. Introduction

Batteries represent a part of our everyday life. They are found everywhere, from electronic devices to cars. In electric power systems, they are used as energy storage facilities in conventional and smart distribution systems, transmission systems, as well as for manual frequency Rrestoration reserves (mFRR) and backup supply of auxiliary networks in substations [1]. The most frequently used batteries are lead-acid ones nowadays, although Li-ion and other types of batteries are being used increasingly. The technology for producing a lead-acid battery (LAB) is well known and mature, and these batteries have a long service life (SL). The manufacturing costs are much lower than those for manufacturing Li-ion batteries. Li-ion batteries have the capability of storing high energy density and do not require much maintenance. LABs are used in applications that are limited by costs, such as smart grids that are not connected to the power system. A LAB is composed of a certain number of lead-acid cells connected in series. The selection of LABs used for energy storage applications in isolated microgrids is dealt with in [2,3,4]. The load is random in these applications. The selection is performed by optimization methods for harmonization of dynamic voltage characteristics with the load. A net present value (NPV) cost analysis was performed in [2]. A mathematical model of an LAB is used based on [5]. The selection of LABs for high-capacity energy storage applications is also performed using iteration methods, using the existing battery models in the NETOMAC [6] program tool. LABs are used mostly in battery storage applications, such as a DC auxiliary system supply in substations, nuclear power plants, and uninterruptible power supply (UPS) systems [7]. The load is known in these applications. This means that the batteries can be selected using the procedure defined in the IEEE 485 Standard [8]. The paper focuses only on the DC system for supplying the auxiliary system in a substation. This is the most important part of a substation. It supplies the substation’s protection and control systems. The requirements for operation of a DC auxiliary system are covered by the Standard [9]. In normal operation, this system is supplied from the power grid through a battery charging system (rectifier). The DC auxiliary system should be supplied without interruption from the LAB in the case of a rectifier’s outage. For a certain period of time, it should provide supply to the entire DC auxiliary system load. The most important parameter for the reliable operation of a LAB is the State of Health (SOH) factor for the entire SL of the battery. This factor describes the ability of the battery to perform charging and discharging during its SL, and shows the degradation processes. It is necessary to determine this factor [10,11]. The possibilities have been analyzed for determination of the SOH factor for LABs in a substation and its impact on their reliability [12]. An important factor of an LAB’s operational reliability is also the temperature of the electrolyte. It has an impact on the thermal dynamics of electrochemical processes and on the battery’s capacity [13]. An adequate cost analysis of both investment and operation of the LAB is also an important factor in the selection of LABs [14].
The main purpose of this paper is to give a presentation and implementation of the new LAB selection method for energy storage applications, especially in DC auxiliary systems, using an optimization method where the load current can be determined. In this process, the technical criteria given by the Standard [9], economic criteria, and reliability operation criteria are taken into account. The selection is performed using an optimization algorithm of differential evolution (DEA) [15,16].
Special attention is paid in this article to the LAB’s operational safety in the battery room (BR). General requirements for this area follow the Standard [17]. Hydrogen, H2, is released due to the electrolysis of water in the electrolyte when charging a LAB [17,18]. Hence, proper BR ventilation is required. The author in [19] discusses the risk of explosion in the BR and safety measures.
The new LAB selection concept by the DE optimization method is designed in the Matlab program tool environment. The data on LABs were supplied by the battery manufacturer. Computation examples were made for a substation of the Slovenian TSO ELES. The article will also introduce the conventional method of selecting LABs. This method will be compared with the new selection method that uses the optimization process. The basic theoretical requirements for the new concept of LAB selection with optimization have been covered from a book [18], articles [19,20,21], and standards [8,17,22,23]. The implementation of DEA in the LAB selection was carried out on the basis of research in [15,16].
The main contributions and innovations in this paper are:
  • Development of an optimization algorithm for the selection of LABs in stationary applications, taking into consideration technical, economic and reliability criteria, safety, and possible methods of battery maintenance;
  • Optimum conditions of battery selection;
  • A selection method that contributes to more reliable and more cost-efficient operation of LABs for the supply of a DC auxiliary system in substations;
  • The selection of LABs impacts on the operational safety in the BR.
Below is a short presentation of the paper’s Sections. Section 2 gives a description of the DC auxiliary system supply in a substation and the role of LABs in it. Section 3 presents a detailed description of the LAB selection concept of the conventional LAB selection method. In this context, the role of the IEEE 485 Standard is explained. The new LAB selection method with optimization is presented in Section 4, together with a detailed description of battery capacity and number of lead-acid cells’ calculation. This section also includes a presentation of costs, determination of reliability and safety in the BR, and the optimization method of DEA with criteria. Section 5 presents the results of the selection process analysis, with the conventional selection method and the selection with optimization of LABs for two cases. Section 6 provides a comparison and analysis between the conventional and new selection method with optimization. This paper concludes with Section 7 which contains the conclusions of the research.

2. The Role of Lead-Acid Batteries in a Substation’s Auxiliary System Supply

The AC auxiliary system loads in a substation are supplied from a three-phase AC 0.4 kV busbar. DC auxiliary system loads are supplied from the UDC = 220 V or UDC = 110 V auxiliary system. Figure 1 presents the concept of the DC auxiliary system. The elements of an essential AC auxiliary system are, in all cases, also the rectifiers that supply the substation’s DC auxiliary system. The rectifiers do not have limited operation time, while the operation time of LABs is limited, although the minimum time is prescribed. Certain loads of the essential AC auxiliary system, such as supply of protection systems, measurement transducers, and switchgear drives, need DC voltage for their operation. A redundant supply of a DC auxiliary system with two rectifiers is used in all cases. The rectifiers are connected to the battery coupling switch panel through fuses (F) on both parallel systems with cables (C) (Figure 1).
The rectifiers have to be sized to such a capacity that enables supplying of the entire DC auxiliary system and DC/AC inverter. In the case of an outage of the main and essential AC auxiliary source, the supply of rectifiers is interrupted. Two separated LABs of sufficient capacities are needed to provide a reliable operation of the DC auxiliary system. Each of them is capable of supplying the DC auxiliary system and inverted loads for a certain period of time. Two LABs are used for this purpose in most substations. Both batteries are charged through the rectifiers during normal operation. For the purpose of battery testing, each battery is equipped with two discharging resistors, Rd,A and Rd,B. Individual parts of the system are protected by fuses. Switching manipulations in the DC auxiliary system network are performed by adequate switching devices (S). In the majority of substations, the DC auxiliary system is also the main supply source of the UPS system (through an inverter). The operation depends on the load and availability of supply sources. In the normal operation, both systems, (A and B), are switched on, and supply all load and charge the LABs. In the case of rectifiers’ outage, the supply is taken over by the LABs.

3. Procedure of the Conventional Lead-Acid Battery Selection Method According to the Standard

The conventional selection method of LABs is based on the IEEE Std-485 Standard [8]. This Standard brings guidelines for the selection of capacity and number of lead-acid cells. It also gives a detailed overview of loads connected to the DC voltage UDC. The loads are categorized into six types with regard to the duration of load using the DC current IDC. A random load with a current IR with the duration of tR = 1 minute can, during the autonomous operation, appear at any time. In substations, such loads are circuit breaker triggering coils [20]. Let us observe the case when the LAB supplies DC load autonomously, as shown in Figure 1. During the entire autonomous operation the various loads are turned on and off. Figure 2 shows a generalized current diagram in the autonomous operation of a LAB [8]. For this purpose, the duration of the autonomous operation of the LAB is divided into ms periods, where new period p + 1 starts every time IDC is changed. At that time, a new cycle s + 1 covers all periods from 1 to the period p + 1, for period 1 is considered to be Ip − 1 = 0. For the cycle (s), the capacity of the LAB is computed using Equation (1).
Q s = p = 1 p = m s ( I p I ( p 1 ) ) K T , p   [ Ah ]
where KT,p [21] is the factor of operational capacity in the period (p) in [h]. It represents the relation between the operational capacity and the current that the lead-acid cell is capable of supplying permanently to the DC circuit in t minutes until it is discharged to the voltage Uc,min. It can be determined graphically from three characteristics for three different ways of a lead-acid cell’s discharging.
The capacity can be computed for all cycles of operation from s = 1 to s = ms. The necessary capacity is for all cycles calculated as the maximum value of individual cycles using (2).
Q = max s = 1 s = m s ( Q s )
The necessary capacity of a lead-acid cell for a random load is, according to the Standard, calculated using Equation (3).
Q R = n rep I R K T , R
where KT,R is the factor that can be determined graphically from three characteristics for three different ways of a lead-acid cell’s discharging for a random load for the duration of tR = 1 min. nrep is the random load repetition factor, assuming tR = 1 min for all repetitions. IR is the total load current of a random load. This capacity is oversized, due to the selected duration [7].
The necessary capacity of the lead-acid cell can, finally, be calculated using Equation (4).
Q c , need = K a K tem K dm ( Q + Q R )
where Ka is the aging factor of the lead-acid cell (irreversible chemical processes). The Standard defines it as Ka = 1.25. This means that, at the start, up to 25% higher capacity of a lead-acid cell needs to be provided to ensure that it will be able to supply the load during the entire SL. Ktem is the temperature factor. Kdm (design margin) is a correction factor that takes into consideration insufficient maintenance and unexpected changes of load.
To design the DC auxiliary system for new substations, it is necessary to determine the set of potential DC auxiliary system loads. The power ratings of individual loads and their estimated duration of connection to the DC auxiliary system are determined during the intended autonomy of power supply from LABs. Also determined are the average current Iavg at the average discharge voltage Uavg (Iavg = P/Uavg) and the random load current IR. Cycles and periods of load currents are determined. The appropriate capacity is selected according to Equations (1)–(4). The factors in capacity selection (aging, temperature, manufacturing constraints) are generally taken conservatively as maximum values. The number of lead-acid cells connected in series for a given DC voltage level is predetermined and in accordance with the Standard [8]. In the case of a reconstruction of the DC auxiliary system, the current measurement and duration shall be measured for the existing one. A random current load, as well as the number of lead-acid cells connected in series, are also determined in accordance with the provisions of the Standard and equipment at the DC auxiliary system voltage. The rule is that a unifying number of cells connected in series is selected for a given DC auxiliary system voltage level. Based on these provisions, and in cooperation with the institutions for designing the DC auxiliary system in substations, we have created an application in MS Excel, which covers an active capacity selection table by the Standard [8].

4. Procedure of Lead-Acid Battery Selection Based on the Optimization Method

The new LAB selection method using optimization complies fully with the technical criterion regarding the selection of capacity and the number of lead-acid cells connected in series. With the additional variation of factors (temperature and manufacturing constraints) and the number of cells connected in series, we introduced a cost criterion, and criteria for the reliability and operational safety of lead-acid cells in the BR.
The entire procedure of LAB selection using the optimization method is presented in Figure 3. DEA was used as an optimization method for the selection of LABs. The basic idea is to use an optimization method that enables selection of the most optimal battery using multiple selection criteria. The flow chart shows several phases of computations and selection. The basic phase is a collection of information and variables that are used in the optimization procedure, as well as Standards, based on the user’s experiences and manufacturer’s data. The flow chart in Figure 2 presents the entire procedure for the computation of variables that are included in the optimization process.
The elements of IEEE Std 485 (2010) in Figure 3, properties of a DC auxiliary system, and supplier of LABs, include all necessary input data and procedures for computation of variables that are included in the optimization process. The remaining building blocks of the flow chart are included in the loop of the DEA optimization process algorithm. The selection of optimization parameters influences the selection and computation of variables that are included in the objective function. The DEA requires a normalized objective function and defined limits of optimization parameters. These data are presented in the lower part, since they influence the performance of the algorithm directly. The optimization parameters that are not part of the analytic procedure according to the Standard [8] are also presented, but have an impact on the DEA’s behavior. The algorithm offers new values of parameters that have an indirect impact on the value of the objective function. This procedure leads to the selection of optimal parameters at the criteria of the highest possible autonomy of supply with the LAB f1, minimum cost f2, highest possible operational reliability f3, and maximum operational safety of LABs in the BR f4. All elements of this optimization system are presented below.
To include factors KT,p and KT,R in the optimization process, an approximation from three characteristics for three different ways of a lead-acid cell’s discharging was made with the polynomial of the fourth degree. The “grabit” application was used for this purpose, where, for the diagram for each characteristic, the points Ti (xi,yi) were determined (more than 200 points per curve). Since these curves are plotted on a log-log graph, the final points were obtained using x’ = 10x transformation. The transformation is valid for all coordinates. The fourth-degree polynomial coefficients were sought using the approximation process in Equation (5).
K T , p = a 1 t aut 4 + a 2 t aut 3 + a 3 t aut 2 + a 4 t aut + a 5   [ h ]
where a1, a2, a3, a4 in a5 are fourth-degree polynomial coefficients and taut is the duration of the autonomous supply expressed in minutes. Table 1 shows the coefficients for three ways of lead-acid cells’ discharge at different Uc,min.
The Standard defines discrete values of this temperature factor for electrolyte temperatures between θ = 4.4 °C (Ktem = 1.3) and θ = 48.9 °C (Ktem = 0.86). This is also the ambient temperature in the stationary operating conditions. In the optimization process, these boundary conditions are given in a tabular form. For the intermediate temperatures, the factor Ktem is defined by the linear interpolation. Kdm (design margin) is a correction factor that takes into consideration insufficient maintenance and unexpected changes of load. Only the influence of insufficient maintenance is taken into account in the optimization process. The boundary values of this factor lie between Kdm,min = 1.0 and Kdm,max = 1.15. In the subsequent parts of the paper, this factor is addressed to maintenance factor Km = Kdm.
The other important area that influences the selection of a LAB is the DC network supplied by the battery. Below, there is a description of a DC auxiliary system supply in modern substations, although the procedures can be generalized to all DC networks. Voltage levels of DC networks are defined by the types and properties of the connected load. The minimum voltage UDC,min is the DC network voltage that enables uninterrupted operation of the supplied load. The maximum DC network voltage UDC,max is the maximum permitted operational voltage of the supplied load. The DC network voltage and, thus, the LAB voltage, depend on the necessary amount of energy stored in the battery. The user has to maintain the LAB and comply with the minimum maintenance requirements defined by the manufacturer. These requirements may be even higher to provide the required level of reliability. An LAB has to undergo inspections, revisions, and capacity tests to maintain its SL. The LAB is not disconnected from the DC network during the inspections. Checked are the general condition of the battery, electrolyte level, and condition of contacts between the lead-acid cells (using a thermovision camera), the sealing, and ventilation of the BR. The battery is switched off during the revisions. This process includes a thorough inspection of contacts, with measurement of contact resistance, battery connections, electrolyte density, and voltage of individual cells. The capacity test is performed in accordance with the IEC 60896-11 Standard [22], and in accordance with the manufacturer’s instructions. A detailed inspection of the battery is performed. It is loaded with a constant current through the discharging resistor. Voltage is measured until the battery is discharged to 80% of its initial capacity. The intention is to find malfunctioning lead-acid cells. During this process, the electrolyte density is also measured constantly.
The inspection cost is denoted as Cins. The revision cost, on the other hand, is denoted as Crev, while the cost of the capacity test is Cct. The SL of the battery is designated as SL.
The maintenance extent influences the maintenance factor Km and the maintenance costs Cm. On the basis of the lead-acid cells’ maintenance method and the manufacturer’s recommendations, five maintenance modes are possible, as described below. Maintenance mode 1: Twice a year, a capacity test is performed; once a year, a revision; and twice a year, an inspection. Km,mode1 = 1. The cost of maintenance mode 1 is expressed as Cm,mode1 = (2 · Cct + Crev + 2 · Cins) · SL. Maintenance mode 2: Once a year, a capacity test; once a year, a revision; and twice a year, an inspection. Km,mode2 = 1.05. The cost of this mode is defined by Cm,mode2 = (Cct + Crev + 2 · Cins) · SL. Maintenance mode 3: A capacity test is performed every two years. During the years of the service life, when the capacity test is not performed, a revision is carried out, and, twice a year, an inspection. The cost of this mode is Cm,mode3 = (0.5 · (Cct + Crev) + 2 · Cins) · SL. Km,mode3 = 1.075. Service mode 4: A capacity test is performed every five years. During the years of the service life, when the capacity test is not performed, a revision is carried out, and, twice a year, an inspection. Cm,mode4 = (0.2 · Cct + 0.8 · Crev + 2 · Cins) · SL. Km,mode4 = 1.1. Service mode 5: A capacity test is performed once in the middle of the SL. During years of the service life, when the capacity test is not performed, a revision is carried out, and, twice a year, an inspection. Km,mode5 = 1.15. Cm,mode5 = Cct + (SL − 1)⋅Crev + 2 · Cins · SL. The vectors Km = [1,1.05,1.075,1.1,1.15] and Cm = [Cm,mode1, Cm,mode2, Cm,mode3, Cm,mode4, Cm,mode5] are formed with the currency unit [CU]. We are interested in the annual maintenance costs. The vector of annual maintenance costs is calculated using Cm,a = (1/SL) · Cm, where SL is the lead-acid cells’ SL. The maintenance of LABs is linked closely with their reliability of operation. A LAB is composed of a large number of cells connected in series. The capacity test gives us an indication of the weak links in this series, and the instruction which cells need to be replaced with new ones. Each weak lead-acid cell can prevent the battery from ensuring it required autonomy time during its operation [12]. The calculation of reliability depends mainly on the capacity test. A basic level of reliability is ensured by regular revisions if a capacity test is not carried out during the years of service life and inspections twice a year. For mode 1, it was found out that a failure may occur in the last half year of the SL. The reliability of operation is, thus, Rb,mode1 = 1 − 0.5 · SL−1. For mode 2, the reliability of operation is Rb,mode2 = 1 − SL−1. For mode 3, the reliability of operation is Rb,mode3 = 1 − 2 · SL−1. For mode 4, the reliability of operation is Rb,mode4 = 1 − 5 · SL−1. For maintenance mode 5, the reliability of operation is expressed as Rb,mode5 = 1 − 10 · SL−1. The reliability of operation vector Rb = [Rb,mode1, Rb,mode2, Rb,mode3, Rb,mode4, Rb,mode5] is formed for the LAB.
The LAB is placed in the BR, which needs to be ventilated forcibly, due to the release of H2 during battery charging [18]. For this purpose, a heating, ventilation, and air conditioning (HVAC) device is installed in the BR, which also keeps the room temperature at the desired level. The question is, what are the costs related to the operation of the HVAC device to maintain the desired temperature in the BR? For this purpose, the IEC 12831 Standard [23] is used, which defines the method of calculating the projected thermal load for buildings. To use this Standard properly, one has to know the properties of the walls, floor, ceilings, windows, and doors of both the building and the BR, as well as the surface areas of all elements. Heat losses due to natural ventilation of the BR and heat transfer through heat bridges can be neglected. It is assumed that the BR is located in a heated building with the temperature of the adjacent rooms amounting to Θnp. It is also assumed that all the adjacent heated/cooled rooms have the same temperature Θnp. The heat is transmitted between the building elements with the adjacent rooms, and the outer walls with the exterior. A stationary state of heat transmission is observed. The total heat transmission ΦBR, expressed in [W], between the BR and the adjacent rooms and the exterior, is defined by Equation (6).
Φ BR = ( H T , BRnp H T , BRe ) Θ BR H T , BRnp Θ np H T , BRe Θ e
HT,BRnp is the coefficient of transmission heat loss between the BR and the adjacent rooms in [W/K]. HT,BRe is the coefficient of transmission heat loss between the BR and the building exterior. ΘBR is the temperature inside the BR in [°C], while Θe is the exterior temperature. The intention is to know what the levels of heat transmission from the BR are at various outside temperatures. It is assumed that the annual hourly data are known on the exterior temperature around the building. A vector Θe,a = [Θe,a,1,…,Θe,a,i,…,Θe,a,8760] is formed. The counter of hours i lies between 1 and mh = 8760. For a certain BR temperature ΘBR, a vector of heat transmission from the BR in all hours of the year ΦBR,T can be defined using Equation (6). This vector is defined as ΦBR,Θ = [ΦBR,Θ,1,…,ΦBR,Θ,i,…,ΦBR,Θ,8760]. If the heat in a certain hour of the year (i) is transferred from the BR, the element ΦBR,Θ,I > 0 is heating, and if it is transferred to it, ΦBR,Θ,I < 0 it is cooling. The c device covers both ways of heat transmission, and is able to maintain the desired temperature in the BR. To maintain this temperature, the necessary electric power in the hour (i) in a certain year is calculated using Equation (7).
P e , Θ , i = ( 1 / ε HC ) | Φ BR , Θ , i |   [ W ]
The factor εHC is the average heating and cooling number of the HVAC device. It is assumed that in the hour (i), the necessary electrical power for air conditioning in the Equation (7) is average. The quantity of electrical energy in this hour is calculated using Equation (8).
W e , Θ , i = P e , Θ , i Δ t   [ Wh ]
The change of time in the observed case amounts to Δt = 1 h. When the necessary energy for all hours in a year is computed, the vector of necessary electrical energy We,Θ can be formed for maintaining the desired temperature in the BR. At the annual level, the hourly contributions of energy are summed up to get the annual electrical energy consumption of the air conditioning device for a certain temperature We,Θ,a using Equation (9).
W e , Θ , a = i = 1 i = m h W e , Θ , i   [ Wh ]
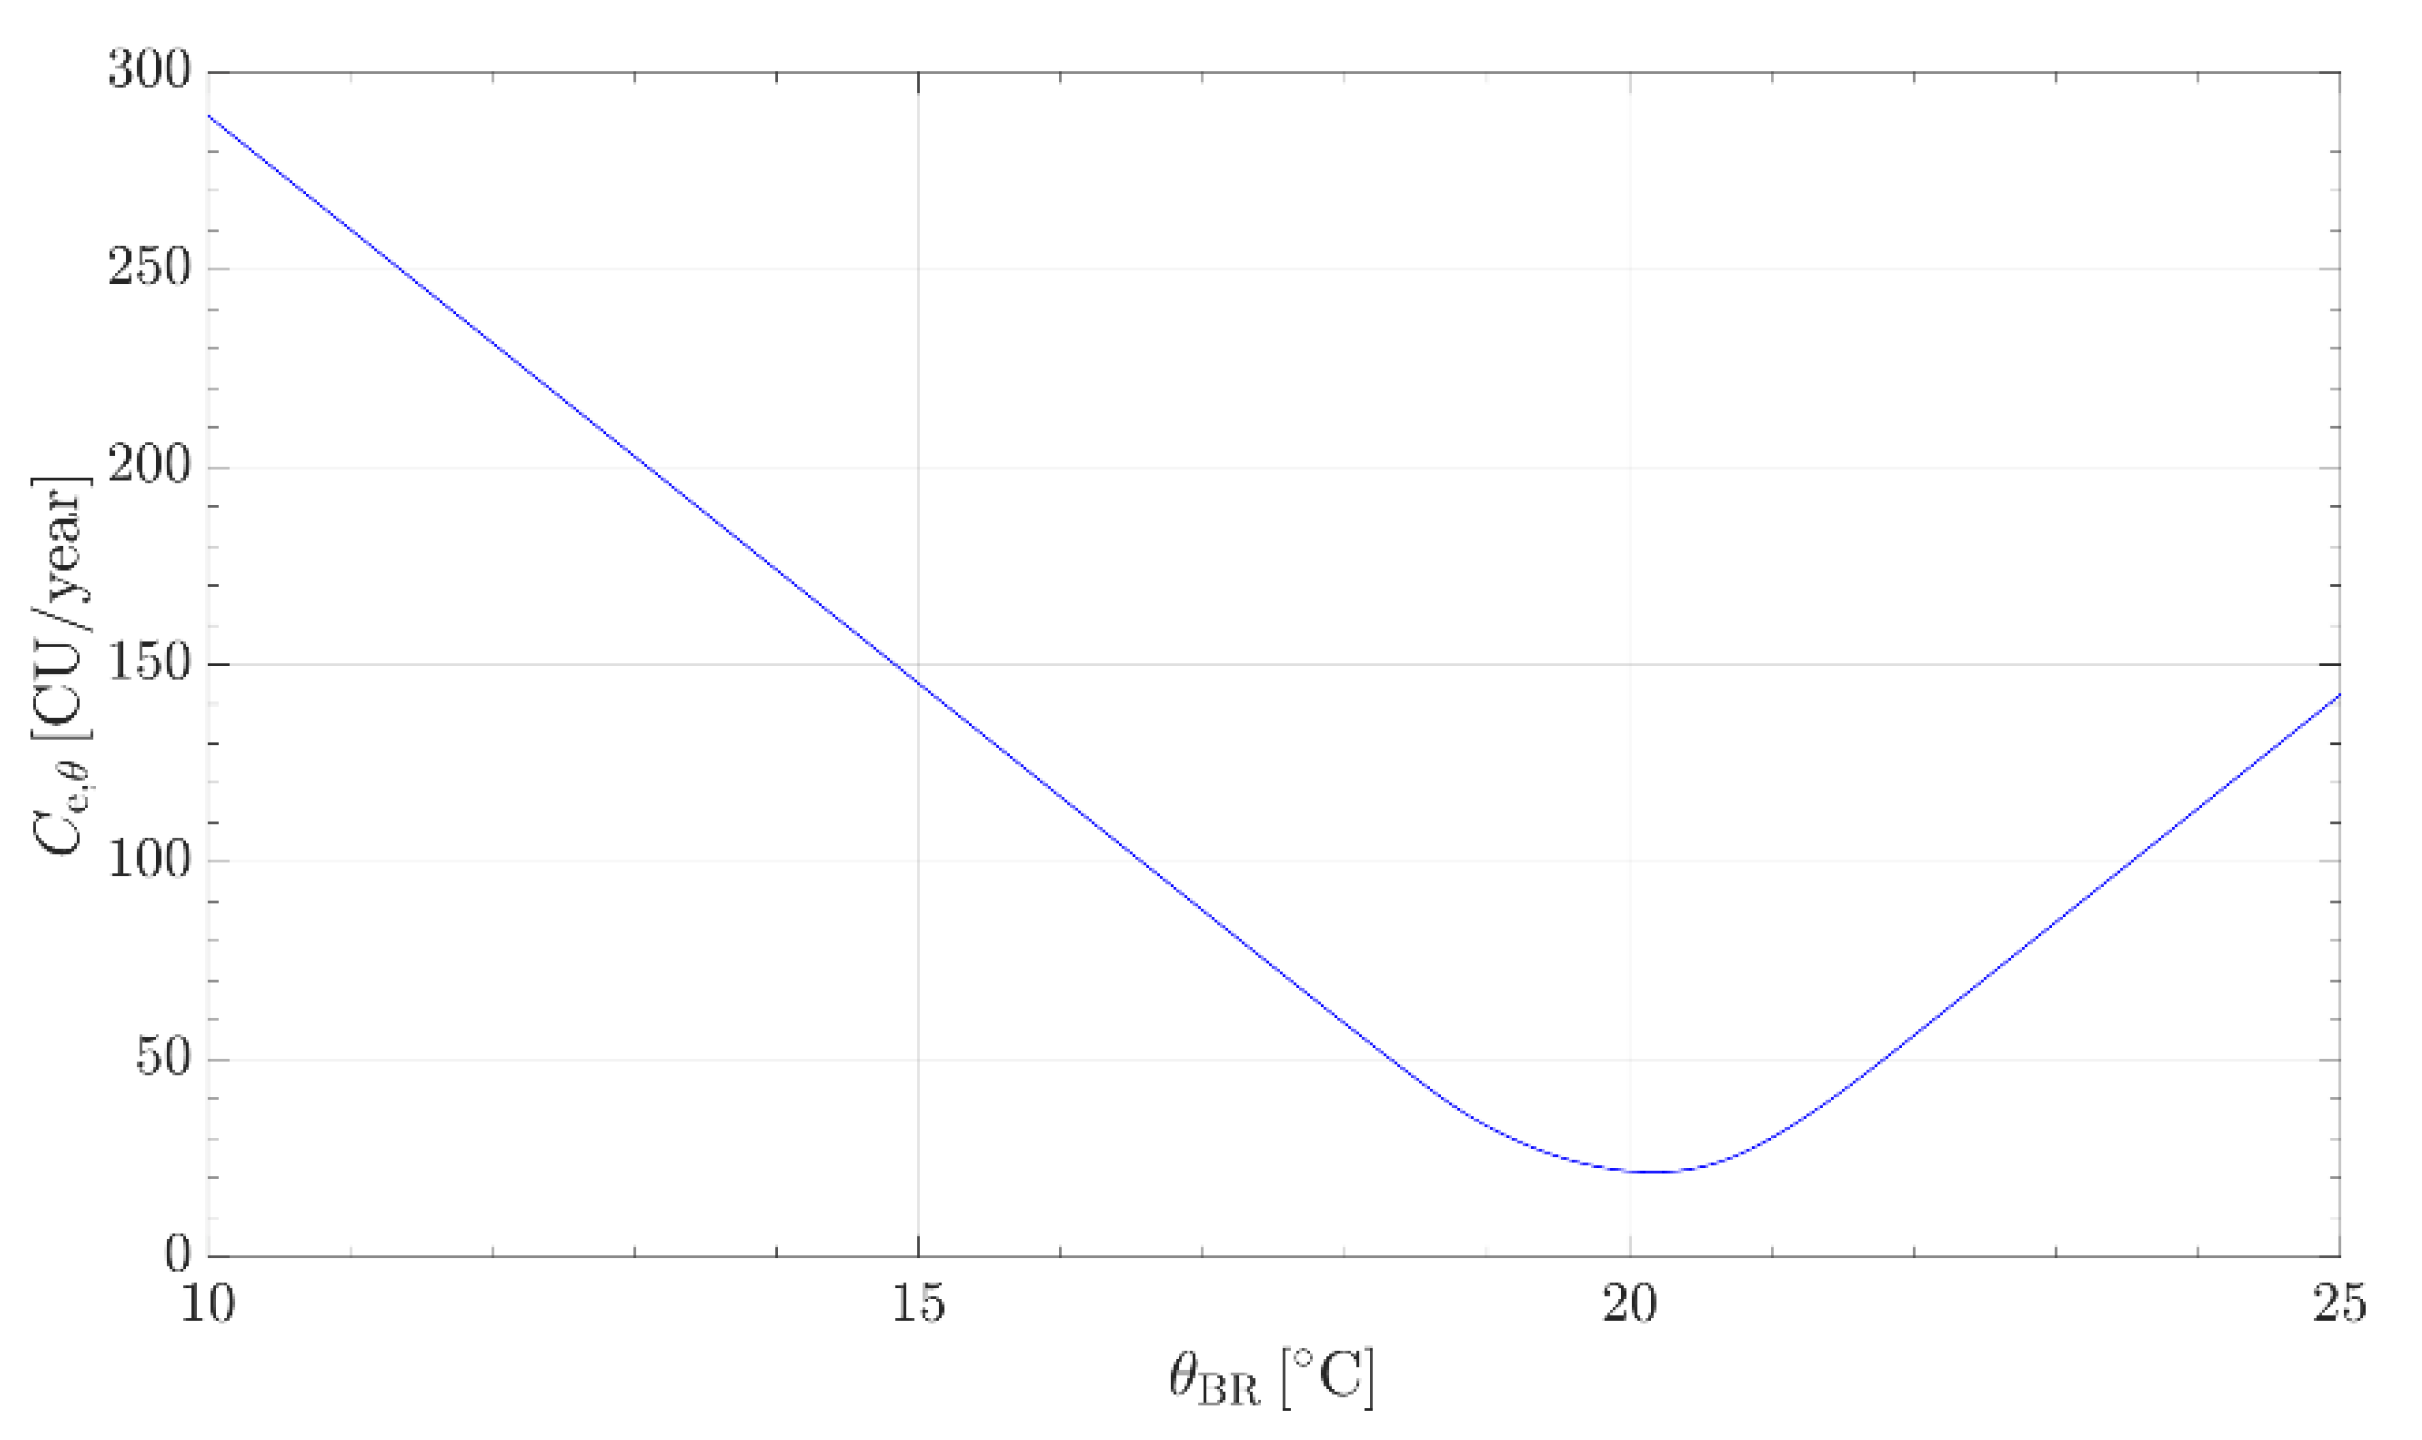
Finally, it is possible to calculate the annual HVAC cost for maintaining the BR temperature at ΘBR by using Equation (10).
C e , Θ = 1 1000 c e W e , Θ , a   [ CU ]
The procedure yields that the cost is Ce,Θ = f(ΘBR). This procedure is used in the optimization process.
The user also defines the longest possible time of autonomy of supply by the lead acid battery, 
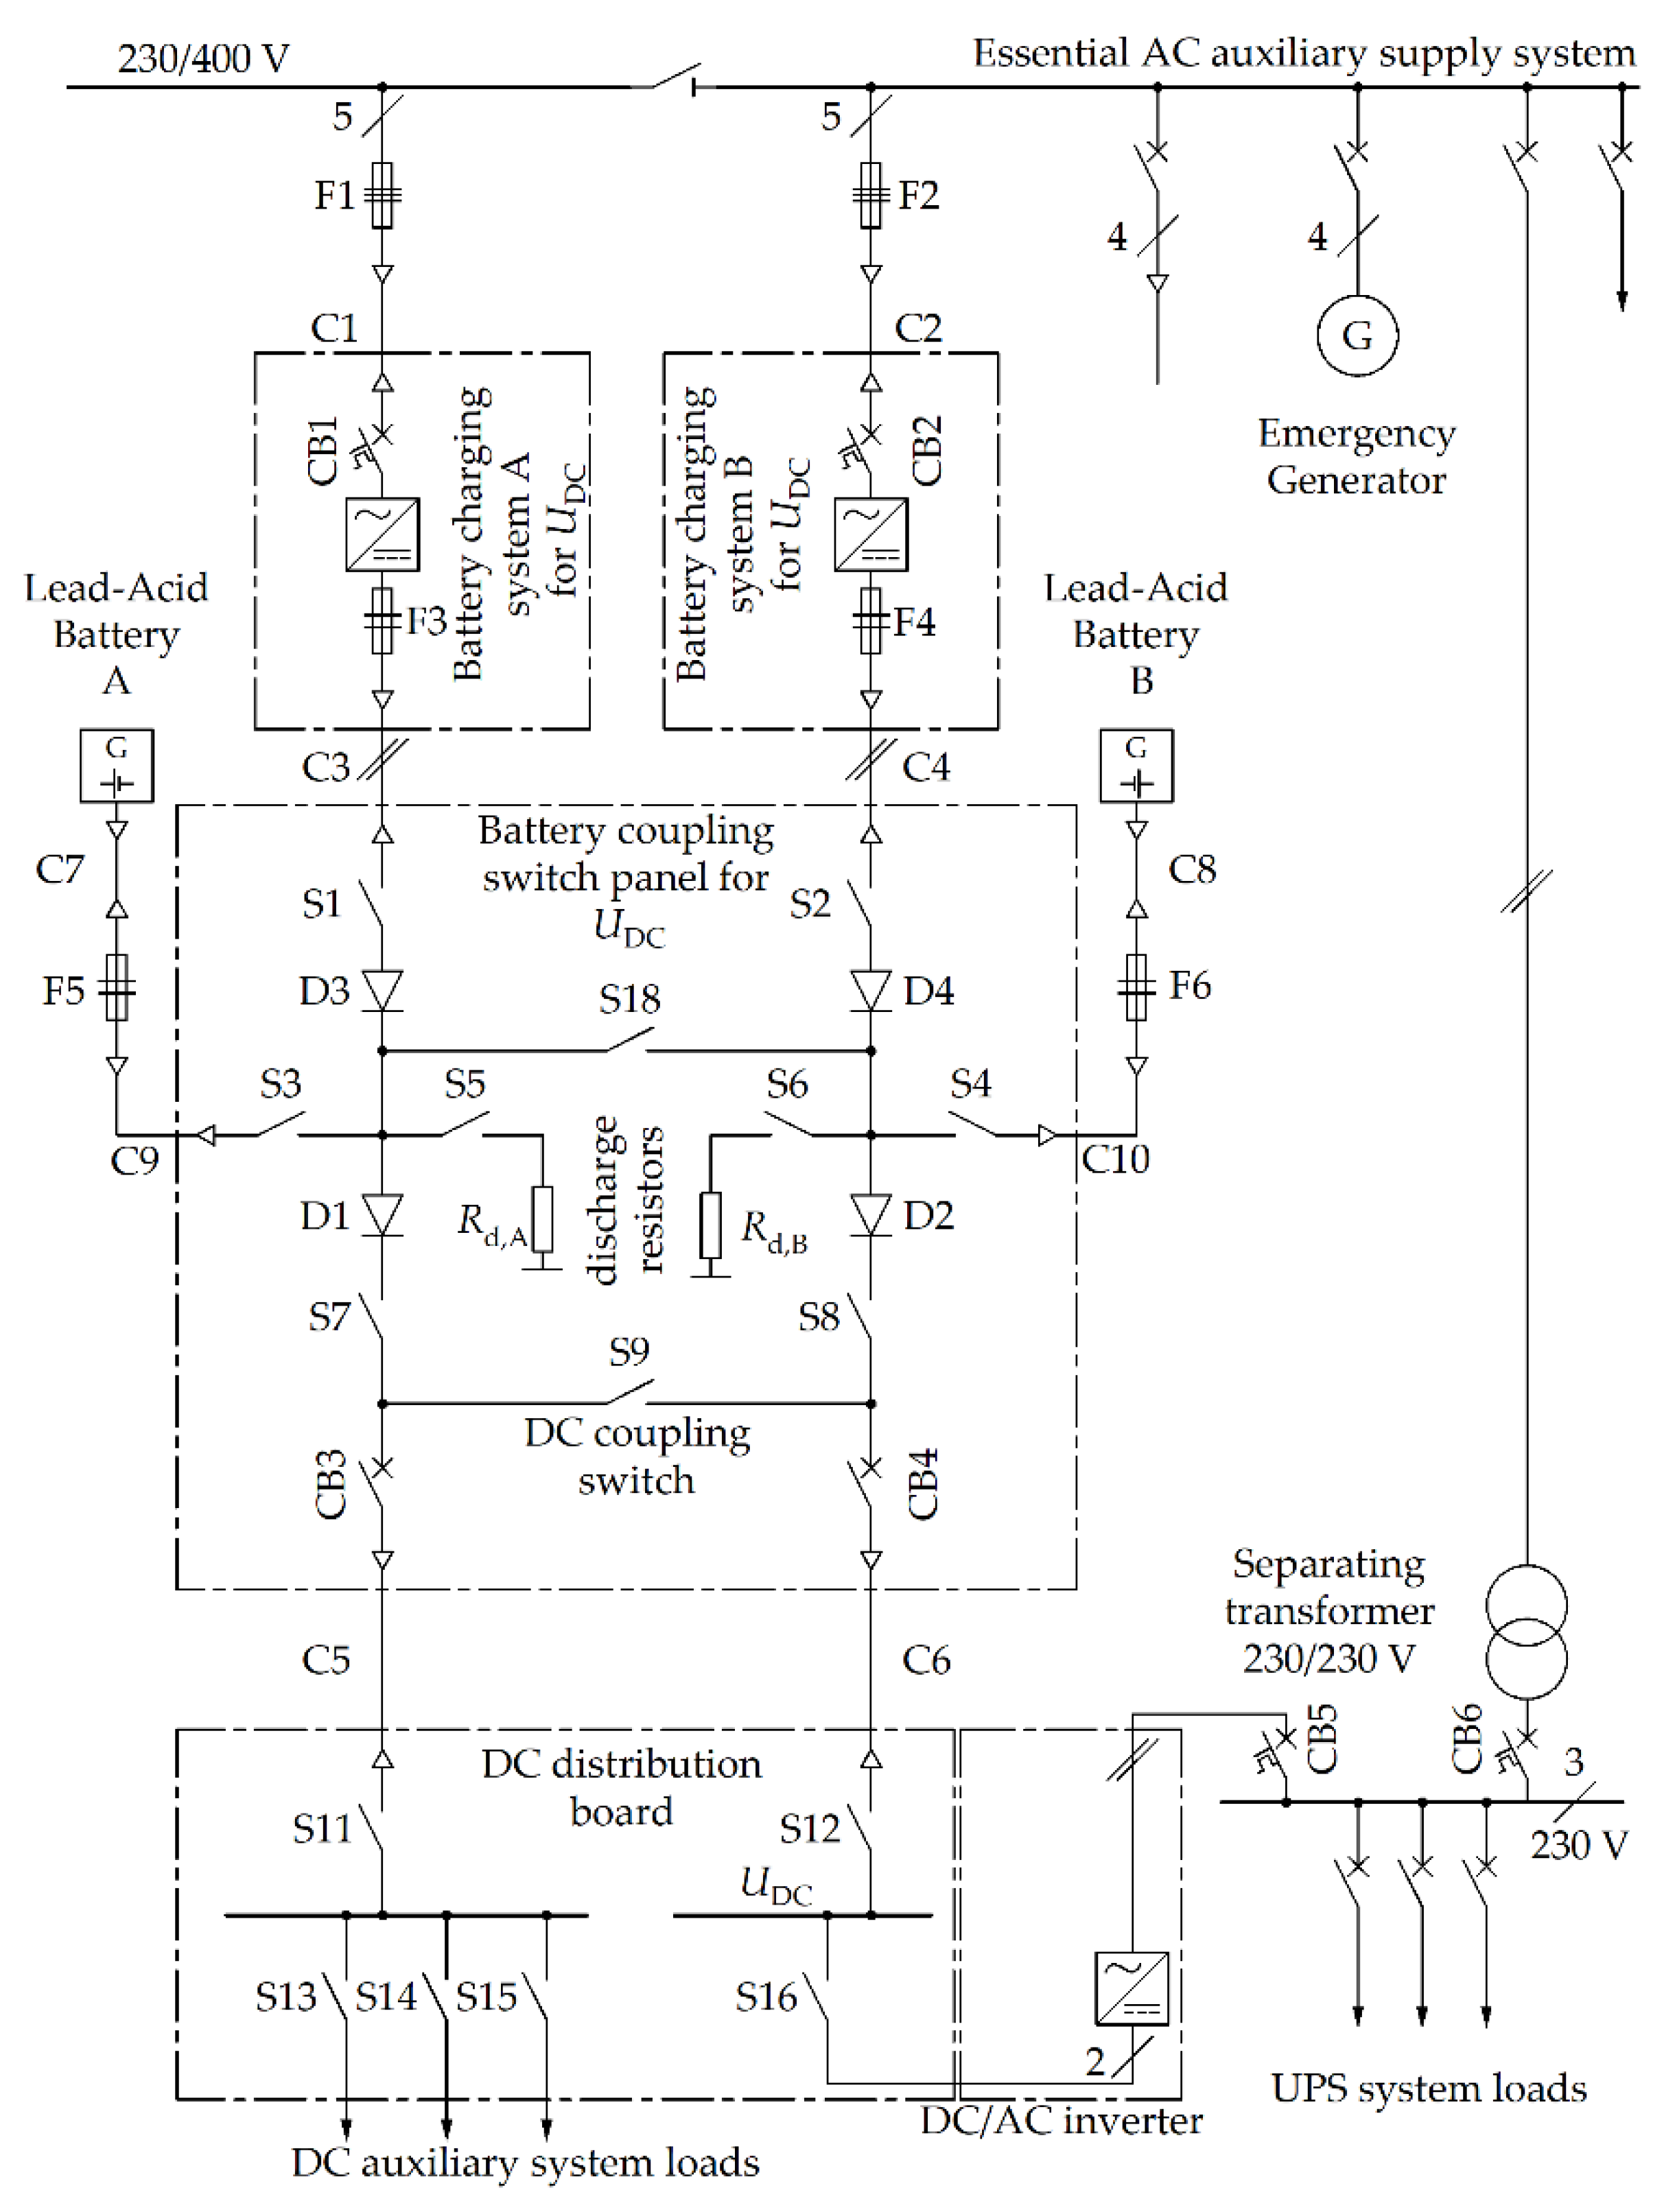
taut,max. This time is defined on the basis of experience. In this task, it is necessary to take into consideration the worst possible case, i.e., when the other battery in the DC network is empty. In the case of a rectifier’s outage, the other network should charge through the mobile emergency generator (Figure 1). The minimum time needed to recharge the other LAB is, for the optimization process, the highest possible autonomy time of the DC network with a LAB, taut,max. The user also defines the minimum autonomy of supply time taut,min, required to remove any problems in most cases and re-establish supply in the other supply network.
The third step in the process of selection of LABs is the battery manufacturer’s data. A set of m possible lead cells is selected from the production program. Thus, the vector Qc = [Qc,1,…,Qc,k,…,Qc,m] is obtained. An important factor in this process is the prices of different types of cells contained in the vector Cc = [Cc,1,…,Cc,k,…,Cc,m]. Since we deal with the annual costs, the vector] is formed of annual procurement costs Cc,a = (1/SL)Cc in a [CU/year]. The manufacturer also gives the technical SL of cells’ SL. Characteristic data are also the maximum lead-acid cell’s voltage Uc,max in [V/cell] and minimum operating voltage that enables its normal operation, Uc,min in [V/cell]. The manufacturer also specifies the recommended temperature range, limited by ΘBR,r,min and ΘBR,r,max. This temperature range is usually narrower than the one defined by the Standard.
The Standard defines the procedure for determining the number of cells connected in series. The procedure was upgraded. The maximum number of cells connected in series is determined using Equation (11).
n c , max = U DC , max U c , max   [ cell ]
The natural number nc,max,int is assigned to the maximum number of cells using Equation (12).
n c , max , int = floor ( n c , max )   [ cell ]
The minimum number of cells connected in series is calculated in a similar way. The number nc,min is defined by Equation (13).
n c , min = U DC , min U c , min   [ cell ]
The minimum natural number nc,min,int is determined using Equation (14).
n c , min , int = floor ( n c , min ) + 1   [ cell ]
The vector of serially connected lead-acid cells nc = [nc,min,int,…,nc,l,…,nc,max,int] can be formed as long as the rule nc,max,int > nc,min,int is in force. The dimension of this vector n is defined by Equation (15).
n = n c , max , int n c , min , int + 1
Each number of serially connected cells in the vector nc complies with the technical requirements of the Standard. The size of the vector nc is defined primarily to enable setting of the maximum charging voltage Uc,max. If it is higher, the number of possible cells connected in series is lower. The variables and procedures described so far are input data for the optimization process. In addition to the input data, they are also influenced by the optimization parameters. The output from the DEA is a set of optimization parameter values. They are limited directly in the algorithm. The parameters were not normalized in the concept described in the paper. The limitations are of a physical nature. The optimization algorithm deals with five optimization parameters: Electrolyte temperature (BR) (p1), maintenance mode of the LAB (p2), selection of cells’ capacity from the set of possible ones (p3), selection of the number of lead-acid cells connected in series (p4), and duration of autonomy of supply with the LAB (p5). The first parameter in the optimization process is electrolyte temperature. In stationary operating conditions, this is also the BR temperature. The room temperature takes the value of parameter p1, as ΘBR,sel = p1; p1 ∈ [ΘBR,r,min,ΘBR,r,max]; p1 ∈ ℝ. With the selection of this parameter, the temperature factor Ktem,sel = f(ΘBR,sel) can be determined using linear interpolation, as well as the annual cost of maintaining this temperature with the air conditioning device Ce,Θ,sel using the procedure defined by the set of Equations (6)–(10). The parameter p2 is connected with the battery maintenance. It is an element of the set of natural numbers, p2 ∈ {1,2,3,4,5}; p2 ∈ N. Since the optimization process yields the parameter p2 as a real number, it should be transformed to a natural number using the function round(). This parameter actually represents a counter of possible maintenance modes j = p2. The parameter p2 is used to obtain the maintenance factor Km,sel = Km,j from the vector of maintenance factors Km, reliability of operation of LABs Rb,sel = Rb,j from the vector of reliability of operation Rb, and maintenance-related cost Cm,sel = Cm,j from the vector of maintenance costs Cm. The parameter p3 is related to the selection of lead-acid cells’ capacity, defined by the manufacturer. It represents a counter of selection of cell capacities from the set of products k offered by the manufacturer, k = p3; p3 ∈ {1,2,…,m}; p3 ∈ N. With this parameter, the lead-acid cells’ capacity Qc,sel = Qc,k is selected from the vector Qc, as well as the procurement costs distributed by the years Cc,a,sel = Cc,a,k from the vector of annual costs Cc,a. The parameter p4 represents the counter of selection of the number of cells connected in series. This is the counter l in the vector nc, l = p4; p4 ∈ {1,2,…,n}; p4 ∈ N. The number of cells connected in series nc,sel = nc,l is selected from the vector nc with this parameter,. The parameter p5 represents the duration of battery autonomy in supplying energy to the DC auxiliary network. The duration of autonomy takes the value of the parameter p5 as taut,sel = p5; p5 ∈ [taut,min,taut,max]; p5 ∈ R. This parameter enables calculation of the factor KT,p,sel = f(taut,sel), which makes possible calculation of the needed lead-acid cell’s capacity Qc,need.
When the variables that depend on optimization parameters are selected (Ktem,sel, Ce,Θ,sel, Km,sel, Cm,sel, Rb,sel, Qc,sel, Cc,a,sel, nc,sel, KT,p,sel), it is possible to calculate the needed capacity Qc,need using Equation (4). If Qc,selQc,need, then the capacity was selected properly, and complies with the technical criteria defined by the Standard. If Qc,sel < Qc,need, then the counter k is set at the last place, k = m. The capacity Qc,sel and cost Cc,a,sel are selected once again. After this, we may proceed to the computation of the Objective Function.
The objective is to select LABs using an optimization procedure by maximizing their duration of autonomy, minimizing costs, and providing maximum reliability of operation of the LAB. This is a multiple-criteria function. The total objective function can be computed using Equation (16). This is a dimensionless variable. In the optimization process it approaches to the minimum.
F o = α 1 f 1 + α 2 f 2 + α 3 f 3 + α 4 f 4   min
The functions f1, f2, f3, and f4 are normalized functions for autonomy of supply, costs, reliability of operation, and the operational safety of LABs in a BR. α1, α2, α3, and α4 are weighting factors of the objective function. The normalized function f1 is a normalized objective function for the criterion of autonomy of supply. This function is normalized through the linear transformation in Equation (17).
f 1 = 1 t aut , sel t aut , min t aut , max t aut , min
This objective function is defined only with the duration of supply autonomy. The boundary values of this objective function are also the limits of the parameter p5. The most cost efficient selection of a LAB is sought. This means that the minimum of the objective function f2 is sought. Normalized function f2 is the normalized function for the criterion of cost. Normalization is performed using linear transformation in Equation (18). Since the minimum of this function is sought, it can only be increasing linearly.
f 2 = C sel C min C max C min
The cost criterion was designed on the basis of the procedure in [14]. The total cost in the optimization procedure Csel is defined by Equation (19).
C sel = C e , Θ , sel + C m , sel + n c , sel C c , a , sel
The upper limit of cost Cmax is defined by the inequality in Equation (20).
C max > C e , Θ , max + C m , max + n c , max C c , a , max
The lower limit of cost Cmin is defined by the inequality in Equation (21).
C min < C e , Θ , min + C m , min + n c , min C c , a , min
The third objective function defines the criterion of the maximum reliability of operation. This criterion depends only on the reliability of operation of the LAB. The reliability vector Rb has distributed five probabilities discretely, and each of them has reliability mostly above Rb > 0.5. The normalization of the reliability criterion with linear transformation is, in this case, not adequate. A Gaussian curve is used instead for the normalization of the objective function, assuming that the objective is to ensure the highest possible reliability of operation of the LAB. The function f3 is obtained by Equation (22).
f 3 = 1 e m l ( R b 1 ) 2
where ml is the “shape factor” on the left side of the Gaussian curve, calculated for our normalization case using the equation ml = ln(0.1)/(0.82 − 1)2.
The last objective function f4 is the operational safety criterion of LABs in the BR. It refers to the amount of released hydrogen, H2, into the BR while charging LABs. The Standard [17] deals with the safety requirements for secondary batteries and installations. An important part of this Standard is explosion hazards and protection against them in the BR. During the charging process of the LAB at Uc > 2,23 V/cell, a chemical reaction of electrolysis of water is initiated in the electrolyte. The concentration of hydrogen in the air in the BR must not exceed 4%vol (a potentially explosive mixture). The battery for a DC auxiliary system supply in the substation is recharged all the time. This means the H2 concentration is increasing regularly. The solution is adequate forced ventilation of the BR. The amount of replaced air in hours is defined by Equation (23).
Q air = 5 10 5 n c I gas Q c [ m 3 h ]
Igas is a specific equivalent charge current producing H2 in [mA/Ah]. The thermodynamics of the electrochemical reaction of the electrolysis of water in the electrolyte depends on the charge current density [18]. With increasing charging current, the amount of H2 release also increases. The current is dependent on the lead-acid cell’s charge voltage Uc, since the conductivity is presumed to be constant in this area of charging. In the worst case, the charge voltage of the lead-acid cell is determined as Uc = UDC,max/nc. The limit currents Igas = 5 mA/Ah at the voltage Uc = 2.23 V/cell and Igas = 20 mA/Ah at the voltage Uc = 2,40 V/cell are specified in the Standard [17]. Based on the two boundary points, function Igas = f(Uc) is determined by linear interpolation. Inserting this function into Equation (23), Equation (24) is obtained for the ventilation airflow Qair,sel.
Q air , sel = 5 10 5 n c , sel ( 88.235 U DC , max n c , sel 191.764 ) Q c , sel
Qc,sel is the selected capacity from vector Qc. Equation (24) is normalized, and the objective function in Equation (25) obtained. As with the normalization for the objective function f3, the Gaussian bell curve function is also applied here.
f 4 = 1 e m l Q air 2
where ml is the “shape factor”, defined by ml = ln(0.01)/502. By minimizing the objective function in Equation (25), the amount of H2 released into the BR is reduced, along with the required airflow for forced ventilation with HVAC.
Figure 3 also presents the control parameters of the DEA, i.e., the algorithm that is used in the optimization. These parameters are the number of optimization variables D, number of members of population NP, difference factor F, crossover control parameter CR, and the maximum number of iterations itermax.
The optimization process terminates when the algorithm reaches the maximum number of iterations, or the deviation of the objective function is lower than ε = 1⋅10−6. The optimization parameters become the optimum parameters. The vector popt = [p1,opt, p2,opt, p3,opt, p4,opt, p5,opt] is obtained as a solution. If the parameters are decoded, we can obtain the optimum operational temperature Θopt = p1,opt, optimum maintenance mode mmode,opt = p2, optimum capacity of the lead-acid cell Qc,opt, optimum number of cells connected in series nc,opt, optimum duration of autonomy taut,opt = p5,opt, and optimum costs Copt, that can be calculated using Equation (19) if optimal costs Ce,Θ,opt, Cm,opt in Cc,a,opt are used as parameters in this equation.

5. Two Examples of the Selection of Lead-Acid Batteries Using the Conventional Method and the Optimization Process

Two examples of the selection of LABs were performed, one for an auxiliary DC network in a small substation and one for a large substation. For both examples, the selection was performed using the conventional method and the new proposed selection method with optimization. Substations differ with regard to the number of bays and loading of the DC network. Both substations have an existing DC auxiliary system. The reconstruction of the LABs is required due to the expiration of the LAB’s life. For both examples, the same settings of control parameters were used for the DEA, as well as the boundaries of objective functions for normalizing. The control parameters for the DEA are as follows: D = 5, NP = 50, F = 0.6, CR = 0.7 in itermax = 50, and they were determined based on previous experience for such optimization cases. The boundaries for normalization for the objective function f1 are taut,min = 1 h and taut,max = 8 h.
For the cost criterion f2, the boundary values for normalization are Cmin = 938 CU and Cmax = 4000 CU. For f3, the boundary values are 0 and 1. For the safety criterion f4, the boundary values for normalization are Qair,min = 12 m3/h and Qair,max = 100 m3/h. All four objective functions are equally weighted, α1 = α2 = α3 = α4 = 0.25.

5.1. Input Data for the Selection of Lead-Acid Batteries for Small Substations

A small 110 kV distribution substation is demonstrated as the first example of selection of LABs for supplying an auxiliary DC network using the optimization method. It is an existing substation, where the DC auxiliary supply networks need to be revitalized. In a substation, the LAB can be permanently charged, and is always in a position to take its role to supply the DC’s auxiliary system autonomously. With regard to the operation mode, it can be supposed that the battery’s temperature during charging is not increased due to the charging process itself. Measurements of load current (protection and control) showed that the current was permanent. The measured current is shown in Figure 4. It can be seen that the total load current is IL1,1 = 2.42 A. The inverter’s current was also measured on the DC side of the UPS system. The permanent DC current amounted to IL1,2 = 1.41 A. Both loads, according to Figure 1, represent the total permanent current IL1 = 3.83 A. Since there is only one type of load with the current IL1 decisive for the selection of LABs, the calculation of needed capacity Q according to Equation (1) was simplified, since the number of cycles equals ns = 1, and one period is p = 1. The calculation of the factor KT,L1 was also simplified at the same time.
We also measured the current during the operation of the triggering coil of the circuit breaker’s drive. The temporal course of this current is shown in Figure 5, where we can see the highest value of this impulse Itc = 1.63 A.
All circuit breakers in the bays operate simultaneously in the operation of a busbar protection system in a substation. There are seven bays in the observed substation. There are no reserve bays. In the circuit breaker in the transformer bay, there are three triggering coils, while circuit breakers in the remaining six bays have six simultaneously operating coils each. The busbar protection can operate any time during the autonomous LAB supply. Therefore, the total current of random load amounts to IR = 1.63⋅(6⋅6 + 3⋅1) = 63.57 A. During the autonomous operation of the LAB, the system can also be restored by sequential switching of all bays. We assume that the actuators of the circuit breaker have stored energy for the three switching maneuvers. The equivalent trigger time of all coils is tR = 1 min, which means the same KT,R factor for all triggers. Given these assumptions, we can define nrep = 2. By integrating the nrep repetition factor, we included in the LAB selection concept with optimization the determination of the required capacity reserve to restore the system after switching off the bays in substation. To enable their operation, the loads also define UDC,max = 250 V and minimal load voltage UDC,min = 188 V. Let us assume that 8 h are needed to charge the second battery system. This means that taut,max = 8 h. The minimum time of autonomy of supply is set to taut,min = 1 h. The cost of LAB inspections in the substation is known, and amounts to Cpr = 100 CU, cost of revision amounts to Crev = 240 CU, while the cost of the capacity test amounts to Ckp = 350 CU. The vector of maintenance costs Cm = [1140, 790, 495, 462, 445.5] CU, is calculated on the basis of these data. The lead-acid battery should be located in the BR. Proper BR ambient conditions are provided by the HVAC device. The room has one outer wall with HT,BRe = 10.3 W/K. The other walls, ceiling, and floor are uninsulated, with HT,BRnp = 87.7 W/K. The temperature in the neighboring rooms is constant, and amounts to Θnp = 21 °C. In the year 2018, a temperature profile of the outer side of the building was measured, comprising hourly temperature readings. The temperature profile is shown in Figure 6.
The average heating and cooling number of the air conditioning device should be εHC = 3.7. The specific cost for electricity is ce = 0.124 CU/kWh. Using the procedure defined by Equations (6)–(10), the annual electricity costs were calculated to maintain the temperature between 10 °C and 25 °C in the BR. The diagram of costs for different BR temperatures is shown in Figure 7.
These data are used in the optimization process for the cost Ce,Θ. The manufacturer provides a set of possible LAB cells’ capacities Qc = [100,150,200,250,300,350,420,490,600,800,1000,1200] Ah and costs Cc = [91,104,115,130,148,163,185,204,235,325,378,431] CU. The manufacturer also specifies the SL of the lead-acid cells, SL = 20 years, and operating temperature range between ΘBR,r,min = 10 °C and ΘBR,r,max = 25 °C. The maximum charging voltage of lead-acid cells is Uc,max = 2.35 V/cell. The minimum voltage, to which a cell can discharge, amounts to Uc,min = 1.81 V/cell.

5.2. Selection of Lead-Acid Batteries Using the Conventional Method for Small Substations

Based on the measured current DC auxiliary system loads and the current of DC auxiliary system random loads, we have chosen the required lead-acid cell capacity using the conventional method based on the Standard [8]. The results of the selection are shown in active Table 2. For the LAB autonomy, the required capacity was calculated as Qc,need = 291.65 Ah. From the scale of offered capacities from the manufacturer, we have chosen Qc = 300 Ah. It is assumed that the lead battery operates at a temperature ΘBR ≥ 10 °C. The number of lead-acid cells connected in series is nc = 104 cells.

5.3. Optimization-Based Selection of Lead-Acid Batteries for Small Substations

A computation was performed for the selected parameters of the DEA, and the vector of optimized parameters popt = [20.17,1,4,3,8] was obtained as a result. From this, it can be seen that the optimum temperature amounts to Θopt = 20.17 °C, and optimum maintenance mode is mmode,opt = 1. This means that Cm,1,opt = 1140 CU/year and Rb,opt = 0.975 are selected. The selected maintenance mode provides for the highest operational reliability. The optimum lead-acid cell capacity selected is Qc,opt = 250 Ah. The optimum number of cells connected in series is nc,opt = 106 cells, while the optimum duration of autonomy is taut,opt = 8 h. Optimum costs are Copt = 1851 CU/year. For the optimally selected optimization parameters according to Equation (24), we have calculated the minimum amount of exchanged air in the BR as Qair = 21.65 m3/h. With the selected temperature Θopt = 20.17 °C, these are the necessary data for selecting an HVAC device for the BR. Figure 8a shows the results of all objective functions. It is obvious that the values of the objective functions converge. Figure 8b shows the results of all values of the objective functions.
Figure 9 shows the courses of all five parameters during the iteration process.

5.4. Input Data for Selection of Lead-Acid Batteries for Large Substations

A large 400 kV/220 kV/110 kV transmission substation was selected as the second example of selection of LABs for supplying an auxiliary DC network using the conventional and optimization methods. This substation has line bays and transformer bays for voltage levels 110 kV, 220 kV, and 400 kV. At the 110 kV level, the substation has nine line and coupler bays and three transformer bays (two for 110/220 kV and one for 110/400 kV). At the 220 kV, the substation has four line and coupler bays and three transformer bays (two for 220/110 kV and one for 220/400 kV). At the 400 kV level, there are also four line and coupler bays and two transformer bays.
Figure 10 shows the measured permanent load at the DC busbar, and represents the permanent current IL1 = 20.4 A. The circuit breaker drives are the same as in the small substation. When the busbar protection is activated at 110 kV, it switches off all 110 kV bays, as well as the transformer bays on both sides of the transformers. The total current in this case amounts to IR,110 = 1.63⋅(9⋅6 + 2⋅3⋅3) = 117.36 A. At the 220 kV level, it stays equal, while at 400 kV, it equals IR,400 = 1.63⋅(4⋅6 + 2⋅2⋅3) = 58.68 A.
In reality, it is impossible that there will be an outage at all three voltage levels at the same time. Therefore, the maximum value of IR = 117.36 A is used as a random current. Also, in this case, during the LABs’ autonomous operation, the system can be restored to its original state after the busbar protection is activated. We assume the random load repetition factor nrep = 2. The BR has one insulated wall with HT,BRe = 4.71 W/K. The other walls and ceiling are shared with the neighboring rooms through uninsulated walls with HT,BRnp = 100.53 W/K. The heat loss coefficient to the uninsulated floor is neglected. The temperature in the neighboring rooms is constant, and amounts to Θnp = 21 °C. The annual profile of costs for the HVAC device Ce,Θ is shown in Figure 11.
It is obvious that the insulated outer wall reduces the influence of the outside ambient temperature. These data for the cost Ce were used in the optimization process. The other data are the same as in the previous example. The temperature profile is preserved, since both substations are located within a radius of 20 km. The profile of annual costs for maintaining the specified temperature was also calculated as shown in Figure 11. The optimum temperature was shifted towards 21 °C, due to the reduced impact of the outside temperature due to the insulated wall.

5.5. Selection of Lead-Acid Batteries Using the Conventional Method for Large Substations

Also, for this case, the selection based on the conventional method was made using active Table 2. For the LAB autonomy, the required capacity was calculated as Qc,need = 721.86 Ah. From the scale of offered capacities from the manufacturer, we have chosen Qc = 800 Ah. It is assumed that the LAB operates at a temperature ΘBR ≥ 10 °C. The number of lead-acid cells connected in series is nc = 104 cells.

5.6. Optimization-Based Selection of Lead-Acid Batteries for Large Substations

For the selected parameters of the DEA, another computation was performed, which yielded the vector of optimum parameters popt = [20.65,1,9,3,8]. The optimum temperature obtained in the second computation was Θopt = 20.65 °C. This result is slightly different than that obtained by the first computation. The optimum maintenance mode is also, in this case, mmode,opt = 1. The transmission system operator should stem for the highest possible reliability. This means that Cm,1,opt = 1140 CU/year and Rb,opt = 0.975 are selected. The selected maintenance mode provides the highest reliability of operation. The optimum lead-acid cell capacity is Qc,opt = 600 Ah. The selected capacity is so high due to the high constant loading and the possibility of a random current. The optimum number of cells connected in series is nc,opt = 106 cells. The optimum duration of autonomy is taut,opt = 8 h. The optimum costs are Copt = 2397 CU/year. For the optimally selected optimization parameters according to Equation (24), we have calculated the minimum amount of exchanged air in the BR as Qair = 51.95 m3/h. These costs are only higher due to the higher annuity for purchasing the LAB. The only differences between the two computations are the capacities of the lead-acid cells, which is a result of the higher current loadings of the DC network in the large substation.
Figure 12a shows the results of all objective functions for the second Case. It is obvious that the value of the objective function converges. Figure 12b shows the results of all values of the objective functions.
For each computation case, 10 individual computations were made with a DEA. The optimum parameter differed at the fourth decimal. The objective values were compared. They also differed at the fourth decimal. Thus, the reproducibility was ensured of the optimization algorithm results. Some computations were also performed with the increased population NP = 75. There were no changes of the optimum parameters. Figure 13 shows the courses of all five parameters during the iteration process in a large substation.

6. Comparison between the Conventional and New Selection Method Using Optimization

For Case 1, the selected capacity of lead-acid cells is Qc = 300 Ah using the conventional selection method for the intended autonomy of operation. Using the new method, the selected capacity after optimization is Qc = 250 Ah for the estimated LAB autonomy of 8 h, which is one level lower than the selection according to the conventional method. The number of lead-acid cells is nc = 106 cells according to the new method. According to the conventional method, it is nc = 104 cells. These selections satisfy all the technical requirements of the Standard [8]. Selection according to the new method is cost effective. The highest level of reliability and the lowest H2 emissions in the BR were reached. According to the conventional method, the minimum amount of required air exchange in the BR is Qair = 31.73 m3/h, which is 46% more than the selection using the optimization method. In the event of a failure on the HVAC system for the BR, the gas concentration would rise earlier, with the same mode of operation. Maintenance and explosion protection requirements are part of the optimization process. However, they do not affect the selection of LABs using the conventional method.
Even in example 2, a comparison between the conventional and new selection methods gives similar results. According to the conventional method, we have selected the lead-acid cell capacity Qc = 800 Ah. According to the new selection method, the capacity is Qc = 600 Ah, which is two levels lower than the selection according to the conventional method. For the conventional method, this means significantly higher H2 emissions and higher required airflow ventilation requirements in the BR (Qair = 84.61 m3/h for Qc = 800 Ah).

7. Conclusions

The paper presents the selection process of LABs using the conventional and a new method based on the optimization process, that enables selection, operation, maintenance, and operational safety of BR and LABs for supplying DC auxiliary systems in substations. Conventional methods do not consider the safety, cost efficiency, and maintenance in selection of LABs. For the optimization process, the DEA was used, which takes into consideration technical requirements, cost efficiency, and the reliability of operation of the batteries. The presented optimization procedure employs large datasets for the selection process. The process also requires acquaintance with the relevant Standard, the DC auxiliary network, and the properties of lead-acid cells available on the market.
The DEA proved to be an efficient tool for the selection of LABs for the supply of a DC auxiliary system in substations. The solutions of the optimization problem are optimum parameters (BR temperature, maintenance mode, capacity of lead-acid cells, number of cells connected in series, and the duration of autonomy of supply), taking into consideration the criteria of maximum autonomy of supply, minimum cost, and maximum reliability of operation of lead-acid cells. The most important input parameter is the load current of the DC auxiliary network, which can sometimes be measured; otherwise, it has to be assumed. We performed measurements of load current on the DC auxiliary system supply in two substations, the temporal course of triggering the coil current of the circuit breakers’ drive, and the temperature profile of the area outside the substation building for the year 2018.
In every substation, the criterion of reliability of supply of the DC auxiliary system is a very important factor. The LAB has to have the lowest possible number of outages during its SL. The reliability of operation is connected closely with the battery’s maintenance. The presented calculation results for small and large substations show that the substation operator has to perform the highest maintenance level to achieve the desired reliability. This should also be the uniform LAB maintenance concept of the substation operator. An adequate maintenance level also enables reaching the criterion of the highest autonomy of supply of the DC network with LABs.
In the paper, the cost efficiency also includes the annual cost of electricity consumed for the HVAC device, which depends on the BR and outside temperature. A detailed analysis was carried out of stationary heat transfer through the BR walls to the outside. The actual measured data of outside temperature were used in this analysis.
The new proposed selection method of LABs using optimization combines the technical requirements set by the IEEE 485 Standard, cost effectiveness, operational reliability, including maintenance processes during their lifetime and safety, where H2 emissions are reduced to a minimum (up to 40% in comparison to the conventional method). Based on the comparison between the conventional and new method of selection, it can be concluded that the conventional selection method satisfies the technical criterion only. Maintenance tasks and associated reliability of operation are determined independently of selection. Also, the HVAC device selection for the BR is made independently. The proposed new method using optimization includes them in the selection process. Thus, we achieve the optimum choice of both LAB, as well as maintenance, operational safety BR, and designing of HVAC.
The described concept of LAB selection could also be used for the selection of LABs for large electricity storage facilities used for manual frequency restoration reserves (tertiary control in the old terminology) in the transmission system. An alternative to the use of LABs for supplying the DC auxiliary system supply in a substation could be the use of lithium titanate oxide (LTO) batteries, which have a titanium oxide electrode instead of a graphite one. Thus, a temperature escape is prevented. These batteries have similar voltage characteristics of discharging as the LABs.

Author Contributions

All authors contributed equally to all the sections of this work. Writing—original draft preparation, J.R.; writing—review and editing, J.P., P.K., and R.M.; supervision F.K.; software, J.R. and P.K.; measurements, R.M., J.P.

Funding

The research received no external fundings.

Acknowledgments

The authors gratefully acknowledge ELES TSO for getting access to substations of ELES and providing measurements in a DC auxiliary system, and Lead-Acid Batteries` Manufacturer TAB Mezica for the provided data for lead-acid cells.

Conflicts of Interest

The authors declare no conflict of interest.

References

  1. Parvini, Y.; Vahidi, A.; Fayazi, S.A. Heuristic Versus Optimal Charging of Supercapacitors, Lithium-Ion, and Lead-Acid Batteries: An Efficiency Point of View. IEEE Trans. Control Syst. Technol. 2018, 26, 167–180. [Google Scholar] [CrossRef]
  2. Neto, P.B.L.; Saavedra, O.R.; de Souza Ribeiro, L.A. A Dual-Battery Storage Bank Configuration for Isolated Microgrids Based on Renewable Sources. IEEE Trans. Sustain. Energy 2018, 9, 1618–1626. [Google Scholar] [CrossRef]
  3. Gallo, D.; Landi, C.; Luiso, M.; Morello, R. Optimization of Experimental Model Parameter Identification for Energy Storage Systems. Energies 2013, 6, 4572–4590. [Google Scholar] [CrossRef]
  4. Vrettos, E.I.; Papathanassiou, S.A. Operating Policy and Optimal Sizing of a High Penetration RES-BESS System for Small Isolated Grids. IEEE Trans. Energy Convers. 2011, 26, 744–756. [Google Scholar] [CrossRef]
  5. Salameh, Z.M.; Casacca, M.A.; Lynch, W.A. A mathematical model for lead-acid batteries. IEEE Trans. Energy Convers. 1992, 7, 93–98. [Google Scholar] [CrossRef]
  6. Papic, I. Simulation model for discharging a lead-acid battery energy storage system for load leveling. IEEE Trans. Energy Convers. 2006, 21, 608–615. [Google Scholar] [CrossRef]
  7. Jancauskas, J.R.; Shook, D.A. Optimization of station battery replacement [nuclear plant]. IEEE Trans. Nuclear Sci. 1994, 41, 1384–1388. [Google Scholar] [CrossRef]
  8. IEEE. Recommended Practice for Sizing Lead-Acid Batteries for Stationary Applications. IEEE Std 485-2010 (Revis. IEEE Std 485-1997) 2011, 1–90. [Google Scholar] [CrossRef]
  9. IEEE. Guide for the Design of Low-Voltage Auxiliary Systems for Electric Power Substations. IEEE Std 1818-2017 2017, 1–95. [Google Scholar] [CrossRef]
  10. Sun, Y.; Jou, H.; Wu, J. Aging Estimation Method for Lead-Acid Battery. IEEE Trans. Energy Convers. 2011, 26, 264–271. [Google Scholar] [CrossRef]
  11. Stevanatto, L.C.; Brusamarello, V.J.; Tairov, S. Parameter Identification and Analysis of Uncertainties in Measurements of Lead–Acid Batteries. IEEE Trans. Instrum. Meas. 2014, 63, 761–768. [Google Scholar] [CrossRef]
  12. Liu, X.; Yang, Y.; He, Y.; Zhang, J.; Zheng, X.; Ma, M.; Zeng, G. A new dynamic SOH estimation of lead-acid battery for substation application. Int. J. Energy Res. 2017, 41, 579–592. [Google Scholar] [CrossRef]
  13. Azzollini, I.A. Lead-Acid Battery Modeling Over Full State of Charge and Discharge Range. IEEE Trans. Power Syst. 2018, 33, 6422–6429. [Google Scholar] [CrossRef]
  14. Zhao, X.; Zhang, J.; Chen, C.; Guo, L. Operation Optimization of Standalone Microgrids Considering Lifetime Characteristics of Battery Energy Storage System. IEEE Trans. Sustain. Energy 2013, 4, 934–943. [Google Scholar] [CrossRef]
  15. Ribič, J.; Pihler, J.; Kitak, P. Impact of Electrode Shape on the Performance of a Gas Discharge Arrester. IEEE Trans. Power Deliv. 2015, 30, 463–471. [Google Scholar] [CrossRef]
  16. Glotić, A.; Glotić, A.; Kitak, P.; Pihler, J.; Tičar, I. Parallel Self-Adaptive Differential Evolution Algorithm for Solving Short-Term Hydro Scheduling Problem. IEEE Trans. Power Syst. 2014, 29, 2347–2358. [Google Scholar] [CrossRef]
  17. CENELEC—EN 50272-2—Safety Requirements for Secondary Batteries and Battery Installations Part 2: Stationary Batteries|Engineering360. Available online: https://standards.globalspec.com/std/418395/EN%2050272-2 (accessed on 18 October 2019).
  18. Pavlov, D. Lead-Acid Batteries: Science and Technology; Elsevier: Amsterdam, The Netherlands, 2011. [Google Scholar]
  19. Brzezinska, D. Ventilation System Influence on Hydrogen Explosion Hazards in Industrial Lead-Acid Battery Rooms. Energies 2018, 11, 2086. [Google Scholar] [CrossRef] [Green Version]
  20. Thompson, M.J.; Wilson, D. Auxiliary DC Control Power System Design for Substations. In Proceedings of the 2007 60th Annual Conference for Protective Relay Engineers, College Station, TX, USA, 27–29 March 2007; pp. 522–533. [Google Scholar]
  21. Kim, D.; Cha, H. Kt Factor analysis of lead-acid battery for nuclear power plant. In Proceedings of the 2013 International Conference on Electrical Machines and Systems (ICEMS), Busan, Korea, 26–29 October 2013; pp. 526–529. [Google Scholar]
  22. TC/SC 21, I. IEC 60896-11 Ed. 1.0 b:2002, Stationary Lead-Acid Batteries-Part 11: Vented Types-General Requirements and Methods of Tests; IEC: Geneva, Switzerland, 2003. [Google Scholar]
  23. CEN/TR 12831-2:2017. Energy, Performance of Buildings - Method for Calculation of the Design Heat Load - Part 2: Explanation and Justification. EN 12831-1; Module M3-3; CEN: Brussels, Belgium, 2017. [Google Scholar]
Figure 1. Presentation of a DC auxiliary system in a substation with lead-acid battery (LAB), switching devices and DC auxiliary system loads.
Energies 12 04400 g001
Figure 2. Generalized duty cycle for the autonomous operation of a LAB.
Energies 12 04400 g002
Figure 3. Lead-acid battery selection process using the optimization algorithm.
Energies 12 04400 g003
Figure 4. Oscillogram of the measured DC current of protection and control system’s DC auxiliary system in a small substation.
Energies 12 04400 g004
Figure 5. Oscillogram of the measured circuit breaker triggering coil current.
Energies 12 04400 g005
Figure 6. Temperature profile of the outer side of the building in the year 2018.
Energies 12 04400 g006
Figure 7. Annual costs of the heating, ventilation, and air conditioning (HVAC) device in the battery room (BR) for various BR temperatures in a small substation.
Energies 12 04400 g007
Figure 8. The results of all objective functions and all objective functions values for small substation: (a) Results of all objective functions; (b) Results of all values of the objective functions.
Energies 12 04400 g008
Figure 9. The results of optimization parameters in various iterations for a small substation.
Energies 12 04400 g009
Figure 10. Oscillogram of the measured DC current of protection and control system’s DC auxiliary system in a large substation.
Energies 12 04400 g010
Figure 11. Annual costs of the HVAC device in the BR for various BR temperatures in a large substation.
Energies 12 04400 g011
Figure 12. The results of all objective functions and all objective function values for large substation: (a) Results of all objective functions; (b) Results of all values of the objective functions.
Energies 12 04400 g012
Figure 13. The results of optimization parameters in various iterations for a large substation.
Energies 12 04400 g013
Table 1. Fourth-degree polynomial coefficients for various depths of lead-acid battery discharging.
Uc,min [V/Cell]a1a2a3a4a5
1.81−8.7584⋅10−111.0610⋅10−7−4.4639⋅10−522.9857⋅10−31.0599
1.75−1.7060⋅10−101.8196⋅10−7−6.5694⋅10−524.5160⋅10−30.7513
1.69−1.0067⋅10−101.6330⋅10−7−4.5739⋅10−523.6610⋅10−30.5792
Table 2. Active table for the selection of lead-acid battery capacity for Case 1.
Lead-Acid Batteries Capacity Sizing by Standard IEEE 85-2010, Using KT; Case 1
pIp [A] Ip – Ip− 1 [A]Mp [min]Tp [min]KT,p [h] Q1 = (IpIp 1)⋅KT,p =
Section 1—First Period
p = 1I1 = 3.83I1−0 = 3.83M1 = 480T1 = M1 = 480830.64Ah
S = 1TOTAL30.64Ah
Random Equipment Load
pIR [A] IR−I0 [A]MR [min] TR [min]KT,R [h]QR= (IR − 0)⋅KT,R =
p = RIR = 127.14IR − 0 = 127.14MR = 1TR = MR = 11,1139.85Ah
Max Section Capacity Size30.64Ah +Random Section Q139.85Ah =170.49Ah
Uncorected Capacity Size170.49Ah× Temp. Correction1.19×Aging Factor1.25
×Design Margin1.15= Total needed Q of cell =291.65Ah--

