Article

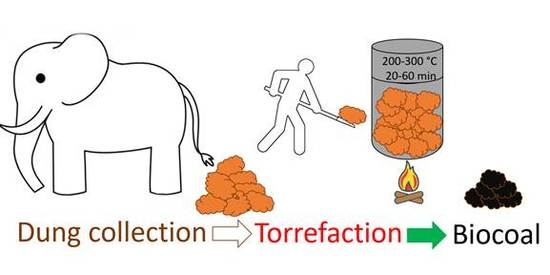
Waste to Carbon: Biocoal from Elephant Dung as New Cooking Fuel

by
Paweł Stępień
1,
Kacper Świechowski
1,
Martyna Hnat
1,
Szymon Kugler
2,
Sylwia Stegenta-Dąbrowska
1,*,
Jacek A. Koziel
3,
Piotr Manczarski
4 and
Andrzej Białowiec
1,3
1
Institute of Agricultural Engineering, Faculty of Life Sciences and Technology, Wroclaw University of Environmental and Life Sciences, 37a Chełmońskiego Str., 51-630 Wroclaw, Poland
2
Polymer Institute, Faculty of Chemical Technology and Engineering, West Pomeranian University of Technology, 10 Pułaskiego Str., 70-322 Szczecin, Poland
3
Department of Agricultural and Biosystems Engineering, Iowa State University, Ames, IA 50011-3270, USA
4
Department of Environmental Engineering, Hydro and Environmental Engineering, Faculty of Building Services, Warsaw University of Technology, 00-661 Warszawa, Poland
*
Author to whom correspondence should be addressed.
Energies 2019, 12(22), 4344; https://doi.org/10.3390/en12224344
Submission received: 10 September 2019 / Revised: 9 November 2019 / Accepted: 12 November 2019 / Published: 14 November 2019
(This article belongs to the Special Issue Biomass Wastes for Energy Production)

Abstract

:
The paper presents, for the first time, the results of fuel characteristics of biochars from torrefaction (a.k.a., roasting or low-temperature pyrolysis) of elephant dung (manure). Elephant dung could be processed and valorized by torrefaction to produce fuel with improved qualities for cooking. The work aimed to examine the possibility of using torrefaction to (1) valorize elephant waste and to (2) determine the impact of technological parameters (temperature and duration of the torrefaction process) on the waste conversion rate and fuel properties of resulting biochar (biocoal). In addition, the influence of temperature on the kinetics of the torrefaction and its energy consumption was examined. The lab-scale experiment was based on the production of biocoals at six temperatures (200–300 °C; 20 °C interval) and three process durations of the torrefaction (20, 40, 60 min). The generated biocoals were characterized in terms of moisture content, organic matter, ash, and higher heating values. In addition, thermogravimetric and differential scanning calorimetry analyses were also used for process kinetics assessment. The results show that torrefaction is a feasible method for elephant dung valorization and it could be used as fuel. The process temperature ranging from 200 to 260 °C did not affect the key fuel properties (high heating value, HHV, HHVdaf, regardless of the process duration), i.e., important practical information for proposed low-tech applications. However, the higher heating values of the biocoal decreased above 260 °C. Further research is needed regarding the torrefaction of elephant dung focused on scaling up, techno-economic analyses, and the possibility of improving access to reliable energy sources in rural areas.

Graphical Abstract

1. Introduction

It is estimated that there are around~450,000 elephants today, of which 400,000 are in Africa and 50,000 in Asia. In Africa, these mammals live in 34 countries (Angola, Benin, Botswana, Burkina Faso, Cameroon, Central African Republic, Chad, Congo, Ivory Coast, Equatorial Guinea, Eritrea, Ethiopia, Gabon, Gana, Guinea, Bissau, Kenya, Liberia, Malawi, Mali, Mozambique, Namibia, Niger, Nigeria, Rwanda, Senegal, Sierra Leone, Somalia, South Africa, Sudan, Tanzania, Togo, Uganda, Zambia, Zimbabwe), and on the Asian continent they can be found in 15 countries (India, Nepal, Bhutan and Bangladesh, China, Burma, Thailand, Cambodia, Laos, Vietnam, Malaysia, Andaman Islands, Sri Lanka, Sumatra, Borneo) [1]. The daily amount of dung produced by one elephant is 100–150 kg. The weight of elephant excrement depends on the amount of consumed water [2,3,4]. Thus, taking into consideration the conservative estimate of the minimum dung weight (100 kg), the daily and annual dung production on a global scale is 45,000 Mg and more than 16 million Mg, respectively, i.e., a large amount of biowaste that could be valorized [2,3,4].
From an ecological point of view, untreated animal waste or handling, air-drying and combustion without prior treatment can be problematic due to health and environmental concerns, such as elevated risk of contamination with pathogens, contamination of drinking water sources, gaseous emissions of odor, hydrogen sulfide, ammonia, and other toxic gases [5,6]. In addition, the loss of nutrients from dung associated with current practices can also represent economic losses due to its lower value as a fertilizer [5].
We propose a solution to these problems with the introduction of the torrefaction process to manage and valorize the elephant dung. Resulting biocoal can be used as a fuel with a useful high heating value (HHV). Research with slow pyrolysis and hydrothermal carbonization of other types of livestock manure resulted in HHVs ranging from 15.8 to 18.4 MJ/kg [7]. Qambrani et al. [8] showed that biocoal from animal manure contains more N compared to biochar from plant residues. Although the pore structure is more organized in biochar from plant sources, the fertilizer quality and heavy metal adsorbability were found to be excellent in manure biochars. On the other hand, some raw waste types (such as poultry manure or sewage sludge) can contain a large amount of copper and zinc, which limits its use as a fertilizer. The proposed concept to valorize elephant manure can provide new technologies for using the torrefaction process in rural areas, which can be used to obtain better quality fuel and fertilizer.
To date, several methods to valorize elephant dung have been proposed. Vermicomposting is a biological process in which the organic fraction of dung is decomposed by microorganisms and earthworms under controlled environmental conditions to a level when it can be applied on arable land. This method can be ecological and economically profitable [9]. Vermicomposting of animal dung from the zoo was investigated in pilot-scale by a team of scientists in Mexico [6]. Elephant dung was also used for research by scientists in Thailand for the production of biogas in co-fermentation with water hyacinth and fermentation on a laboratory scale. In the case of co-fermentation, the calorific value of biogas was 15.05 MJ·m−3 [10,11].
Biohydrogen production through anaerobic mixed cultures of microorganisms found in elephant dungs was also researched in laboratory conditions. It is based on simultaneous saccharification and fermentation of cellulose. The bacteria break down the cellulose to glucose, and then non-cellulolytic bacteria from the formed glucose produces hydrogen [12,13]. The microorganism’s culture from elephant dung stimulated the production of H2 from cellulose. It was assumed that cellulolytic bacteria in the dung originate from the plant diet of the elephant. Animal manure, including elephant dung, was also the subject of research conducted in Thailand on cellulolytic bacteria for the direct production of butanol from cellulose, which could be an alternative to fuel obtained from petroleum [14].
The knowledge about practical considerations for the valorization of elephant dung and the progression from lab to full-scale (e.g., costs of construction and operation ) is limited. There are also questions about the storage and distribution of finished products (e.g., fuel briquettes for cooking), which could be prohibitively expensive for long-range transport. Life-cycle analyses could be useful to assess the critical transport range [15]. It is equally important to consider managing the residues (e.g., raw dung and sludge), which may require specialized collection, storage, treatment, and disposal. It has not been described yet how existing or developing technologies (anaerobic digestion, biohydrogen production) could be used for waste management, especially in rural regions in which elephant dung is available in large quantities. Thus, there is a need to find local-scale solutions suited for these regions, which should be safe, inexpensive, simple to build, use and maintain, dependable, and not generating another waste stream to manage.
We propose an alternative solution for elephant dung management via torrefaction (Figure 1). Torrefaction (a.k.a., ‘roasting’ or low-temperature pyrolysis) is a thermochemical process occurring at 200–300 °C without the presence of an oxidant. Jia et al. [16] described the possibility of using a co-gasification of woody biomass and animal manure as a useful technology to utilize organic waste, which could be practical in the case of elephant dung as well. The elephant dung fuel produced may be an attractive source of rural fuel. For example, in India alone, 6.3% of all households use the so-called ‘dung cake’ to produce the energy needed for cooking [17]. Assuming 1.34 billion people in India in 2018 [18] and that one household comprises 10 people, as many as ~8.4 million households use dung cake for energy production. Although the torrefaction process requires some energy, it is also the most promising technology for organic waste treatment for its highest greenhouse gas mitigation potential [19]. The produced biocoal, especially when pelletized, poses a lower environmental risk during transport, storage, and combustion, in addition to lowering the risks of sanitary and aquatic pollution [20,21]. Therefore, torrefaction could be one of the potential technologies for elephant dung utilization that are sustainable.
To date, no work has been carried out on the torrefaction of elephant dung as a method for the production of fuel. Local-scale torrefaction can address challenges with dung management, through its valorization, while improving the socio-economic situation in rural households. Therefore, the research carried out was aimed at determining:
  • Whether torrefaction can be used as a method of preliminary valorization of elephant dung;
  • Whether the duration of the torrefaction process at a given temperature affects the dung conversion rate (e.g., mass loss, energy densification, and improved fuel properties);
  • Whether energy consumption is needed for the torrefaction of elephant dung.

2. Materials and Methods

2.1. Feedstock

The study used Asian elephant dung from the Zoological Garden, located in Wrocław, Poland. The 5 kg sample was dried at 105 °C for 24 h in a laboratory dryer, followed by milling to the grain size of ≤0.425 mm with the laboratory knife mill (TESTCHEM, model LMN-100, Pszów, Poland) to make the sample homogeneous. Samples were frozen at −15 °C for further testing.

2.2. Biocoal Production Method via Torrefaction

A scheme of the experiment is shown in Figure 2. The biocoal production process was carried out in triplicates according to the methodology presented by [22] at six temperatures from 200 to 300 °C (20 °C intervals) at 20, 40, 60 min for each interval, followed by the cooling phase. The biocoals were generated using a muffle furnace (Snol, model 8.1/1100, Utena, Lithuania). CO2 inert gas was provided to the furnace to ensure non-oxidative conditions. The elephant dung samples were heated from 20 °C to set point at 50 °C·min−1. The cooling times were 38 min, 33 min, 29 min, 23 and 13.5 min, from torrefaction setpoints of 300 °C, 280 °C, 260 °C, 240 °C, and 220 °C to 200 °C, respectively. After the CO2 supply was cut off, the biocoals were removed from the furnace when the interior temperature was <200 °C. The mass of the sample was determined before and after the cooling process in order to calculate the mass loss. Dung samples of 10 ± 0.5 g (dry mass, d.m.) were used to produce biocoal.

2.3. Proximate Analysis of Raw and Torrefied Elephant Dung

Physical and chemical properties were subjected to raw material and produced biocoals. The following tests were made in three replicates using the following standard methods:
  • Moisture content (MC) by means of a laboratory dryer (WAMED, model KBC-65W, Warsaw, Poland) at temperature 105 °C, time 24 h, in accordance with the PN-EN 14346:2011 standard [23],
  • Organic matter content (OM) by means of a laboratory dryer (WAMED, model KBC-65W, Warsaw, Poland) at temperature 550 °C, time 4 h, in accordance with the PN-EN 15169:2011 standard [24],
  • ash and combustible parts (CP) by means of a laboratory dryer (WAMED, model KBC-65W, Warsaw, Poland) at temperature 815 °C, time 4 h in accordance with the PN-Z-15008-04:1993 standard [25],
  • High heating value (HHV) by means of the IKA C2000 Basic calorimeter, at 17–25 °C, 30 bar pressure in accordance with the PN-G-04513:1981 standard [26].

2.4. Thermogravimetric Analysis (TGA) of Elephant Dung

Thermogravimetric analyses (TGA) were first performed in isothermal conditions to determine the kinetics parameters (k—reaction rate constants and Ea—activation energy) of the torrefaction process of elephant dung. Reaction rate constants were determined for the following temperatures: 200 °C, 220 °C, 240 °C, 260 °C, 280 °C, and 300 °C in accordance with the methodology and reactor set-up presented elsewhere [22]. First, the empty furnace was pre-heated to the set point. Then, 3 g of dry dung was placed in the steel crucible and placed in the furnace for 1 h. Measurement of mass loss was performed using a balance coupled to a steel crucible at 10 s intervals with 0.01 g accuracy. The calculating methodology for the kinetic parameters is presented in Section 2.6.2. The kinetics parameters (reaction rate and activation energy) were calculated.
TGA analyses were also completed in non-isothermal conditions to obtain more comprehensive data on the thermal degradation of elephant dung. These TGA analyses were performed at rising temperatures (from 20 °C to 850 °C) at a heating rate of 650 °C·h−1 (10.83 °C·min−1). The sample was heated for 2 min after reaching a set point. The study of kinetic parameters and thermal degradation was performed using the stand-mounted tubular furnace (Czylok, RST 40x200/100, Jastrzębie-Zdrój, Poland).

2.5. Differential Scanning Calorimetry (DSC) of Raw Elephant Dung

Differential scanning calorimetry (DSC) analysis was carried out using a differential scanning calorimeter (TA Instruments, DSC Q2500, New Castle, DE, USA). Approximately 6 mg of the tested material was weighed into the aluminum hermetic crucible. Each sample (n = 1) was then placed in the analyzer and heated from 10 °C to 300 °C at a heating rate of 10 °C·min−1. The N2 inert gas was supplied at 3 dm3·h−1 flowrates. The analysis provided information on endothermic and exothermic changes during torrefaction.

2.6. Data-Processing Calculation Methods

2.6.1. Mass Yield, Energy Densification Ratio, and Energy Yield

The mass yield, energy densification ratio, and energy yield of each of the variants were determined based on Equations (1)–(3), respectively [27]:
M Y = m b m a · 100
where:
  • MY—mass yield, %
  • ma—the mass of dry elephant dung before torrefaction, g,
  • mb—the mass of dry biocoal after torrefaction, g.
E D r = H H V b H H V a
where:
  • EDr—energy densification ratio, -,
  • HHVb—the high heating value of biocoal, J·g−1,
  • HHVa—the high heating value of raw elephant dung, MJ·kg−1.
E Y = M Y · E D r
where:
  • EY—nergy yield, %,
  • MY—mass yield, %
  • EDr—energy densification ratio, -,
The ash-free value of the HHV was determined based on [28]:
H H V d a f = H H V M f M a s h
where:
  • HHVdaf—high heating value on dry and ash-free base, MJ·kg−1,
  • HHV—high heating value, MJ·kg−1,
  • Mf—dry mass of fuel, kg,
  • Mash—the mass of ash in fuel, kg.

2.6.2. Calculation of Kinetics Parameters (Reaction Rate and Activation Energy)

The data obtained from isothermal TGA analysis were used to determine the reaction rate (k) constant for each temperature, based on the first-order model [22]:
m s = m o · e k · t
where:
  • ms—mass after time t, g,
  • mo—initial mass, g,
  • k—the reaction rate constant, s−1,
  • t—time, s.
The nonlinear estimation of k in Equation (5) for each temperature was made with the Statistica 13.3 software (StatSoft, Inc., TIBCO Software Inc. Palo Alto, CA, USA). The Arrhenius plot was created (ln(k)(T) vs. 1/T) on the basis of k values for individual temperatures [29], and a trend line was found:
y = a · x + b
Then, the activation energy (Ea) values [22] were determined as follows:
E a = ( a · R )
where:
  • Ea—activation energy, J∙mol−1,
  • a—the coefficient from Equation (6), K,
  • R—gas constant, J∙mol−1∙K−1.

2.6.3. Calculation of Energy Demand for Torrefaction of Elephant Dung

The results from the DSC and TGA analyses were used to calculate the actual energy demand in processing dry elephant dung (to heat dung from 20 °C to 300 °C) in accordance with the methodology presented in a previous paper [30]. The lack of TGA analysis causes overestimated energy amount needed to process the material, due to the decreasing amount of material during torrefaction caused by its devolatilization. The following is an example of the model use where the calculation for 1 g of the raw elephant dung torrefied at 300 °C was considered. The total amount of energy needed to processing raw elephant dung was calculated by adding the energy needed to evaporate water from raw elephant dung to the result from the model of dry elephant dung. The energy needed to evaporate water was calculated by Equation (8) [31]:
Q = m · T · c p + m · c o
where:
  • Q—the total amount of heat needed to heat and evaporate water, J,
  • m—the mass of water in the sample, g,
  • ΔT—the temperature difference between ambient temperature (20 °C) and boiling point (100 °C), under normal pressure conditions, °C,
  • cp—specific heat of water, 4.2 J·(g·°C)−1,
  • co—the heat of water evaporation, 2257 J·g−1.

2.6.4. Modeling of Torrefaction Process and Biocoal Fuel Properties

Polynomial models of the influence of torrefaction temperature and time on torrefaction process and biocoals fuel parameters were developed. These models were based on measured data from the torrefaction process, and biocoal properties for a particular temperature and time using a similar modeling approach described in our previous work [32]. Equations describing MY, EDr, EY, organic matter content, combustible parts, ash, HHV, and HHVdaf for biocoal were developed. The general form of the applied polynomial equation was:
f ( T , t ) = a 1 + a 2 · T + a 3 · T 2 + a 4 · t + a 5 · t 2 + a 6 · T · t + a 7 · T 2 · t 2
where:
  • f(T,t)—the property (T, t, & combinations) being analyzed,
  • a1—intercept,
  • a2a7—regression coefficient,
  • T—process temperature, °C,
  • t—process time, min.
Regression analysis used a 2-degree polynomial with a general form, with intercept (a1) and six regression coefficients (a2a7). The confidence interval of the parameter evaluations (a1a7) was 95%. All parameters for which the results of p-value were <0.05, were assumed to be statistically significant. The results of the analysis are presented in the form of equations. as well as the correlation coefficients (R) and determination coefficients (R2). The results of the DSC analysis were also subjected to polynomial regression analysis in order to determine a useful model of the specific heat (SH) of elephant dung for 200–300 °C. The polynomial regression analysis was used because the torrefaction process has a non-linear character. The results were presented in the form of an equation describing the dependence of the change of specific heat of elephant dung as a function of temperature. The general form of the polynomial used is in the form of Equation (10). Nine regression coefficients were used to provide a higher level of matching model to raw data.
S H = a 1 + a 2 · T + a 3 · T 2 + a 4 · T 3 + a 5 · T 4 + a 6 · T 5 + a 7 · T 6 + a 8 · T 7 + a 9 · T 8
where:
  • SH—specific heat of elephant dung as a function of temperature, J·(kg·°C)−1,
  • a1—intercept,
  • a2a9—regression coefficient,
  • T—torrefaction temperature, °C.
Nonlinear regression and evaluation of intercepts and regressions coefficients (p < 0.05) were completed with Statistica software (13.3, StatSoft, Palo Alto, CA, USA).

2.6.5. Statistical Analysis

An analysis of variance (ANOVA) evaluation of differences between mean values was performed with the application of post-hoc Tuckey’s test, at the p < 0.05 significance level. For statistical data evaluation, the Statistica software (13.3, StatSoft, Palo Alto, CA, USA) was used.

3. Results

3.1. Result of the Torrefaction Process

The mass yields (MY) for elephant dung biocoals (Figure 3) showed a downward trend with the increase of process temperature. The highest mass yields values were obtained for biocoal generated at 200 °C and were above 90%. The lowest MY was for 300 °C, in this case, the mass yield decreased to 66%. All regression coefficients were statistically significant (p < 0.05) in the MY model, (R2 = 0.75) (Table 1). Detailed MY data are shown in Table A2.
The energy yield (EY) of the biochar from elephant dung (Figure 4) also decreased with the increase of temperature and did not change with time. The biocoals produced at 200 °C resulted in more than 105% EY compared to raw material. However, the EY dropped below 68% for torrefaction at 300 °C. All regression coefficients were statistically significant (p < 0.05) for the EY model (R2 = 0.85) (Table 2).
The energy densification ratio (EDr) in biocoals generated from elephant dung (Figure 5) decreased with increasing temperature and did not change much with time. Biocoals produced at 200 °C had the highest EDr of ~1.1, while biocoals generated at 300 °C had the lowest EDr (~0.9). All regression coefficients were statistically significant (p < 0.05) for the EDr model (R2 = 0.83) (Table 3).

3.2. Result of Proximate Analysis of Raw and Torrefied Elephant Dung

The content of organic matter (OM) decreased as the temperature and the retention time increased. The lowest OM value was 28.26% for torrefaction at 280 °C and 60 min, and for torrefaction at 300 °C in time 20 min and 40 min (Figure 6, Table A1). Analysis of variance showed that statistically significant differences occur between the results obtained at 260 °C, 280 °C, and 300 °C, (p < 0.05) (Figure A1, Table A3). All regression coefficients were statistically significant (p < 0.05) for the OM model (R2 = 0.83) (Table 4).
The ash content was inversely proportional to the OM content and increased to over 71% in comparison to 50.81% for raw dung (Table A1) in biocoal produced at 280 and 300 °C at 60 min (Figure 7). Analysis of variance showed statistically significant differences between the results for temperatures 260 °C, 280 °C, and 300 °C (p < 0.05), (Figure A2, Table A4). All regression coefficients were statistically significant (p < 0.05) for the ash content model (R2 = 0.83) (Table 5).
The content of combustible parts (CP) decreased with time and the rise of the process temperature. Raw elephant dung had a CP = 48.9% (Table A1). During the torrefaction, the CP decreased to 28.6% at 60 min and 300 °C (Table A1, Figure 8). The analysis of variance showed numerous statistically significant differences, the majority of which occurred between 260 °C, 280 °C, and 300 °C (Table A5, Figure A3). All regression coefficients were statistically significant (p < 0.05) for the CP model (R2 = 0.67) (Table 6).
The decrease in the HHV of the biocoals produced from the elephant dung was observed along with the increase of temperature and time (Figure 9, Table A1, Figure A4). The highest HHV was obtained for the biocoal generated at 200 °C and 60 min. A similar trend was discovered by Li et al., [33]. They explained this phenomenon by the effect of specific biocoal properties (pH; C, H, N, S, O content; specific surface area) and noticed also a possibility of predicting the biocoal yield of a group of feedstocks with similar physiochemical properties.
The average HHV was 13 MJ∙kg−1 and was higher than the HHV of raw elephant dung (by 1.59 MJ·kg−1) and higher than the lowest HHV for the biocoal obtained at 300 °C and 60 min (by 6.51 MJ·kg−1). The HHV is affected by the high ash content in the biocoals and raw material. Thus, it was decided to estimate the value of HHV on an ash-free basis (HHVdaf). The highest average HHVdaf was obtained for the biocoal generated at 280 °C and for 60 min (27.20 MJ·kg−1) (Figure 10, Table A1). Regression coefficients for the HHV and HHVdaf were statistically significant (p < 0.05), the proposed model worked well for HHV but was less representative for HHVdaf (R2 were 0.74 and 0.21, respectively) (Table 7 and Table 8). Analysis of the variance of average values of HHV showed statistically significant differences between the results for 280 °C and 300 °C and 40 & 60 min (p < 0.05) (Figure A4, Table A6). This result has practical implications for the collection and initial processing of elephant dung to minimize mineral ash content and impurities and to maximize the HHV.

3.3. Result of the Thermogravimetric Analysis (TGA) of Elephant Dung

Table 9 summarizes kinetics parameters based on the TGA analyses and the mass loss data.
The obtained values of k were analyzed by ANOVA, which showed that there were statistically significant differences (p < 0.05) for biocoal produced at 300 °C, and those obtained at 200 °C, 220 °C, 240 °C, and 260 °C, respectively. There were no statistical differences between k for 280 and 300 °C and k for 200–260 °C range. Kim et al. indicated that different optimal temperatures should be selected for different types of manure to maximize the energetic retention efficiency [34]. The energy yield of hydrochar (48.0–71.9%) is higher than that of pyrolysis char (31.5–52.4%), implying that the carbonization process, rather than the reaction temperature, is also a key factor that affects the energy yield of manure [35]. The TGA analysis showed the most substantial mass decrease in the first repetition to 54% of the initial mass of the sample, while in the second and third repetitions, the mass decreased to 64% and 62%. The loss of mass began at a temperature of ~300 °C, and it started to stabilize after exceeding ~600 °C (Figure 11).
New knowledge on the substrates of elephant dung was gained from the TGA analyzes. There was a characteristic peak start at ~330 °C with a maximum at ~500 °C, most likely related to the decomposition of undigested (by elephant) cellulose and lignin from consumed biomass. The decomposition of cellulose and lignin takes place at 305–375 °C and 250–500 °C, respectively [36]. No degradation of hemicellulose was observed based on the DTG (derivative thermogravimetry) analysis. The decomposition of hemicellulose takes place at 225–325 °C [36]. However, the apparent lack of mass change in this temperature range (Figure 11) does not necessarily indicate a lack of hemicelluloses content. It is also likely that particular decompositions could be superimposed [36] and could not be detected by the lack of precision of the used thermogravimetric analyzer.

3.4. Differential Scanning Calorimetry (DSC) of Elephant Dung

DSC analysis showed that during heating, two endoenergetic transformations occurred (Figure 12).
At the beginning of the experiment, the energy was supplied to the sample to raise the temperature of the system. The first observation was that transformation began at 37 °C. Here, the energy was delivered to heat a sample and to initiate its transformation, which reached its maximum value at 80 °C and ended at 146 °C. The total energy demand for this first transformation was 66.17 J·g−1. After the first transformation ended, the energy needed only for heating the sample was supplied to the system (146–158 °C). The second transformation began at 158 °C, reached its maximum at 216 °C, and ended at 252 °C, requiring only 9.76 J·g−1. After the second transformation occurred, the energy required for heating decreased significantly. After T > 252 °C the exothermic reaction occurred.
The total energy demand for the whole process including heating and transformations of dry elephant dung was 485.37 kJ·kg−1 for the −20 to 300 °C range. The estimate for process energy demand calculated by model for torrefaction [30] decreased to 484.81 kJ·kg−1, and it was due to mass loss during the process. In addition, the heating and evaporation of the water contained in raw elephant dung (moisture content 49.19%), results in the additional 1275.49 kJ·kg−1 (Equation (8)) energy demand. Thus, the total energy demand for processing of raw elephant dung (heating, moisture evaporation, and torrefaction) is 1760.30 kJ·kg−1.

4. Discussion

4.1. The Impact of Technological Parameters on the Efficiency of the Process

A related torrefaction study carried out on cow manure showed that the MY of torrefaction decreased with the increase of the process temperature [37], similar to the finding in this research. The torrefied elephant dung (200–300 °C at 40 min) had the MY of 100–68%, whereas it was 90–55% for cow manure at the same process conditions [37]. Differences in MY could be explained by a greater decomposition of biodegradable substrates at lower temperatures. Also, elephant dung had higher moisture and OM content compared with the cow manure. In addition, it has been reported that it is possible to change specific surface area (SSA) as a result of morphological changes due to thermal condensation, and it could be exploited in different materials [38]. The energy yield of torrefaction of cow manure decreased from around 92% at 200 °C to approximately 57% at 300 °C, whereas elephant dung were of 110% and 60%, respectively. The EDr ratio for cow manure had the same downtrend as elephant dung [37]. It was also noticed that there are different degradation processes in the studied range of 200–300 °C. Lignocellulose degradation occurs at approximately 120 °C; hemicellulose degradation occurs at 200–260 °C; cellulose degradation occurs at 240–350 °C; while lignin degradation occurs at 280–350 °C [39], which due to the observation of narrow temperature ranges could have affected the lack of a decrease or increase trend in the case of obtained moisture and MY.

4.2. Proximate Analyses of Elephant Dung and Biocoals

The average moisture content in the elephant dung was 49.19%. The moisture content of dung depends on the amount of water consumed by the animal. For example, pig manure could have a moisture content of ~35–82%, whereas cow manure is of ~66–97% [40,41,42]. In the case of poultry manure, moisture content ranges from ~5 to 40% [40]. The OM content in the studied elephant dung was 48.09% (d.m.). For comparison, the OM content for Indian elephant and rhinoceros were 52% and 56%, respectively [43]. For yet another case of the cattle manure, an OM content was ~74% [44]. These OMs are much lower than those reported in related torrefaction studies for pruned biomass of Paulownia (90%) [45], or brewery spent grain (96%) [46].
The elephant dung had a higher ash content (50.81%, d.m.) than the maximum content of ash in pig manure (21.4% d.m.), cow manure (32.8% d.m.) and chicken manure (34% d.m.) [40,47]. The HHV of elephant dung was 11.41 MJ∙kg−1 and was lower than HHV in chicken manure (13 MJ·kg−1), cow manure (12.7–17.2 MJ∙kg−1), or pig manure (18.1–19.5 MJ∙kg−1) [37,40,41,48]. The low value of HHV is likely caused by high ash content, i.e., the calculated ash-free HHV was as high as 23 MJ∙kg−1.
The HHV of the torrefied dung was not much higher than the raw sample (Table A1). For biocoal, the highest HHV was 13 MJ·kg−1 (260 °C, 60 min), and a further increase in temperature and time caused a decrease in its value. The low increase of HHV in comparison to the raw base for cow dung was reported by Pahla et al. [37] and HHV increased from 16.78 to 18.64 MJ·kg−1 (at 300 °C). A small increase of HHV in dung biocoal is directly affected by a low amount of fixed carbon (high amount of ash content). During torrefaction, fixed carbon is enhanced by thermal degradation of hemicellulose and part of cellulose and lignin [49]. The decomposition of these constituents results in releases of compounds with low energy content, leaving organic compounds with higher energy content [50]. Cow manure, similarly to elephant dung did not experience high HHV enhancement likely because it had less OM and more ash content. Pulka et al. [28] tested sewage sludge via torrefaction and met the same problem—the highest value of HHV for biocoal generated at 260 °C, 60 min, and further temperature increase decreased HHV. Therefore, it may be assumed that at a temperature > 260 and time > 60 min, some organic components from elephant dung and sewage sludge start to decompose and release volatiles with higher energy content.
There was no observed relationship between the moisture content and the process temperature and time for the biocoals from elephant dung. This is likely because dry material was used for the torrefaction process. Small differences in the moisture content of biocoals can result from the time between their generation and the determination of the moisture content experiment. Stored biocoals can adsorb moisture (e.g., from the air), making biomass-derived fuels less advantageous compared with coal [50].
There was a sharp drop in the OM and the simultaneous increase in ash content for torrefaction above 260 °C. This also caused a decrease of HHV and an increase in the HHVdaf, especially in the biocoals produced at 260 °C and 300 °C. A practical implication is that the torrefaction process conducted at temperatures from 200 °C to 260 °C (regardless of time) will have a small impact on the decrease of HHV of biocoals.
Furthermore, it could be recommended that torrefaction at 200 °C for 20 min (lowest temperature and shortest time) is needed for the maximization of the HHV and minimization of the cost of the torrefaction process. In addition, a lack of significant differences (p < 0.05) in 200–260 °C allows us to use torrefaction of elephant dung as a low-tech technology, i.e., one that can be controlled without an accurate measurement system. It is especially important for rural areas. Also, during torrefaction of a more substantial amount of the dung, it would be challenging to evenly heat and then cool down fast all the processed material. However, based on the apparent lack of effect in this research, the risk of generating substandard biocoals appears to be relatively low.
The highest HHVdaf value (27.2·MJ∙kg−1) was observed for 280 °C, 60 min (Table A1). This value is theoretical, and it is worth considering ways of reducing the ash content in the elephant dung, because it may have a high energetic potential after processing. Considering ash-free elephant dung after torrefaction, it is possible to obtain better solid fuel than commercially-available pellets. For example, pellets made from pine sawdust, wheat straw, corn settlements, agricultural residues have HHV of 19.5, 17.5, 18.8, 18.1 MJ∙kg−1, (HHVdaf 19,6, 19.0, 19.0, 19.8 MJ∙kg−1) (Table A8) respectively [51]. These values are still relatively low when compared to ash-free biocoal from elephant dung of 27.2 MJ∙kg−1.
The ash in elephant dung is derived from two primary sources, (1) ash introduced during collecting, transporting, storing, and processing, (2) biogenic ash inside plant tissue consumed by an elephant. The sum of these sources is referred to as ash content. Biogenic ash could be removed from biomass using air separation. For woody pine forest residue, air separation costs ~2.23 $·Mg−1 of biomass to reduce 40% of total biogenic ash to <7% of total biomass [52]. Ash could also be removed from biomass cells via chemical pre-processing that solubilize it. Here, knowledge of the exact morphology and chemical state of the ash is needed to determine the most effective removal methods [52]. From a practical point of view, elephant dung should be collected with the least soil impurities as possible. Next, during transportation, drying, etc. the dung should not be exposed to dust. If prevention is not enough, air separation could be considered, due to its relatively low operational cost. Nevertheless, dung morphology is important factor for air separation. Dung is much more brittle and lighter than wood. Because of this, chipped particles of dung could be lighter than mineral impurities causing the different share of ash in particular fractions than in the case of wood. Although some chemical pre-processing technologies have a high level of ash removal (over 90% removal of alkaline earth and alkali metals) [52], their technological infrastructure and cost would be difficult to adopt in underserved areas.
Another important aspect is the issues related to the supply chain, which may influence the quality of biocoal and efficiency of the process. The collection of elephant dung has a dispersed character with a random accumulation ratio in one specific localization, especially when elephants live in natural habitats. The dung usually is collected directly from the ground, which may increase the ash content. However, when dung is exposed to climatic conditions (especially to wind and sun), the overall effect might be beneficial to drying, which brings benefits related to transportation and torrefaction efficiency. Pre-dried material is more suitable for collection, transportation (less water to be transported), and is less prone to decay. In the case of breeding of elephants or using them as work animals (as practiced in South-East Asia), the accumulation of dung in one specific area is more likely. Natural drying maybe not be sufficient. Therefore, one solution could be pre-drying in the dedicated dryer, which could use a warm air stream for water removal. Solar energy could be used as a heat source. Such solution could solve several practical problems: i) the long-range transport of untreated and wet dung to processing sites that is energy inefficient, while a significant portion of the transportation costs are being used to transport water [5]; ii) the long-term storage of raw biomass can be problematic and impractical because the piled biomass can decompose over time resulting in the decrease of useful HHV [7].

4.3. Thermogravimetric Analysis of Raw Material and Kinetic Parameters of Torrefaction

Reported TGA analyses of elephant dung are the first of their kind in the literature. A comparison of kinetic parameters with the literature is then confounded because of the variety of determination methods used for other materials. For this reason, we discuss the kinetics of a subset of the most common and related substrates. We considered the elephant diet consisting mostly of grasses, and the activation energy for some grass plants is available. The activation energy of wheat straw and sorghum determined for the 250–450 °C range was 176 kJ·mol−1 and kJ·mol−1, respectively [53]. For comparison, lignocellulose materials (eg., woody biomass) have an Ea of 103–165 kJ·mol−1 [54,55]. The values presented in this paper were obtained for non-isothermal conditions and pyrolysis temperature range.
In this work, the Ea and the reaction rate constants were determined in isothermal conditions and a temperature range of 200–300 °C. The same conditions and temperatures were used previously by Pulka et al. [56], who tested sewage sludge (SS) with high ash content, and Syguła et al. [57] who tested spent mushroom compost (MSC). The Ea for torrefaction process of elephant dung was 18 kJ·mol−1, and k values were increasing with process temperature from 1.16 × 10⁻⁵·s−1 to 2.73 × 10⁻⁵·s−1 (from 200 to 300 °C), respectively. In the case of SS, the Ea was 12 kJ·mol−1, and the k value increased from 4.02 × 10⁻⁵·s−1 to 6.71 × 10⁻⁵·s−1 (from 200 to 300 °C), respectively [56]. In the case of MSC, the Ea was 22.2 kJ·mol−1, and the k value increased from 1.7 × 10⁻⁵·s−1 to 4.6 × 10⁻⁵·s−1 (from 200 to 300 °C), respectively [57]. Differences could be a result of biomass origin, and organic matter content. OM in SS was 56% d.m. [56], 76% d.m. in MSC [57], and 50% d.m. in elephant dung—Table A1).
It should also be noted that the greatest Ea was determined for MSC, which had the highest OM content, and much smaller during the torrefaction of elephant dung and SS, where OM contents were lower by ~20%. An opposite trend was observed in the case of the k value, which was the highest during the torrefaction of SS, followed by MSC and elephant dung. This may indicate that the content of OM is one of the critical drivers of the waste’s kinetic properties, such as the Ea and possibly k.

4.4. Differential Scanning Calorimetry of Raw Material

DSC analysis showed that two endothermic reactions (37–146 °C and 158–252 °C) and one exothermic reaction (252–300 °C) occur during the torrefaction process (Figure 12). The first transformation observed on DSC plot may be attributed to water evaporation. Interestingly, the elephant dung was dried at 105 °C before the DSC test. Thus, the presence of water in a previously dried sample could be due to the hygroscopicity (the sample absorbed some water from the atmosphere before the test; i.e., biocoals are known to be affected by this phenomenon) [58]. The first transformation ended above drying temperature (105 °C), so it is probably associated with bound water evaporation. The nature of the second endothermic transformation is unknown. To our knowledge, there are no DSC data of elephant dung to compare. This transformation may be related to residue hemicellulose degradation. Degradation of hemicellulose takes place at a lower temperature range (225–325 °C) than the degradation of cellulose (305–375 °C) [36]. After the second endothermic transformation ended, the heat flow starts to decrease, which is related to an exothermic reaction (253–300 °C). This exothermic reaction corresponds to mass loss observed on TG/DTG plot observed at the beginning of the process (Figure 11). Interestingly, neither of the endothermic reactions were apparerent in the TG/DTG plot (Figure 11). This might be a result of insufficient precision in the use of the laboratory balance, or due to transformations that were not related to mass loss. In general, endothermal reactions are related to depolymerization and volatilization process, whereas exothermic transformations are due to the charring process [59] phenomenon, the DSC plot shows that the elephant dung torrefaction is an (overall) endothermic process and it requires energy delivery. Some energy cost savings might be realized by using the torrefied elephant dung as a fuel for the torrefaction process (Figure 1).
High ash content 50.81% (Table A1) is not without significance. It makes measurements of TGA and DSC less accurate because smaller mass loses in organic compounds were measured. In the case of DSC, the endothermic reactions of <200 °C that were found could also be associated with water evaporation from components of ash such as chlorine and potassium [60]. The growth of the mineral fraction lowers the activation energy of the pyrolysis reaction, and accelerates exothermic thermochemical conversion reactions [61].

5. Conclusions

Initial valorization of elephant dung by torrefaction is proposed as a possible low-tech fuel production in rural areas with abundant supply. Proposed valorization could be used in households for cooking and heating. These studies have expanded knowledge on the possibilities of torrefaction of elephant dung and provided practical knowledge about the fuel properties of torrefied elephant dung, as high heating value, combustible parts, ash content, and organic matter content. Based on the results, models of torrefaction of elephant dung with kinetics parameter evaluation have been proposed. The following conclusions arise from this research:
  • Torrefaction improves the higher heating value of elephant dung. The torrefied elephant dung has an HHV = 13 MJ·kg−1 compared to the HHV = 11.41 MJ·kg−1 for unprocessed dung.
  • Minimal process controls appear to be needed, and thus, scaling the torrefaction up to larger batches of dung is feasible, but due to lack of data, these options need more tests on a technical scale. Biocoals with similar quality are obtained for 200 °C to 260 °C range regardless of the duration of the process (20 to 60 min).
  • The recommended temperature of the torrefaction for elephant dung is 200 °C, due to the lack of significant improvements in fuel properties with increasing process temperature.
  • The activation energy for torrefaction of elephant dung at 200~300 °C was 17.7 J·mol−1, and the reaction rate constant increased from 1.16 × 10⁻⁵·s−1 to 2.73 × 10⁻⁵·s−1.
  • The total energy needed to heat the dry elephant dung from 20 °C to 300 °C was approximately 485 kJ·kg−1 (obtained in laboratory conditions), and 484.81 kJ∙kg−1 (obtained from calculations) after the mass loss during the process is factored in. The total energy demand for drying and torrefaction was the total amount of energy for processing (heating, moisture evaporation, and torrefaction) was 1760.30 kJ·kg−1.
This research has shown that there is a potential in using elephant dung as a substrate for torrefaction and its valorization as an improved fuel source. The next step should be to identify the technological parameters for the torrefaction of elephant dung. This is important for investment analysis and technology design, particularly in rural areas.

Author Contributions

Conceptualization, P.S., M.H. and K.Ś.; methodology, M.H.; software, P.S., S.K., and K.Ś.; validation, P.S., K.Ś., and M.H.; formal analysis, M.H.; investigation, M.H. and S.K.; resources, M.H. and A.B.; data curation, P.S., K.Ś., A.B. and J.A.K.; writing—original draft preparation, P.S., M.H. and K.Ś.; writing—review and editing, P.S., K.Ś., S.S.-D., J.A.K.; visualization, P.S. and K.Ś.; supervision, A.B., J.A.K., and P.M.; project administration, P.S.; funding acquisition, P.S., A.B., and J.A.K.

Funding

The research was funded by the Polish Ministry of Science and Higher Education (2015–2019), the Diamond Grant program # 0077/DIA/2015/14. “The PROM Programme - International scholarship exchange of Ph.D. candidates and academic staff” is co-financed by the European Social Fund under the Knowledge Education Development Operational Programme PPI/PRO/2018/1/00004/U/001. The authors would like to thank the Fulbright Foundation for funding the project titled “Research on pollutants emission from Carbonized Refuse Derived Fuel into the environment”, completed at Iowa State University. In addition, this project was partially supported by the Iowa Agriculture and Home Economics Experiment Station, Ames, Iowa. Project no. IOW05556 (Future Challenges in Animal Production Systems: Seeking Solutions through Focused Facilitation) sponsored by Hatch Act and State of Iowa funds.

Conflicts of Interest

The authors declare no conflict of interest.

Appendix A

Table A1. Summary of proximate analysis of the tested elephant dung and biocoals resulting from its torrefaction.
SampleMoisture, %Organic Matter Content, %Ash, %HHV, MJ·kg−1HHVdaf, MJ·kg−1
Elephant dung49.19 ± 5.8448.90 ± 5.7950.81 ± 5.8411.41 ± 1.3423.18 ± 2.39
200 °C20 min3.33 ± 0.0860.44 ± 0.4639.37 ± 0.4412.75 ± 0.5821.75 ± 1.15
40 min1.14 ± 0.0247.50 ± 1.4252.40 ± 1.4210.14 ± 0.5121.56 ± 0.87
60 min2.35 ± 0.0857.35 ± 1.6942.51 ± 1.7013.00 ± 0.3123.16 ± 0.19
220 °C20 min2.11 ± 0.1561.23 ± 1.0438.65 ± 1.0512.47 ± 1.3120.77 ± 2.30
40 min2.15 ± 0.0560.22 ± 2.5239.77 ± 2.5012.34 ± 1.0121.00 ± 2.48
60 min1.90 ± 0.0660.21 ± 0.2739.76 ± 0.2412.82 ± 0.7221.70 ± 1.24
240 °C20 min2.11 ± 0.1253.57 ± 2.0946.50 ± 2.0111.80 ± 1.5622.48 ± 2.24
40 min1.03 ± 0.0449.91 ± 1.1250.03 ± 1.0810.74 ± 0.7921.71 ± 1.27
60 min0.96 ± 0.0549.79 ± 1.1150.11 ± 1.139.51 ± 0.5019.24 ± 0.59
260 °C20 min3.20 ± 0.0652.96 ± 3.1447.52 ± 3.3011.39 ± 0.3321.79 ±1.93
40 min0.88 ± 0.1047.63 ± 2.9252.24 ± 2.9711.25 ± 0.5023.77 ± 0.51
60 min1.07 ± 0.0444.82 ± 2.5855.07 ± 2.6210.34 ± 0.2423.33 ± 1.93
280 °C20 min2.23 ± 0.1552.21 ± 4.4147.60 ± 4.4511.80 ± 1.4523.00 ± 1.25
40 min2.85 ± 0.2637.23 ± 3.2662.59 ± 3.318.66 ± 1.2223.87 ± 2.92
60 min1.64 ± 0.2628.26 ± 3.9771.48 ± 3.997.54 ± 0.3227.20 ± 3.57
300 °C20 min2.61 ± 0.2549.47 ± 1.4750.21 ± 1.5311.64 ± 1.0224.01 ± 1.99
40 min1.99 ± 0.2639.09 ± 3.4760.89 ± 3.469.05 ± 0.3223.69 ± 1.25
60 min1.24 ± 0.1428.66 ± 2.9271.25 ± 2.926.49 ± 0.7122.86 ± 0.79
Table A2. Values of mass yield, energy yield, and energy densification ratio for biocoals.
SampleMass Yield, %Energy Yield, %Energy Densification Ratio, %
200 °C20 min91.42102.111.12
40 min98.65107.781.09
60 min95.59108.911.13
220 °C20 min95.43104.251.09
40 min93.16100.741.08
60 min90.43101.621.12
240 °C20 min98.12101.431.03
40 min92.7887.330.94
60 min89.3674.460.83
260 °C20 min97.0795.660.99
40 min88.6387.340.99
60 min90.0181.550.90
280 °C20 min71.8368.890.96
40 min53.2146.290.87
60 min63.3351.590.81
300 °C20 min63.2858.280.92
40 min66.5856.500.85
60 min73.1862.580.86
Figure A1. Presentation of differences in individual groups (of torrefaction time) for organic matter content in biocoals from elephant dung.
Energies 12 04344 g0a1
Figure A2. Presentation of differences in individual groups (of torrefaction time) for ash content in biocoals from elephant dung.
Energies 12 04344 g0a2
Figure A3. Presentation of differences in individual groups (of torrefaction time) for combustible parts in biocoals from elephant dung.
Energies 12 04344 g0a3
Figure A4. Presentation of differences in individual groups (of torrefaction time) for the high heating value of biocoals from elephant dung.
Energies 12 04344 g0a4
Table A3. Analysis of variance for organic matter (OM) content.
Tukey Test for OM; a Bold Font Signifies Statistically Significant Difference (p < 0.05)200200200220220220240240240260260260280280280300300300
204060204060204060204060204060204060
20020 0.000.981.001.001.000.120.000.000.060.000.000.030.000.000.000.000.00
200400.00 0.000.000.000.000.271.001.000.431.001.000.680.000.001.000.020.00
200600.980.00 0.900.990.990.910.070.060.770.000.000.530.000.000.040.000.00
220201.000.000.90 1.001.000.050.000.000.020.000.000.010.000.000.000.000.00
220401.000.000.991.00 1.000.150.000.000.080.000.000.030.000.000.000.000.00
220601.000.000.991.001.00 0.160.000.000.080.000.000.030.000.000.000.000.00
240200.120.270.910.050.150.16 0.930.911.000.300.011.000.000.000.850.000.00
240400.001.000.070.000.000.000.93 1.000.991.000.551.000.000.001.000.000.00
240600.001.000.060.000.000.000.911.00 0.981.000.591.000.000.001.000.000.00
260200.060.430.770.020.080.081.000.990.98 0.470.031.000.000.000.950.000.00
260400.001.000.000.000.000.000.301.001.000.47 0.990.720.000.001.000.020.00
260600.001.000.000.000.000.000.010.550.590.030.99 0.070.060.000.700.350.00
280200.030.680.530.010.030.031.001.001.001.000.720.07 0.000.001.000.000.00
280400.000.000.000.000.000.000.000.000.000.000.000.060.00 0.010.001.000.02
280600.000.000.000.000.000.000.000.000.000.000.000.000.000.01 0.000.001.00
300200.001.000.040.000.000.000.851.001.000.951.000.701.000.000.00 0.000.00
300400.000.020.000.000.000.000.000.000.000.000.020.350.001.000.000.00 0.00
300600.000.000.000.000.000.000.000.000.000.000.000.000.000.021.000.000.00
Table A4. Analysis of variance for ash content.
Tukey Test for Ash Content; a Bold Font Signifies Statistically Significant Difference (p < 0.05)200200200220220220240240240260260260280280280300300300
204060204060204060204060204060204060
20020 0.000.981.001.001.000.100.000.000.030.000.000.030.000.000.000.000.00
200400.00 0.000.000.000.000.321.001.000.641.001.000.660.000.001.000.020.00
200600.980.00 0.911.001.000.880.060.060.600.000.000.570.000.000.050.000.00
220201.000.000.91 1.001.000.040.000.000.010.000.000.010.000.000.000.000.00
220401.000.001.001.00 1.000.150.000.000.050.000.000.050.000.000.000.000.00
220601.000.001.001.001.00 0.150.000.000.050.000.000.040.000.000.000.000.00
240200.100.320.880.040.150.15 0.950.941.000.370.021.000.000.000.930.000.00
240400.001.000.060.000.000.000.95 1.001.001.000.591.000.000.001.000.000.00
240600.001.000.060.000.000.000.941.00 1.001.000.611.000.000.001.000.000.00
260200.030.640.600.010.050.051.001.001.00 0.690.061.000.000.001.000.000.00
260400.001.000.000.000.000.000.371.001.000.69 0.990.710.000.001.000.020.00
260600.001.000.000.000.000.000.020.590.610.060.99 0.070.060.000.650.350.00
280200.030.660.570.010.050.041.001.001.001.000.710.07 0.000.001.000.000.00
280400.000.000.000.000.000.000.000.000.000.000.000.060.00 0.010.001.000.02
280600.000.000.000.000.000.000.000.000.000.000.000.000.000.01 0.000.001.00
300200.001.000.050.000.000.000.931.001.001.001.000.651.000.000.00 0.000.00
300400.000.020.000.000.000.000.000.000.000.000.020.350.001.000.000.00 0.00
300600.000.000.000.000.000.000.000.000.000.000.000.000.000.021.000.000.00
Table A5. Analysis of variance for combustible parts (CP).
Tukey Test for CP; a Bold Font Signifies Statistically Significant Difference (p < 0.05)200200200220220220240240240260260260280280280300300300
204060204060204060204060204060204060
20020 0.000.971.001.001.000.070.000.000.000.000.000.020.000.000.000.000.00
200400.00 0.000.000.000.000.251.001.000.001.000.990.580.000.001.000.010.00
200600.970.00 0.870.990.990.840.040.040.000.000.000.490.000.000.030.000.00
220201.000.000.87 1.001.000.030.000.000.000.000.000.010.000.000.000.000.00
220401.000.000.991.00 1.000.110.000.000.000.000.000.030.000.000.000.000.00
220601.000.000.991.001.00 0.110.000.000.000.000.000.030.000.000.000.000.00
240200.070.250.840.030.110.11 0.930.920.000.290.011.000.000.000.900.000.00
240400.001.000.040.000.000.000.93 1.000.001.000.511.000.000.001.000.000.00
240600.001.000.040.000.000.000.921.00 0.001.000.531.000.000.001.000.000.00
260200.000.000.000.000.000.000.000.000.00 0.000.000.000.000.000.000.000.00
260400.001.000.000.000.000.000.291.001.000.00 0.990.640.000.001.000.010.00
260600.000.990.000.000.000.000.010.510.530.000.99 0.040.040.000.570.270.00
280200.020.580.490.010.030.031.001.001.000.000.640.04 0.000.001.000.000.00
280400.000.000.000.000.000.000.000.000.000.000.000.040.00 0.010.001.000.01
280600.000.000.000.000.000.000.000.000.000.000.000.000.000.01 0.000.001.00
300200.001.000.030.000.000.000.901.001.000.001.000.571.000.000.00 0.000.00
300400.000.010.000.000.000.000.000.000.000.000.010.270.001.000.000.00 0.00
300600.000.000.000.000.000.000.000.000.000.000.000.000.000.011.000.000.00
Table A6. Analysis of variance for high heating value (HHV).
Tukey Test for HHV; a Bold Font Signifies Statistically Significant Difference (p < 0.05)200200200220220220240240240260260260280280280300300300
204060204060204060204060204060204060
20020 0.051.001.001.001.000.990.310.000.870.760.100.990.000.000.970.000.00
200400.05 0.020.130.180.040.621.001.000.930.971.000.620.780.050.770.980.00
200601.000.02 1.001.001.000.950.150.000.660.520.040.950.000.000.870.000.00
220201.000.131.00 1.001.001.000.550.010.980.940.221.000.000.001.000.000.00
220401.000.181.001.00 1.001.000.680.020.990.980.311.000.000.001.000.000.00
220601.000.041.001.001.00 0.990.250.000.820.690.070.990.000.000.950.000.00
240200.990.620.951.001.000.99 0.980.141.001.000.801.000.010.001.000.030.00
240400.311.000.150.550.680.250.98 0.941.001.001.000.980.250.011.000.590.00
240600.001.000.000.010.020.000.140.94 0.410.541.000.141.000.330.221.000.01
260200.870.930.660.980.990.821.001.000.41 1.000.981.000.030.001.000.120.00
260400.760.970.520.940.980.691.001.000.541.00 1.001.000.050.001.000.180.00
260600.101.000.040.220.310.070.801.001.000.981.00 0.790.600.020.900.910.00
280200.990.620.951.001.000.991.000.980.141.001.000.79 0.010.001.000.030.00
280400.000.780.000.000.000.000.010.251.000.030.050.600.01 0.970.011.000.20
280600.000.050.000.000.000.000.000.010.330.000.000.020.000.97 0.000.750.98
300200.970.770.871.001.000.951.001.000.221.001.000.901.000.010.00 0.050.00
300400.000.980.000.000.000.000.030.591.000.120.180.910.031.000.750.05 0.06
300600.000.000.000.000.000.000.000.000.010.000.000.000.000.200.980.000.06
Table A7. Statistical evaluation of specific heat of elephant dung.
Intercept/CoefficientValue of Intercept/CoefficientStandard ErrorpLower Limit of ConfidenceUpper Limit of Confidence
a17.74 × 1002.64 × 10−10.006.59 × 1007.62 × 100
a2−6.55 × 10−12.37 × 10−20.00−6.55 × 10⁻¹−5.62 × 10⁻¹
a32.37 × 10−28.21 × 10−40.002.09 × 10−22.41 × 10⁻²
a4−3.97 × 10−41.45 × 10−50.00−4.11 × 10⁻⁴−3.54 × 10⁻⁴
a53.63 × 10−60.00 × 1000.003.53 × 10−63.53 × 10⁻⁶
a6−1.93 × 10−80.00 × 1000.00−1.90 × 10⁻⁸−1.90 × 10⁻⁸
a76.04 × 10−110.00 × 1000.005.97 × 10−115.97 × 10⁻¹¹
a8−1.03 × 10−130.00 × 1000.00−1.02 × 10⁻¹³−1.02 × 10⁻¹³
a97.37 × 10−170.00 × 1000.007.37 × 10−177.37 × 10⁻¹⁷
SH = a1 + a2·T + a3·T2 + a4·T3 + a5·T4 + a6·T5 + a7·T6 + a8·T7 + a9 T8, R2 = 0.98, R = 0.99.
Table A8. Evaluation of commercial pellet HHVdaf, based on [51].
Type of PelletAsh, %HHV, MJ·kg−1HHVdaf *, MJ·kg−1
Pine sawdust0.6619.5219.65
Wheat straw7.2717.5718.95
Corn settlements1.2718.8019.04
Agricultural residues8.2718.1319.76
* HHVdaf has been calculated based on Equation (4).

References

  1. Brown, J.L.; Paris, S.; Prado-Oviedo, N.A.; Meehan, C.L.; Hogan, J.N.; Morfeld, K.A.; Carlstead, K. Reproductive Health Assessment of Female Elephants in North American Zoos and Association of Husbandry Practices with Reproductive Dysfunction in African Elephants (Loxodonta africana). PLoS ONE 2016, 11, e0145673. [Google Scholar] [CrossRef] [PubMed]
  2. Farah, N.; Amna, M.; Naila, Y.; Ishtiaq, R. Processing of Elephant Dung and its Utilization as a Raw Material for Making Exotic Paper. Res. J. Chem. Sci. 2014, 4, 94–103. [Google Scholar]
  3. Sannigrahi, A.K. Beneficial Utilization Of Elephant Dung Through Vermicomposting. Int. J. Recent Sci. Res. 2015, 6, 4814–4817. [Google Scholar]
  4. Elephants for Africa. Available online: http://www.elephantsforafrica.org/elephant-facts/ (accessed on 18 August 2019).
  5. Schröder, J.J.; Scholefield, D.; Cabral, F.; Hofman, G. The effects of nutrient losses from agriculture on ground and surface water quality: The position of science in developing indicators for regulation. Environ. Sci. Policy 2004, 7, 15–23. [Google Scholar] [CrossRef]
  6. Pérez-Godínez, E.A.; Lagunes-Zarate, J.; Corona-Hernández, J.; Barajas-Aceves, M. Growth and reproductive potential of Eisenia foetida (Sav) on various zoo animal dungs after two methods of pre-composting followed by vermicomposting. Waste Manag. 2017, 64, 67–78. [Google Scholar] [CrossRef]
  7. Zhou, S.; Liang, H.; Han, L.; Huang, G.; Yang, Z. The influence of manure feedstock, slow pyrolysis, and hydrothermal temperature on manure thermochemical and combustion properties. Waste Manag. 2019, 88, 85–95. [Google Scholar] [CrossRef]
  8. Qambrani, N.A.; Rahman, M.M.; Won, S.; Shim, S.; Ra, C. Biochar properties and eco-friendly applications for climate change mitigation, waste management, and wastewater treatment: A review. Renew. Sustain. Energy Rev. 2017, 79, 255–273. [Google Scholar] [CrossRef]
  9. Aira, M.; Monroy, F.; Domínguez, J.; Mato, S. How earthworm density affects microbial biomas and activity in pig manure. Eur. J. Soil Biol. 2002, 38, 7–10. [Google Scholar] [CrossRef]
  10. Sukasem, N.; Khanthi, K.; Prayoonkham, S. Biomethane Recovery from Fresh and Dry Water Hyacinth Anaerobic Co-Digestion with Pig Dung, Elephant Dung and Bat Dung with Different Alkali Pretreatments. Energy Procedia 2017, 138, 294–300. [Google Scholar] [CrossRef]
  11. Klasson, K.T.; Nghiem, N. Energy Production from Zoo Animal Wastes; Oak Ridge National Laboratory: Oak Ridge, TN, USA, 2003; Volume 3, pp. 1–8. [Google Scholar] [CrossRef]
  12. Fangkum, A.; Reungsang, A. Simultaneous saccharification and fermentation of cellulose for bio-hydrogen production by anaerobic mixed cultures in elephant dung. Int. J. Hydrogen Energy 2014, 39, 9028–9035. [Google Scholar] [CrossRef]
  13. Fangkum, A.; Reungsang, A. Biohydrogen production from mixed xylose/arabinose at thermophilic temperature by anaerobic mixed cultures in elephant dung. Int. J. Hydrogen Energy 2011, 36, 13928–13938. [Google Scholar] [CrossRef]
  14. Moosophin, K.; Phachan, N.; Apiraksakorn, J. Screening of cellulolytic clostridia from animal dung and compost for direct butanol production from cellulosic materials. Curr. Opin. Biotechnol. 2013, 24, 48–143. [Google Scholar] [CrossRef]
  15. Li, J.; Xiao, F.; Zhang, L.; Amirkhanian, S.N. Life cycle assessment and life cycle cost analysis of recycled solid waste materials in highway pavement: A review. J. Clean. Prod. 2019, 233, 1182–1206. [Google Scholar] [CrossRef]
  16. Jia, J.; Shu, L.; Zang, G.; Xu, L.; Abudula, A.; Ge, K. Energy analysis of a co-gasification of woody biomass and animal manure, solid oxide fuel cells and micro gas turbine hybrid system. Energy 2018, 149, 750–761. [Google Scholar] [CrossRef]
  17. Das, K.; Hiloidhari, M.; Baruah, D.C.; Nonhebel, S. Impact of Time Expenditure on Household Preferences for Cooking Fuels. Energy 2018, 151, 309–316. [Google Scholar] [CrossRef]
  18. International Monetary Fund Report for Selected Countries and Subjects. Available online: https://data.worldbank.org/indicator/SP.POP.TOTL?name_desc=false (accessed on 23 August 2019).
  19. Ji, C.; Cheng, K.; Nayak, D.; Pan, G. Environmental and economic assessment of crop residue competitive utilization for biochar, briquette fuel and combined heat and power generation. J. Clean. Prod. 2018, 192, 916–923. [Google Scholar] [CrossRef]
  20. Kamara, J.; Galukande, M.; Maeda, F.; Luboga, S.; Renzaho, A. Understanding the Challenges of Improving Sanitation and Hygiene Outcomes in a Community Based Intervention: A Cross-Sectional Study in Rural Tanzania. Int. J. Environ. Res. Public Health 2017, 14, 602. [Google Scholar] [CrossRef]
  21. Białowiec, A.; Micuda, M.; Szumny, A.; Łyczko, J.; Koziel, J.A. Waste to Carbon: Influence of Structural Modification on VOC Emission Kinetics from Stored Carbonized Refuse-Derived Fuel. Sustainability 2019, 11, 935. [Google Scholar] [CrossRef]
  22. Stępień, P.; Białowiec, A. Kinetic Parameters of Torrefaction Process of Alternative Fuel Produced From Municipal Solid Waste and Characteristic of Carbonized Refuse Derived Fuel. Detritus 2018, 3, 75–83. [Google Scholar] [CrossRef]
  23. Waste Characteristics. Calculation of Dry Mass on the Basis of Dry Residue or Water Content. Polish standard PN-EN 14346:2011. Available online: https://infostore.saiglobal.com/enau/Standards/PN-EN-14346-2011-932471_SAIG_PKN_PKN_2197939/ (accessed on 23 August 2019).
  24. Waste Characteristics. Content of Organic Matter. Polish Standard PN-EN 15169:2011. Available online: http://sklep.pkn.pl/pn-en-15169-2011p.html (accessed on 23 August 2019).
  25. Municipal Solid Waste. Combustible and Non-Combustible Content. Polish Standard PN-Z-15008-04:1993. Available online: http://sklep.pkn.pl/pn-z-15008-04-1993p.html (accessed on 23 August 2019).
  26. Solid Fuels. Determination of the Higher Heating Value and the Lower Heating Value. Polish Standard PN-G-04513:1981. Available online: http://sklep.pkn.pl/pn-g-04513-1981p.html (accessed on 23 August 2019).
  27. Chin, K.L.; H’ng, P.S.; Go, W.Z.; Wong, W.Z.; Lim, T.W.; Maminski, M.; Paridah, M.T.; Luqman, A.C. Optimization of torrefaction conditions for high energy density solid biofuel from oil palm biomass and fast growing species available in Malaysia. Ind. Crops Prod. 2013, 49, 768–774. [Google Scholar] [CrossRef]
  28. Pulka, J.; Wiśniewski, D.; Gołaszewski, J.; Białowiec, A. Is the biochar produced from sewage sludge a good quality solid fuel? Arch. Environ. Prot. 2016, 42, 125–134. [Google Scholar] [CrossRef]
  29. Peleg, M.; Normand, M.D.; Corradini, M.G. The Arrhenius Equation Revisited. Crit. Rev. Food Sci. Nutr. 2012, 52, 830–851. [Google Scholar] [CrossRef] [PubMed]
  30. Stępień, P.; Serowik, M.; Koziel, J.A.; Białowiec, A. Waste to carbon energy demand model and data based on the TGA and DSC analysis of individual MSW components. Data 2019, 4, 53. [Google Scholar] [CrossRef]
  31. Stępień, P.; Mysior, M.; Białowiec, A. Technical and technological problems and potential application waste torrefaction. In Innovations in Waste Management—Selected Issues; Manczarski, P., Ed.; Wydawnictwo Uniwersytetu Przyrodniczego: Wrocław, Poland, 2018; Volume 1, pp. 59–78. Available online: https://www.researchgate.net/publication/325367684_Innowacje_w_gospodarce_odpadami_Zagadnienia_wybrane (accessed on 23 August 2019).
  32. Świechowski, K.; Liszewski, M.; Bąbelewski, P.; Koziel, J.A.; Białowiec, A. Oxytree Pruned Biomass Torrefaction: Mathematical Models of the Influence of Temperature and Residence Time on Fuel Properties Improvement. Materials 2019, 12, 2228. [Google Scholar] [CrossRef] [PubMed]
  33. Li, S.; Harris, S.; Anandhi, A.; Chen, G. Predicting biochar properties and functions based on feedstock and pyrolysis temperature: A review and data syntheses. J. Clean. Prod. 2019, 215, 890–902. [Google Scholar] [CrossRef]
  34. Kim, D.; Lee, K.; Park, K.Y. Upgrading the characteristics of biochar from cellulose, lignin, and xylan for solid biofuel production from biomass by hydrothermal carbonization. J. Ind. Eng. Chem. 2016, 42, 95–100. [Google Scholar] [CrossRef]
  35. Gascó, G.; Paz-Ferreiro, J.; Álvarez, M.L.; Saa, A.; Méndez, A. Biochars and hydrochars prepared by pyrolysis and hydrothermal carbonisation of pig manure. Waste Manag. 2018, 79, 395–403. [Google Scholar] [CrossRef]
  36. Van der Stelt, M.J.C. Chemistry and Reaction Kinetics of Biowaste Torrezfaction; Technische Universiteit Eindhoven: Eindhoven, The Netherlands, 2011. [Google Scholar] [CrossRef]
  37. Pahla, G.; Mamvura, T.A.; Ntuli, F.; Muzenda, E. Energy densification of animal waste lignocellulose biomass and raw biomass. S. Afr. J. Chem. Eng. 2017, 24, 168–175. [Google Scholar] [CrossRef]
  38. Higgins, M.J.; Adams, G.; Chen, Y.-C.; Erdal, Z.; Forbes, R.H.; Glindemann, D.; Hargreaves, J.R.; McEwen, D.; Murthy, S.N.; Novak, J.T.; et al. Role of protein, amino acids, and enzyme activity on odor production from anaerobically digested and dewatered biosolids. Water Environ. Res. 2008, 80, 127–135. [Google Scholar] [CrossRef]
  39. Lehmann, J.; Joseph, S. Biochar for Environmental Management: Science and Technology; Earthscan: London, UK, 2009; ISBN 184407658X. [Google Scholar]
  40. Ro, K.S.; Libra, J.A.; Bae, S.; Berge, N.D.; Flora, J.R.V.; Pecenka, R. Combustion Behavior of Animal-Manure-Based Hydrochar and Pyrochar. ACS Sustain. Chem. Eng. 2019, 7, 470–478. [Google Scholar] [CrossRef]
  41. Avellone, E.A.; Baumeister, T.; Saunders, H. Marks Standard Handbook for Mechanical Engineers; McGraw-Hill Education: New York, NY, USA, 2008; pp. 101–105. [Google Scholar]
  42. Oshita, K.; Toda, S.; Takaoka, M.; Kanda, H.; Fujimori, T.; Matsukawa, K.; Fujiwara, T. Solid fuel production from cattle manure by dewatering using liquefied dimethyl ether. Fuel 2015, 159, 7–14. [Google Scholar] [CrossRef] [Green Version]
  43. Dębska, A.; Koziołek, S.; Bieniek, J.; Białowiec, A. Potencjał produkcji biogazu z odpadów we wrocławskim Ogrodzie Zoologicznym. Annu. Set Environ. Prot. 2016, 18, 337–351. [Google Scholar]
  44. Matthiessen, M.K.; Larney, F.J.; Selinger, L.B.; Olson, A.F. Influence of Loss-on-Ignition Temperature and Heating Time on Ash Content of Compost and Manure. Commun. Soil Sci. Plant Anal. 2005, 36, 2561–2573. [Google Scholar] [CrossRef]
  45. Świechowski, K.; Koziel, J.A.; Liszewski, M.; Bąbelewski, P.; Białowiec, A. Fuel Properties of Torrefied Biomass from Pruning of Oxytree. Data 2019, 4, 55. [Google Scholar] [CrossRef] [Green Version]
  46. Dudek, M.; Świechowski, K.; Manczarski, P.; Koziel, J.A.; Białowiec, A. The Effect of Biochar Addition on the Biogas Production Kinetics from the Anaerobic Digestion of Brewers’ Spent Grain. Energies 2019, 12, 1518. [Google Scholar] [CrossRef] [Green Version]
  47. Gautam, S.; Edwards, R.; Yadav, A.; Weltman, R.; Pillarsetti, A.; Arora, N.K.; Smith, K.R. Probe-based measurements of moisture in dung fuel for emissions measurements. Energy Sustain. Dev. 2016, 35, 1–6. [Google Scholar] [CrossRef]
  48. Lang, Q.; Guo, Y.; Zheng, Q.; Liu, Z.; Gai, C. Co-hydrothermal carbonization of lignocellulosic biomass and swine manure: Hydrochar properties and heavy metal transformation behavior. Bioresour. Technol. 2018, 266, 242–248. [Google Scholar] [CrossRef]
  49. Rousset, P.; Aguiar, C.; Labbé, N.; Commandré, J.-M. Enhancing the combustible properties of bamboo by torrefaction. Bioresour. Technol. 2011, 102, 8225–8231. [Google Scholar] [CrossRef]
  50. Bach, Q.-V.; Skreiberg, Ø. Upgrading biomass fuels via wet torrefaction: A review and comparison with dry torrefaction. Renew. Sustain. Energy Rev. 2016, 54, 665–677. [Google Scholar] [CrossRef]
  51. Dyjakon, A.; Noszczyk, T. The Influence of Freezing Temperature Storage on the Mechanical Durability of Commercial Pellets from Biomass. Energies 2019, 12, 2627. [Google Scholar] [CrossRef] [Green Version]
  52. Lacey, J.A.; Aston, J.E.; Westover, T.L.; Cherry, R.S.; Thompson, D.N. Removal of introduced inorganic content from chipped forest residues via air classification. Fuel 2015, 160, 265–273. [Google Scholar] [CrossRef] [Green Version]
  53. Várhegyi, G.; Bobály, B.; Jakab, E.; Chen, H. Thermogravimetric study of biomass pyrolysis kinetics. A distributed activation energy model with prediction tests. Energy Fuels 2011, 25, 24–32. [Google Scholar] [CrossRef] [Green Version]
  54. Bach, V.; Tran, K.-Q. Dry and wet torrefaction of woody biomass—A comparative study on combustion kinetics. Energy Proceedia 2015, 75, 150–155. [Google Scholar] [CrossRef] [Green Version]
  55. Soria-Verdugo, A.; Goos, E.; García-Hernando, N. Effect of the number of TGA curves employed on the biomass pyrolysis kinetics results obtained using the Distributed Activation Energy Model. Fuel Process. Technol. 2015, 134, 360–371. [Google Scholar] [CrossRef] [Green Version]
  56. Pulka, J.; Manczarski, P.; Koziel, J.A.; Białowiec, A. Torrefaction of Sewage Sludge: Kinetics and Fuel Properties of Biochars. Energies 2019, 12, 565. [Google Scholar] [CrossRef] [Green Version]
  57. Syguła, E.; Koziel, J.A.; Białowiec, A. Proof-of-Concept of Spent Mushrooms Compost Torrefaction—Studying the Process Kinetics and the Influence of Temperature and Duration on the Calorific Value of the Produced Biocoal. Energies 2019, 12, 3060. [Google Scholar] [CrossRef] [Green Version]
  58. Basak, S.; Samanta, K.K. Thermal behaviour and the cone calorimetric analysis of the jute fabric treated in different pH condition. J. Therm. Anal. Calorim. 2019, 135, 3095–3105. [Google Scholar] [CrossRef]
  59. Wang, J.; Wang, G.; Zhang, M.; Chen, M.; Li, D.; Min, F.; Chen, M.; Zhang, S.; Ren, Z.; Yan, Y. A comparative study of thermolysis characteristics and kinetics of seaweeds and fir wood. Process Biochem. 2006, 41, 1883–1886. [Google Scholar] [CrossRef]
  60. Said, N.; Abdel daiem, M.M.; García-Maraver, A.; Zamorano, M. Reduction of Ash Sintering Precursor Components in Rice Straw by Water Washing. BioResources 2014, 9, 6756–6764. [Google Scholar] [CrossRef] [Green Version]
  61. Burhenne, L.; Messmer, J.; Aicher, T.; Laborie, M.-P. The effect of the biomass components lignin, cellulose and hemicellulose on TGA and fixed bed pyrolysis. J. Anal. Appl. Pyrolysis 2013, 101, 177–184. [Google Scholar] [CrossRef]
Figure 1. The proposed valorization of elephant dung (manure) via torrefaction.
Energies 12 04344 g001
Figure 2. Scheme of experiments – biocoal production via torrefaction of elephant dung to determine the process kinetics with thermogravimetric analyses (TGA) and differential scanning calorimetry (DSC).
Energies 12 04344 g002
Figure 3. The influence of temperature and time on the mass yield of biocoal from elephant dung.
Energies 12 04344 g003
Figure 4. The influence of temperature and time on the energy yield in biocoal from elephant dung.
Energies 12 04344 g004
Figure 5. The influence of temperature and time on the energy densification ratio in biocoal from elephant dung.
Energies 12 04344 g005
Figure 6. The influence of temperature and time on the organic matter content in biocoal from elephant dung.
Energies 12 04344 g006
Figure 7. The influence of temperature and time on the ash content in biocoal from elephant dung.
Energies 12 04344 g007
Figure 8. The influence of temperature and time on the combustible parts in biocoal from elephant dung.
Energies 12 04344 g008
Figure 9. The influence of temperature and time on the high heating value (HHV) in biocoal from elephant dung.
Energies 12 04344 g009
Figure 10. The influence of temperature and time on the HHVdaf in biocoal from elephant dung.
Energies 12 04344 g010
Figure 11. The thermogravimetric characteristic of elephant dung.
Energies 12 04344 g011
Figure 12. The differential scanning calorimetry (DSC) characteristic of elephant dung.
Energies 12 04344 g012
Table 1. Statistical evaluation of mass yield of biocoal from elephant dung.
Intercept/CoefficientValue of Intercept/CoefficientStandard ErrorpLower Limit of ConfidenceUpper Limit of Confidence
a1−2.58 × 1022.18 × 1020.00−7.38 × 1022.22 × 102
a22.72 × 1001.44 × 1000.00−4.52 × 10−-15.89 × 100
a3−5.12 × 10−32.39 × 10−30.00−1.04 × 10−21.41 × 10−4
a46.91 × 1006.19 × 1000.00−6.71 × 1002.05 × 101
a5−4.22 × 10−24.01 × 10−20.00−1.30 × 10−14.61 × 10−2
a6−3.01 × 10−22.45 × 10−20.00−8.40 × 10−22.38 × 10−2
a77.70 × 10−70.00 × 1000.007.70 × 10−77.70 × 10⁻⁷
MY = a1 + a2·T + a3·T2 + a4·t + a5·t2 + a6·t + a7·T2·t, R2 = 0.75, R = 0.87; T* ranged from 200 °C to 300 °C, t* ranged from 20 min to 60 min; * more information in Section 2.2.
Table 2. Statistical evaluation of energy yield of biocoal from elephant dung.
Intercept/CoefficientValue of Intercept/CoefficientStandard ErrorpLower Limit of ConfidenceUpper Limit of Confidence
a1−1.19 × 1022.48 × 1020.00−6.65 × 1024.27 × 102
a21.69 × 1001.64 × 1000.00−1.91 × 1005.30 × 100
a3−3.17 × 10−32.72 × 10−30.00−9.16 × 10−32.82 × 10−3
a48.26 × 1007.04 × 1000.00−7.23 × 1002.38 × 101
a5−4.74 × 10−24.56 × 10−20.00−1.48 × 10−15.30 × 10−2
a6−3.65 × 10−22.79 × 10−20.00−9.78 × 10−22.48 × 10−2
a78.73 × 10−70.00 × 1000.008.73 × 10−78.73 × 10⁻⁷
EY = a1 + a2·T+ a3·T2 + a4·t + a5·t2 + a6·T·t + a7·T2·t, R2 = 0.85, R = 0.92; T* ranged from 200 °C to 300 °C, t* ranged from 20 min to 60 min; * more information in Section 2.2.
Table 3. Statistical evaluation of energy densification ratio of biocoal from elephant dung.
Intercept/CoefficientValue of Intercept/CoefficientStandard ErrorpLower Limit of ConfidenceUpper Limit of Confidence
a11.99 × 1001.38 × 1000.00−1.05 × 1005.04 × 100
a2−7.21 × 10−39.14 × 10−30.00−2.73 × 10−21.29 × 10−2
a31.41 × 10−51.52 × 10−50.00−1.93 × 10−54.75 × 10−5
a42.23 × 10−23.93 × 10−20.00−6.41 × 10−21.09 × 10−1
a5−9.11 × 10−52.54 × 10−40.00−6.51 × 10−44.69 × 10−4
a6−1.06 × 10−41.55 × 1040.00−4.48 × 10−42.36 × 10−4
a71.90 × 10−90.00 × 1000.001.90 × 10−91.90 × 10⁻⁹
EDr = a1 + a2·T + a3·T2 + a·t + a5·t2 + a6·t+a7·T2t, R2 = 0.83, R = 0.91; T* ranged from 200 °C to 300 °C, t* ranged from 20 min to 60 min; * more information in Section 2.2.
Table 4. Statistical evaluation of organic matter content of biocoal from elephant dung.
Intercept/CoefficientValue of Intercept/CoefficientStandard ErrorpLower Limit of ConfidenceUpper Limit of Confidence
a19.74 × 1016.33 × 1010.00−3.00 × 1012.25 × 102
a21.24 × 10−24.18 × 10−10.00−8.29 × 10−18.54 × 10−1
a3−4.95 × 10−46.95 × 10−40.00−1.89 × 10−39.03 × 10−4
a4−3.25 × 1001.80 × 1000.00−6.87 × 1003.62 × 10−1
a53.20 × 10−21.16 × 10−20.008.53 × 1035.54 × 10−2
a69.62 × 10−37.11 × 10−30.00−4.69 × 10−32.39 × 10−2
a7−3.85 × 10−70.00 × 1000.00−3.85 × 10⁻⁷−3.85 × 10⁷
OM = a1 + a2·T + a3·T2 + a4·t + a5·t2 + a6·T·t + a7·T2·t, R2 = 0.83, R = 0.91; T* ranged from 200 °C to 300 °C, t* ranged from 20 min to 60 min; * more information in Section 2.2.
Table 5. Statistical evaluation of ash content of biocoal from elephant dung.
Intercept/CoefficientValue of Intercept/CoefficientStandard ErrorpLower Limit of ConfidenceUpper Limit of Confidence
a1−2.82 × 1006.34 × 1010.00−1.30 × 1021.25 × 102
a22.76 × 10−24.19 × 10−10.00−8.15 × 10−18.70 × 10−1
a34.22 × 10−46.95 × 10−40.00−9.76 × 10−41.82 × 10−3
a43.32 × 1001.80 × 1000.00−3.01 × 10−16.94 × 100
a5−3.24 × 10−21.17 × 10−20.00−5.58 × 10⁻²−8.93 × 10⁻³
a6−9.87 × 10−37.12 × 10−30.00−2.42 × 10−24.44 × 10−3
a73.91 × 10−70.00 × 1000.003.91 × 10−73.91 × 10⁻⁷
Ash = a1 + a2·T + a3·T2 + a4·t + a5·t2 + a6·T·t + a7·T2·t, R2 = 0.83, R = 0.91; T* ranged from 200 °C to 300 °C, t* ranged from 20 min to 60 min; * more information in Section 2.2.
Table 6. Statistical evaluation of ash content of biocoal from elephant dung.
Intercept/CoefficientValue of Intercept/CoefficientStandard ErrorpLower Limit of ConfidenceUpper Limit of Confidence
a1−1.19 × 1021.14 × 1020.00−3.48 × 1021.11 × 102
a21.61 × 1007.54 × 10−10.009.02 × 10−23.12 × 100
a3−3.10 × 10−31.25 × 10−30.00−5.62 × 10⁻³−5.79 × 10⁻⁴
a4−2.38 × 10−13.24 × 1000.00−6.75 × 1006.28 × 100
a51.73 × 10−22.10 × 10−20.00−2.49 × 10−25.95 × 10−2
a6−5.28 × 10−31.28 × 10−20.00−3.11 × 10−22.05 × 10−2
a7−4.29 × 10−80.00 × 1000.00−4.29 × 10⁻⁸−4.29 × 10⁻⁹
CP = a1 + a2·T + a3·T2 + a4·t + a5·t2 + a6·T·t + a7·T2·t, R2 = 0.67, R = 0.82; T* ranged from 200 °C to 300 °C, t* ranged from 20 min to 60 min; * more information in Section 2.2.
Table 7. Statistical evaluation of the high heating value of biocoal from elephant dung.
Intercept/CoefficientValue of Intercept/CoefficientStandard ErrorpLower Limit of ConfidenceUpper Limit of Confidence
a12.25 × 1011.50 × 1010.00−7.67 × 1005.27 × 101
a2−3.04 × 10−29.92 × 10−20.00−2.30 × 10−11.69 × 10−1
a3−2.45 × 10−61.65 × 10−40.00−3.34 × 10−43.29 × 10−4
a4−6.30 × 10−14.26 × 10−10.00−1.49 × 1002.27 × 10−1
a56.68 × 10−32.76 × 10−30.001.12 × 10−31.22 × 10⁻²
a61.84 × 10−31.69 × 10−30.00−1.55 × 10−35.23 × 10−3
a7−8.13 × 10−80.00 × 1000.00−8.13 × 10⁻⁸−8.13 × 10⁻⁸
HHV = a1 + a2·T + a3·T2 + a4·t + a5·t2 + a6·T·t + a7·T2·t, R2 = 0.74, R = 0.86; T* ranged from 200 °C to 300 °C, t* ranged from 20 min to 60 min; * more information in Section 2.2.
Table 8. Statistical evaluation of high heating value on the dry ash-free basis of biocoal from elephant dung.
Intercept/CoefficientValue of Intercept/CoefficientStandard ErrorpLower Limit of ConfidenceUpper Limit of Confidence
a13.54 × 1012.99 × 1010.00−2.48 × 1019.56 × 101
a2−1.28 × 10−11.98 × 10−10.00−5.25 × 10−12.70 × 10−1
a32.91 × 10−43.28 × 10−40.00−3.69 × 10−49.52 × 10−4
a4−1.04 × 10−18.49 × 10−10.00−1.81 × 1001.60 × 100
a56.68 × 10−45.50 × 10−30.00−1.04 × 10−21.17 × 10−2
a64.75 × 10−43.36 × 10−30.00−6.29 × 10−37.23 × 10−3
a7−1.03 × 10−80.00 × 1000.00−1.03 × 10⁻⁸−1.03 × 10⁻⁸
HHVdaf = a1 + a2·T + a3·T2 + a4·t + a5·t2 + a6·T·t + a7·T2·t, R2 = 0.21, R = 0.45; T* ranged from 200 °C to 300 °C, t* ranged from 20min to 60 min; * more information in Section 2.2.
Table 9. The values of reaction rate constants and activation energy for elephant dung torrefaction.
T, °CT−1, °C−1k, s−1ln(k), s−1Ea, J·mol−1
2002.11 × 10−31.16 × 10⁻⁵ a−11.4017,700
2202.03 × 10−31.24 × 10⁻⁵ a−11.30
2401.95 × 10−31.49 × 10⁻⁵ a−11.10
2601.88 × 10−31.50 × 10⁻⁵ a−11.10
2801.81 × 10−31.92 × 10⁻⁵ a,b−10.90
3001.75 × 10−32.73 × 10⁻⁵ b−10.50
a, b—letters present a lack of statistically significant differences between k values (p < 0.05).

