Article

Identification and Quantification of Uncertainty Components in Gaseous and Particle Emission Measurements of a Moped

European Commission – Joint Research Centre, 21027 Ispra, Italy
*
Author to whom correspondence should be addressed.
Energies 2019, 12(22), 4343; https://doi.org/10.3390/en12224343
Submission received: 15 October 2019 / Revised: 11 November 2019 / Accepted: 13 November 2019 / Published: 14 November 2019
(This article belongs to the Special Issue Advances in Combustion of Gases, Liquid Fuels, Coal and Biomass)

Abstract

:
The recent Euro 4 and 5 environmental steps for L-category vehicles (e.g., mopeds, motorcycles) were mainly designed to reduce the emissions of particulate matter and ozone precursors, such as nitrogen oxides and hydrocarbons. However, the corresponding engine, combustion, and aftertreatment improvements will not necessarily reduce the solid particle number (SPN) emissions, suggesting that a SPN regulation may be necessary in the future. At the same time, there are concerns whether the current SPN regulations of passenger cars can be transferred to L-category vehicles. In this study we quantified the errors and uncertainties in emission measurements, focusing on SPN. We summarized the sources of uncertainty related to emission measurements and experimentally quantified the contribution of each uncertainty component to the final results. For this reason, gas analyzers and SPN instruments with lower cut-off sizes of 4 nm, 10 nm, and 23 nm were sampling both from the tailpipe, and from the dilution tunnel having the transfer tube in closed or open configuration (i.e., open at the tailpipe side). The results showed that extracting from the tailpipe 23–28% of the mean total exhaust flow (bleed off) resulted in a 24–31% (for CO2) and 19–73% (for SPN) underestimation of the emissions measured at the dilution tunnel. Erroneous determination of the exhaust flow rate, especially at cold start, resulted in 2% (for CO2) and 69–149% (for SPN) underestimation of the tailpipe emissions. Additionally, for SPN, particle losses in the transfer tube with the closed configuration decreased the SPN concentrations around 30%, mainly due to agglomeration at cold start. The main conclusion of this study is that the open configuration (or mixing tee) without any instruments measuring from the tailpipe is associated with better accuracy for mopeds, especially related to SPN measurements. In addition, we demonstrated that for this moped the particle emissions below 23 nm, the lower size currently prescribed in the passenger cars regulation, were as high as those above 23 nm; thus, a lower cut-off size is more appropriate.

Graphical Abstract

1. Introduction

Air pollution continues to have significant impacts on the economy and the health of the European population, particularly in urban areas. Europe’s most serious pollutants in terms of adverse health effects are particulate matter (PM), nitrogen dioxide (NO2), and ground-level ozone (O3) [1]. PM is damaging to ecosystems and cultural sites, responsible for reduced visibility, and an important global risk factor for human health. Automotive exhaust PM, due to its important contribution to urban PM, has been subject to progressively more stringent regulations [2].
PM mass emissions are determined gravimetrically by collecting diluted exhaust gas on a filter. In addition to the PM method, the non-volatile (solid) particle number (SPN) emissions are measured by a specified method [3] in the European Union (EU). The SPN sampling is conducted via Constant Volume Sampling (CVS) of the whole exhaust in a dilution tunnel where the exhaust is diluted. The laboratory particle number systems consist of three parts: First, the exhaust gases pass through a hot diluter (≥150 °C), followed by an evaporation tube (350 °C), and lastly by a condensation particle counter (CPC) with 50% counting efficiency at a particle diameter of 23 nm. The methodology and specifications follow the recommendations of the Particle Measurement Program (PMP) [4]. The accuracy of the methodology was estimated to be around 15%. Inter-laboratory correlation exercises, which include the uncertainty of the source (i.e., the car or engine) found a reproducibility of approximately 35% [4,5].
Since 2011, SPN emissions are regulated in the EU for compression ignition (diesel) light-duty vehicles; the limit value is 6 × 10¹¹ particles per km (p/km from now on). Since 2013, on-road compression ignition (diesel) heavy duty-engines are included in the regulations, and since 2014, positive ignition heavy duty-engines with limits of 6 × 10¹¹ p/kWh. A limit of 6 × 10¹¹ p/km was applied to gasoline direct injection vehicles in 2014 [6]. However, for up to three years a particle number emission limit of 6 × 10¹² p/km could be applied upon request of the manufacturer. Some non-road engines (power range 19–560 kW), inland waterway vessels (>300 kW), and rail traction engines are regulated for SPN since 2017 with a limit of 1 × 10¹² p/kWh. Since 2017, emission testing of light-duty vehicles includes on-road real driving emissions (RDE). Recently, the European Commission decided to extend the lowest detection size of the SPN methodology to 10 nm, to cover cases that have a high fraction of particles in the 10 nm to 23 nm size range (e.g., some vehicles with spark ignition engines) [2].
The only vehicle class so far not covered by SPN limits is the L-category (two- or three-wheel vehicles and quadri-cycles, such as quads and minicars). Nevertheless, moped and motorcycles account about 10% of the passengers mobility fleet [7,8] and contribute significantly to air pollution [9]. Recent EU regulations aim to reduce the share of total road-transport emissions from L-category vehicles as compared to other road vehicle categories with a focus on PM and ozone precursors, such as nitrogen oxides and hydrocarbons. Among other provisions a new test cycle was introduced, the gaseous compounds emission limits were tightened, and a PM mass limit was introduced. In addition, feasibility and cost-effectiveness studies on durability, on-board diagnostics (OBD), in-service conformity, off-cycle emissions, and particle number emissions were required (Regulation (EU) 168/2013). A first investigation on the feasibility and necessity of introducing a SPN limit for L-category vehicles was conducted in 2015 [10]. That research showed that L-category vehicles can have high SPN emissions with a high percentage of them not counted by the current lower limit of 23 nm. However, it was argued that decreasing the lower detectable size could result in volatile artefacts (namely, the formation of volatile particles in the measurement system via nucleation of semi-volatile species—these re-nucleated particles form downstream of the evaporation tube and may be measured by the particle-measuring instrument) and more research was therefore considered necessary. An ad-hoc environmental study concluded that introducing specific SPN limits for L-category vehicles would first require better understanding of the emissions performance of such vehicles, as new emission control technologies at Euro 5 step would become available (from 2020 on) [11]. A detailed analysis of the data concluded that L-category vehicles are a significant contributor to vehicular particulate emissions, and their relative contribution will increase if no measures will be taken [12]. Consequently, a specific particle number limit should be considered for L-category vehicles. A recent study with the latest technology mopeds and motorcycles (all fulfilling the Euro 4 emission standards) reported that, although the PM mass emissions were <1.5 mg/km for all vehicles tested, two motorcycles and the moped were close to the SPN limit for passenger cars and four motorcycles exceeded the limit by a factor of up to four [13]. Even though the repeatability was good (about 10% deviation from the mean), steady state tests with the moped showed big differences between the tailpipe and the dilution tunnel sampling points for sub-23 nm particles. Detailed studies showed that the differences originated mainly from the growth of pre-existing particles with sizes even below 4 nm to the measuring size range of the instruments; however, particles grew due to condensation of desorbed material from the walls of the transfer tube [14,15].
The previous studies suggest that the current legislative SPN methodology cannot be directly extended to L-category vehicles. On the one hand, the mean particle size is close to or lower than the lower size of the current methodology (23 nm) [10], on the other hand sub-23 nm artefacts are more probable with this category of vehicles than with light-duty or heavy-duty category vehicles [16]. Some of the existing facilities are used for both motorcycles and light-duty vehicles and consequently might not be optimized for mopeds. The low exhaust flow rate may lead to high residence times in the transfer lines and consequently high particle losses. Extraction of a sample from the tailpipe for analysis (e.g., real time gas analyzers) (sometimes the term bleed off is used) at the moment is not taken into account in any automation system for SPN emissions (neither in the light-duty regulation). Although this effect might not be important for light-duty vehicles, for mopeds it may result in a significant error. The recently introduced RDE regulations require measurements from the tailpipe. The equivalency of the tailpipe and dilution tunnel locations has been investigated for heavy-duty engines [17] and for light duty vehicles [18], but not for L-category vehicles. The few studies that did some preliminary investigations found big differences both in size distributions and number concentrations [19]. However, there are no studies that have quantified these differences. Thus, there is a need to summarize the open issues for L-category vehicles, especially for particle number measurements, and quantify the measurement uncertainties.
In the International vocabulary of metrology (VIM) [20], Type A evaluation of uncertainty is defined as the method of evaluation of uncertainty by the statistical analysis of series of observations. Repetitions of a test and statistical analysis are classified as Type A uncertainty. Type B evaluation of uncertainty is defined as the method of evaluation of uncertainty by means other than the statistical analysis of series of observations, for instance, calibration reports and guides. This approach was recently followed to estimate the uncertainty of PEMS (portable emissions measurement systems) [21]. In this study we followed a Type B analysis where we tried to collect all parameters that can contribute or influence the final result and quantified them based on theoretical or experimental data. We started from the equations that are used to calculate emissions both at the tailpipe and the dilution tunnel and then discussed possible errors and inaccuracies for each parameter. Even though we did two to three repetitions of each test condition, and thus Type A uncertainty was available, we did not cover the calculation of the combined standard uncertainty and expanded uncertainty, as foreseen in the Guide to the Expression of Uncertainty in Measurement (GUM) [22]. The objective was to identify and quantify the sources of uncertainty/errors that repetitions cannot identify (e.g., tests can be repeatable but erroneous). The focus was on SPN emissions. Gas analyzers and SPN instruments with various cut-off sizes were used to cover current and future regulations. A moped in a facility for motorcycles and passenger cars was chosen as the worst case scenario due to its small weight and engine capacity and the necessity for long transfer lines. Finally, recommendations for appropriate setups and procedures were given.

2. Materials and Methods

2.1. Experimental Setup

The experimental measurements were performed at the Vehicle Emissions Laboratory (VELA 1) of the European Commission’s Joint Research Centre. The facility is an emission test cell for L-category vehicles (such as mopeds and motorcycles) and light-duty vehicles (such as small passenger cars). Herein, we consider emission-test measurements performed with a Euro 4 moped with a 50 cm3 4-stroke engine with a three-way catalyst (>1000 km at the odometer). As shown in Figure 1, which presents schematically the experimental setup, the tailpipe of the moped was connected to a 6 m stainless steel transfer tube. The first section of the transfer tube, the first 4 m, was flexible and heated (heater set to 80 °C), while the second section, the last 2 m, was fixed, insulated, and kept in a climatic room at 20–24 °C. The moped and the first 4 m of the transfer line were inside a different climatic chamber kept at 21–25 °C. The whole exhaust gas was diluted in the dilution tunnel with constant volume sampling (CVS) set to 3.5 m3/min. With this flow rate, the under-pressure at the tailpipe of the moped is small, and similarly its influence on emissions [23]. The dilution tunnel and the CVS were in the climatic room kept at 20–24 °C.
For gaseous pollutants, two identical AMA i60 (AVL, Graz, Austria) benches were used to measure dry CO and CO2 with non-dispersive infrared detectors, NOx with chemiluminescence detectors, and total hydrocarbons (HC) with flame ionization detectors. One system was connected to the tailpipe and the other to the full dilution tunnel with CVS.
The particle measurement systems we used in this study were AVL particle counters (APC 489, Graz, Austria) [24], which consisted of the following parts: A hot diluter at 150 °C, an evaporation tube at 350 °C, a cold diluter with filtered ambient air at 20 °C, and three Condensation Particle Counters (CPCs). As shown in Figure 1, the CPCs had different 50% counting efficiencies: At 23 nm (model 3790 from TSI, USA), at 10 nm (model 3772 from TSI, USA), and at 4 nm (model 3752 from TSI, USA) [25,26]. Two such SPN measurement systems were used. They were identical and freshly calibrated. One (SPN #1) measured always at the tailpipe and the other (SPN #2) at the dilution tunnel (CVS). The SPN #1 was connected to the tailpipe with a stainless steel 0.5 m heated tube at 120 °C.
The transfer tube that conducts the exhaust flow from the moped tailpipe to the dilution tunnel was usually connected to the moped. For some tests, however, the connection was left open on the side normally connected to the moped (Figure 1, left inset). The tailpipe instruments were sampling at the moped tailpipe, before the opening. The CVS under-pressure sucked ambient air also from the opening in addition to that from the external line for main dilution. The dilution factor of this first dilution is not known; based on some steady state tests it is expected to be around 2:1 at the maximum speed and higher at lower speeds [14,19]. This configuration (open transfer tube) is allowed in the EU motorcycles/mopeds regulation, and it has been used previously [23]. We note, however, that the closed configuration is more common [7,27,28,29,30,31,32].
The test cycle was the Worldwide harmonized Motorcycle Test Cycle (WMTC) class 1 consisting of a cold engine start phase followed by the same phase in hot engine conditions for a total of 7.6 km and 45 km/h maximum speed [33].

2.2. Theoretical Background

L-category regulation provides the equations for gaseous pollutants measured from the dilution tunnel with bags. In our case, we used the integrated signal from the analyzers in order to compare real time signals as well. Equations from the tailpipe can be found in passenger cars regulations at the RDE (Real-Driving Emissions) regulation or at the heavy-duty engines regulation and were summarized elsewhere for gaseous pollutants [34]. Here, the equations for SPN will be given for both the tailpipe and the dilution tunnel, because there is lack of information and it is the most complex case (see also [18]). In addition, we will expand them to take into account the extracted flow from the tailpipe (bleed off). Other topics that can influence the results and have been mentioned in the literature will also be shortly presented.

2.2.1. Solid Particle Number (SPN) Emissions

The tailpipe instantaneous particle number flow rate SPNTP,i [p/s] can be determined by multiplying the instantaneous particle number concentration CTP,i [p/m3] (normalized to 0 °C and 101.3 kPa) by the instantaneous exhaust mass flow rate Qexh,i [kg/s] (aligned to each other), and by dividing with the density of the exhaust gas ρexh [kg/m3] at 0 °C. A density of 1.2931 kg/m3 was used for gasoline (E10) (Regulation (EU) 2017/1154). The total tailpipe emissions SPNTP [p/km] were calculated by integrating the SPNTP,i rate over the test cycle and dividing by the distance covered D [km] (7.6 km in our tests).
SPNTP,i = CTP,i Qexh,i/ρexh
SPNTP = Σ SPNTP,i/D
When a flow is extracted from the exhaust gas, the equation is still valid if the Qexh includes this extracted flow rate.
The CVS instantaneous particle number flow rate SPNCVS,i [p/s] was calculated as above using the CVS flow rate QCVS [kg/s] and the density of air ρair [kg/m3] at 0 °C. The total tailpipe emissions SPNCVS [p/km] were calculated by integrating the SPNCVS,i rate over the test cycle and dividing by the distance covered D [km].
SPNCVS,i = CCVS,i QCVS,i/ρair
SPNCVS = Σ SPNCVS,i/D
When a flow is extracted from the dilution tunnel, the equation is still valid if the QCVS includes this extracted flow rate; however, the correction is usually negligible.
The final SPNCVS result is equivalent to the one in the passenger cars and trucks regulations. The time alignment is less critical in this case:
SPNCVS = CCVS,ave VCVS/D
where VCVS [l] is the volume of the diluted exhaust gas (normalized to 0 °C and 101.3 kPa) and CCVS,ave [p/m3] is the mean concentration during the cycle duration (normalized to 0 °C and 101.3 kPa) (Regulation (EU) 2017/1151).
The particles extracted from the tailpipe SPNextr,i were calculated using the instantaneous particle number concentration CTP,i [p/m3] (normalized to 0 °C and 101.3 kPa) and the instantaneous flow rate of the instruments sampling from the tailpipe Qinstr,i [kg/s]. In our case, the total extracted flow rate was constant and equal to 19–23 l/min due to the SPN instrument(s) and the gas analyzers. The total particle emissions extracted from the tailpipe SPNextr [p/km] were calculated by integrating the SPNextr,i rate over the test cycle and dividing by the distance covered D [km].
SPNextr,i = CTP,i Qinstr,i/ρexh
SPNextr = Σ SPNextr,i/D
The corrected CVS results SPNCVS,corr,i were calculated by adding the SPN emissions of the dilution tunnel SPNCVS,i and the SPN extracted from the tailpipe SPNextr,i.
SPNCVS,corr,i = SPNCVS,i + SPNextr,i
For completeness, another way to calculate the SPN emissions due to the extracted flow from the tailpipe, when no tailpipe SPN measurements are available, is to recalculate every second of the concentrations at the dilution tunnel by using the “true” dilution ratio at the CVS as if no flow had been extracted. The reason is that the extraction of a flow from the tailpipe results in higher dilution in the dilution tunnel, which is not considered in the calculations. This is equivalent to increasing the exhaust flow that would enter the dilution tunnel by the flow extracted by the instruments connected to the tailpipe. As an example, using the difference between CVS total (QCVS) and dilution air flow (Qair) rates as a proxy of the exhaust flow, the final SPN concentration would be:
SPNCVS,corr,i = SPNCVS,i/(QCVSQair,i) × (QCVSQair,i + Qinstr,i)
Details about other methods determining the exhaust flow rate or the dilution factor are given in the next paragraph.
For the open transfer tube case, the same tailpipe equations can be used as long as the tailpipe SPN measurements are taken before the dilution at the tailpipe and the exhaust flow rate is estimated correctly.
The results of the SPN emissions at the tailpipe need correct time alignment between the SPN signal and the exhaust flow rate. Misalignment of a few seconds can have a significant effect [35]. Here, the effect of misalignment was checked by moving the SPN signal for ±1 second. Long sampling lines might result in signal deformation due to mixing and diffusion and need advanced mathematical models to “reconstruct” the original signal [36,37,38]. The tailpipe measurements due to the short sampling lines should not have this issue. It should be mentioned though that the deformation of the signal from the engine to the tailpipe is not of importance in this paper, because only tailpipe with dilution tunnel results are compared [39].

2.2.2. Exhaust Flow Rate

The exhaust flow rate Qexh can be determined with various methods. The direct measurements with exhaust flow meters are sensitive to the exhaust gas fluid conditions, such as the temperature, flow rate, composition, and pressure [40]. In small one- or two-cylinder gasoline engines, there is also a problem with pulsating flows especially during idling, which can even include reverse flow direction. For this reason, today, there are no exhaust flow meters for mopeds and small motorcycles and indirect methods are used. In the case of non-road, small utility purpose engines, for example, the sum of intake air mass and fuel mass flow is used as the exhaust mass flow [41]. Alternatively, one of these two flows can be calculated from the other with the measurement of the air/fuel ratio obtained with a lambda sensor.
Here, we used three methods applicable in the laboratory: The instantaneous difference between total CVS flow QCVS (corrected for any flows extracted from the dilution tunnel) and dilution air flow (Qair) (Equation (10)), the CVS flow and the instantaneous dilution factor (DF) calculated by the CO2 tracer method (Equation (11)), or the carbon balance method (CB) (Equation (12)).
Qexh,air,i = QCVSQair,i,
Qexh,CO2,i = QCVS/DFCO2,i,
Qexh,CB,i = QCVS/DFCB,i,
DFCO2,i = CCO2,TP,i/CCO2,CVS,i,
DFCB,i = 13.4/(CCO2,CVS,i + CCO,CVS,i + CHC,CVS,i)
where C is the concentration [%] of the pollutant in the dilution tunnel (CVS) or tailpipe (TP) for each second i. The concentrations should refer to the wet exhaust (i.e., the dry-to-wet correction should be applied [42]) and should also be corrected for the dilution air background. The dry-to-wet correction is important for the tailpipe concentrations, while the dilution air background correction is important for the dilution tunnel concentrations. The 13.4 is the theoretical CO2 concentration for a gasoline engine, around 13.4%, which is obtained with the average composition of gasoline fuel (C8H15) [40]. Note also that the CO2 tracer method needs a CO2 analyzer sampling from the tailpipe beyond that at the dilution tunnel, and this extracted flow has to be considered in the calculations. The extracted flow rate has to be added to the equations above to find the actual exhaust flow rate.
Qexh,i = Qexh,method,i + Qinstr,i

2.2.3. Cold Start

During cold start condensation can take place and this has an effect up to 10% on the results of instruments measuring on dry basis (e.g., CO2 or CO) [42]. According to our knowledge there are no SPN instruments measuring in dry basis. Therefore, the correction is not needed.

2.2.4. Particle Dynamics

The main aerosol processes from the tailpipe to the full dilution tunnel are agglomeration, diffusion, and thermophoresis [18,43,44].
Agglomeration arises from particle to particle collisions where the colliding particles are attached together, but retain their identity and shape. Agglomeration changes the number concentration and size of particles, but not the total particle mass concentration. The extent of agglomeration depends on the initial particle concentration and, to a smaller degree, on particle size and surrounding temperature.
Diffusion is the net movement of particles (or gas molecules) from high to low concentration. Smaller particles diffuse faster than larger particles. Therefore, diffusion is most important for particles smaller than about 50 nm in diameter. Particle concentration decreases in the exhaust transfer lines due to diffusional deposition of particles on the surfaces.
Thermophoresis is the motion of a particle in a temperature gradient. Due to the higher rate of collisions of gas molecules on the hotter side the particle, thermophoresis results in particle movement towards the colder side (i.e., particles in high temperature exhaust gas to the colder walls).
Other transport losses (e.g., gravitational deposition, inertial impaction, electrophoretic) and sampling losses (due to anisoaxial and anisokinetic extraction of sample) were considered negligible as they affect larger particles than those emitted of the moped of this study (<1 μm) [44]. A detailed presentation of the topics is out of the scope of this paper. Details can be found in the literature [18,43,44].
This study focused on measurements of solid particles carried out following the current EU legislation (Regulation (EU) 2017/1151) and on the related uncertainty. The measurements of total particles (including volatiles) are not included in the legislation, both in the laboratory and on the road (Regulation (EU) 2017/1154). They depend on many parameters, such as the dilution ratio and the dilution air temperature, which can result in orders of magnitude difference between different settings [45]. This topic has been discussed in the literature [46] and was beyond the scope of this study.

2.2.5. Artefacts

When comparing solid particle number concentrations, it has to be ensured that no artefacts take place. The volatile artefact is the formation, downstream of the evaporation tube, of volatile particles via re-nucleation of semi-volatile species in the measurement system [16,47]. These particles are volatiles but are counted as solids. The appearance of solid particles in the transfer line due to formation or growth in the transfer tube is defined as a nonvolatile artefact [14,15]. Artefacts at sub-23 nm particle measurements of mopeds and motorcycles have been reported in the literature [13,15]. The topic will not be further discussed; it should be noted though that due to the low exhaust gas temperatures and the high employed dilution in the SPN systems, we do not expect any artefacts in our results.

3. Results

3.1. Exhaust Flow

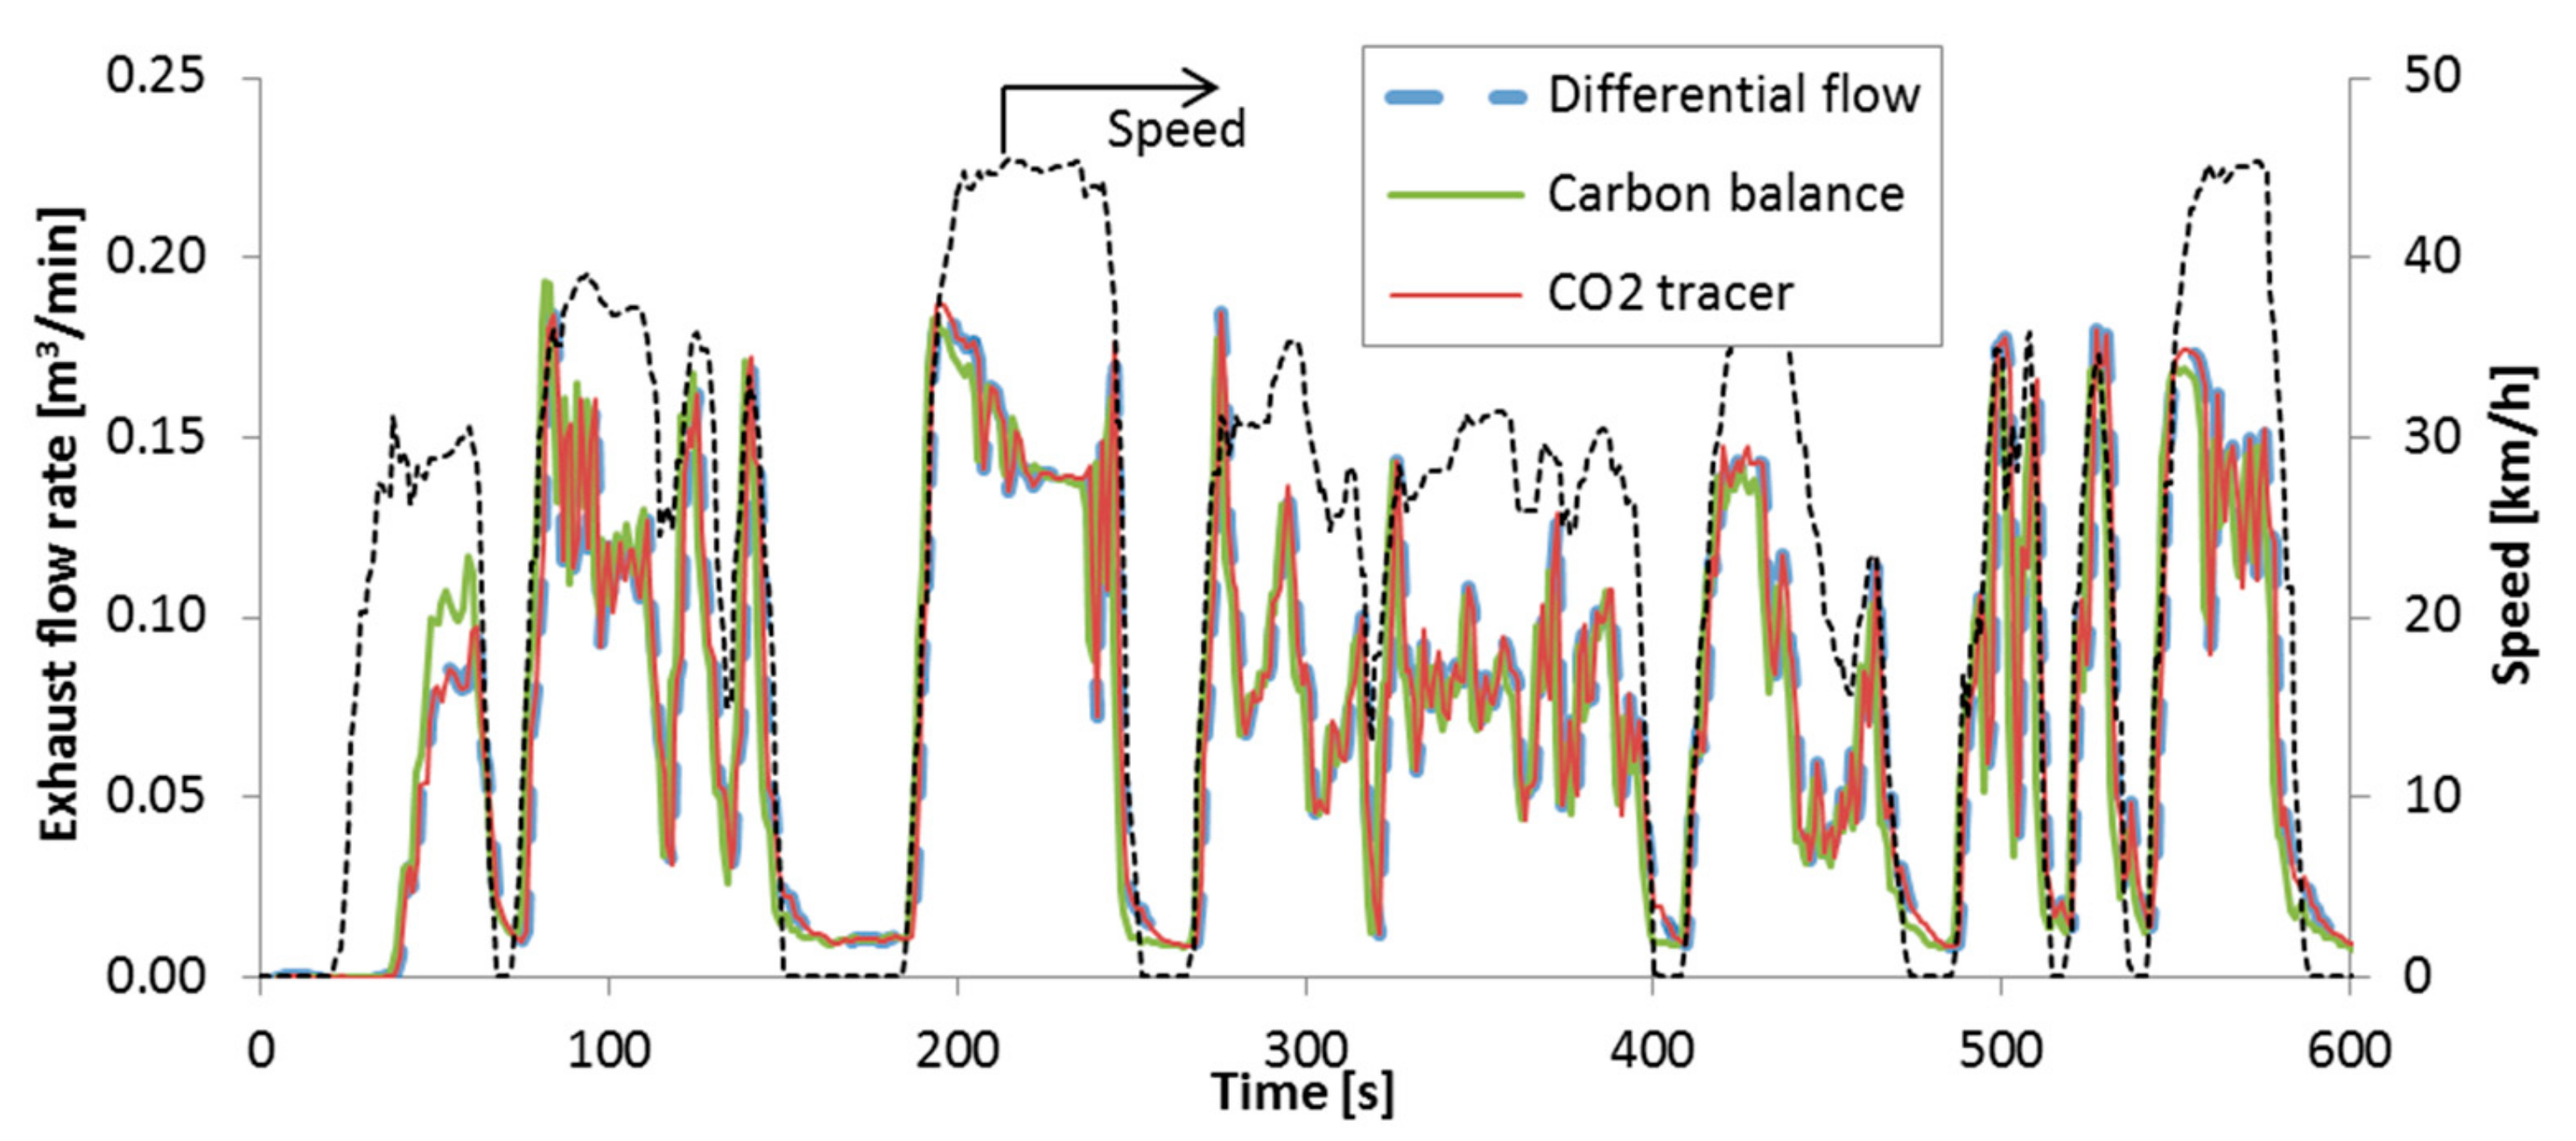
Figure 2 plots the exhaust flow rate of the motorcycle as estimated by the three methods (Equations (10)–(12)). There is a very good agreement between the different methods. Even though not shown here, the carbon balance method without the CO2 dilution air correction would slightly overestimate the exhaust flow rate. The CO2 tracer method was considered the basis for further evaluations.
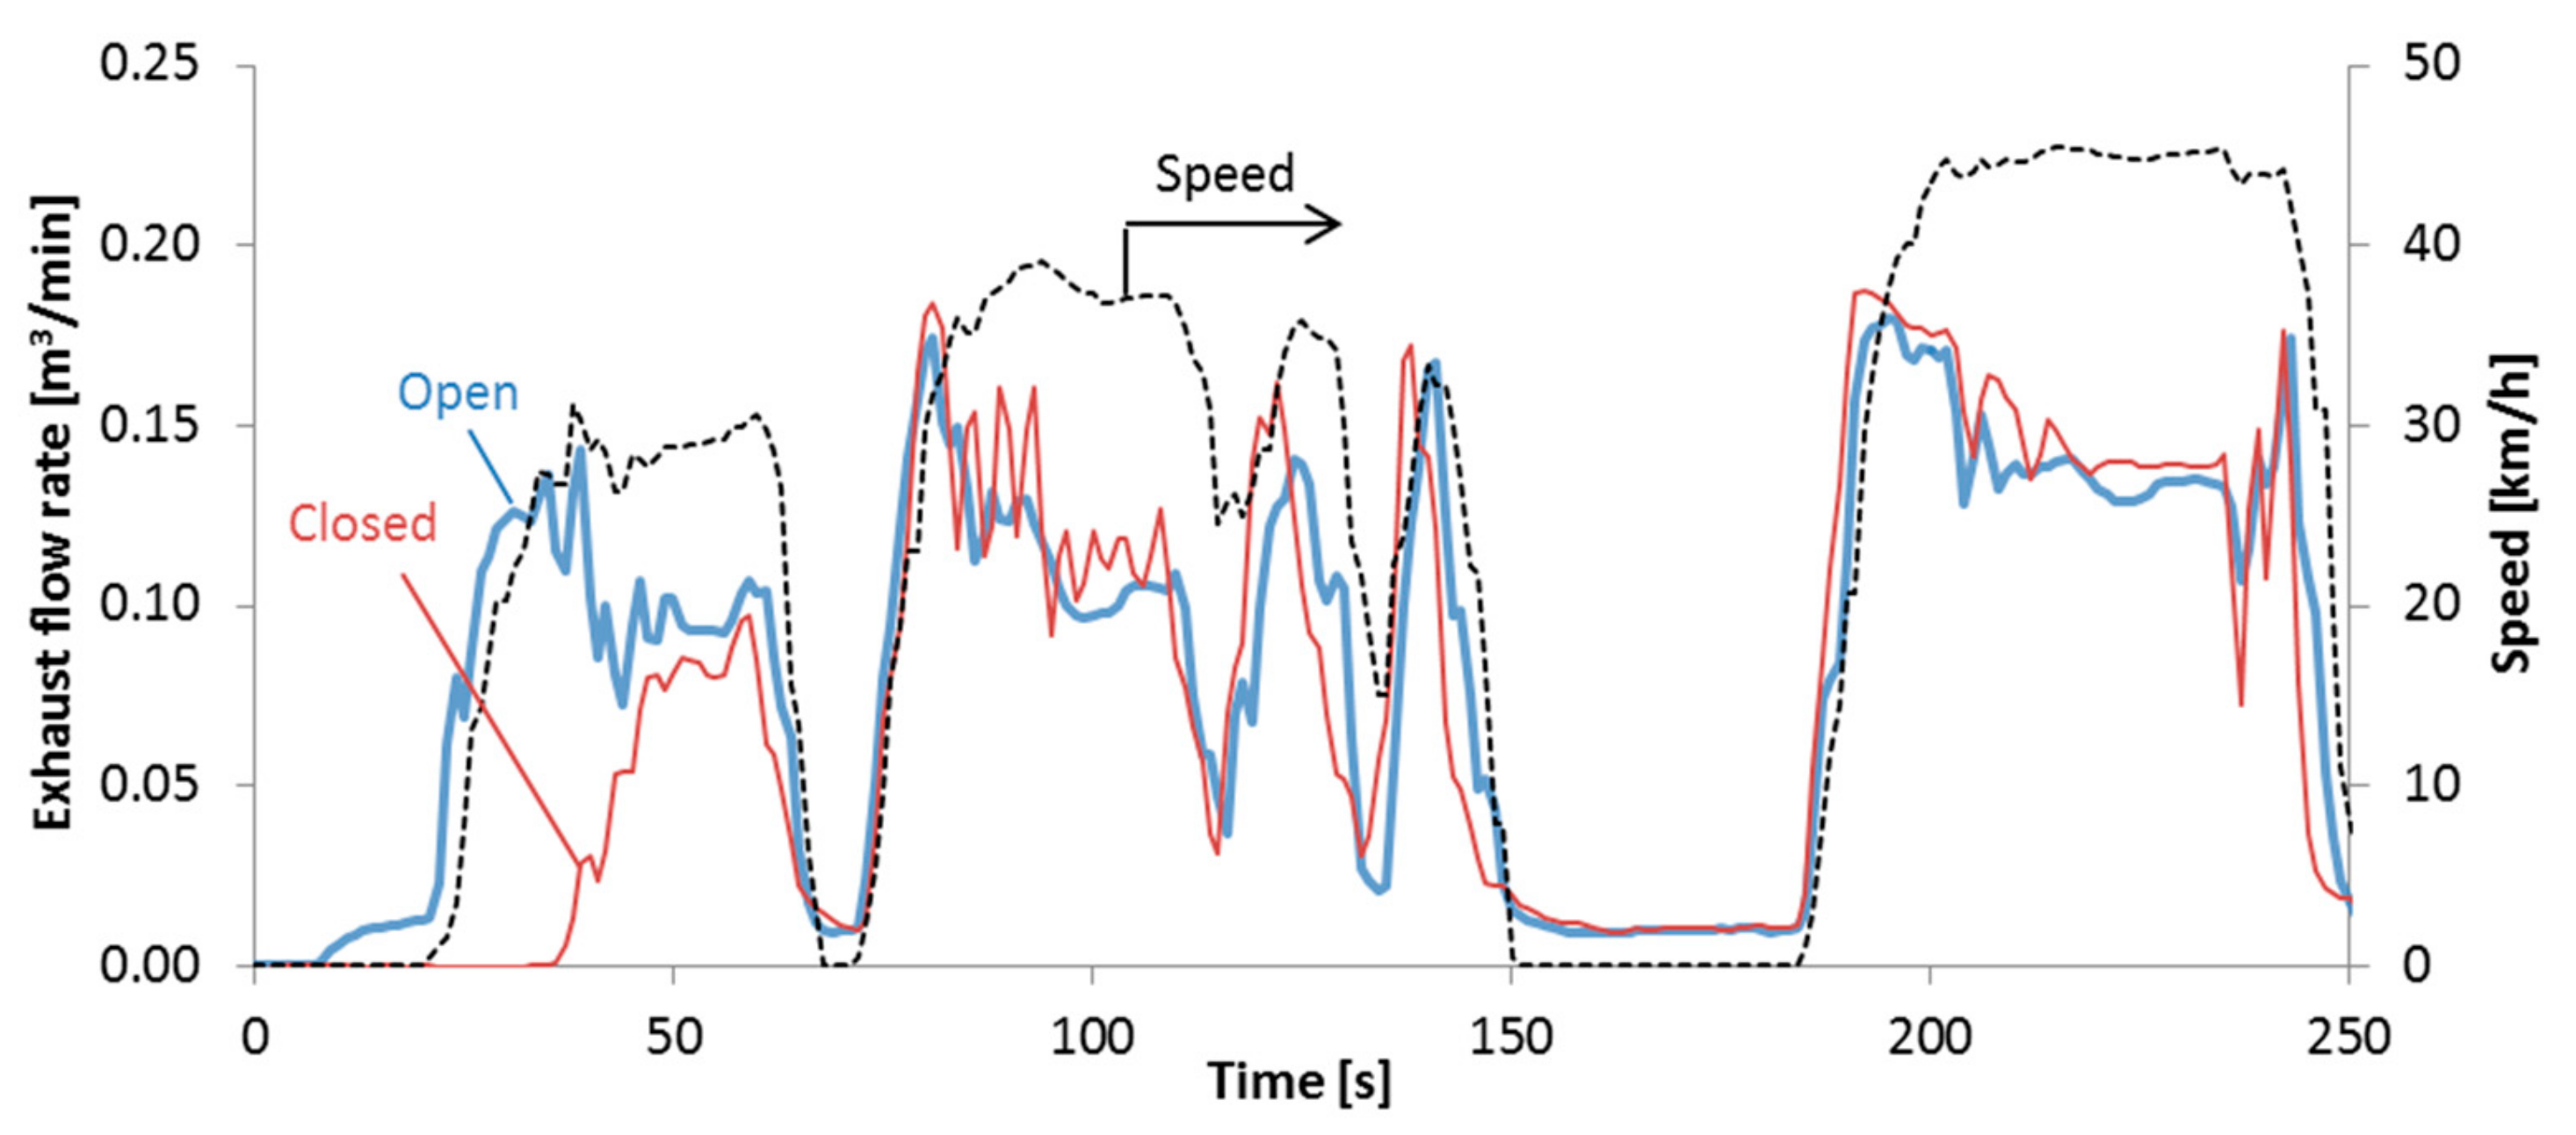
At a next step, the calculated exhaust flow rate with the CO2 tracer method was plotted for the two configurations with closed and open transfer tube (Figure 3) during the first 250 s of a cold start WMTC. After the first minute, there is a generally good agreement within the experimental uncertainty. However, there is a significant difference at the beginning of the cycle: The exhaust flow rate with the transfer tube closed starts much later. The reason is that there is a big “dead” volume in the transfer tube that delays the CO2 signal at the dilution tunnel. The gas transport delays, mixing and dispersion phenomena, are responsible for smoothing and distortion of the original emission signal [36,38,39]. Furthermore, even though the transfer tube is heated, there may still be colder spots where condensation can take place. This condensation will be different with the open and closed configurations, resulting in different actual CO2 concentrations. However, the dry-to-wet corrections of the CO2 signal do not take this into account [42]. We cannot exclude completely the possibility that the moped behaved differently with open and closed configurations. However, the CO2 tailpipe signals (and the results later) did not show any difference. This figure clearly shows the importance of having short transfer lines. In the following results, the first 50 s of the calculated exhaust flow rate were corrected using the exhaust flow rate of the open configuration; the effect of this correction will also be shown.

3.2. CO2 and Gaseous Pollutants

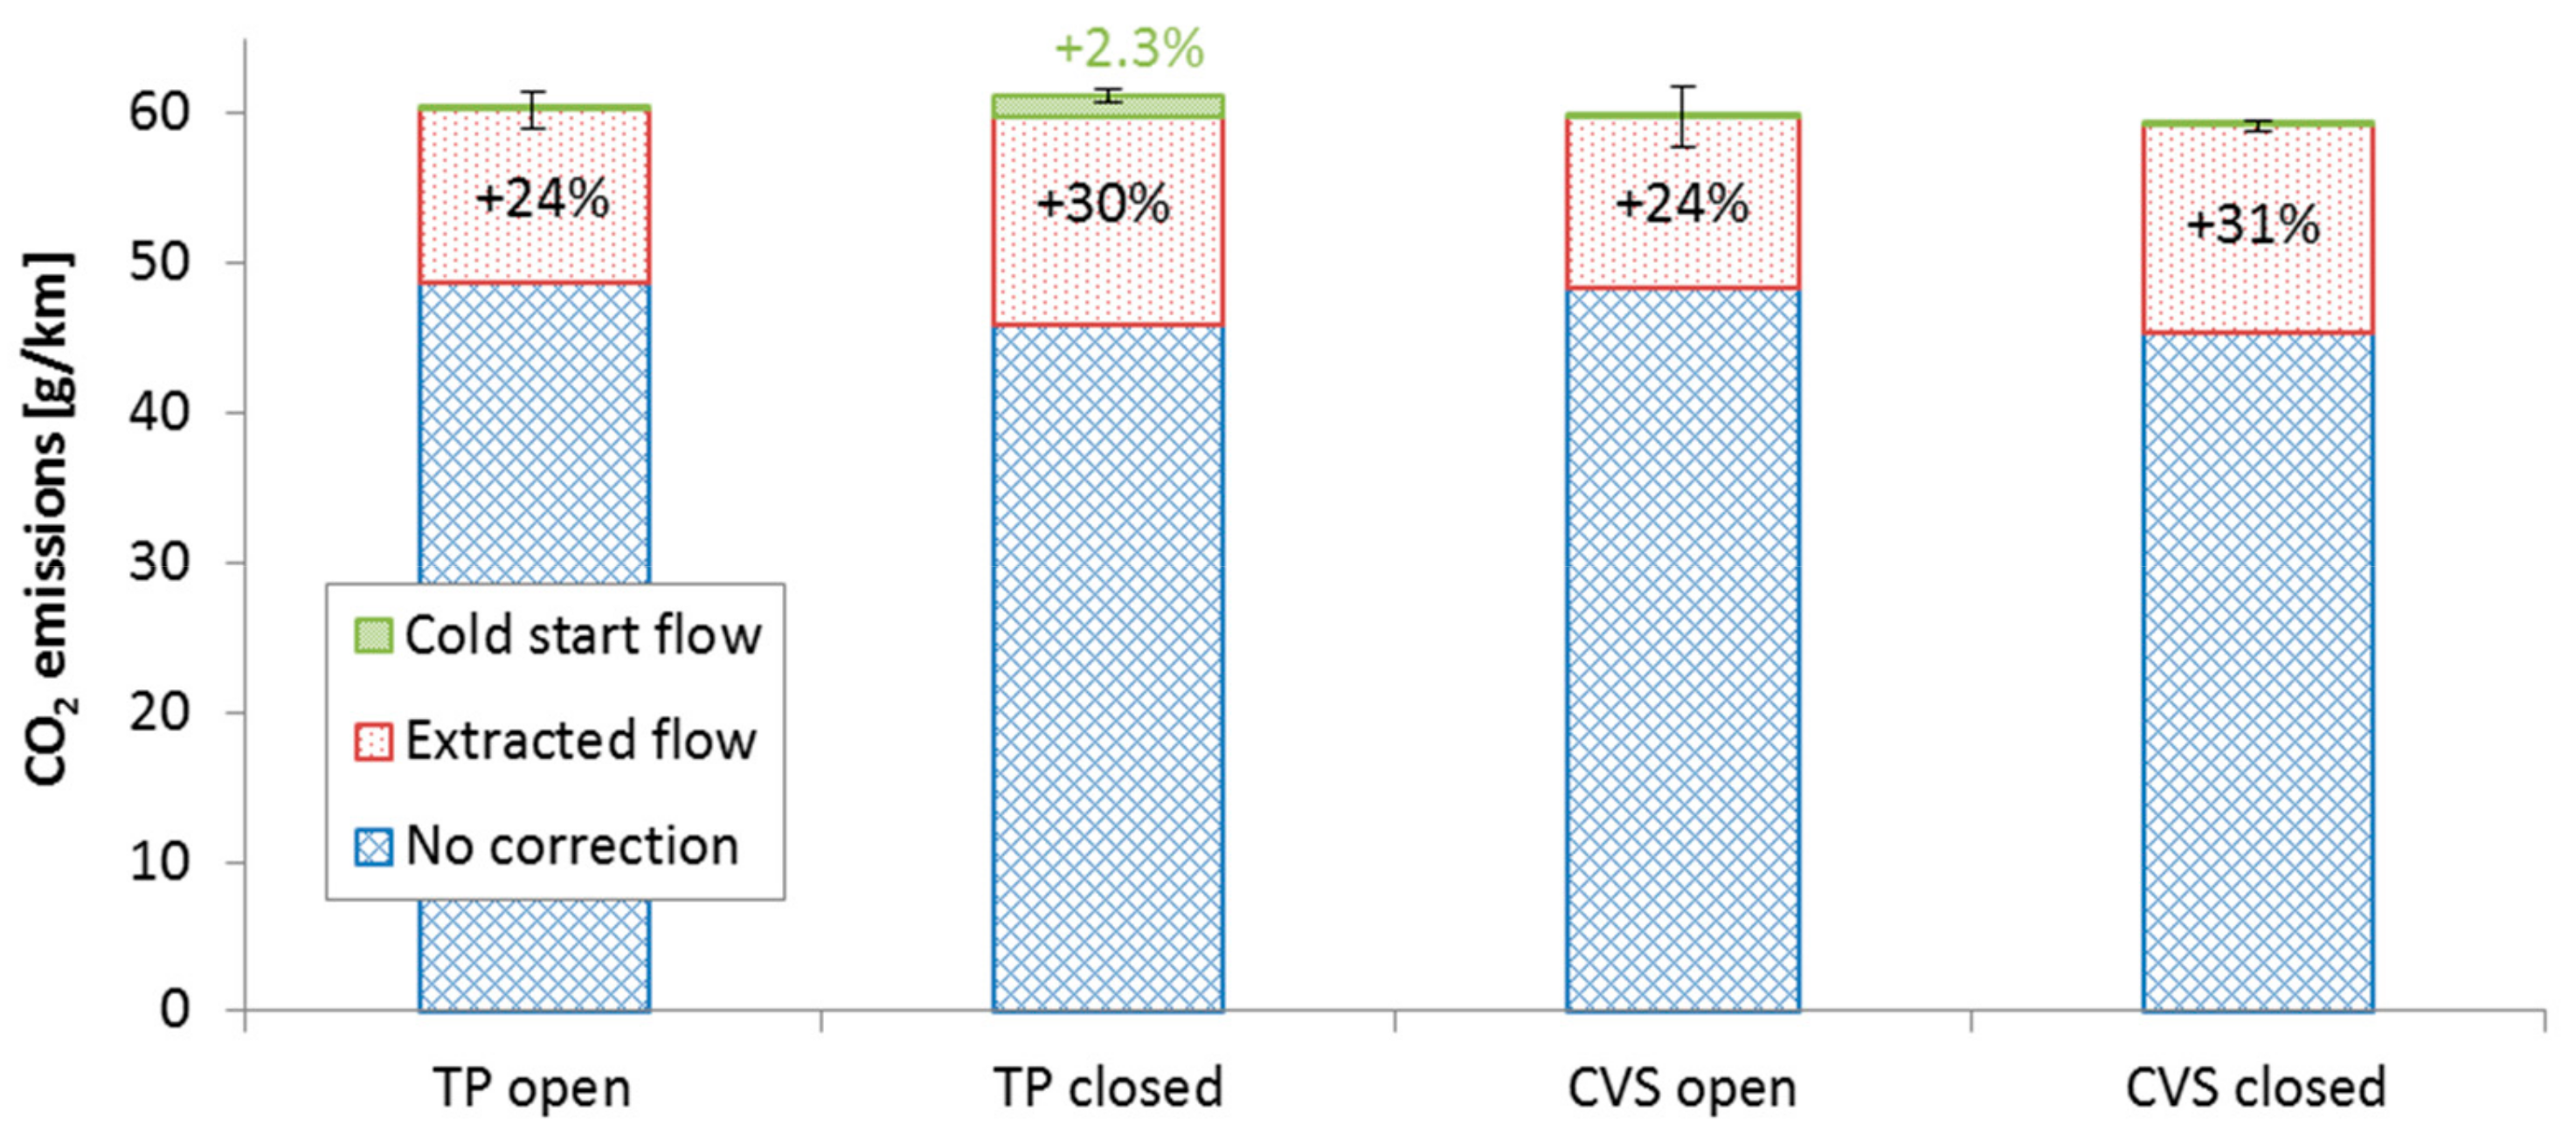
Figure 4 plots the CO2 emissions over the WMTC as determined at the tailpipe and the dilution tunnel with integration of the gas analyzers signals with the transfer tube open and closed. The agreement is very good within the experimental uncertainty. For the tailpipe measurements, the improvement of the exhaust flow determination at the first minute of cold start (as discussed in Figure 3) increased the CO2 emissions by 2.3%. However, single factor analysis of variance (ANOVA) showed that the CO2 differences were not statistically significant with or without the correction for the first 50 s of the of exhaust flow (p = 0.23, N = 10). The dilution tunnel results were increased 24% to 31% from the addition of the mass of the extracted exhaust from the tailpipe sampling (Equation (7)). This percentage was similar to the mean extracted flow rate; the extracted 19–23 l/min corresponded to 23–28% of the mean total exhaust flow rate.
For the rest gases, the results were similar: The extracted flow rate from the tailpipe contributed 19% to 30%, while the first 50 s erroneous exhaust flow rate determination affected 3.5% (CO), 23% (NOx), and 51% (hydrocarbons) of the rest gases. Thus, the contribution was pollutant specific.

3.3. Solid Particle Number (SPN)

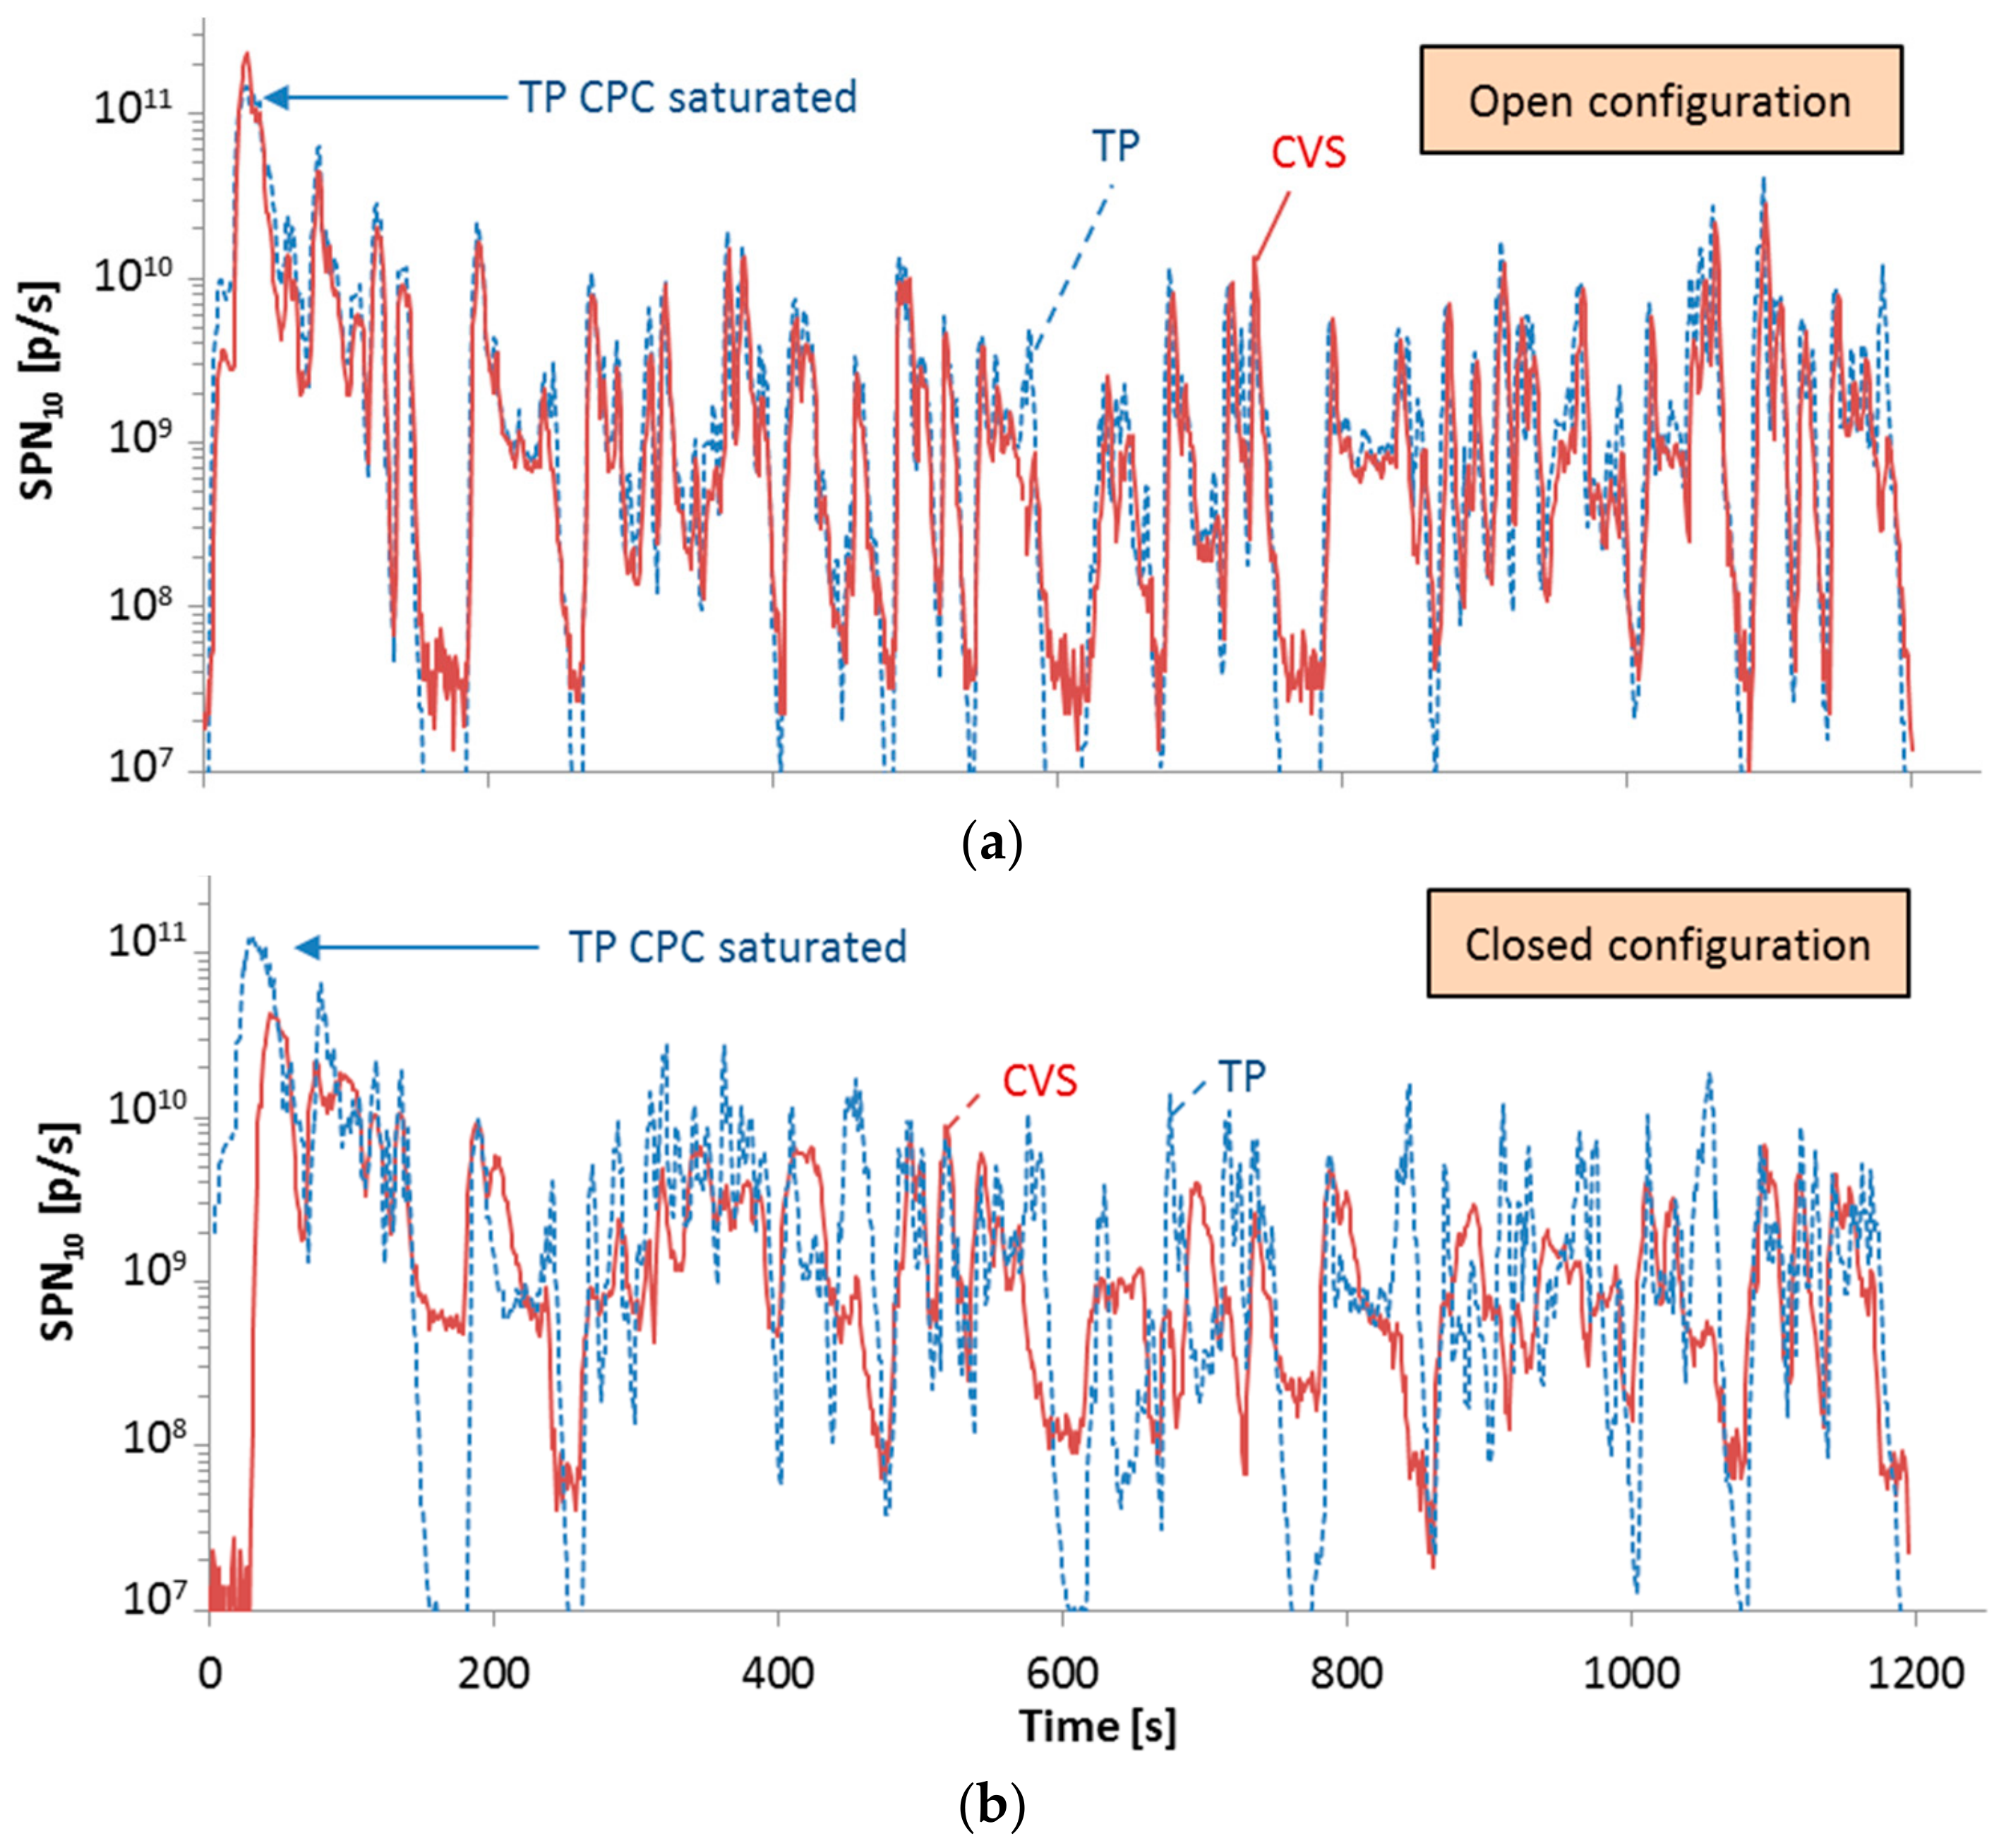
Figure 5 plots the SPN real time emissions over the tested cycle (WMTC) for the two configurations (open and closed transfer tube). With the open configuration (Figure 5, upper panel), the SPN at the CVS and tailpipe (TP) agree very well, with the exception of the first minute, where the CPC of the tailpipe particle number system was saturated (it measured around 60,000 p/cm3 where the maximum is around 10,000 p/cm3). The 10 nm was saturated for approximately 25–30 s, while the 23 nm CPC for 10–15 s. The good agreement between tailpipe and dilution tunnel results indicates that there were no artefacts (i.e., formation of particles after the tailpipe). This was expected because the exhaust gas temperature was low (<200 °C) and the instruments dilutions were high (>1000:1).
The picture is very different with the closed configuration (Figure 5, lower panel). The tailpipe results are similar to the open configuration (compare blue dashed TP lines of lower and upper panels), as expected, because the sampling location was the same. However, the SPN at the dilution tunnel is smoother and in some cases the particle peaks appear later due to the variable residence time in the transfer tube. The concentrations seem lower, especially in the first minute. The emissions are very high at cold start, leading to considerable particle losses mainly due to agglomeration. These losses yield decreased particle concentrations at the dilution tunnel.
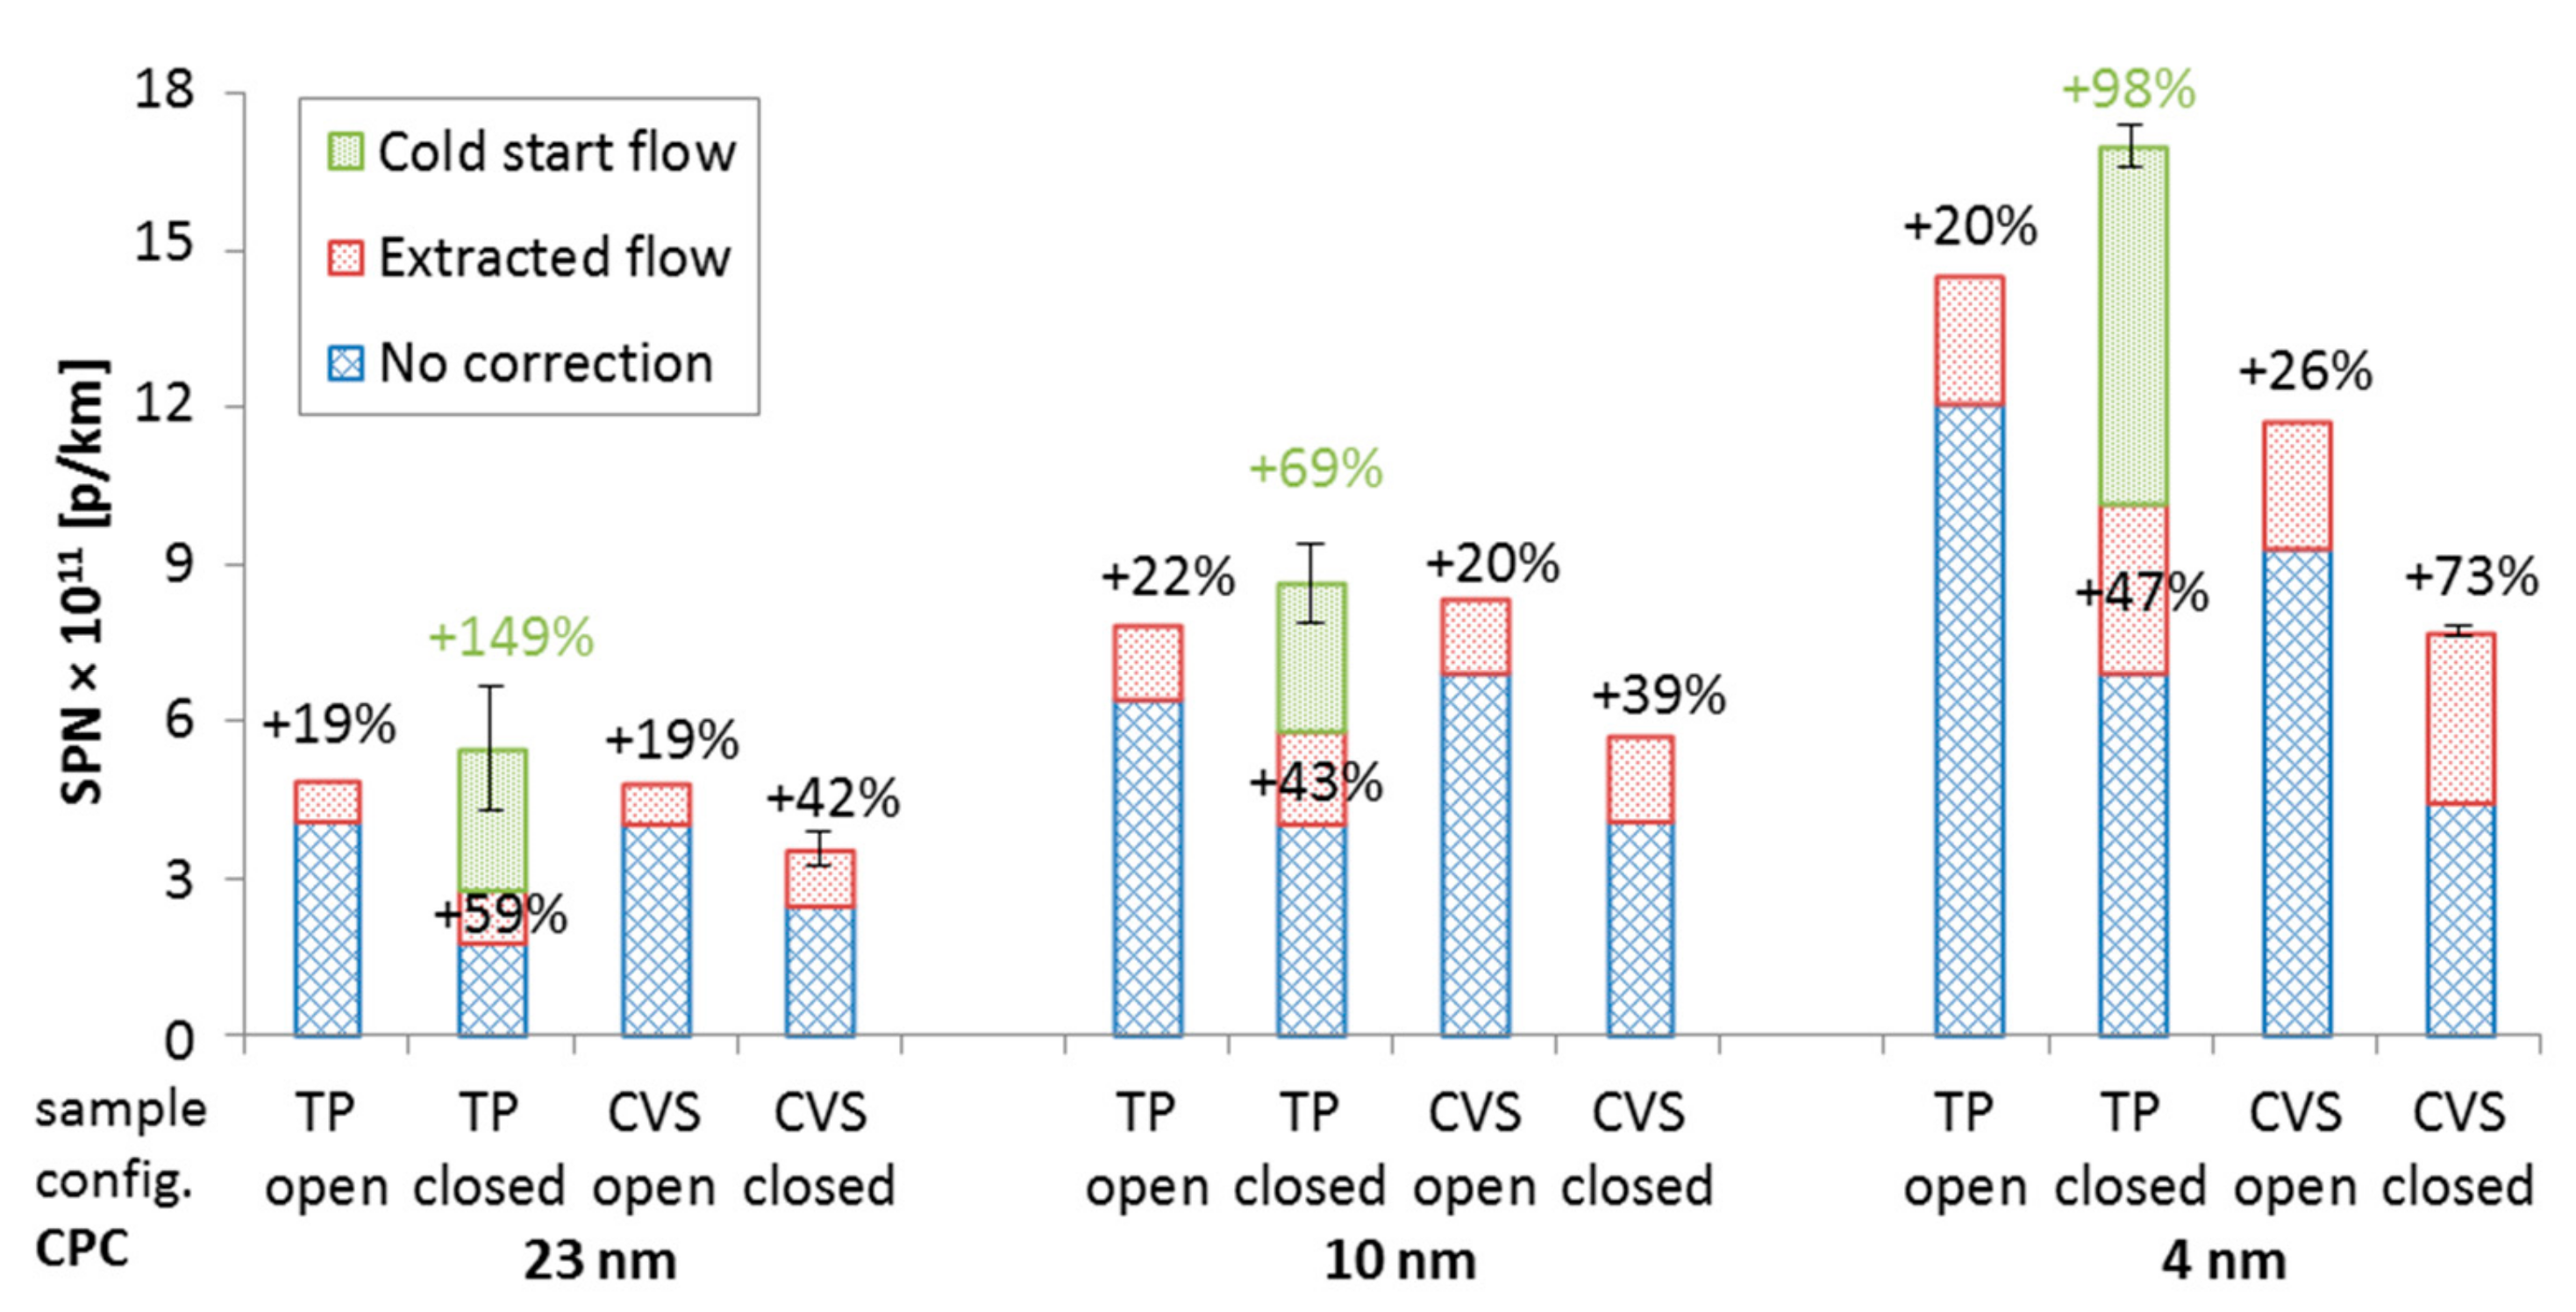
Figure 6 summarizes the results of all tests conducted: Tailpipe and dilution tunnel measurements with open and closed configurations. The results are given separately for the three CPCs with lower particle sizes of 4 nm, 10 nm, and 23 nm. The CVS results were corrected for the extracted flow rate from the tailpipe (Equation (7)) (bleed off), while for the TP results the extracted flow rate was taken into account by adding it to the exhaust flow rate. The “bleed off” correction was 19–26% for the open transfer tube case and 39–73% for the closed one. The percentages depend on the absolute emission levels, and also on when the emissions take place. The percentages are higher with the closed configuration because the absolute levels are lower. The tailpipe results with the first 50 s corrected exhaust flow rate for the cold start (Figure 3) were 69% to 149% higher than without the correction due to the high SPN emissions at the cold start. After correction, the tailpipe measurements with the closed configuration were close to the tailpipe measurements with the open configuration.
After corrections, and assuming that the tailpipe results with the open configuration are the reference values as best available option, the differences become –7% to +4% for the tailpipe with the closed configurations, –2% to +19% for the dilution tunnel with the open configuration, but –19% to –41% for the dilution tunnel with the closed configuration. The lower closed configuration results indicate 20–40% particle losses in the exhaust transfer line. Theoretical calculations using the 4 nm concentrations and a mean size of 20 nm estimated the contribution of agglomeration around 30% [44]. The contribution of thermophoresis was estimated to be <2%, and of diffusion <5%. As the corrected results were in good agreement to each other, the possibility of sub-23 nm artefacts is unlikely in our tests.
Based on the open transfer tube results, the specific moped had SPN23 emission levels below the light-duty vehicles limit set for particles >23 nm (6 × 10¹¹ p/km), but higher when considering the particles below 23 nm. Based on the increasing emissions with decreasing lower size, the solid particle size distribution peaked at a size close to 10 nm.

4. Discussion

This study, based on transient tests of a moped, quantified the uncertainties in emissions measurements using gaseous analyzers and solid particle number (SPN) instruments with cut-off sizes of 4 nm, 10 nm, and 23 nm at the tailpipe and the dilution tunnel. Two configurations were tested: Closed and open transfer tube to the dilution tunnel; both allowed in the current EU regulations (for gaseous pollutants). The results of this study can be used to draft a list of issues to be discussed in current and future legislation development and research activities. This is the first study to discuss uncertainties of this type for L-category vehicles. We are also not aware of similar discussions for passenger car and trucks. Although the results cannot be directly generalized to other mopeds and motorcycles (relative magnitude of the uncertainties may differ), Table 1 identifies common issues which will be of significance.
The results had to be corrected for the extracted flow rate from instruments sampling from the tailpipe. This is typically done by the laboratory automation software for gaseous pollutants, but not for SPN. The typical approach is to have two instruments measuring simultaneously at tailpipe and dilution tunnel and add to dilution tunnel results the particles that are extracted from the tailpipe. Using the CVS real time signal and correcting with the “true” CVS dilution factor based on the differential method (Equation (9)) would be another approach when no tailpipe measurements are taken. This correction was on the order of 19–73% in this study due to the low exhaust flow rate of the moped (extracted flow 23–28% of mean flow). Thus, the instrument used (SPN instrument and gas analyzers) were taking a significant part of the moped’s exhaust flow. The Global Technical Regulation (GTR) 15 for light-duty vehicles allows a maximum 0.5% of the exhaust flow to be extracted and not returned in order to validate a type-approval test. Practically, for this moped it would require instruments with flow rates of <0.25 L/min, which do not exist. Thus, the extracted flow correction might be necessary if in the future measurements from the tailpipe (e.g., for additional pollutants or PEMS) will be required.
The tailpipe measurements need the exhaust flow rate for the calculation of the emissions, which can introduce an error. We used three methods, all applicable only in the laboratory (not on-road): Difference of CVS total and dilution air flow rates, CVS total flow rate, and dilution factors based on CO2 tracer or carbon balance. The agreement of the three methods was excellent (5%). For diesel vehicles, big errors have been reported with the CO2 tracer method during fuel cut-offs [48], but for stoichiometric gasoline engines, the error should be small because the CO2 concentration remains constant over most operating conditions. More studies are needed to better determine the exhaust flow associated uncertainty, e.g., with other methods, such as intake air and fuel consumption or the lambda measurement. This will be even more important when direct methods (i.e., exhaust flow meters) will appear in the market. The time misalignment of the analyzers’ signals and the exhaust flow rate signals for the tailpipe measurements can have an effect. For SPN, the effect of ±1 s misalignment was ±5%, reaching ±10% in a few cases, which was in agreement with another study for light-duty vehicles [18]. Another study found up to 20% effect on the estimated catalyst efficiency for a ±2 s misalignment [48]. The time misalignment of the CO2 could also introduce an error on the exhaust flow determination with the CO2 tracer method. An important issue was that with closed configuration the exhaust flow of the first 50 s was erroneously calculated to be zero due to the “dead” volume of the transfer tube and the associated dispersion and diffusion phenomena. This led to an underestimation of around 69% to 149% in the SPN results, but less than 2.3% for CO2. The error was significant for SPN because the majority of the SPN emissions take place during cold start. Thus, this error will be important for engines from which the majority of the emissions take place at the beginning of the test (cold start). It could be avoided with better determination of the exhaust flow (e.g., exhaust flow meter or measurement of intake air and fuel flow). For SPN measurements, the instrument dilution (2000:1) that was used was not enough for the 23 nm and 10 nm CPCs during cold start (10–30 s). This resulted in an uncertainty in the tailpipe SPN results. Comparing with the concentrations of the CPCs at the CVS with the open configuration for those seconds, the underestimation of the emissions was negligible for the 23 nm CPC but around 10% for the 10 nm CPC. Higher dilutions can solve this issue, but higher dilutions have higher uncertainty [24]. Thus, the tailpipe method needs further investigation in the future before introducing it in the regulation.
For the specific moped and tests, the applied corrections increased the emissions significantly. For example, for >10 nm, the tailpipe and dilution tunnel with closed configuration emissions were around 4 × 10¹¹ p/km; with the corrections, the emissions were approximately 112% (tailpipe) and 39% (dilution tunnel) higher. The tailpipe results with the two configurations (open and closed transfer tube) and the dilution tunnel results with the open configuration were within ±10% for the 23 nm and 10 nm CPCs and ±20% for the 4 nm CPCs. The results of the closed configuration were 30% (23 nm, 10 nm) to 47% (4 nm) lower due to particle losses in the transfer tube (30% from agglomeration, <5% from diffusion, and <2% from thermophoresis). Decrease of particle levels of 10–40% have been reported for passenger cars [18,43]. The open configuration decreased the agglomeration and thermophoretic losses due to the immediate cooling dilution at the tailpipe and due to the decreased residence time in the exhaust transfer line. There were no indications that the open or closed configurations formed particles, but this needs more detailed studies as the partitioning of the semi-volatile particles will be different for the two configurations [30]. Tests with heavy-duty diesel and CNG (compressed natural gas) engines with cold and hot dilution showed similar results with 23 nm and 10 nm CPCs. Thus, we expect small effect if any also for mopeds and motorcycles [49]. Dedicated studies have shown that particles may be formed or grow to the measurement range of instruments from the silicone, Teflon parts, or desorbed material of the transfer tube when the exhaust gas temperature is high. These phenomena typically lead to quite large errors that in some cases reach an order of magnitude difference [14,16]. The open configuration seems to minimize such artefacts, because the exhaust gas temperature drops to low levels (<150 °C) [14]. It should be mentioned though that the uncertainty of the SPN instruments are in the 10–15% range [3], and thus the errors associated with the extracted flow, the cold start, and the particle losses are significant. The lower results from the dilution tunnel with the closed configuration shows that L-category studies so far might have been underestimating the emissions [10,13]. The exact magnitude depends on the exhaust gas temperatures, the size of particles, and the SPN concentration levels. The major contributor seems to be the agglomeration losses during cold start where the concentration levels are high. One of the key messages of this comparison is that for future SPN regulations the open transfer tube configuration is more appropriate. In order to avoid the uncertainties related to the open configuration (i.e., how much open, the ambient air might not be filtered, etc.), it is the authors’ opinion that the open configuration could be replaced with a mixing tee; a commonly used approach for gasoline light-duty vehicles. In this case, the flow of the dilution air entering is well controlled and, in addition, the air is filtered minimizing the contribution of ambient particles to the results. Special attention should be given to the material of the tube after the mixing tee in order to minimize particle losses.
Closing, it should be mentioned that the SPN23 emissions after corrections were around 5 × 10¹¹ p/km; lower than the current light-duty vehicle limit of 6 × 10¹¹ p/km. However, the SPN10 and SPN4 emissions were 8.3 × 10¹¹ p/km and 14 × 1011 p/km, respectively, indicating that the current methodology captures only a small percentage of the emitted particles. This is in agreement with other studies for mopeds and motorcycles [10,13] and references therein. It also raises concerns when comparing SPN emissions using instruments with different lower sizes. The most important message though, based also on the previous studies [10,13], is that future regulations for mopeds and motorcycles should consider a size lower than the current of 23 nm. Similar discussion is on-going for light-duty and heavy-duty vehicles, where high sub-23 nm particle fractions (>100%) have been measured in some cases, for instance, motorcycles [10], port-fuel injection engines [6], compressed natural gas engines [18], and heavy-duty engines [50,51].

5. Conclusions

This study summarized the issues that have been raised in the literature regarding solid particle number (SPN) measurements of L-category vehicles (e.g., mopeds and motorcycles), namely: Lower particle size that should be counted, possibility of artefacts, use of long lines from the vehicle to the dilution tunnel in combination with low exhaust flow rates, extraction of a sample from the tailpipe for analysis, exhaust flow rate determination, time alignment, and cold start. In this study we quantified the uncertainties in emission measurements of a moped, with emphasis on SPN and CO2 and concluded on the setup with the highest accuracy for regulatory purposes.
The dilution tunnel measurements needed a 24–31% correction for CO2 and 19–73% for SPN to account for exhaust extracted upstream of the dilution tunnel from instruments sampling from the tailpipe (in our case 23–28% of the mean total exhaust flow) (bleed off). Furthermore, the particles losses in the transfer tube from the moped to the dilution tunnel decreased the SPN emissions by an additional 30% (dilution tunnel vs. tailpipe). The exhaust flow was determined via the difference between total and dilution air flow, the CO2 tracer method, and the carbon balance. In this study, we estimated about 5% of uncertainty associated to the average exhaust flow, which propagates to the final emission results. The wrong estimation of the exhaust flow during the first minute of the cold start, due to the “dead” volume in the transfer tube to the dilution tunnel, resulted in a >50% error in SPN. A time misalignment of ±1 second gave differences of the SPN emissions on the order of ±5%.
Based on the results of this study, dilution tunnel SPN measurements in open configuration without additional instruments sampling from the tailpipe would give the most accurate results for regulatory purposes in terms of particle emissions. Tailpipe measurements for regulatory purposes need further investigations when specific exhaust flow meters will be available.
The specific moped had SPN emissions of 5 × 10¹¹ p/km: Lower than, but close to the passenger cars limit when considering particles larger than 23 nm. The emissions were double when smaller particles were included and exceeded the limit indicating that for this category a lower cut-off size is more appropriate. With high dilution ratios (around 1000:1) and the tailpipe in open configuration, and consequently, lower exhaust temperatures, the possibility of particle losses due to agglomeration or formation of particles due to high temperatures can be minimized.

Author Contributions

Conceptualization, B.G.; formal analysis, B.G.; writing—original draft preparation, B.G.; writing, review and editing, A.A.Z., T.L., M.C., F.F., and Y.D.

Funding

This research received no external funding.

Acknowledgments

The authors would like to acknowledge D. Lesueur, P. Le Lijour, and M. Sculati for the experimental support.

Conflicts of Interest

The authors declare no conflict of interest.

Disclaimer

The opinions expressed in this manuscript are those of the authors and should in no way be considered to represent an official opinion of the European Commission. Mention of trade names or commercial products does not constitute endorsement or recommendation by the authors or the European Commission.

References

  1. Guerreiro, C.; González Ortiz, A.; de Leeuw, F.; Viana, M.; Colette, A.; European Environment Agency. Air Quality in Europe—2018 Report; European Environment Agency: Luxembourg, 2018; ISBN 978-929-213-989-6. [Google Scholar]
  2. Giechaskiel, B.; Lähde, T.; Suarez-Bertoa, R.; Clairotte, M.; Grigoratos, T.; Zardini, A.; Perujo, A.; Martini, G. Particle number measurements in the European legislation and future JRC activities. Combust. Engines 2018, 174, 3–16. [Google Scholar]
  3. Giechaskiel, B.; Mamakos, A.; Andersson, J.; Dilara, P.; Martini, G.; Schindler, W.; Bergmann, A. Measurement of automotive nonvolatile particle number emissions within the European legislative framework: A review. Aerosol Sci. Technol. 2012, 46, 719–749. [Google Scholar] [CrossRef]
  4. Giechaskiel, B.; Dilara, P.; Andersson, J. Particle measurement programme (PMP) light-duty inter-laboratory exercise: Repeatability and reproducibility of the particle number method. Aerosol Sci. Technol. 2008, 42, 528–543. [Google Scholar] [CrossRef]
  5. Giechaskiel, B.; Casadei, S.; Mazzini, M.; Sammarco, M.; Montabone, G.; Tonelli, R.; Deana, M.; Costi, G.; Di Tanno, F.; Prati, M.; et al. Inter-laboratory correlation exercise with portable emissions measurement systems (PEMS) on chassis dynamometers. Appl. Sci. 2018, 8, 2275. [Google Scholar] [CrossRef]
  6. Giechaskiel, B.; Joshi, A.; Ntziachristos, L.; Dilara, P. European regulatory framework and particulate matter emissions of gasoline light-duty vehicles: A review. Catalysts 2019, 9, 586. [Google Scholar] [CrossRef]
  7. Iodice, P.; Senatore, A. Exhaust emissions of new high-performance motorcycles in hot and cold conditions. Int. J. Environ. Sci. Technol. 2015, 12, 3133–3144. [Google Scholar] [CrossRef]
  8. European Commission, Directorate General for Mobility and Transport. EU Transport in Figures: Statistical Pocketbook; European Commission: Luxembourg, 2019; ISBN 978-92-76-03843-6. [Google Scholar]
  9. Platt, S.M.; Haddad, I.E.; Pieber, S.M.; Huang, R.J.; Zardini, A.A.; Clairotte, M.; Suarez-Bertoa, R.; Barmet, P.; Pfaffenberger, L.; Wolf, R.; et al. Two-stroke scooters are a dominant source of air pollution in many cities. Nat. Commun. 2014, 5, 3749. [Google Scholar] [CrossRef]
  10. Giechaskiel, B.; Zardini, A.; Martini, G. Particle emission measurements from L-category vehicles. SAE Int. J. Engines 2015, 8, 2322–2337. [Google Scholar] [CrossRef]
  11. Ntziachristos, L.; Vonk, W.A.; Papadopoulos, G.; van Mensch, P.; Geivanidis, S.; Mellios, G.; Papadimitriou, G.; Steven, H.; Elstgeest, M.; Ligterink, N.E.; et al. Effect Study of the Environmental Step Euro 5 for L-Category Vehicles; European Commission: Luxembourg, 2017; ISBN 978-92-79-70203-7. [Google Scholar]
  12. Kontses, A.; Ntziachristos, L.; Zardini, A.A.; Papadopoulos, G.; Giechaskiel, B. Particulate emissions from L-Category vehicles towards Euro 5. Env. Res. 2019. [Google Scholar]
  13. Giechaskiel, B.; Zardini, A.A.; Lähde, T.; Perujo, A.; Kontses, A.; Ntziachristos, L. Particulate emissions of Euro 4 motorcycles and sampling considerations. Atmosphere 2019, 10, 421. [Google Scholar] [CrossRef]
  14. Giechaskiel, B. Effect of sampling conditions on the sub-23 nm nonvolatile particle emissions measurements of a moped. Appl. Sci. 2019, 9, 3112. [Google Scholar] [CrossRef]
  15. Giechaskiel, B. Differences between tailpipe and dilution tunnel sub-23 nm non-volatile (solid) particle number measurements. Aerosol Sci. Technol. 2019, 1–13. [Google Scholar]
  16. Giechaskiel, B.; Vanhanen, J.; Väkevä, M.; Martini, G. Investigation of vehicle exhaust sub-23 nm particle emissions. Aerosol Sci. Technol. 2017, 51, 626–641. [Google Scholar] [CrossRef]
  17. Giechaskiel, B.; Schwelberger, M.; Delacroix, C.; Marchetti, M.; Feijen, M.; Prieger, K.; Andersson, S.; Karlsson, H.L. Experimental assessment of solid particle number portable emissions measurement systems (PEMS) for heavy-duty vehicles applications. J. Aerosol Sci. 2018, 123, 161–170. [Google Scholar] [CrossRef]
  18. Giechaskiel, B.; Lähde, T.; Drossinos, Y. Regulating particle number measurements from the tailpipe of light-duty vehicles: The next step? Environ. Res. 2019, 172, 1–9. [Google Scholar] [CrossRef] [PubMed]
  19. Czerwinski, J.; Comte, P.; Mayer, A.; Reutimann, F. Investigations of Changes of the 2-Stroke Scooters Nanoparticles in the Exhaust- and CVS-System; SAE International: Warrendale, PA, USA, 2013; 12p. [Google Scholar]
  20. Joint Committee for Guides in Metrology. JCGM 200:2012 International Vocabulary of Metrology–Basic and General Concepts and Associated Terms (VIM), 3rd ed.; Joint Committee for Guides in Metrology: Paris, France, 2008. [Google Scholar]
  21. Giechaskiel, B.; Clairotte, M.; Valverde-Morales, V.; Bonnel, P.; Kregar, Z.; Franco, V.; Dilara, P. Framework for the assessment of PEMS (portable emissions measurement systems) uncertainty. Environ. Res. 2018, 166, 251–260. [Google Scholar] [CrossRef] [PubMed]
  22. Joint Committee for Guides in Metrology. JCGM 100:2008 Evaluation of Measurement Data—Guide to the Expression of Uncertainty in Measurement (GUM); Joint Committee for Guides in Metrology: Paris, France, 2008. [Google Scholar]
  23. Vasic, A.M.; Weilenmann, M. Comparison of real-world emissions from two-wheelers and passenger cars. Environ. Sci. Technol. 2006, 40, 149–154. [Google Scholar] [CrossRef]
  24. Giechaskiel, B.; Cresnoverh, M.; Jörgl, H.; Bergmann, A. Calibration and accuracy of a particle number measurement system. Meas. Sci. Technol. 2010, 21, 045102. [Google Scholar] [CrossRef]
  25. Takegawa, N.; Sakurai, H. Laboratory evaluation of a TSI condensation particle counter (model 3771) under airborne measurement conditions. Aerosol Sci. Technol. 2011, 45, 272–283. [Google Scholar] [CrossRef]
  26. Giechaskiel, B.; Bergmann, A. Validation of 14 used, re-calibrated and new TSI 3790 condensation particle counters according to the UN-ECE Regulation 83. J. Aerosol Sci. 2011, 42, 195–203. [Google Scholar] [CrossRef]
  27. Tsai, J.H.; Huang, P.H.; Chiang, H.L. Air pollutants and toxic emissions of various mileage motorcycles for ECE driving cycles. Atmos. Environ. 2017, 153, 126–134. [Google Scholar] [CrossRef]
  28. Zardini, A.A.; Platt, S.M.; Clairotte, M.; El Haddad, I.; Temime-Roussel, B.; Marchand, N.; Ježek, I.; Drinovec, L.; Močnik, G.; Slowik, J.G.; et al. Effects of alkylate fuel on exhaust emissions and secondary aerosol formation of a 2-stroke and a 4-stroke scooter. Atmos. Environ. 2014, 94, 307–315. [Google Scholar] [CrossRef]
  29. Zardini, A.A.; Suarez-Bertoa, R.; Dardiotis, C.; Astorga, C. Unregulated pollutants from tampered two-wheelers. Transp. Res. Procedia 2016, 14, 3109–3118. [Google Scholar] [CrossRef]
  30. Clairotte, M.; Adam, T.W.; Chirico, R.; Giechaskiel, B.; Manfredi, U.; Elsasser, M.; Sklorz, M.; DeCarlo, P.F.; Heringa, M.F.; Zimmermann, R.; et al. Online characterization of regulated and unregulated gaseous and particulate exhaust emissions from two-stroke mopeds: A chemometric approach. Anal. Chim. Acta 2012, 717, 28–38. [Google Scholar] [CrossRef]
  31. Spezzano, P.; Picini, P.; Cataldi, D.; Messale, F.; Manni, C. Particle- and gas-phase emissions of polycyclic aromatic hydrocarbons from two-stroke, 50-cm3 mopeds. Atmos. Environ. 2008, 42, 4332–4344. [Google Scholar] [CrossRef]
  32. Prati, M.V.; Costagliola, M.A. Emissions of fine particles and organic compounds from mopeds. Environ. Eng. Sci. 2009, 26, 111–122. [Google Scholar] [CrossRef]
  33. Zardini, A.; Clairotte, M.; Lanappe, G.; Giechaskiel, B.; Martini, G. Preparatory Work for the Environmental Effect Study on the Euro 5 Step of L-Category Vehicles; Publications Office: Luxembourg, 2016. [Google Scholar]
  34. Varella, R.; Giechaskiel, B.; Sousa, L.; Duarte, G. Comparison of Portable Emissions Measurement Systems (PEMS) with Laboratory Grade Equipment. Appl. Sci. 2018, 8, 1633. [Google Scholar] [CrossRef]
  35. Mohanta, L.; Iyer, S.; Mishra, P.; Klinikowski, D. Uncertainties in Measurements of Emissions in Chassis Dynamometer Tests; SAE International: Warrendale, PA, USA, 2014. [Google Scholar]
  36. Geivanidis, S.; Samaras, Z. Development of a dynamic model for the reconstruction of tailpipe emissions from measurements on a constant volume sampling dilution system. Meas. Sci. Technol. 2008, 19, 015404. [Google Scholar] [CrossRef]
  37. Mahadevan, V.; Iyer, S.; Klinikowski, D. Recovery of tail pipe species concentrations and its effect on emissions calculations from raw exhaust gas streams during chassis dynamometer tests. SAE Int. J. Engines 2016, 9, 1763–1774. [Google Scholar] [CrossRef]
  38. Ajtay, D.; Weilenmann, M. Compensation of the exhaust gas transport dynamics for accurate instantaneous emission measurements. Environ. Sci. Technol. 2004, 38, 5141–5148. [Google Scholar] [CrossRef]
  39. Weilenmann, M.; Soltic, P.; Ajtay, D. Describing and compensating gas transport dynamics for accurate instantaneous emission measurement. Atmos. Environ. 2003, 37, 5137–5145. [Google Scholar] [CrossRef]
  40. Adachi, M.; Nakamura, H. Engine Emissions Measurement Handbook: HORIBA Automotive Test Systems; SAE International: Warrendale, PA, USA, 2014; ISBN 978-076-808-012-4. [Google Scholar]
  41. Zardini, A.A.; Suarez-Bertoa, R.; Forni, F.; Montigny, F.; Otura-Garcia, M.; Carriero, M.; Astorga, C. Reducing the exhaust emissions of unregulated pollutants from small gasoline engines with alkylate fuel and low-ash lube oil. Environ. Res. 2019, 170, 203–214. [Google Scholar] [CrossRef] [PubMed]
  42. Giechaskiel, B.; Zardini, A.A.; Clairotte, M. Exhaust gas condensation during engine cold start and application of the dry-wet correction factor. Appl. Sci. 2019, 9, 2263. [Google Scholar] [CrossRef]
  43. Isella, L.; Giechaskiel, B.; Drossinos, Y. Diesel-exhaust aerosol dynamics from the tailpipe to the dilution tunnel. J. Aerosol Sci. 2008, 39, 737–758. [Google Scholar] [CrossRef]
  44. Giechaskiel, B.; Arndt, M.; Schindler, W.; Bergmann, A.; Silvis, W.; Drossinos, Y. Sampling of non-volatile vehicle exhaust particles: A simplified guide. SAE Int. J. Engines 2012, 5, 379–399. [Google Scholar] [CrossRef]
  45. Mathis, U.; Ristimäki, J.; Mohr, M.; Keskinen, J.; Ntziachristos, L.; Samaras, Z.; Mikkanen, P. Sampling conditions for the measurement of nucleation mode particles in the exhaust of a diesel vehicle. Aerosol Sci. Technol. 2004, 38, 1149–1160. [Google Scholar] [CrossRef]
  46. Keskinen, J.; Rönkkö, T. Can real-world diesel exhaust particle size distribution be reproduced in the laboratory? A critical review. J. Air Waste Manag. Assoc. 2010, 60, 1245–1255. [Google Scholar] [CrossRef]
  47. Giechaskiel, B.; Drossinos, Y. Theoretical investigation of volatile removal efficiency of particle number measurement systems. SAE Int. J. Engines 2010, 3, 1140–1151. [Google Scholar] [CrossRef]
  48. Hawley, J.G.; Bannister, C.D.; Brace, C.J.; Cox, A.; Ketcher, D.; Stark, R. Vehicle modal emissions measurement—Techniques and issues. Proc. Inst. Mech. Eng. Part D J. Automob. Eng. 2004, 218, 859–873. [Google Scholar] [CrossRef]
  49. Giechaskiel, B.; Lähde, T.; Schwelberger, M.; Kleinbach, T.; Roske, H.; Teti, E.; van den Bos, T.; Neils, P.; Delacroix, C.; Jakobsson, T.; et al. Particle number measurements directly from the tailpipe for type approval of heavy-duty engines. Appl. Sci. 2019, 9, 4418. [Google Scholar] [CrossRef] [Green Version]
  50. Giechaskiel, B. Solid particle number emission factors of Euro VI heavy-duty vehicles on the road and in the laboratory. IJERPH 2018, 15, 304. [Google Scholar] [CrossRef] [PubMed] [Green Version]
  51. Mamakos, A.; Schwelberger, M.; Fierz, M.; Giechaskiel, B. Effect of selective catalytic reduction on exhaust nonvolatile particle emissions of Euro VI heavy-duty compression ignition vehicles. Aerosol Sci. Technol. 2019, 53, 898–910. [Google Scholar] [CrossRef] [Green Version]
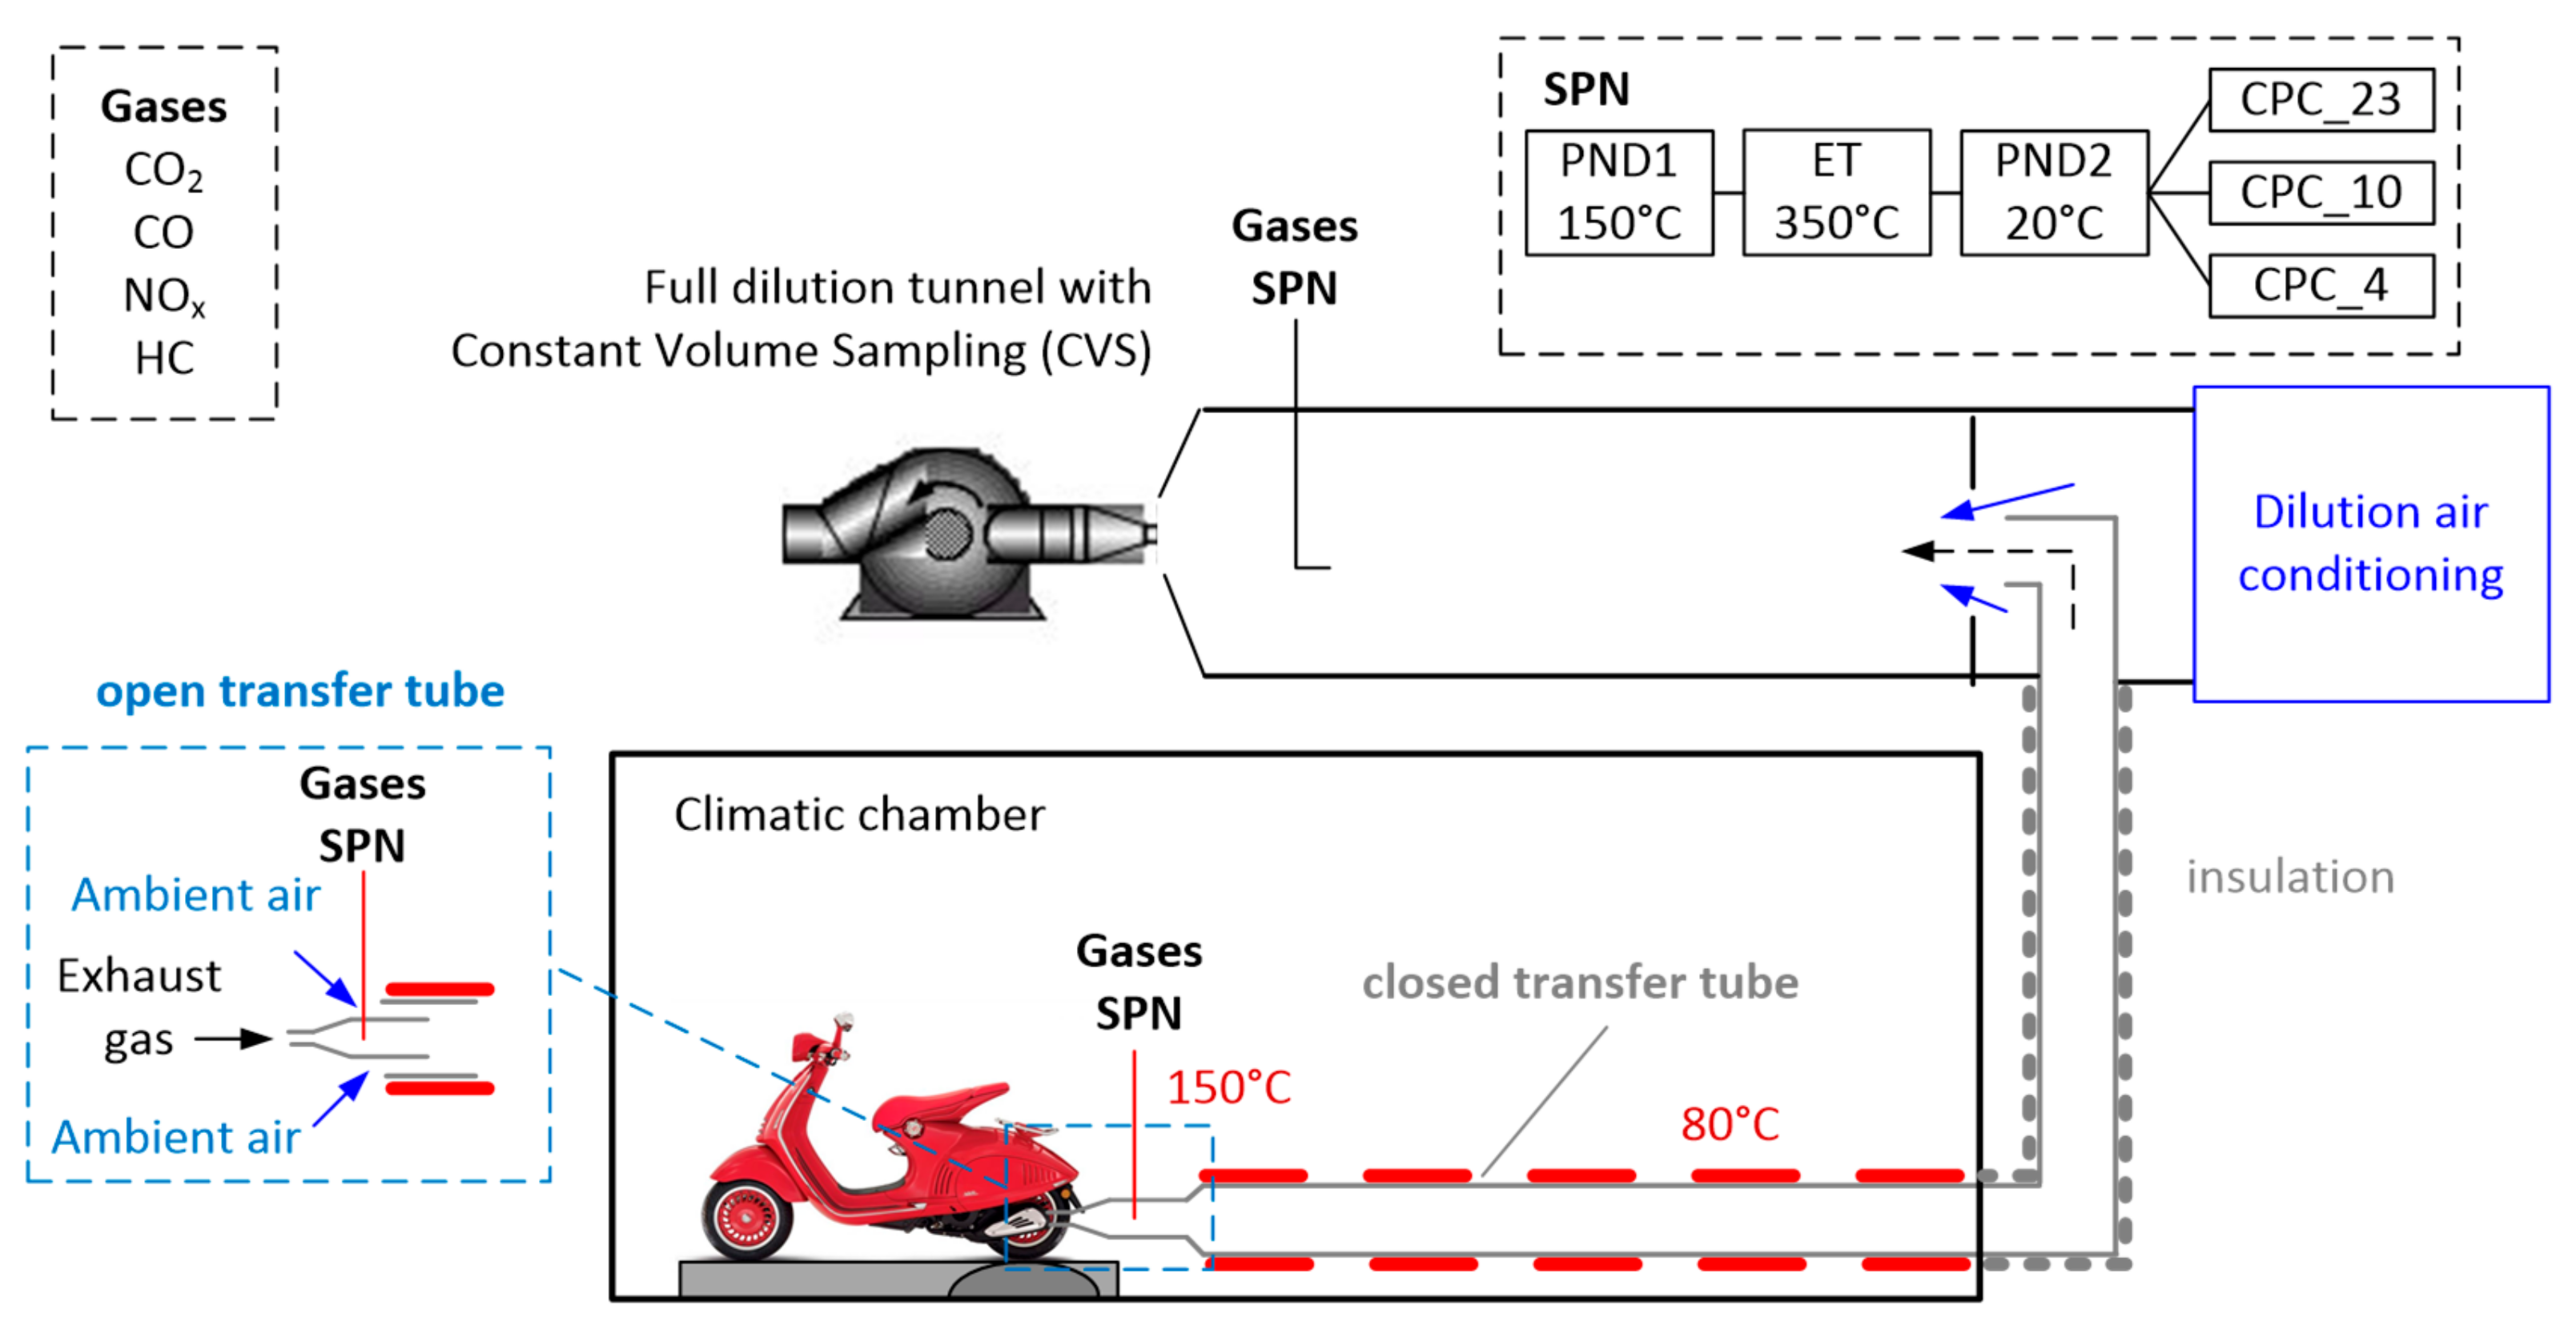
Figure 1. Experimental setup. Gases and SPN were sampled with separate probes at the tailpipe or the dilution tunnel. CPC = Condensation Particle Counter; ET = Evaporation Tube; HC = Hydrocarbons; PND = Particle Number Diluter; SPN = Solid Particle Number.
Energies 12 04343 g001
Figure 2. Exhaust flow rate as determined by three methods for the first 600 s of the Worldwide harmonized Motorcycle Test Cycle (WMTC) (closed transfer tube) (Equations (10)–(12)). The extracted flow (0.019 m3/min) should also be added.
Energies 12 04343 g002
Figure 3. Comparison of the exhaust flow estimated with the CO2 tracer method during cold start in open/closed configuration. The speed profile is from the open configuration test. The extracted flow (0.019 m3/min) should also be added.
Energies 12 04343 g003
Figure 4. CO2 emissions at the tailpipe (TP) or the dilution tunnel (Constant Volume Sampling (CVS)) with open or closed transfer tube over an entire WMTC test (blue areas). The corrections due to the extracted tailpipe flow are also given (red areas). The additional emissions by correcting the first 50 s of the exhaust flow rate based on the open configuration (Figure 3) is given for the TP closed case (green dashed area). Error bars show one standard deviation of 2 (open) to 3 (closed) repetitions.
Energies 12 04343 g004
Figure 5. Real time solid particle number emissions (SPN) >10 nm with (a) open (upper panel) or (b) closed (lower panel) transfer tube. Measurements at the tailpipe (TP) and the dilution tunnel (CVS) are separately plotted for each case.
Energies 12 04343 g005
Figure 6. Solid particle number emissions (SPN) at the tailpipe (TP) or the dilution tunnel (CVS) with open or closed transfer tube (blue areas). The corrections due to the extracted tailpipe flow are also given (red area). The additional emissions by correcting the first 50 s of the exhaust flow rate based on the open configuration (Figure 3) is given for the TP closed case (green area). Error bars show one standard deviation of 2–3 repetitions.
Energies 12 04343 g006
Table 1. Contribution of various parameters on results.
TP
Open
TP
Closed
CVS
Open
CVS
Closed
Comments
Exhaust flowYYNNDepends on the method. In this study ±5%
Extracted flowYYYYThe effect can be assumed similar to the extracted flow (CO2) or higher (SPN) (>25% in this study)
Dead volume of transfer lineN(Y)NYWill affect exhaust flow determination, (depending on the method) due to gas mixing and dispersion. Effect on SPN >50% in this study
ConcentrationsYYNNCold start concentrations might exceed max range of tailpipe instruments
Particle lossesNNNYNot for gases. Agglomeration for concentrations >1 × 10⁷ p/cm3; 30% effect for peaks >1 × 10⁸ p/cm3
MisalignmentYYNNFor ±1 s, in this study around ±5%