Article

State-of-Health Estimation of Li-ion Batteries in Electric Vehicle Using IndRNN under Variable Load Condition

School of Electronics Engineering, Vellore Institute of Technology, Chennai, Tamilnadu 600 127, India
*
Author to whom correspondence should be addressed.
Energies 2019, 12(22), 4338; https://doi.org/10.3390/en12224338
Submission received: 17 October 2019 / Revised: 8 November 2019 / Accepted: 11 November 2019 / Published: 14 November 2019

Abstract

:
In electric vehicles (EVs), battery management systems (BMS) carry out various functions for effective utilization of stored energy in lithium-ion batteries (LIBs). Among numerous functions performed by the BMS, estimating the state of health (SOH) is an essential and challenging task to be accomplished at regular intervals. Accurate estimation of SOH ensures battery reliability by computing remaining lifetime and forecasting its failure conditions to avoid battery risk. Accurate estimation of SOH is challenging, due to uncertain operating conditions of EVs and complex non-linear electrochemical characteristics demonstrated by LIBs. In most of the existing studies, standard charge/discharge patterns with numerous assumptions are considered to accelerate the battery ageing process. However, such patterns and assumptions fail to reflect the real world operating condition of EV batteries, which is not appropriate for BMS of EVs. In contrast, this research work proposes a unique SOH estimation approach, using an independently recurrent neural network (IndRNN) in a more realistic manner by adopting the dynamic load profile condition of EVs. This research work illustrates a deep learning-based data-driven approach to estimate SOH by analyzing their historical data collected from LIBs. The IndRNN is adapted due to its ability to capture complex non-linear characteristics of batteries by eliminating the gradient problem and allowing the neural network to learn long-term dependencies among the capacity degradations. Experimental results indicate that the IndRNN based model is able to predict a battery’s SOH accurately with root mean square error (RMSE) reduced to 1.33% and mean absolute error (MAE) reduced to 1.14%. The maximum error (MAX) produced by IndRNN throughout the testing process is 2.5943% which is well below the acceptable SOH error range of ±5% for EVs. In addition, to demonstrate effectiveness of the IndRNN attained results are compared with other well-known recurrent neural network (RNN) architectures such as long short-term memory (LSTM) and gated recurrent unit (GRU). From the comparison of results, it is clearly evident that IndRNN outperformed other RNN architectures with the highest SOH accuracy rate.

1. Introduction

The increasing number of internal combustion engine (ICE) vehicles that run on fossil fuels causes a huge impact on global climate change, energy expenditure, environmental pollution and health hazards. Due to this alarming situation, many countries have begun to pay more attention to alternative and renewable energy sources to replace fossil fuels. As per the report from the Transport and Environment (T&E) organization [1], the transport industry alone caused 27% of the greenhouse gas emissions among overall Europe Union emissions. In particular, passenger cars are accountable for 41% of total transport emissions. Electric vehicles (EVs) have been identified as the best alternative by the automotive industry to address emerging challenges and issues associated with climate change and increasing energy demands.
Among various kinds of energy sources, lithium-ion batteries (LIBs) are a preferred choice for the automotive industry due to high energy density, high specific energy, high charging efficiency, long lifetime, low maintenance and low self-discharge [2,3]. Presently, most EVs on the road use LIBs including GM Chevy-Volt, BMW Mini E, Tesla Model S, Renault Zoe, Nissan Leaf EV, Chrysler 200 C EV and Mitsubishi iMi EV [4,5]. To increase driving range, optimal power utilization, increase lifetime, increase battery performance and guarantee safe operation, batteries must be managed more effectively. In general, EVs employ a dedicated module called the battery management systems (BMS) to enable safe and efficient operation of the battery. Improper management of the battery may lead to safety-related issues such as an accelerated battery ageing process and overheating which may even leads to an explosion [3,6]. Among various BMS operations, accurate estimation of battery’s state-of-health (SOH) is a crucial operation. This ensures safe and reliable operation of LIBs by computing remaining lifetime and forecasting its failure condition. The SOH of a battery could be expressed as the ratio of maximum available capacity in the present condition to the nominal capacity of the battery in a fresh condition [7]. This can be stated as follows:
S O H = Q P r e s e n t Q F r e s h · 100 %  
where, Q P r e s e n t     denotes present available capacity of the battery and Q F r e s h     indicates the capacity of the battery in the fresh condition. In general, if battery capacity goes below 80% of its original capacity then the battery is considered as non-usable for application purposes. This is due to exponential degradation of the battery capacity exhibited below 80% cut-off.
There are numerous internal and external factors influencing the health of the Li-ion battery and its performance degradation over a period of time. Some of the internal factors includes battery material, calendar ageing and increase in internal resistance. The external factors are operating temperature, uncertain driving condition, overcharging/discharging, high charge/discharge rate and improper charge/discharge cycling [8,9]. Due to many unknown and unpredictable factors influencing the health of the battery, estimating battery SOH becomes quite challenging. These factors are accountable for the unpredictable battery ageing process and many works in the literature have made an effort to investigate ageing process [10,11]. The main source of ageing mechanisms includes chemical, mechanical, thermal and highly depends on electrode compositions. Two distinguished types of ageing occurring in LIBs are calendar ageing and cycle ageing. The calendar ageing accelerates ageing while in storage condition due to increase in internal resistance and self-discharge rate. This type of ageing primarily based on external environmental factors including temperature under storage condition. In contrast to calendar ageing, cycle ageing takes place during charging or discharging conditions. Cycle ageing is mostly influenced by battery-charging methods, discharge rate and state-of-charge (SOC) values. In addition, cycle ageing may result cycle-life loss in the LIB due to irreversible damage caused to electrodes under improper battery operation.
Most of the existing approaches utilize a capacity fading and electrochemical (EC) model to measure SOH because as battery age capacity decreases, EC parameters are modified. However, all these approaches estimate SOH under robust assumptions and static cycling condition. These conditions are not suitable for real world EV batteries because this requires real-time SOH computation and charging/discharging happens in a dynamic manner [12]. Since battery SOH is a vital parameter to estimate SOC, which determines driving mileage of an EV, it is very much essential to compute the SOH in real-time. Due to longer charging time of EV batteries, charging occurs randomly whenever the battery is not fully charged. In addition, EV batteries discharges dynamically based on driving behavior, traffic conditions and other external factors. To eliminate such limitations, this research work proposes a data-driven technique to predict SOH based on vital data such as voltage (V), current (I) and temperature (T) collected from LIBs under variable load conditions. An artificial neural network (ANN) framework is developed to establish the non-linear relationship among battery parameters (V, I, T) and SOH. Key contributions of the proposed research work listed as follows:
  • A new approach is adopted to identify and extract a set of input features associated with the battery degradation process;
  • A data-driven based SOH estimation using an independently recurrent neural network (IndRNN) is developed with the help of vital battery parameters collected from LIBs;
  • The effectiveness of the proposed IndRNN based SOH estimation approach is verified by comparing it with similar RNN architectures, and the IndRNN resulted in having a much lower mean square error (RMSE) rate of 1.33%.
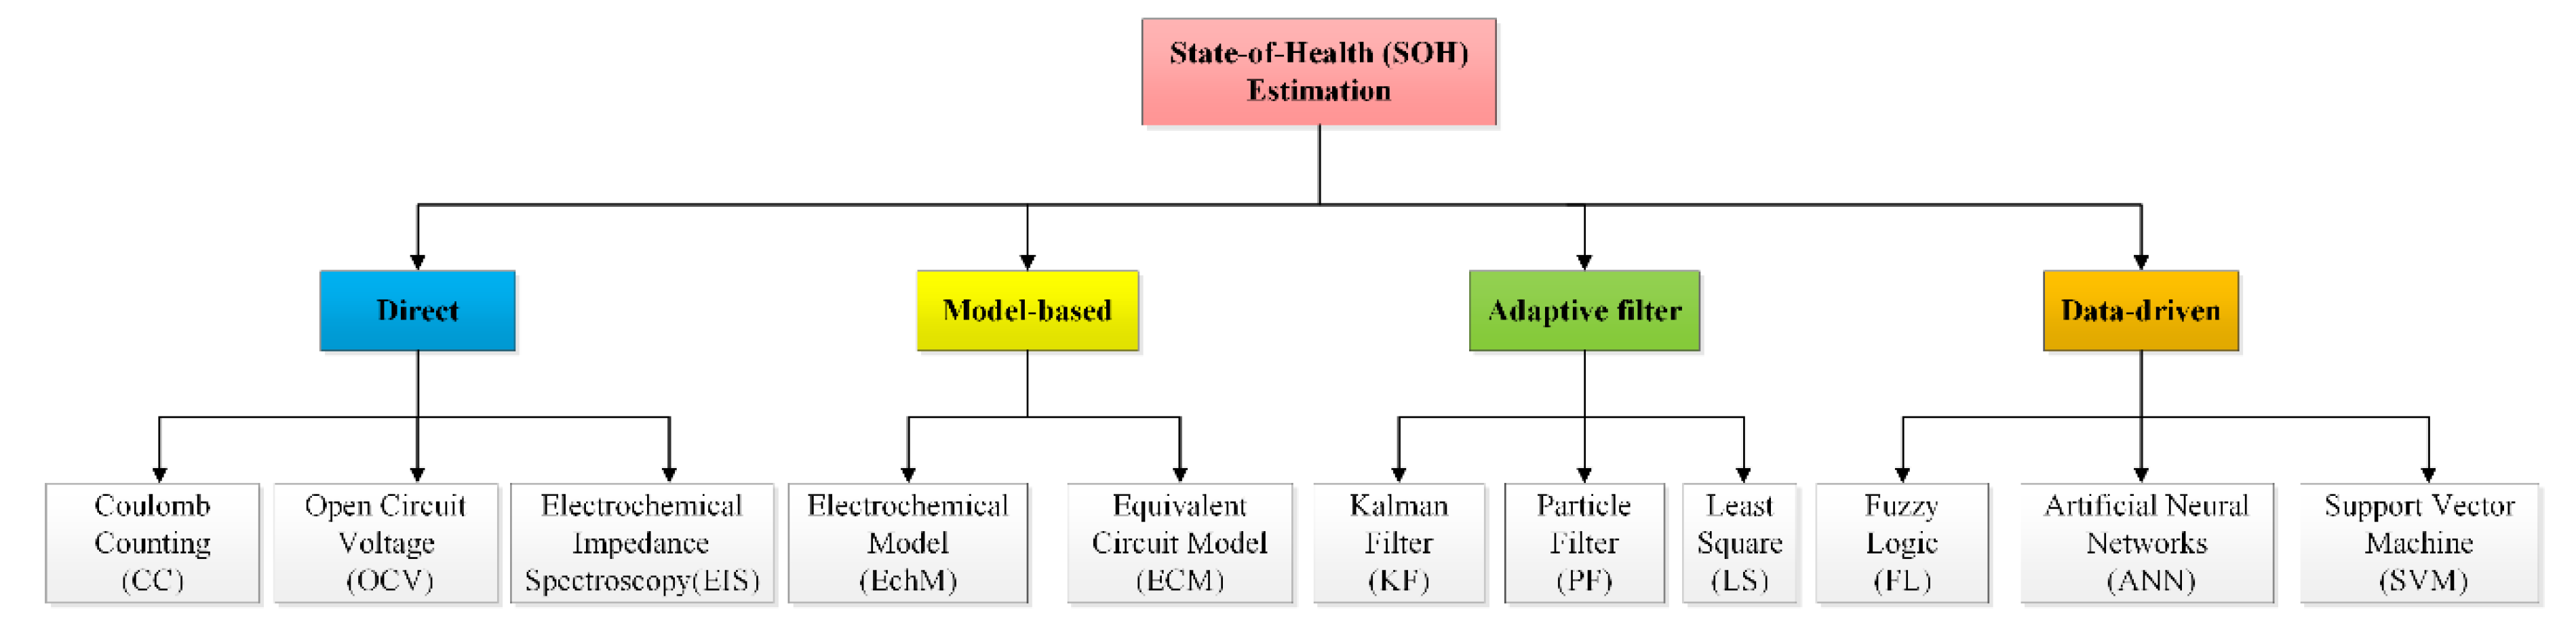
Subsequent sections of this paper is organized as follows: Section 2 examines existing SOH estimation approaches and highlights the advantages of the data-driven approach. Section 3 elaborates on the experimental dataset used for the proposed research work. Section 4 describes the IndRNN based SOH estimation framework. Section 5 explains the experimental result of the proposed IndRNN model. Section 6 concludes the highlights of this research work.

2. Related Work

An accurate and effective SOH estimation primarily depends on a systematic approach to observe and analyze vital parameters of LIBs involved in the battery ageing process. Although many contributions have been made by researchers around the globe for the advancement of SOH estimation, compared to other BMS functions research on SOH appears to be inadequate. This is due to hindrances caused by an extremely time-consuming ageing process of LIBs. Some of the common SOH estimation approaches include the direct measurement approach, model-based approaches, adaptive filtering approaches and the data-driven approach as shown in Figure 1 [8].
Direct measurement is a well-known method to estimate the battery SOH by directly measuring its key attributes such as internal resistance, impedance, open-circuit voltage (OCV) and charge/discharge current. Battery capacity loss and internal resistance are inversely proportional to each other as capacity degrades, internal resistance of the battery increases. This relationship is basis for many researchers [13,14,15] to recommend many SOH estimation methods based on the battery degradation process by measuring a battery’s internal resistance using Ohm’s law. Electrochemical impedance spectroscopy [EIS] is another method to estimate SOH by measuring battery impedance, since battery impedance increases as battery ages. By measuring a battery’s impendence value as a function of frequency, SOH can be estimated [16,17]. In OCV, estimation of SOH is performed both online and offline and exhaustive lab experiments are necessary to establish a relationship between SOH and OCV. To estimate battery SOH accurately, capacity degradation and model parameters are evaluated based on the charging curve of the battery at various battery cycles [18,19]. Coulomb counting (CC) is another approach to estimate SOH by monitoring the amount of current charged/discharged into/from LIB (Ah counting). By tracking the amount of Ah exchanged between battery and load, the remaining capacity of the battery is computed and used for SOH estimation [20].
In the model-based approach, the battery-ageing process is assessed by developing battery models. The objective of these approaches is to provide knowledge of various physical and chemical reactions experienced by a battery when utilized. Two most commonly employed battery models for SOH estimation are the electrochemical model (EChM) and equivalent circuit model (ECM). Basic electrical elements such as resistor, capacitor and voltage source are used to construct the ECM model and many methods have been proposed [21,22,23] to determine model parameters such as V, I, T and impedance. Although the ECM method can be implemented easily in BMS, it involves time-consuming experimental tests to generate diverse datasets. The EChM model aimed to replicate the exact chemical behavior of a battery such as electrolyte concentration, corrosion, electrolyte volume, density and porosity of the active materials etc., for better accuracy [24]. However, implementing this model in a real EV’s BMS is doubtful due to its complexity and high computational cost.
In adaptive filter approaches, the SOH of a battery estimated by continuously monitoring and analyzing the battery parameters, which are sensitive to the battery ageing process. The Kalman filter, particle filter and least square are some of the commonly existing adaptive methods to estimate SOH. The Kalman filter approach is a two-stage process and uses a series of battery parameters measured over a time for accurate SOH estimation. First, prediction stage filters are designed to estimate current battery parameters. Then, update stage estimation is updated with current battery parameters for precise output. A Kalman filter-based battery model is constructed to compute battery parameters and to estimate SOH [25,26,27]. Particle filter uses Bayesian learning with important sampling to estimate SOH with acceptable computational load [28]. This battery model uses a Monte Carlo sampling method to characterize any probability density function to estimate battery SOC. Then, SOH of the battery is predicted by employing the estimated SOC as input. Least square is a statistical approach in which regression analysis is used to determine best-fit line for a given dataset, which indicates a relationship among known and unknown battery parameters. An analytical battery model is developed using experimental data collected from LIBs during the ageing process and applied to estimate battery capacity by employing the least square optimization method [29,30].

Data-Driven Approach for State-of-Health (SOH) Estimation

Although many approaches presented by many researchers for SOH estimation, due to advancement of computational units such as graphical processing units (GPUs) and advanced learning algorithms the data-driven approach has become the preferred approach. In the data-driven approach, a large volume of battery parameters such as V, I and T etc., are collected from LIBs by continuously recording the health condition of the battery until it fails. In addition, this approach effectively captures the non-linear relationship among various battery parameters without having any anxiety about unpredictable EV operating condition and complex electrochemical process of batteries. In particular, fuzzy logic (FL), support vector machine (SVM), artificial neural network (ANN), and deep learning methods are some of few data-driven approaches accepted by researchers for battery SOH estimation.
A fuzzy logic system consists of four elements (1) fuzzifier, transforming measured data into fuzzy sets with the help of membership function; (2) fuzzy rule base, designed based on system control operating methods; (3) fuzzy inference engine, converting fuzzy rule base to fuzzy linguistic output; (4) defuzzifier, which converts fuzzy sets to analog output values. A reliable SOH estimation technique is proposed using fuzzy logic to determine coefficients employed to measure internal resistance and battery capacity [31]. Based on the measured battery temperature and current, coefficients associated with SOH determined by fuzzy logic system. A similar approach is followed to predict SOH using fuzzy logic with temperature, current, voltage and time as battery coefficients to determine battery internal resistance and its maximum capacity, which in turn is employed for SOH estimation [32]. Although fuzzy logic is a powerful approach, it requires a huge dataset for testing and needs a powerful computational unit, which is not possible for real-world EVs. In addition, due to improper assumptions considered in fuzzy rules this adds a substantial number of errors to the final SOH result.
Support vector machine is a renowned machine learning method that uses a regression algorithm to analyze and capture the characteristics of a non-linear system such as LIBs for SOH prediction. A large volume of data is collected from LIB under various battery ageing conditions and applied to the SVM algorithm to predict SOH at different environmental and load conditions [33]. The proposed method is verified under different temperature conditions and the obtained result indicates that an adequate amount of accuracy is achieved to predict the health of the battery. Partial charge voltage and the current of the battery can be used to extract three feature vectors, energy signal, charge duration and Ah-throughput, then SVM with radial basis function is applied on these inputs to estimate SOH [34]. The results indicate that the proposed method is able to estimate the battery SOH online effectively with less than 2% error. The main limitation of the SVM model is a large amount of data is required for better accuracy and fine-tuning of the required battery parameters which is a time-consuming process.
An artificial neural network (ANN) is a well-known approach to model a complex and non-linear system by processing a large amount of data. ANN is an appropriate method to estimate battery SOH because it is not essential to understand electrochemical reactions occurring inside the battery. For accurate SOH estimation, a large amount of experimental data is collected from LIB, and repeatedly processed by a training algorithm until minimum estimation error is achieved. A simple back propagation neural network model is developed to compute maximum available capacity to indicate battery SOH by employing a hybrid pulse power characterization (HPPC) test to extract battery parameters from the first order ECM model [7]. A probabilistic neural network (PNN) adopted to estimate SOH by performing constant current/voltage recharging and constant current discharging has been performed on 110 Li-Co batteries. This method considers instantaneous voltage drop, current charging time, and open circuit voltage as the essential battery parameters to estimate SOH [35]. A polynomial neural network model is developed using the group method of data handling to establish the relationship between battery SOH and differential geometric properties of battery terminal voltage curves [36]. A multi-layer perception-based neural network model was developed to estimate SOH of a battery by extracting their parameters using ECM. In addition, this method considered battery data collected from discrete life span to predict SOH accurately [37].
Deep learning is an improved version of the multi-layer perceptron with an ability to overcome limitations of machine learning approaches. Some of the deep learning approaches are, the convolutional neural network (CNN), deep neural network (DNN), recurrent neural network (RNN) and their variants long short-term memory network (LSTM) and gated recurrent unit (GRU). Although ANN effectively captures the key features of a non-linear system, it is not effective for time series-related system. Especially data acquired during single discharge cycle of battery at a specific instant of time is not suitable for SOH estimation. However, time-series data acquired during a specific range of time interval will help to capture ageing effect of battery. Henceforth, an approach employed to estimate SOH must handle time-series data effectively for better prediction. One such proven deep learning approach is recurrent neural network (RNN).
Dynamically driven recurrent network employs non-linear autoregressive with exogenous inputs architecture for SOC and SOH estimation [38]. The proposed method highlights its ability to capture a battery’s non-linearity characteristics effectively by evaluating experimentally on two battery chemistries LiFePO4 and LTO under dynamic charge and discharge current profile with different ambient temperature conditions. However, a fully connected RNN architecture is easily prone to the long-range dependency problem, which either vanishes or explodes the gradient during the backpropagation operation. A LSTM-based battery SOH estimation approach utilizes time varying instantiations to predict the SOH recording current (I) and voltage (V) under real-world driving pattern [39]. In addition, the obtained results indicate that the proposed approach is robust and flexible under various EV conditions with overall average error less than 0.0765 Ah (2.46%). It is necessary to note that some of the researchers began to apply LSTM for predicting the remaining useful life (RUL) of a battery [40,41].
From Table 1, the drawbacks of various SOH methods other than data-driven methods are summarized as: (1) They are difficult to implement in real-time due to high computational intensity and a time-consuming process’ (2) accuracy depends on extraction of the battery model parameters; (3) many strict assumptions are observed during experimental dataset preparation; (4) many methods are applicable to specific battery chemistries. All these hindrances make such SOH estimation methods unsuitable for EV BMS. In contrast, data-driven approaches avoid the aforementioned limitations by establishing non-linear relationship between various battery parameters and its ageing process. However, these SOH methods encounter few drawbacks, which include: (1) require high quality and large amount of data for battery accuracy; (2) most of the methods adopted fixed charge/discharge profile which fails to reflect real EV driving pattern; (3) an effective training process is essential for better performance.
To overcome these limitations, a data-driven accurate SOH estimation battery model is developed with the help of efficient training process. In addition, the experimental dataset utilized for training must reflect real-world EV driving pattern for practical implementation. Therefore, the main motive of this research work is to develop a robust SOH estimation battery model with high accuracy using an advanced deep learning neural network called an independently recurrent neural network (IndRNN) to capture the non-linear characteristics of Li-ion batteries.
The potential of the proposed approach is demonstrated with the help of randomized battery usage data set obtained from National Aeronautics and Space Administration (NASA) Ames Prognostics Data Repository. In addition, to validate the effectiveness of IndRNN results were compared with similar type of RNN architecture such as LSTM and GRU.

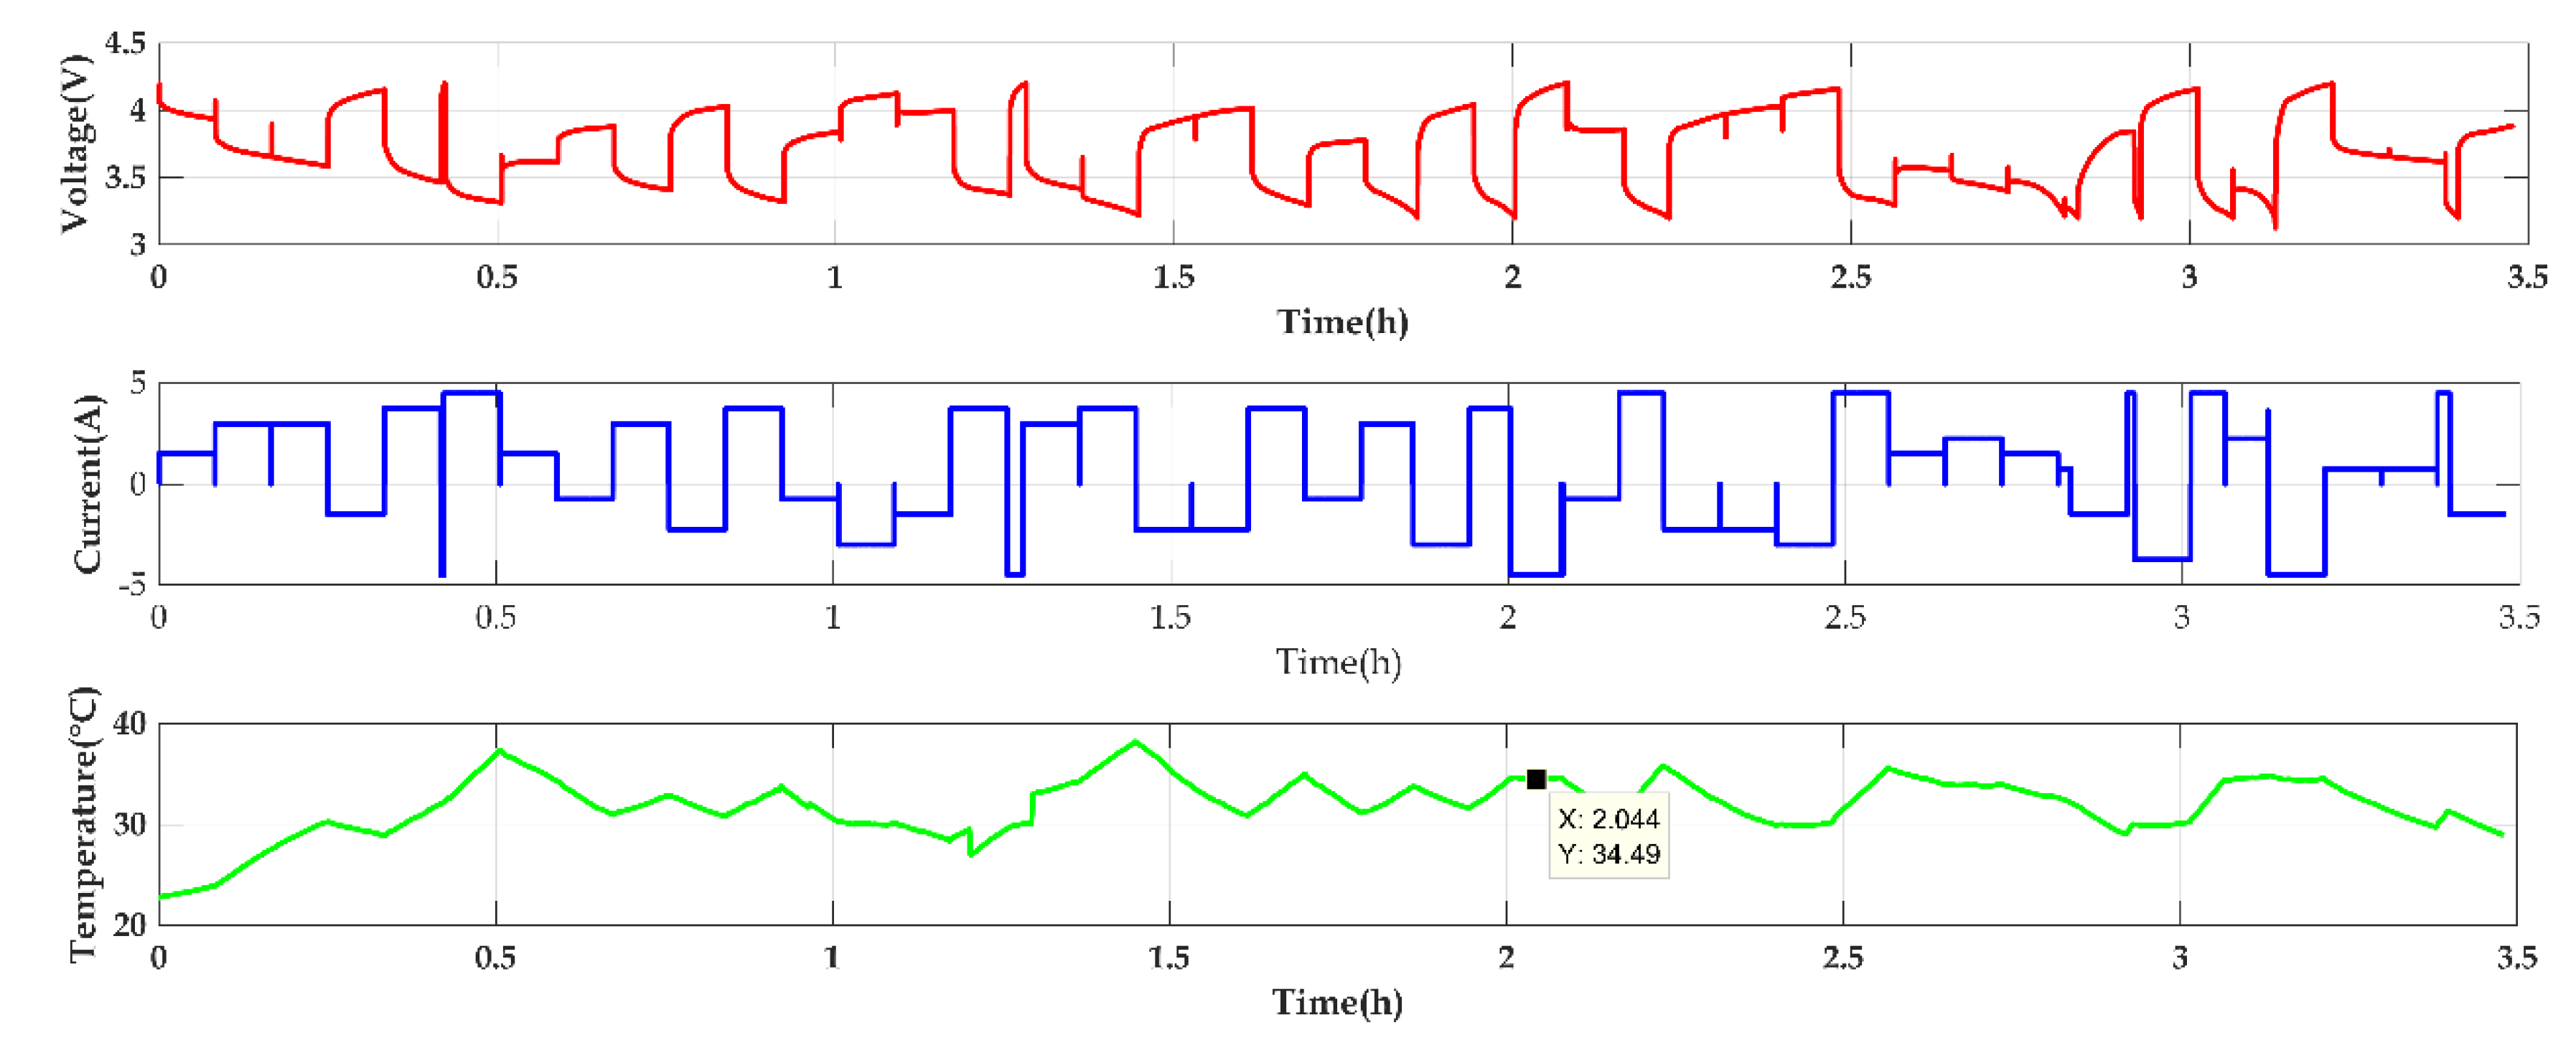
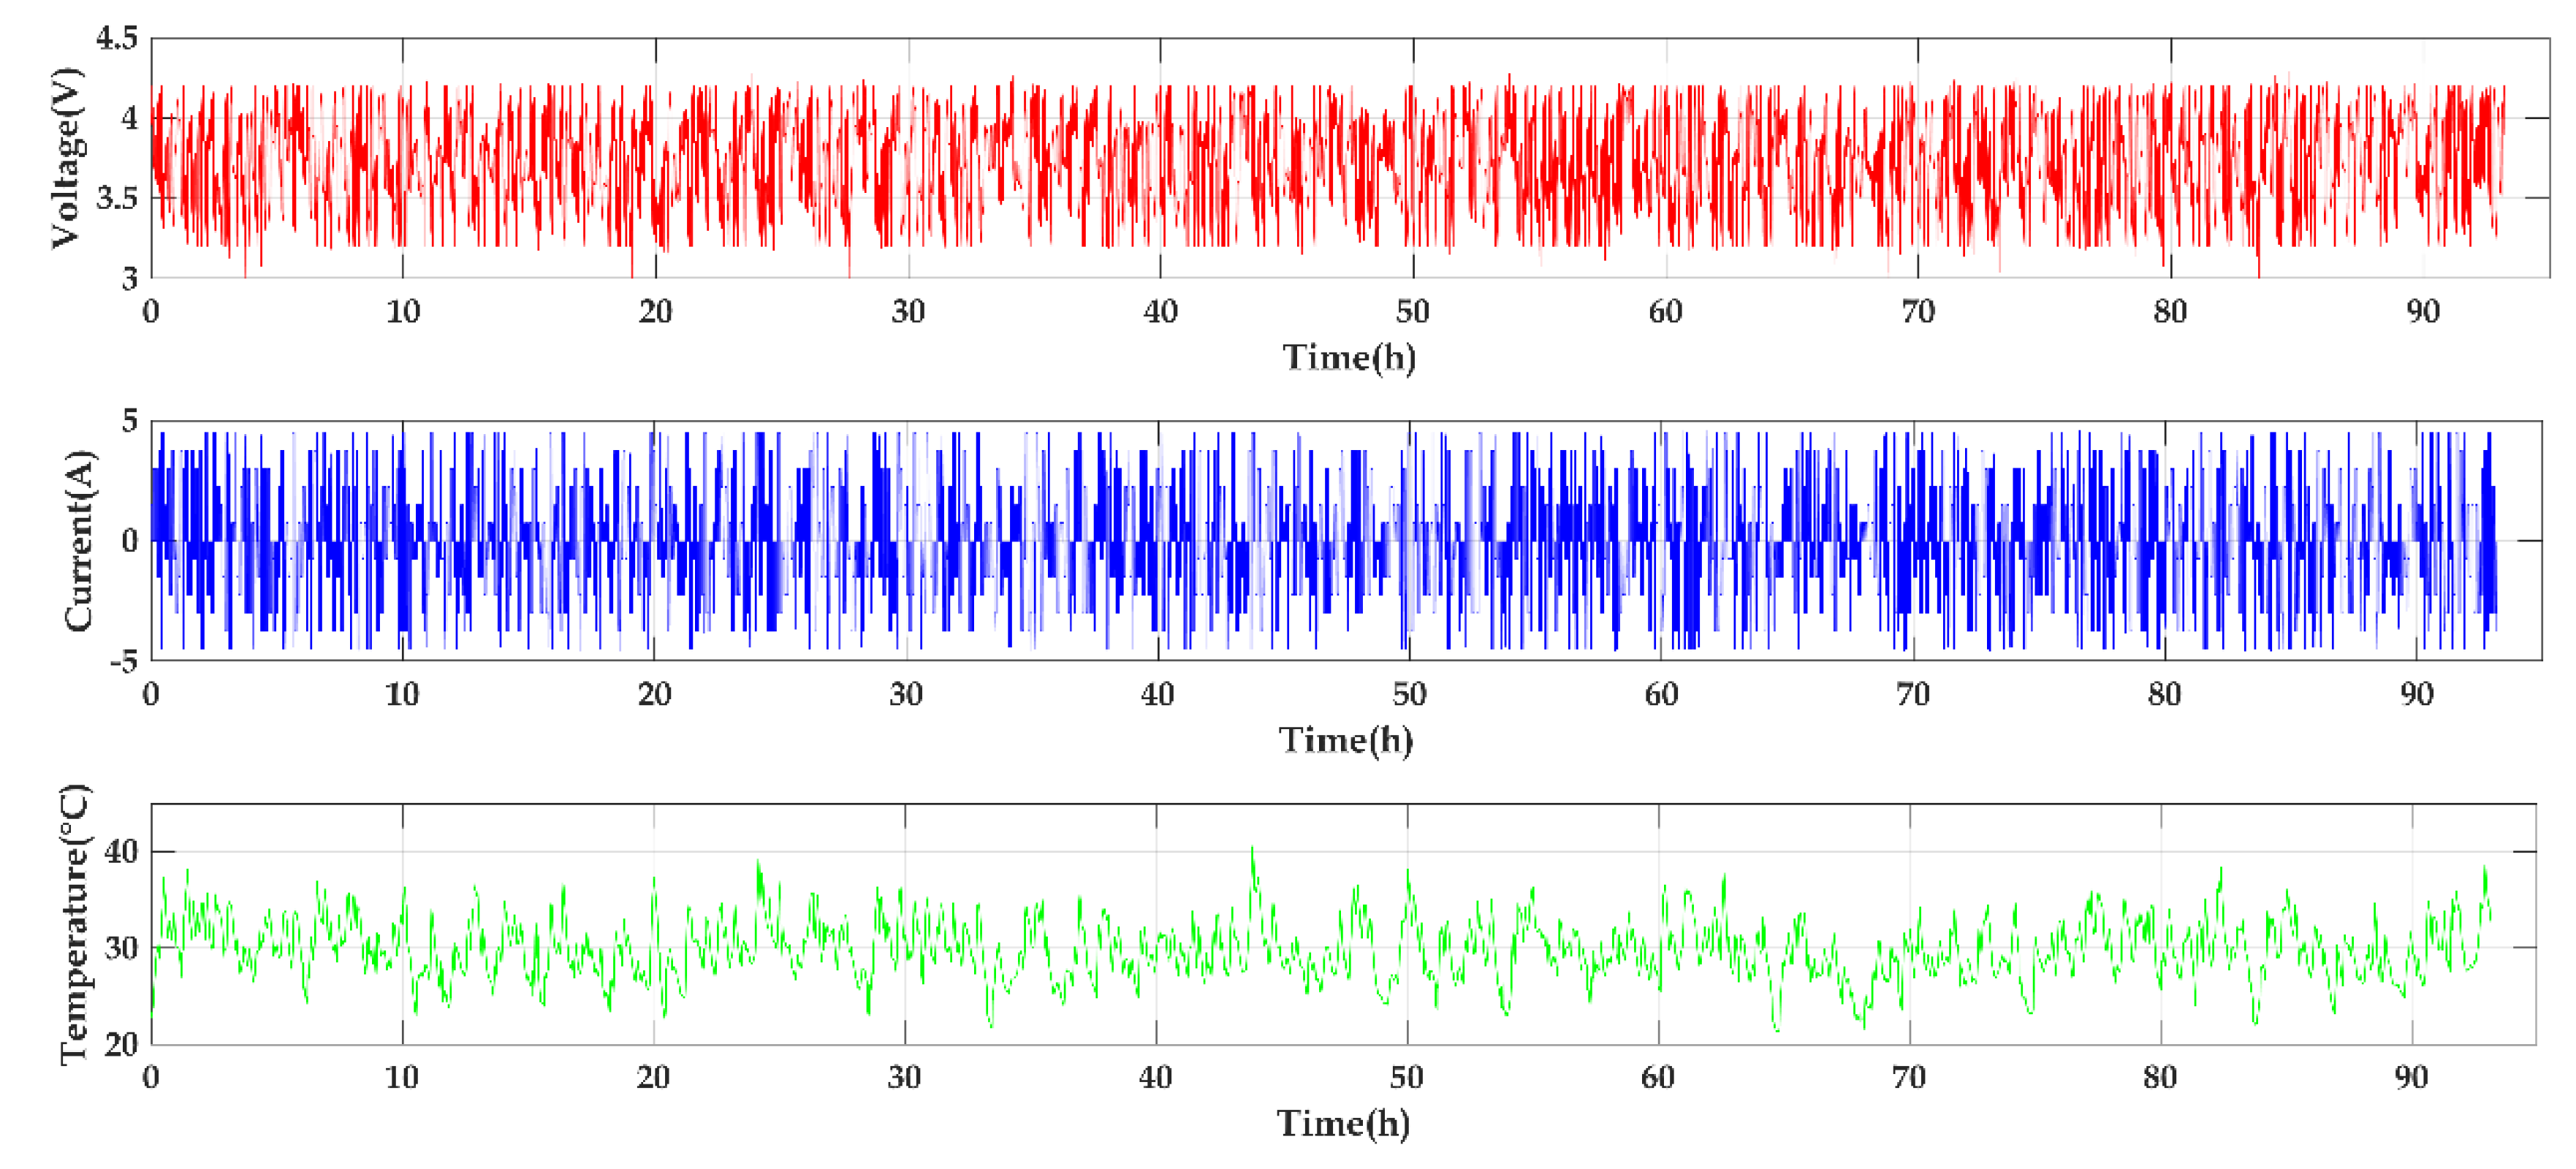
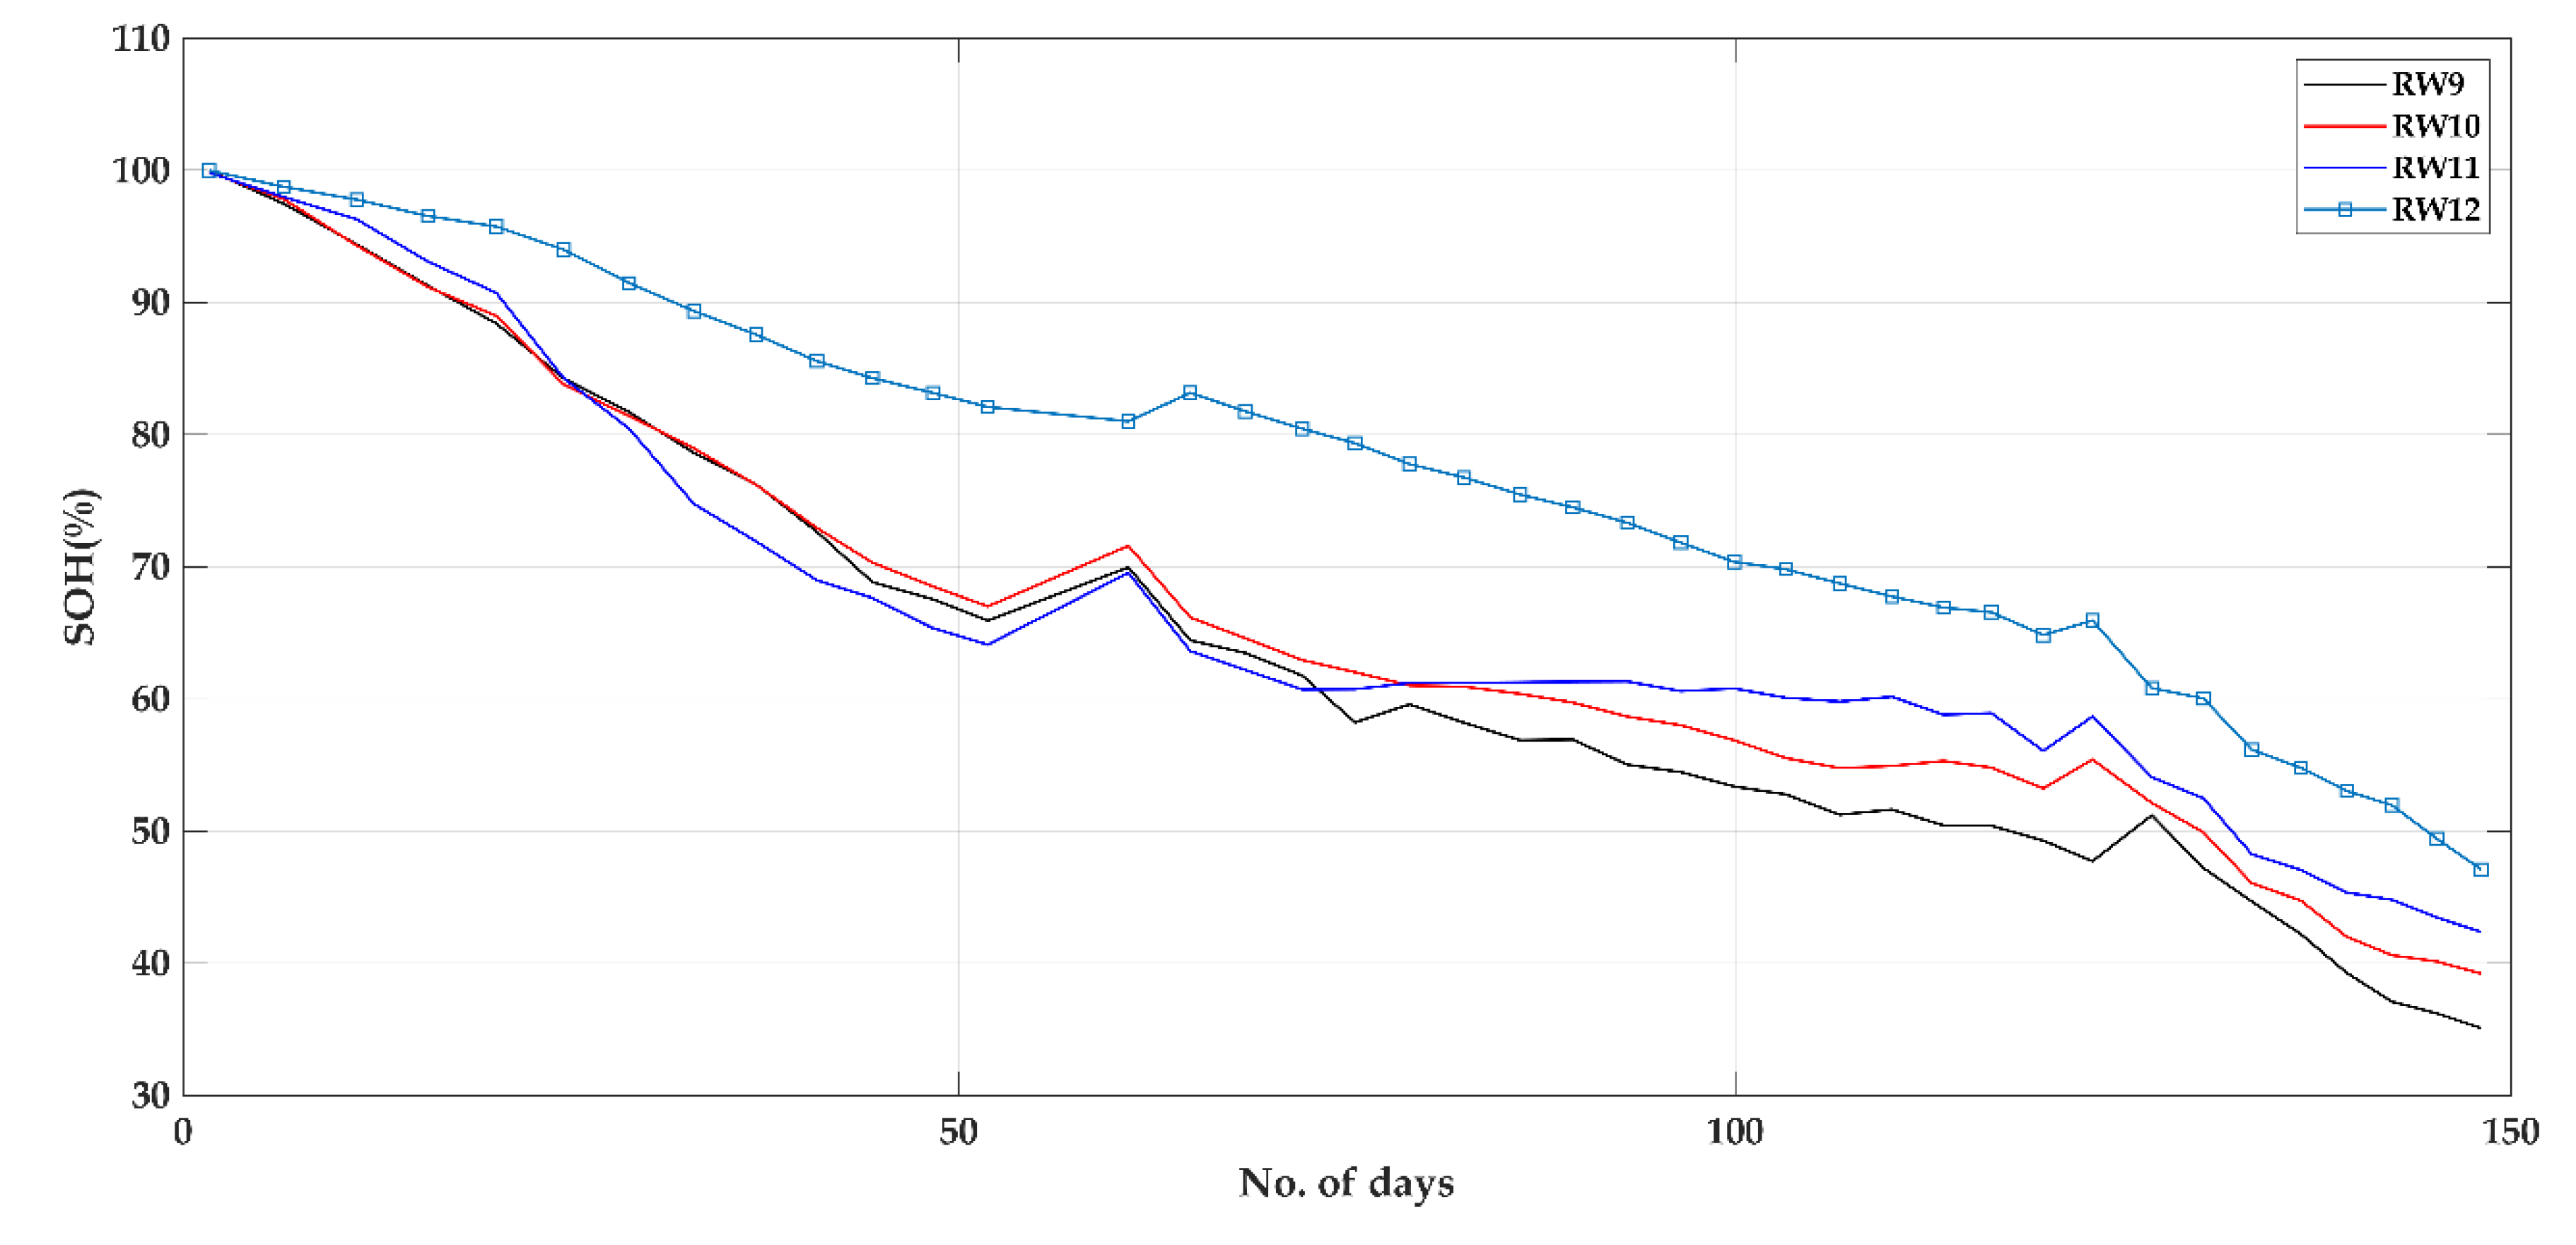
3. NASA’s Randomized Battery Usage Dataset

The practical operating condition of a real-world EV battery involves partial and dynamic driving behavior, improper battery cycling and unsystematic current charge and discharge conditions. Unfortunately, most of the existing studies employ battery datasets with tightly constrained assumptions, such as battery allowed to discharge under constant current, battery cycling allowed with fixed voltage range and fixed temperature condition. However, these assumptions failed to encapsulate the practical operating condition of EV batteries. To eradicate such limitations, this research work is focused on operating a battery under a dynamic load profile consisting of different battery cycles with randomly selected charge and discharge current. The proposed IndRNN approach estimate battery SOH in real-world EV operating conditions by employing randomized battery usage experiment dataset collected from data repository of NASA’s Ames Research Center [42]. This dataset comprises of test results of battery ageing experiment conducted at room temperature condition on four commercially available LIBs identified as RW9, RW10, RW11 and RW12. The specifications of the experimental battery chemistry is shown in Table 2. All batteries are engaged under two battery profiles namely, (1) Random walk (RW) profile and (2) Reference charge and discharge profile.

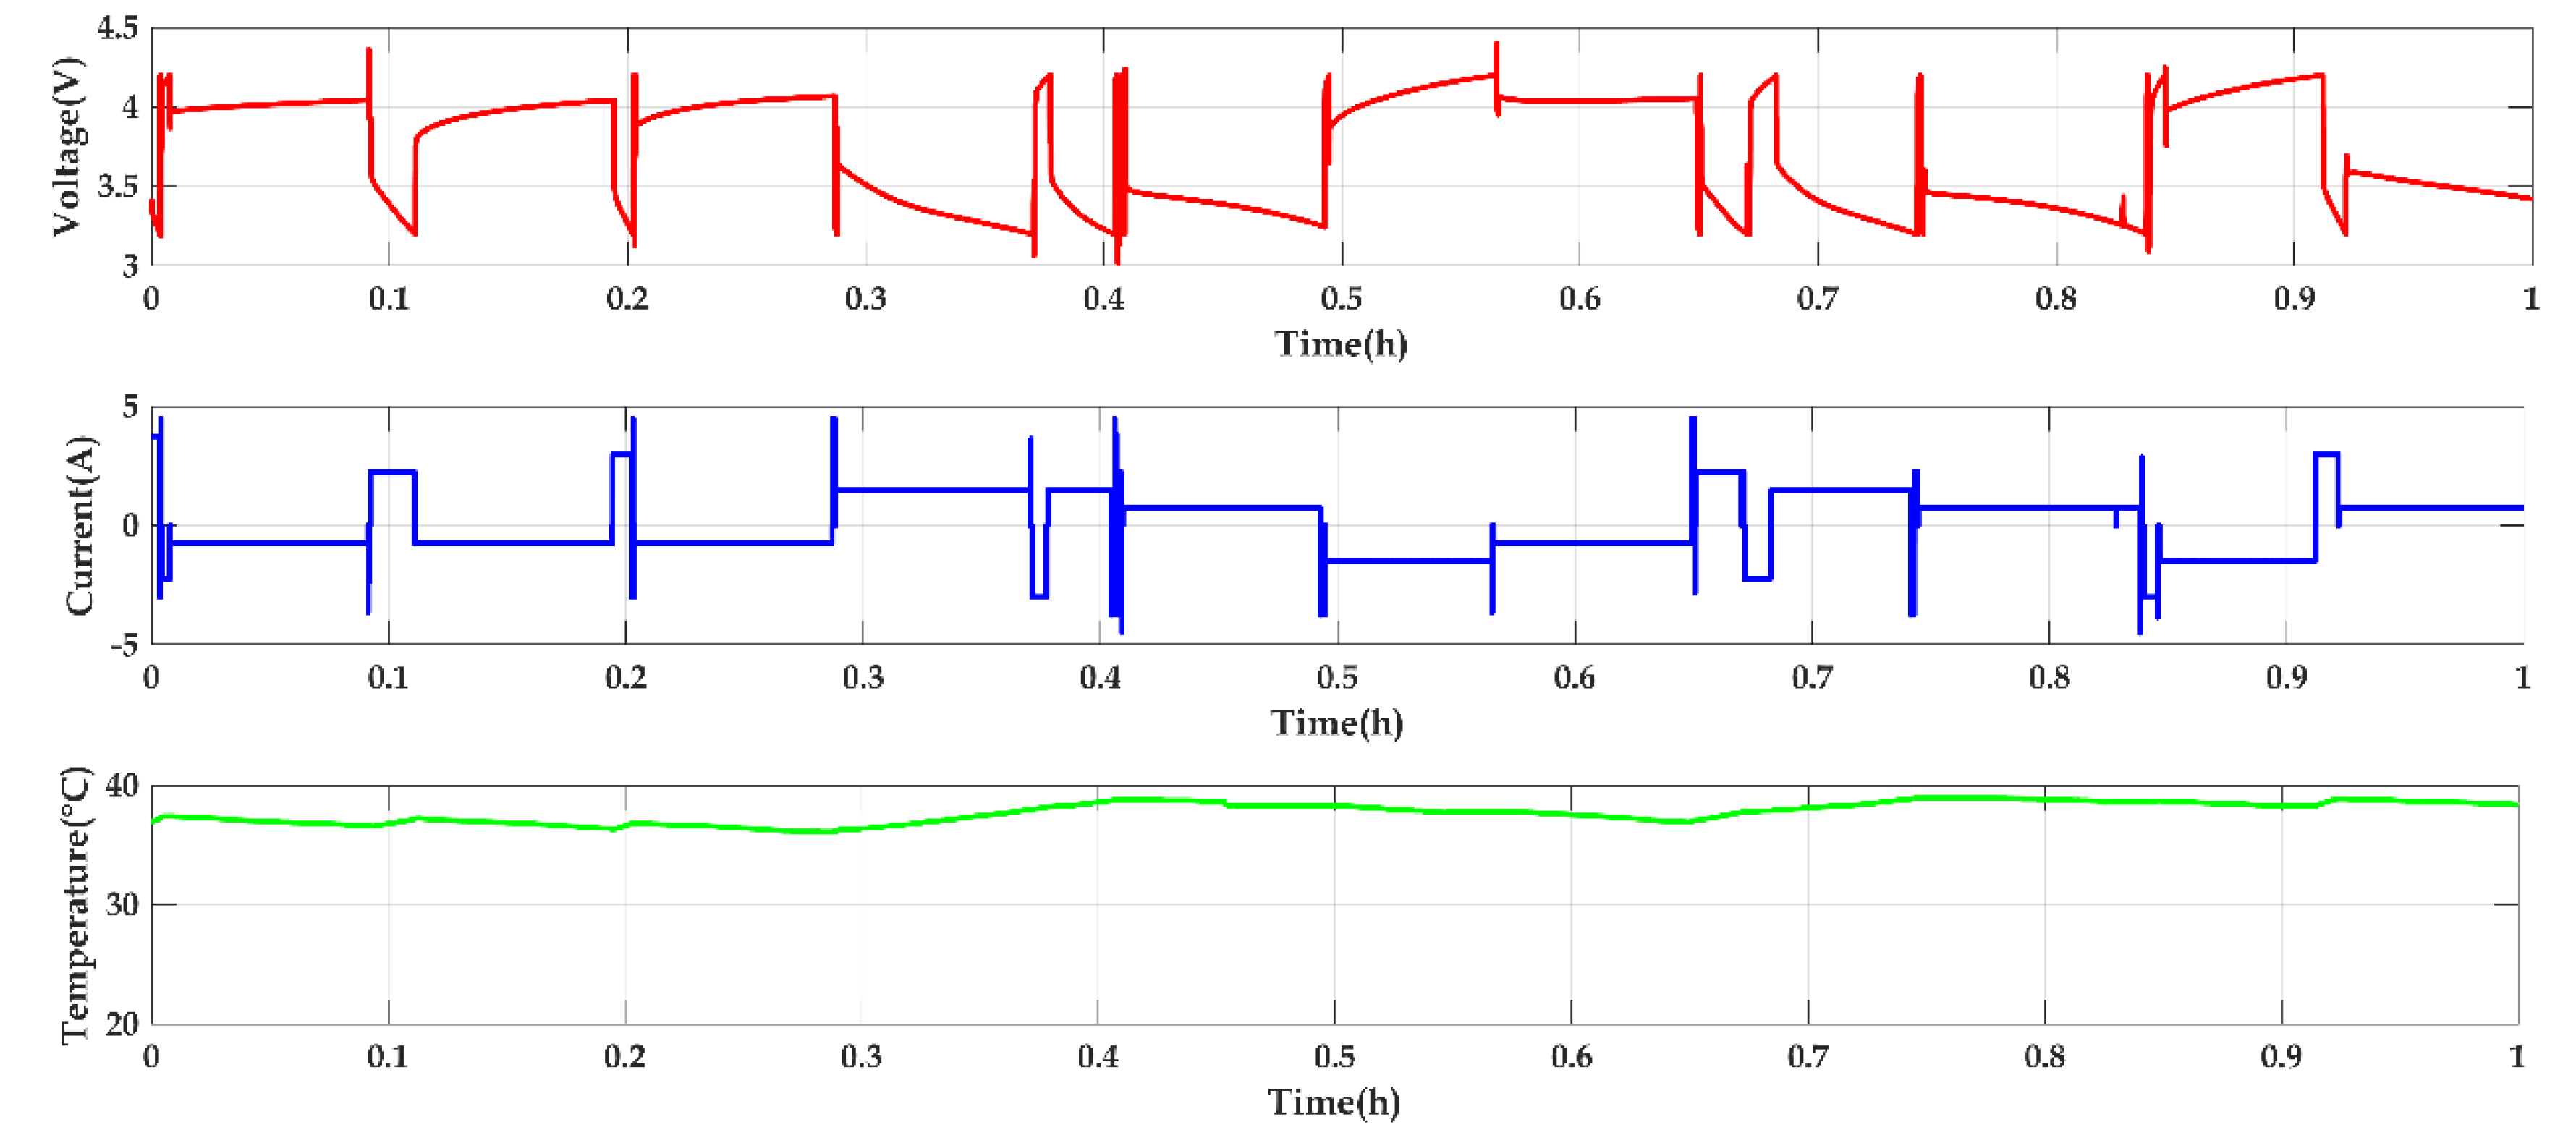
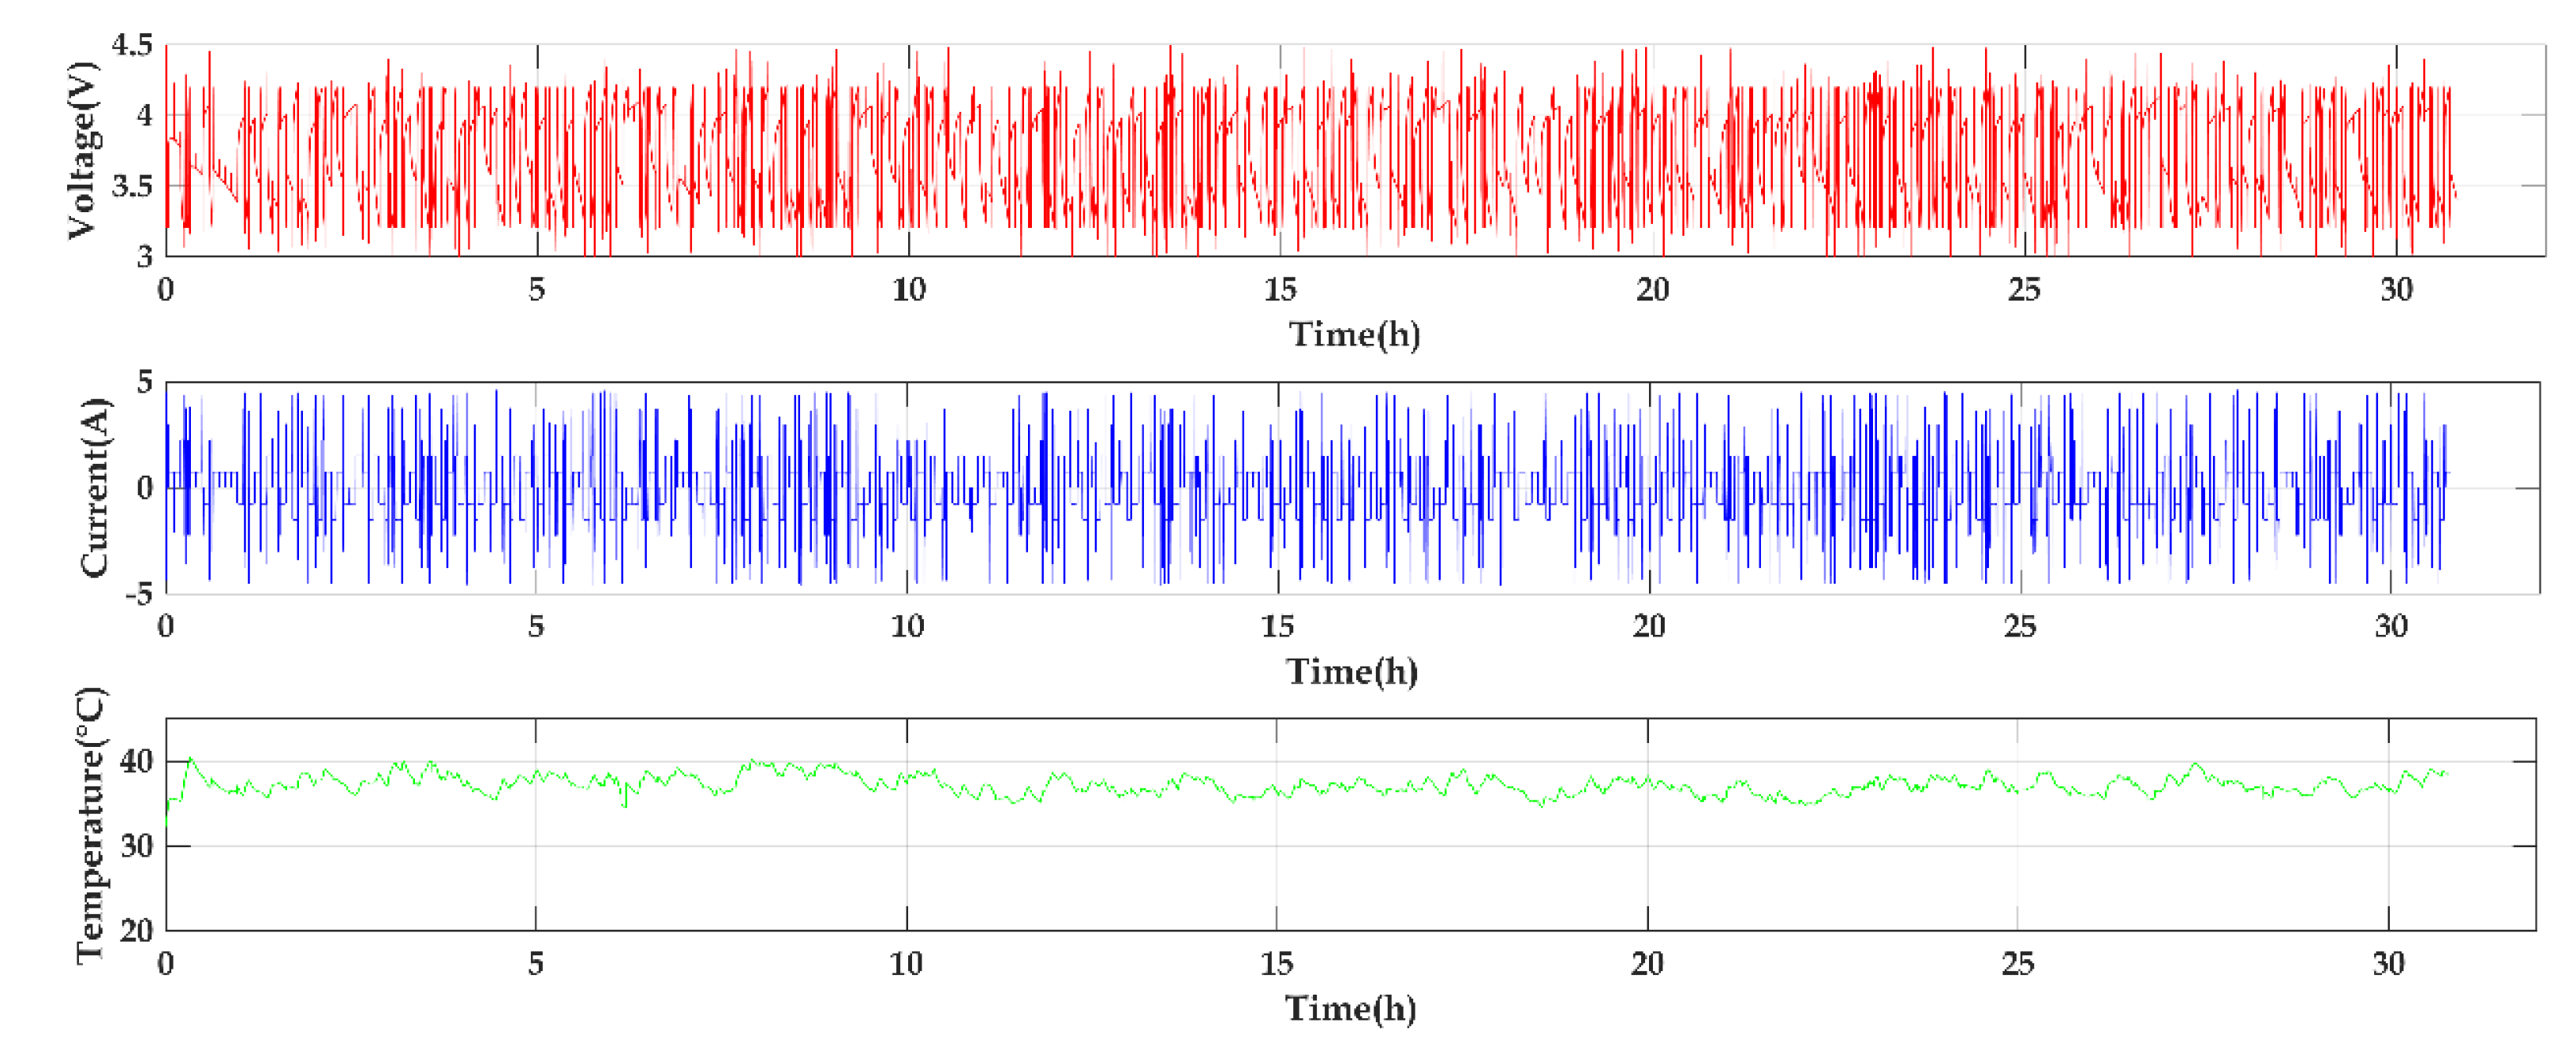
3.1. Random Walk (RW) Profile Generation

This RW profile comprises of randomized sequence of current ranging between −4.5 A and 4.5 A. A randomly selected charging or discharging current from the set (−4.5 A, −3.75 A, −3 A, −2.25 A, −1.5 A, −0.75 A, 0.75 A, 1.5 A, 2.25 A, 3 A, 3.75 A, 4.5 A) is applied to a battery for every five-minute which is specified as a step in the dataset. Negative currents are associated with charging and positive currents indicate discharging operation. For every five-minute duration a new current is chosen randomly and applied to the battery. To ensure battery safety operation, battery voltage is charged to its maximum threshold voltage 4.2 V and discharged to its minimum threshold voltage 3.2 V. Whenever a battery runs beyond its voltage range (3.2 V to 4.2 V) during its step operation, then the current step operation stops and new step operation is initiated by choosing a new value from the current set. After every step, a small amount of delay of approximately 1 s is permitted to choose a new current value which is described as rest (random walk) in the dataset and repeated for every step. Therefore, a single RW cycle consist of 1500 RW steps and 1500 rests (random walk); each RW profile consists of numerous RW cycles. After every RW profile, battery undergo reference charge and discharge profile to assess the battery’s capacity and calculate its SOH value. Even though the exact driving pattern of the EV is not imitated by the RW profile, it makes best attempt to capture the dynamic operating condition of the EV with the help of a random current set.

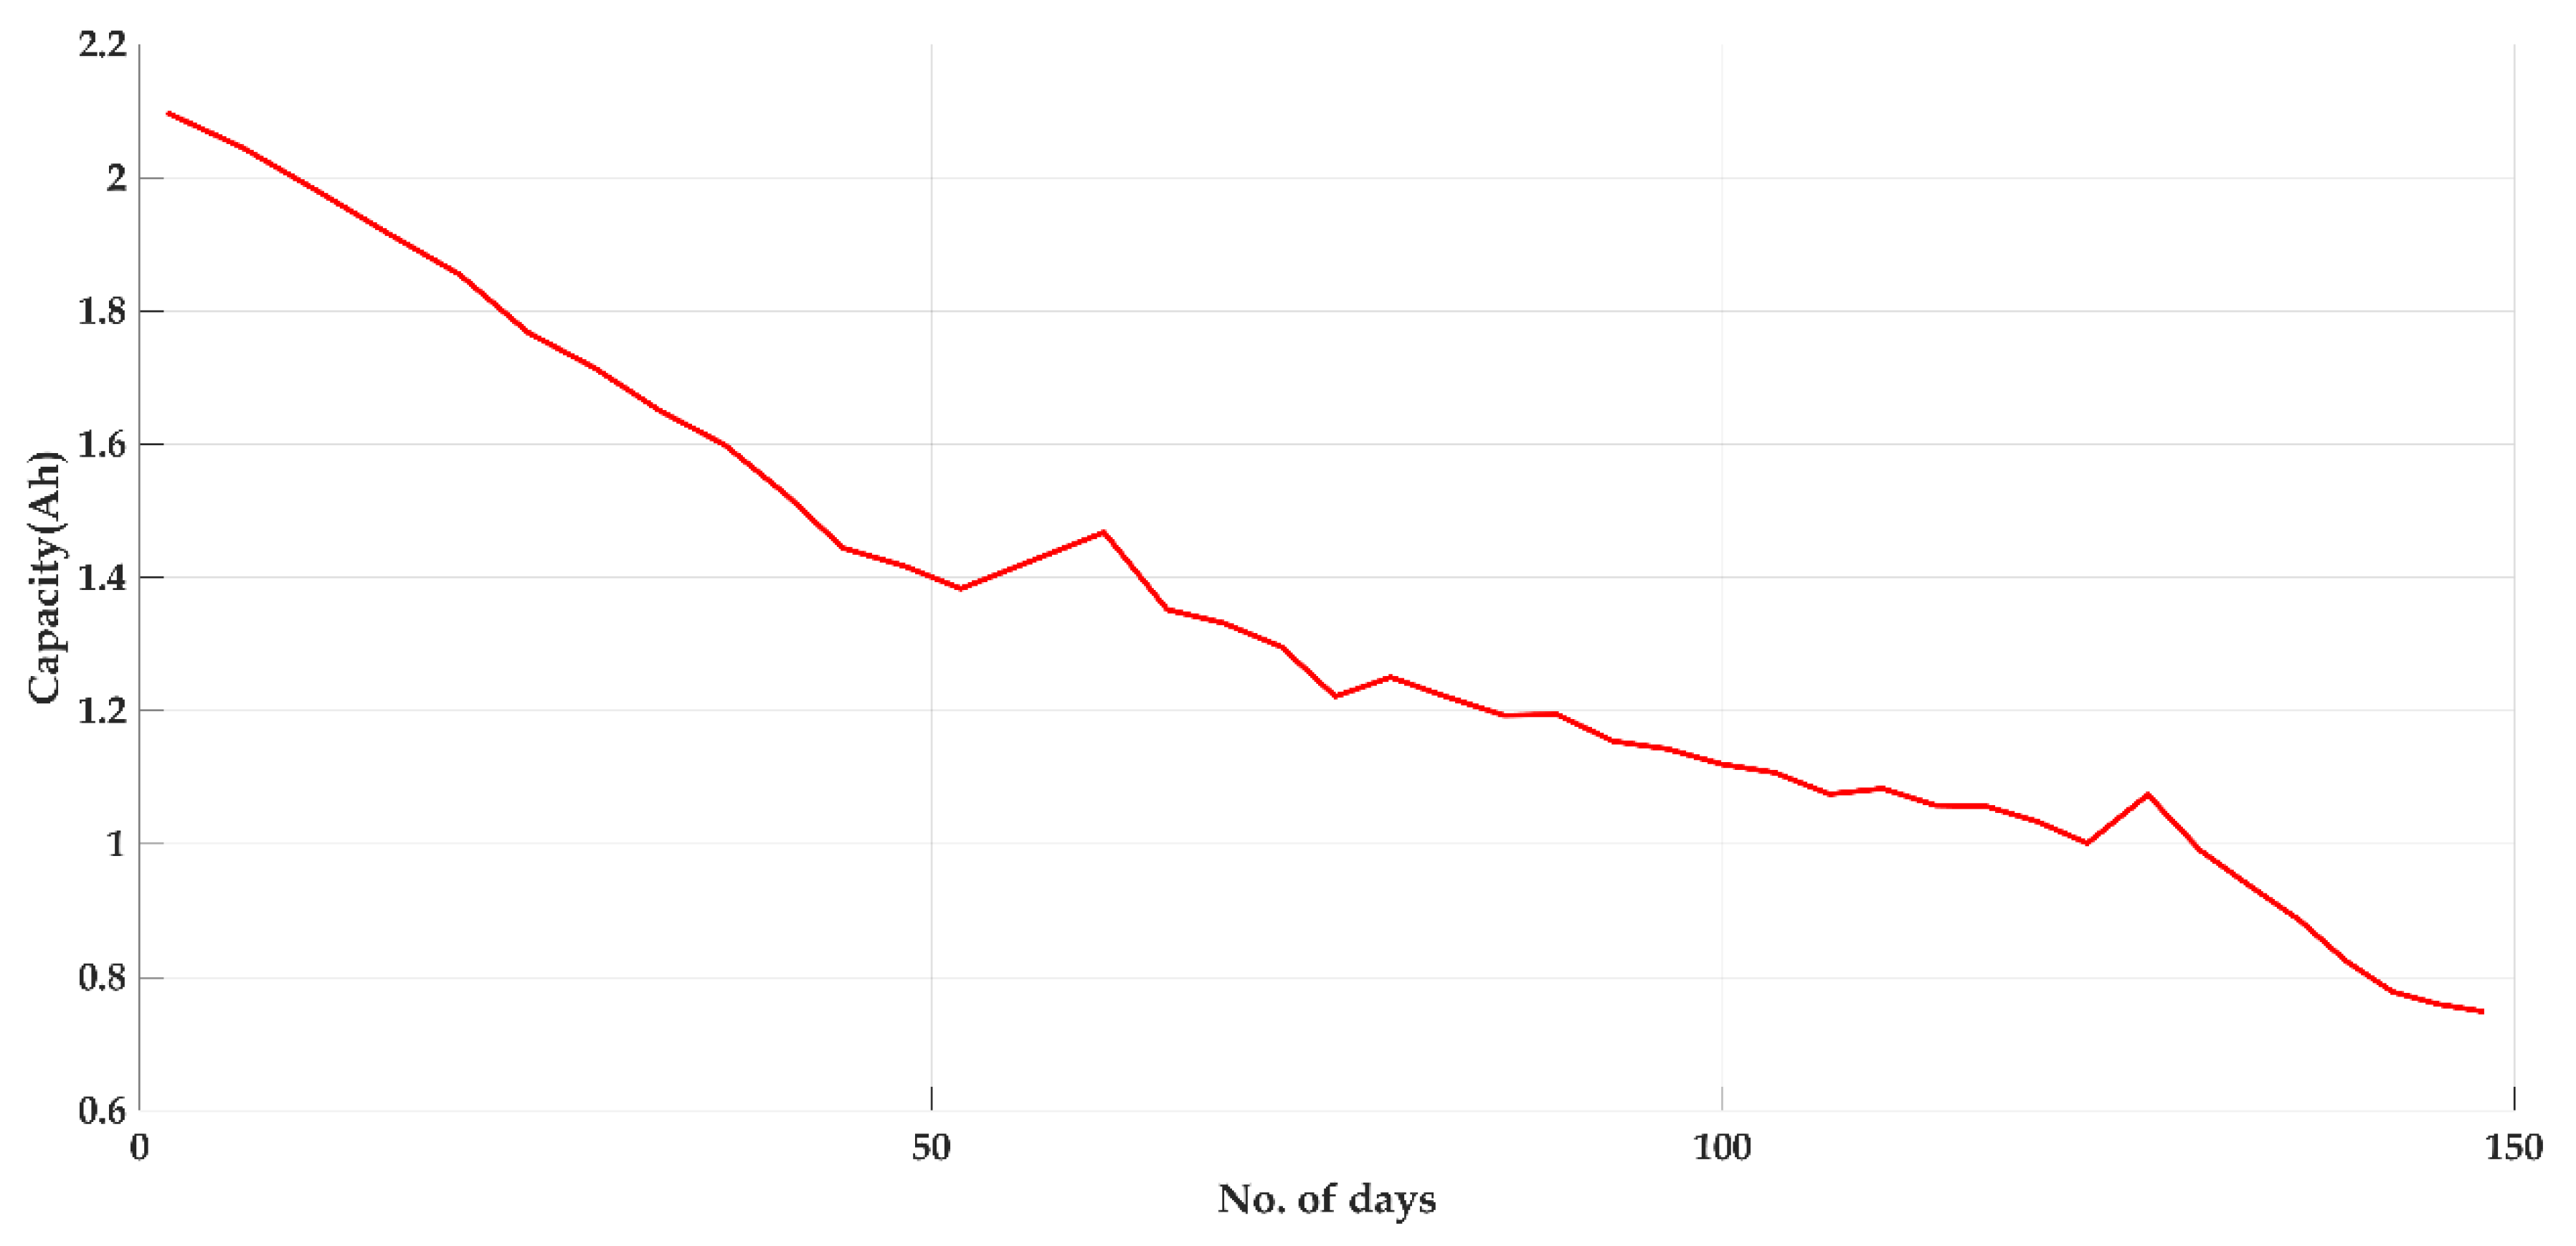
3.2. Reference Charge and Discharge Profile

Before every RW cycle starts to provide a reference benchmark for battery SOH, a series of reference charging and discharging profiles were carried out. Firstly, the battery is charged to its maximum voltage by applying constant current of 2 A, then a constant voltage of 4.2 V is maintained until its current drops to 0.01 A. Subsequently, 2 A current load is applied to the battery until its voltage drops to 3.2 V. This charging and discharging operation are defined as reference charging and discharging cycle. After every RW cycle, the present battery capacity (Qpresent) of the battery can be calculated by accumulating total discharge current (Id) of the battery cell during reference discharge cycle as given as,
Q p r e s e n t   ( t ) =   0 t I d ( t )   d t
After every RW cycle, the reference charge and discharge cycle are carried out twice. For better analysis, the very first reference charging and discharging cycles are considered for calculating battery capacity after every RW cycle, and remaining reference cycles are ignored due to very small amount of capacity reduction exhibited by the battery cell. For every RW, reference charging and discharging profile, the battery’s V, I and T are monitored for every second along with its time (referenced to the beginning of the experiment) and relative time (referenced to the beginning of the step). Figure 2 and Figure 3 represents V, I and T for first 50 and last 50 RW steps of RW9 profile respectively.

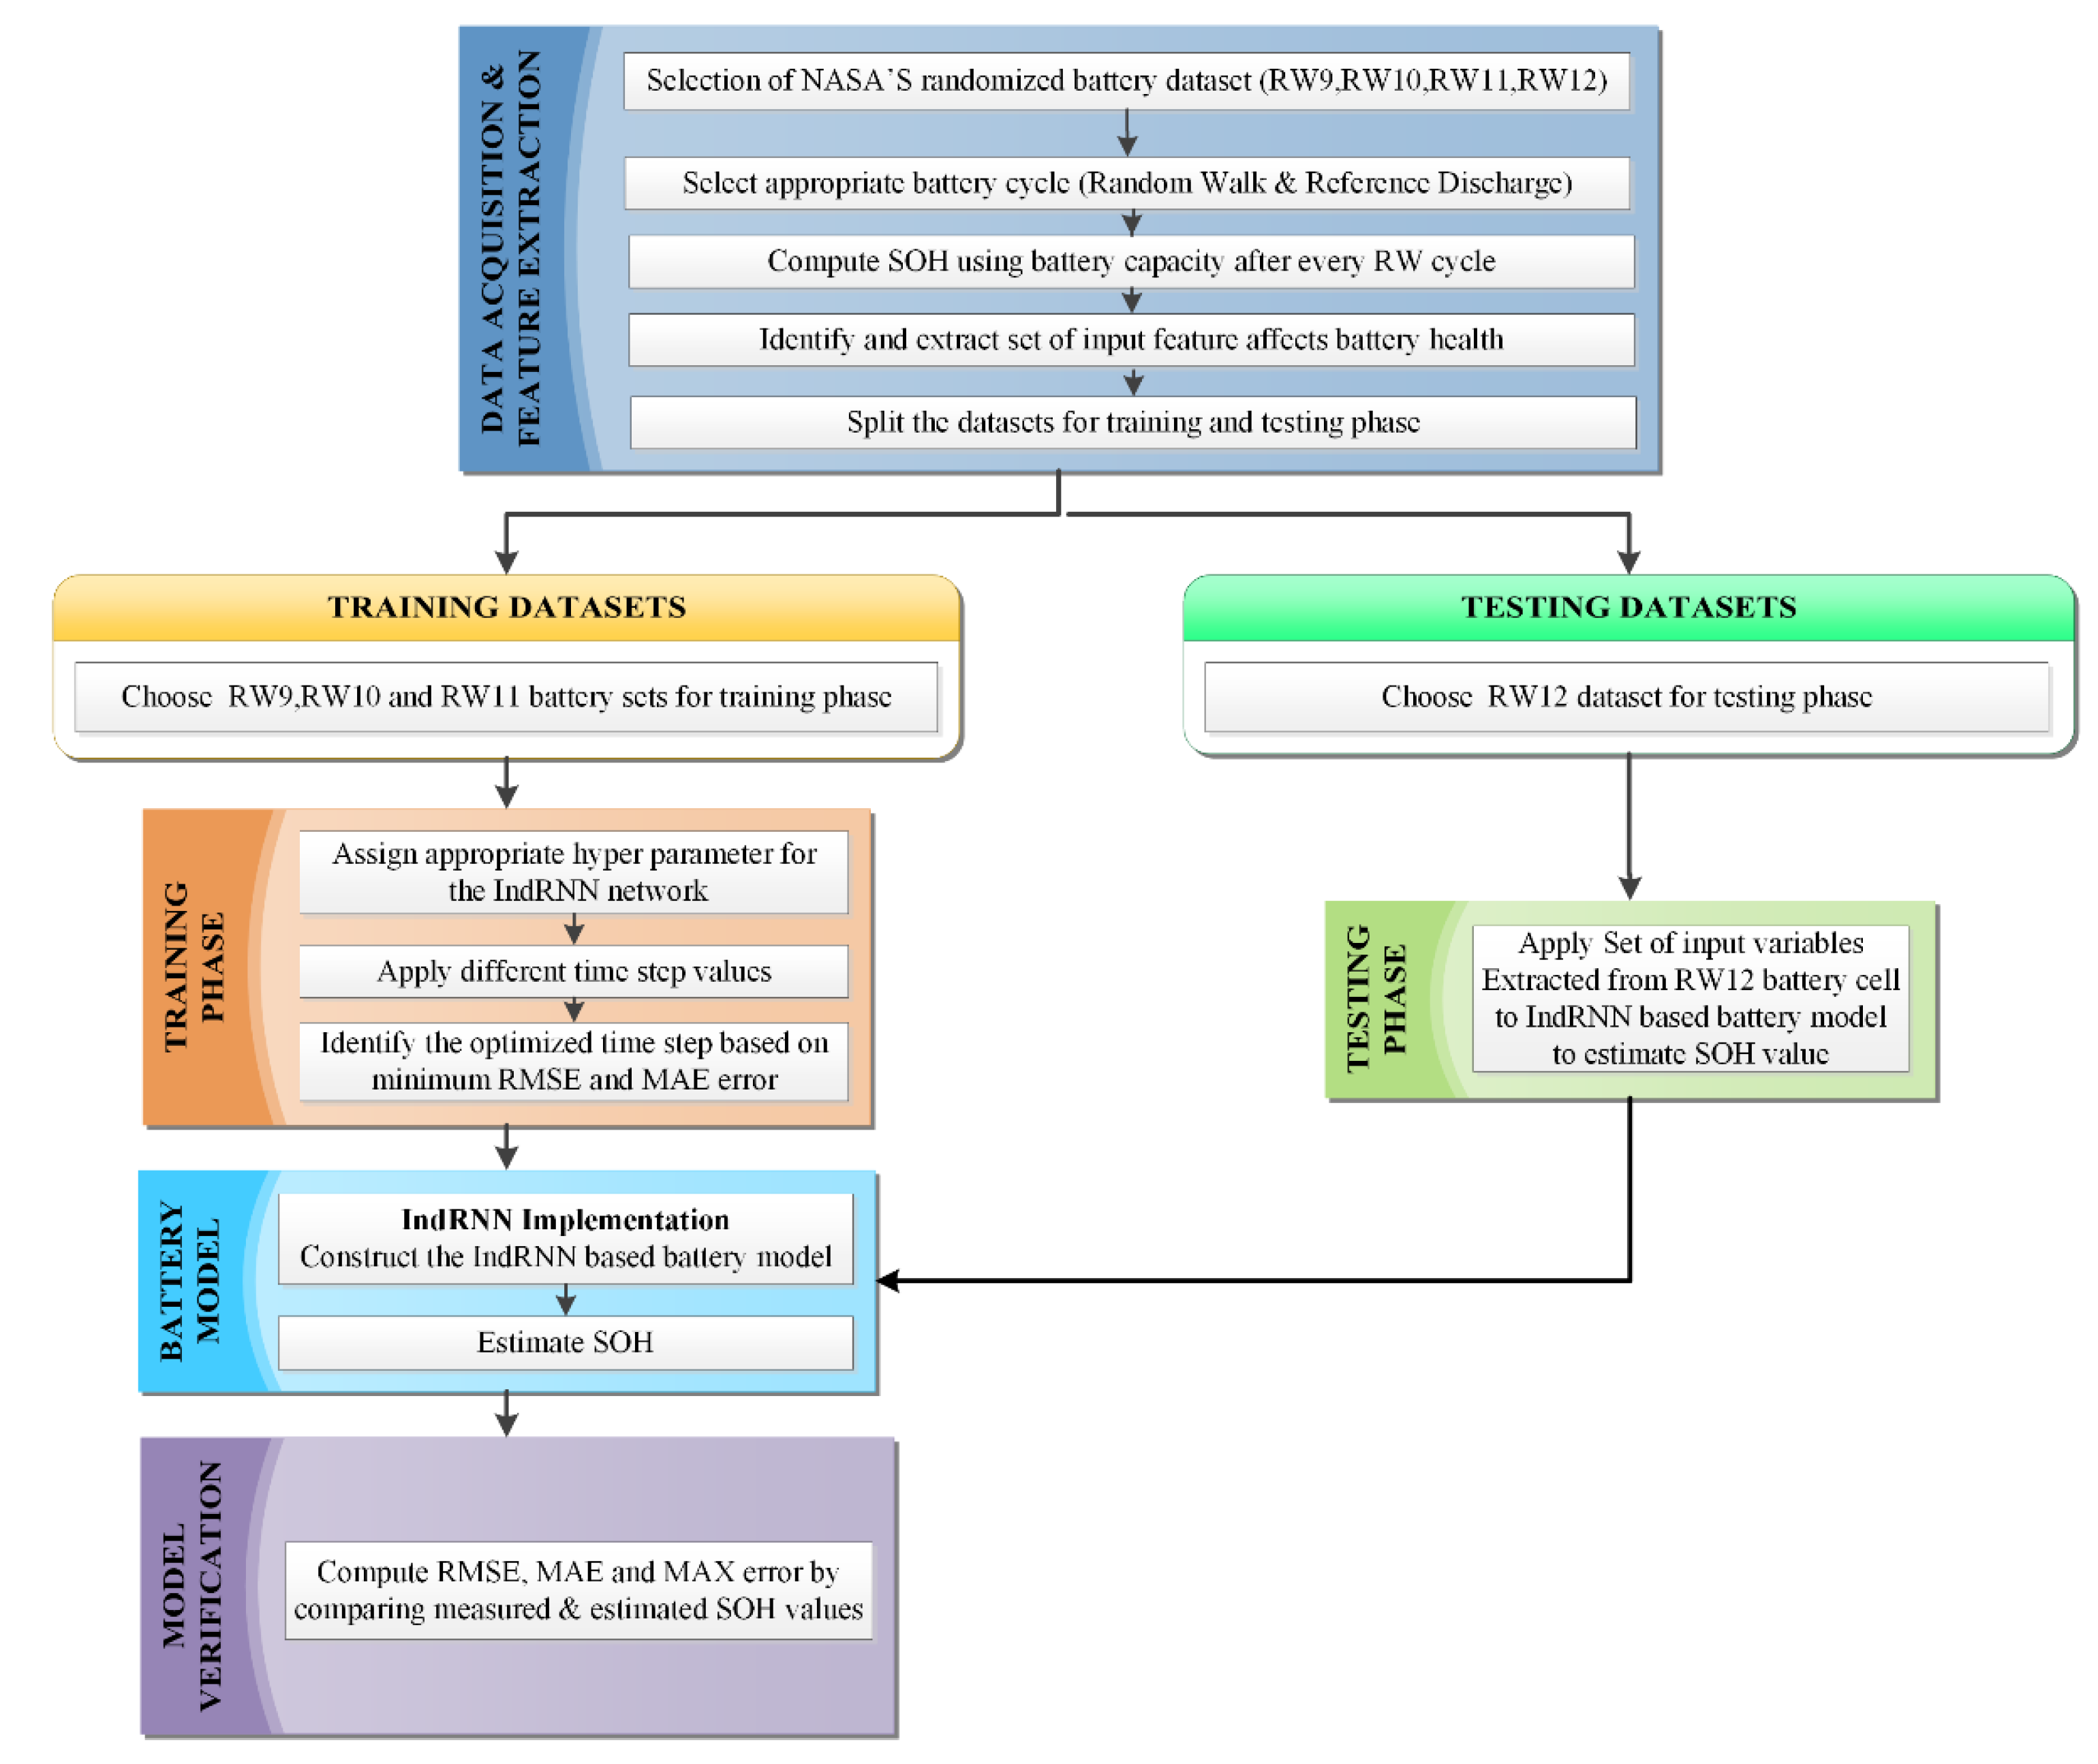
4. Framework for SOH Estimation

4.1. Input Feature Extraction

There are many factors that influence battery ageing, which includes load enforced, operating temperature, humidity and their electrochemical effects. It is difficult to consider all these factors in any model estimation approach to predict SOH. Instead, this research work presents a SOH estimation method based on three battery parameters V, I and T acquired through BMS of EV in relation with battery capacity degradation. These battery parameters can effectively capture and reproduce the effect of the aforementioned battery ageing factors. The intention behind choosing V, I and T for SOH estimation is, they all depend on each other. From Figure 2 it is very clear that V, I and T are not independent of each other. In particular, observe V, I and T at time instant near to 2.5 h as current increases (discharge), battery voltages starts to decrease and temperature begin to rise gradually. In contrast, at time instant near 2 h when current decrease(charge), voltage starts to increase and temperature starts to decrease gradually towards room temperature. To demonstrate the effect of V, I and T on the battery ageing process last 50 random walk discharge profile of same battery cell RW9 as shown in Figure 3. It is evident that, time period for last 50 RW steps are lesser than first 50 RW steps which indicates that the battery reaches minimum and maximum threshold voltage frequently.
Consider for the first and last 50 RW steps that the battery cell operated under fresh and aged condition with random current load applied for every, which means approximately entire time taken for 50 steps must be 4.167 h. The time taken by the first and last 50 RW steps are approximately 3.47 h and 1 h respectively. The mismatch between actual duration (4.167 h) and practical duration (3.47 h) of first 50 RW cycle is due to some of the random current load applied when the battery is near to its minimum(3.2V) and maximum(4.2V) threshold voltages. Under such condition (4.2< V < 3.2), current step is stopped, new load current is chosen and applied to the battery cell to start the next step. However, for the last 50 RW cycle this time duration is much less (1 h) because the battery reaches its minimum and maximum threshold voltages very frequently this is due to increase in internal resistances which inherently reduces battery storage capacity. Similarly, total time unit taken for every RW cycle decreases since the battery is operated from fresh condition to aged condition. Figure 4 shows the first RW cycle of battery cell RW9 which consumes approximately 93.18 h whereas the last RW shown in Figure 5 consumes only 31.07 h, which is much less compared to the first RW cycle time duration. It clearly evident that in addition to V, I and T of the battery, the time duration of RW cycle and reference discharge cycle also influence the capacity degradation at different stages for fresh and aged batteries.
Figure 6 represents the reference discharge profile of the battery cell RW9. It is clear that voltage decay rate increases as the battery ages which leads to a decrease in battery capacity because of a rise in internal resistance.
Figure 7 represents the capacity degradation of battery cell RW9 over its lifetime. In Figure 7, approximately at 60th and 126th day the battery capacity increases. The possible reason for such increase is not indicated clearly in the experimental dataset. One possible reason could be that the reference battery characterization tests are carried out after the battery is allowed to rest for some time.
For each RW cycle, factors which accelerate battery ageing are identified from NASA’s randomized battery dataset. Each RW cycle consists of 3000 steps which include 1500 RW steps and 1500 RW rest periods, and the capacity of the battery is measured for every RW cycle. As battery capacity is used for SOH estimation, the relation between set of input parameters and battery capacity must be drawn for every RW cycle to construct the SOH estimation model. Identify the set of input features associated with time series data for each RW cycle and form an input vector x of size j. For example, for every RW cycle in each battery profile of measured battery parameters Vi, Ii and Ti are mapped to a single j-dimensional input vector x. The size of input vector xj is same for all RW cycles. As discussed, although many factors influence the battery ageing process with respect to each RW cycle, the following 18 factors significantly contribute to accurate SOH estimation.
The first three factors of the input vector are mean of V, I and T for a particular RW cycle which are directly measured from battery and denoted as Vavg(rwk), Iavg(rwk) and Tavg(rwk) respectively. Furthermore, these can be represented as follows,
x j , 1 = V a v g ( r w k ) = 1 n i = 1 n V ( r w k ) i
x j , 2 = I a v g ( r w k ) = 1 n i = 1 n I ( r w k ) i
x j , 3 = T a v g ( r w k ) = 1 n i = 1 n T ( r w k ) i
where, n represents number of steps in each RW cycle which is 3000, k represents number of RW cycles in each battery dataset, V(rwk)i, I(rwk)i and T(rwk)i represents voltage, current and temperature acquired during each step of RW cycle rwk respectively. The fourth factor for the input vector is the present battery capacity measured prior to the beginning of the RW cycle rwk is given by,
x j , 4 = Q ( r w k )
The fifth factor is the total time elapsed for each RW cycle is Δ t ( r w k ) given by,
x j , 5 = Δ t ( r w k )   =   t ( r w k ) n t ( r w k ) 1
where, t ( r w k ) 1 and t ( r w k ) n     represents time measured at the beginning and end of the RW cycle rwk. The next factor of the input vector is the time elapsed during each reference discharge cycle rdm which can be represented by,
x j , 6 = Δ t ( r d m )   =   t ( r d m ) 3.2 V t ( r d m ) 4.2 V
where,   t ( r d m ) 4.2 V and t ( r d m ) 3.2 V represent time measured at the beginning (when V is at 4.2 V) and end (when V is at 3.2 V) of the reference discharge cycle rdm respectively and m represents the number of reference discharge cycle. And remaining input factors are total time period of each current load applied under each RW cycle rwk. There are 12 different random current loads −4.5 A to 4.5 A applied for every RW cycle, and their time duration are denoted as t−4.5k, t−3.75k, t−3k, t−2.25k, t−1.5k, t−0.75k, t0.75k, t1.5k, t2.25k, t3k, t3.75k, and t4.5k. Total time duration of each current load under every RW cycle rwk are denoted as T1(rwk) to T12(rwk). The equation for T1(rwk) is given below, similarly the total time duration of remaining current load conditions (−3.75 A to 4.5 A) can be represented as input vector xj,8 to xj,18.
x j , 7 = T 1 ( r w k ) =   i = 1 n t 4.5 i      
where, t−4.5i denotes total time duration of load current −4.5 A applied in the RW cycle rwk. All these 18 factors are the input vector and assigned as input layer for the proposed network learning model.

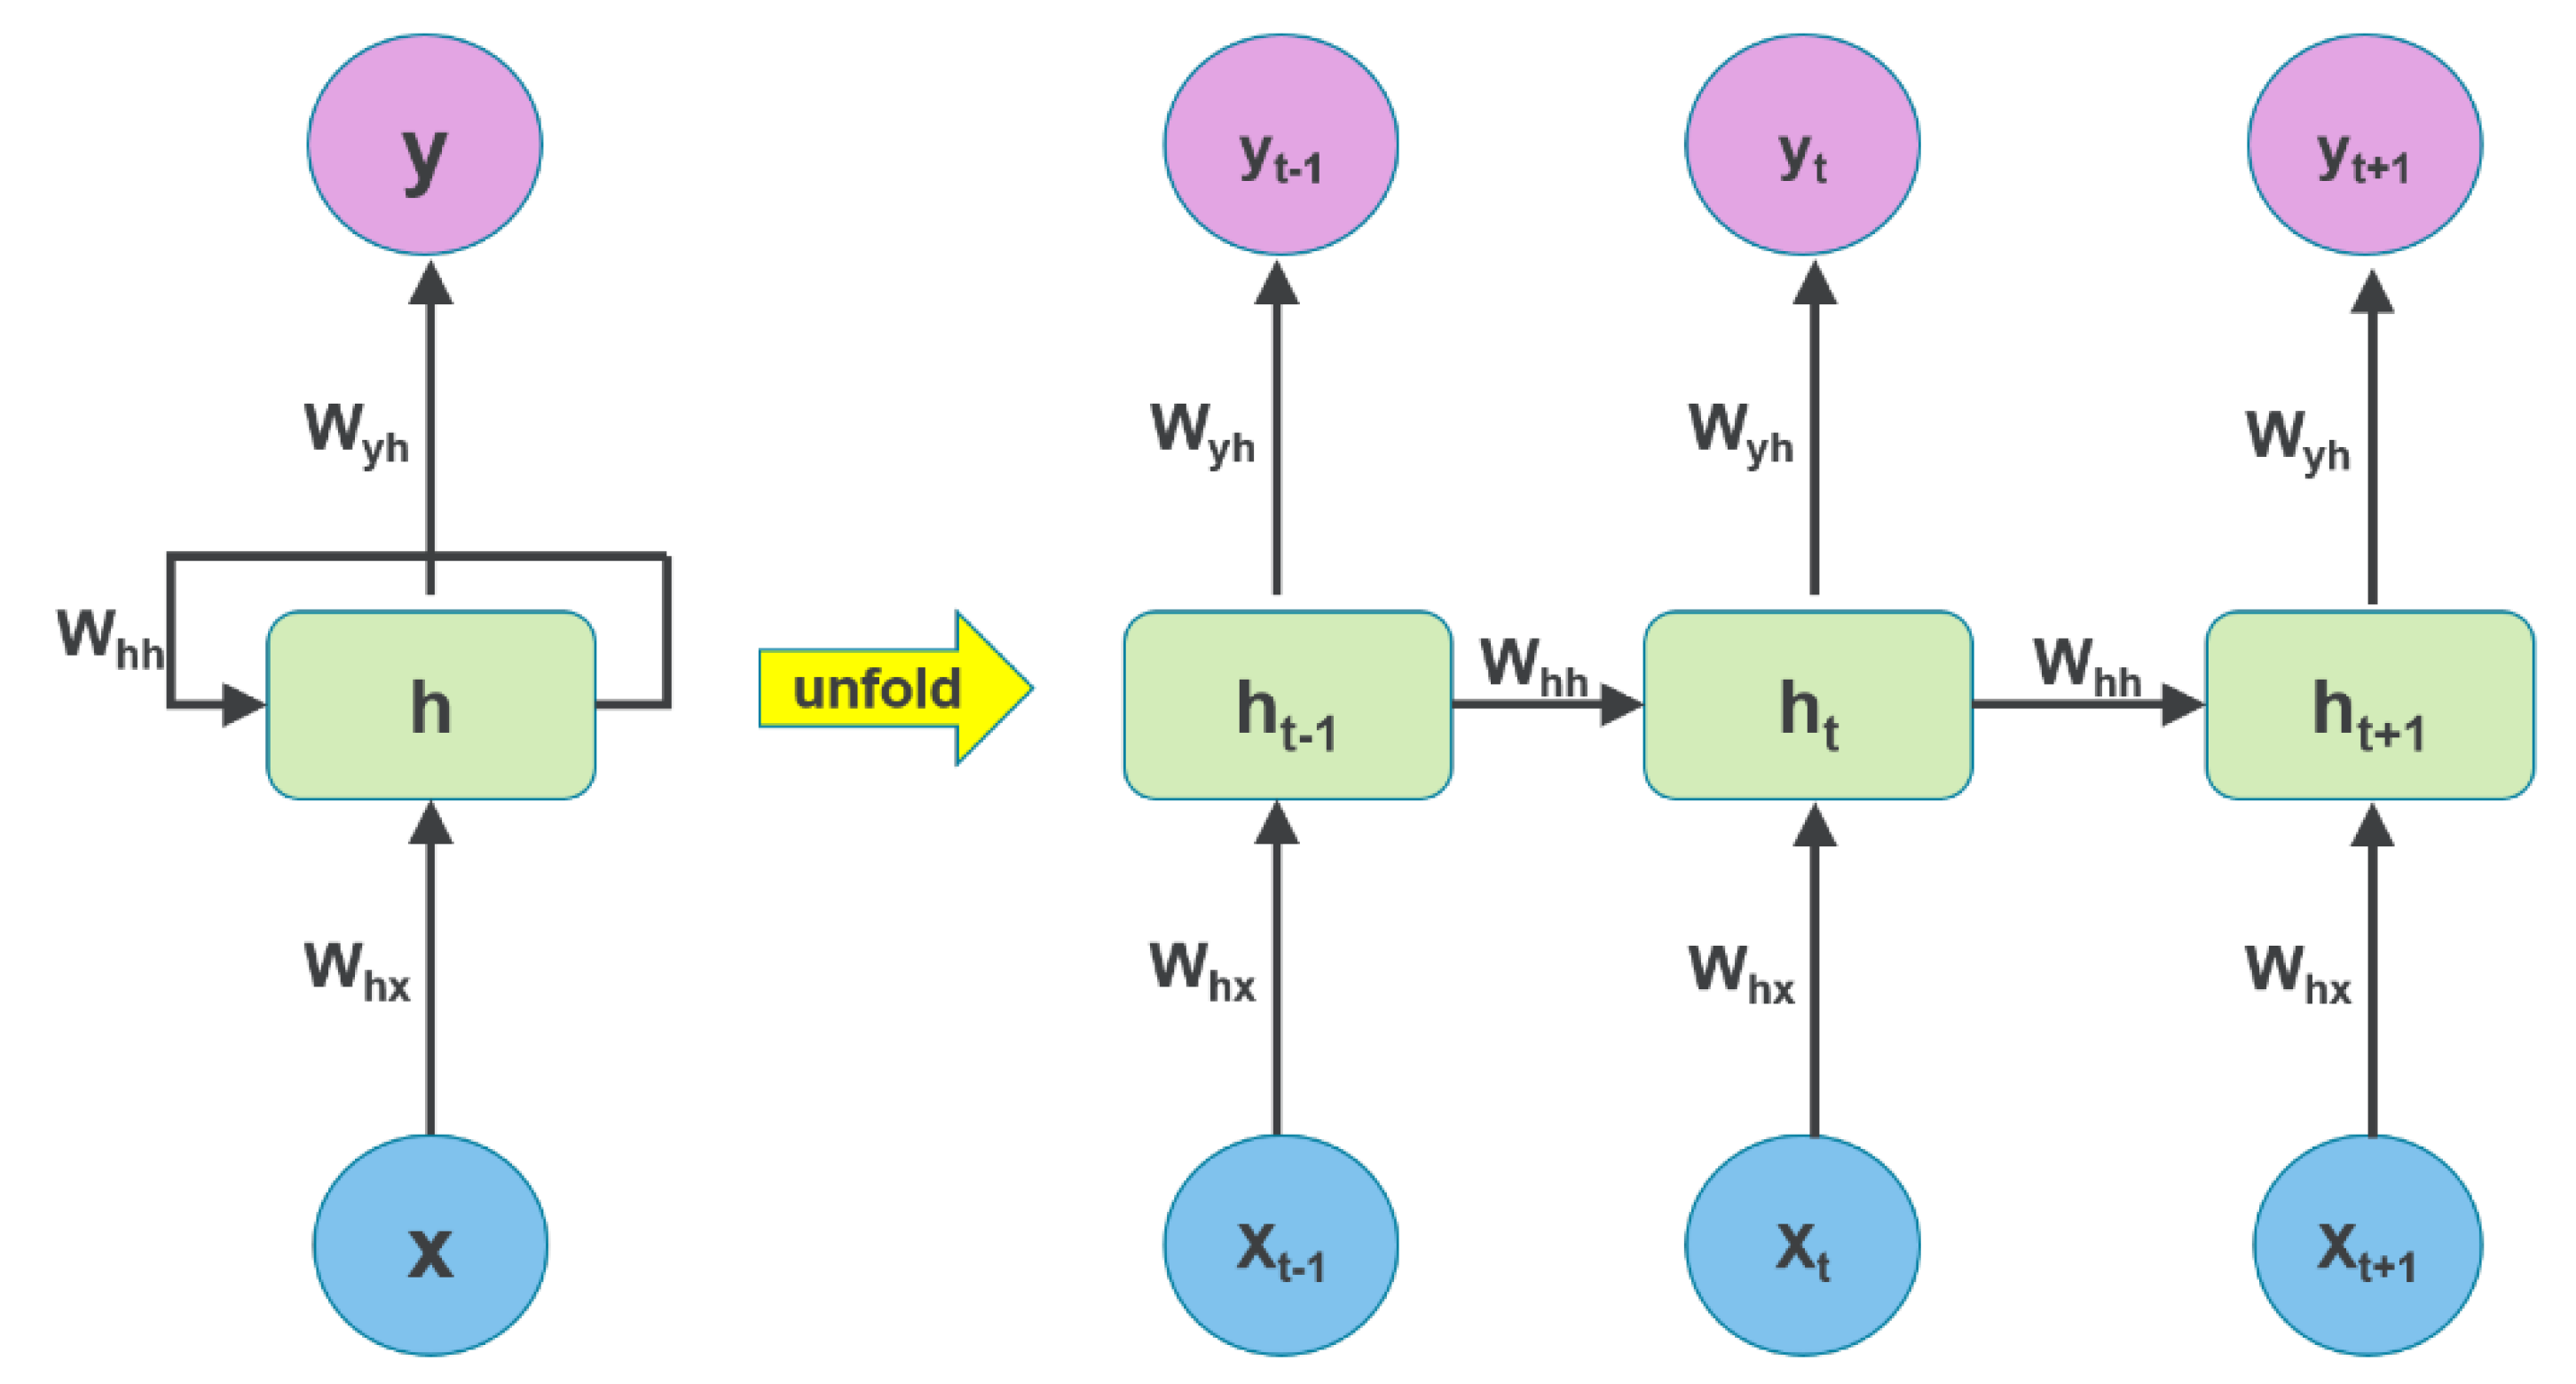
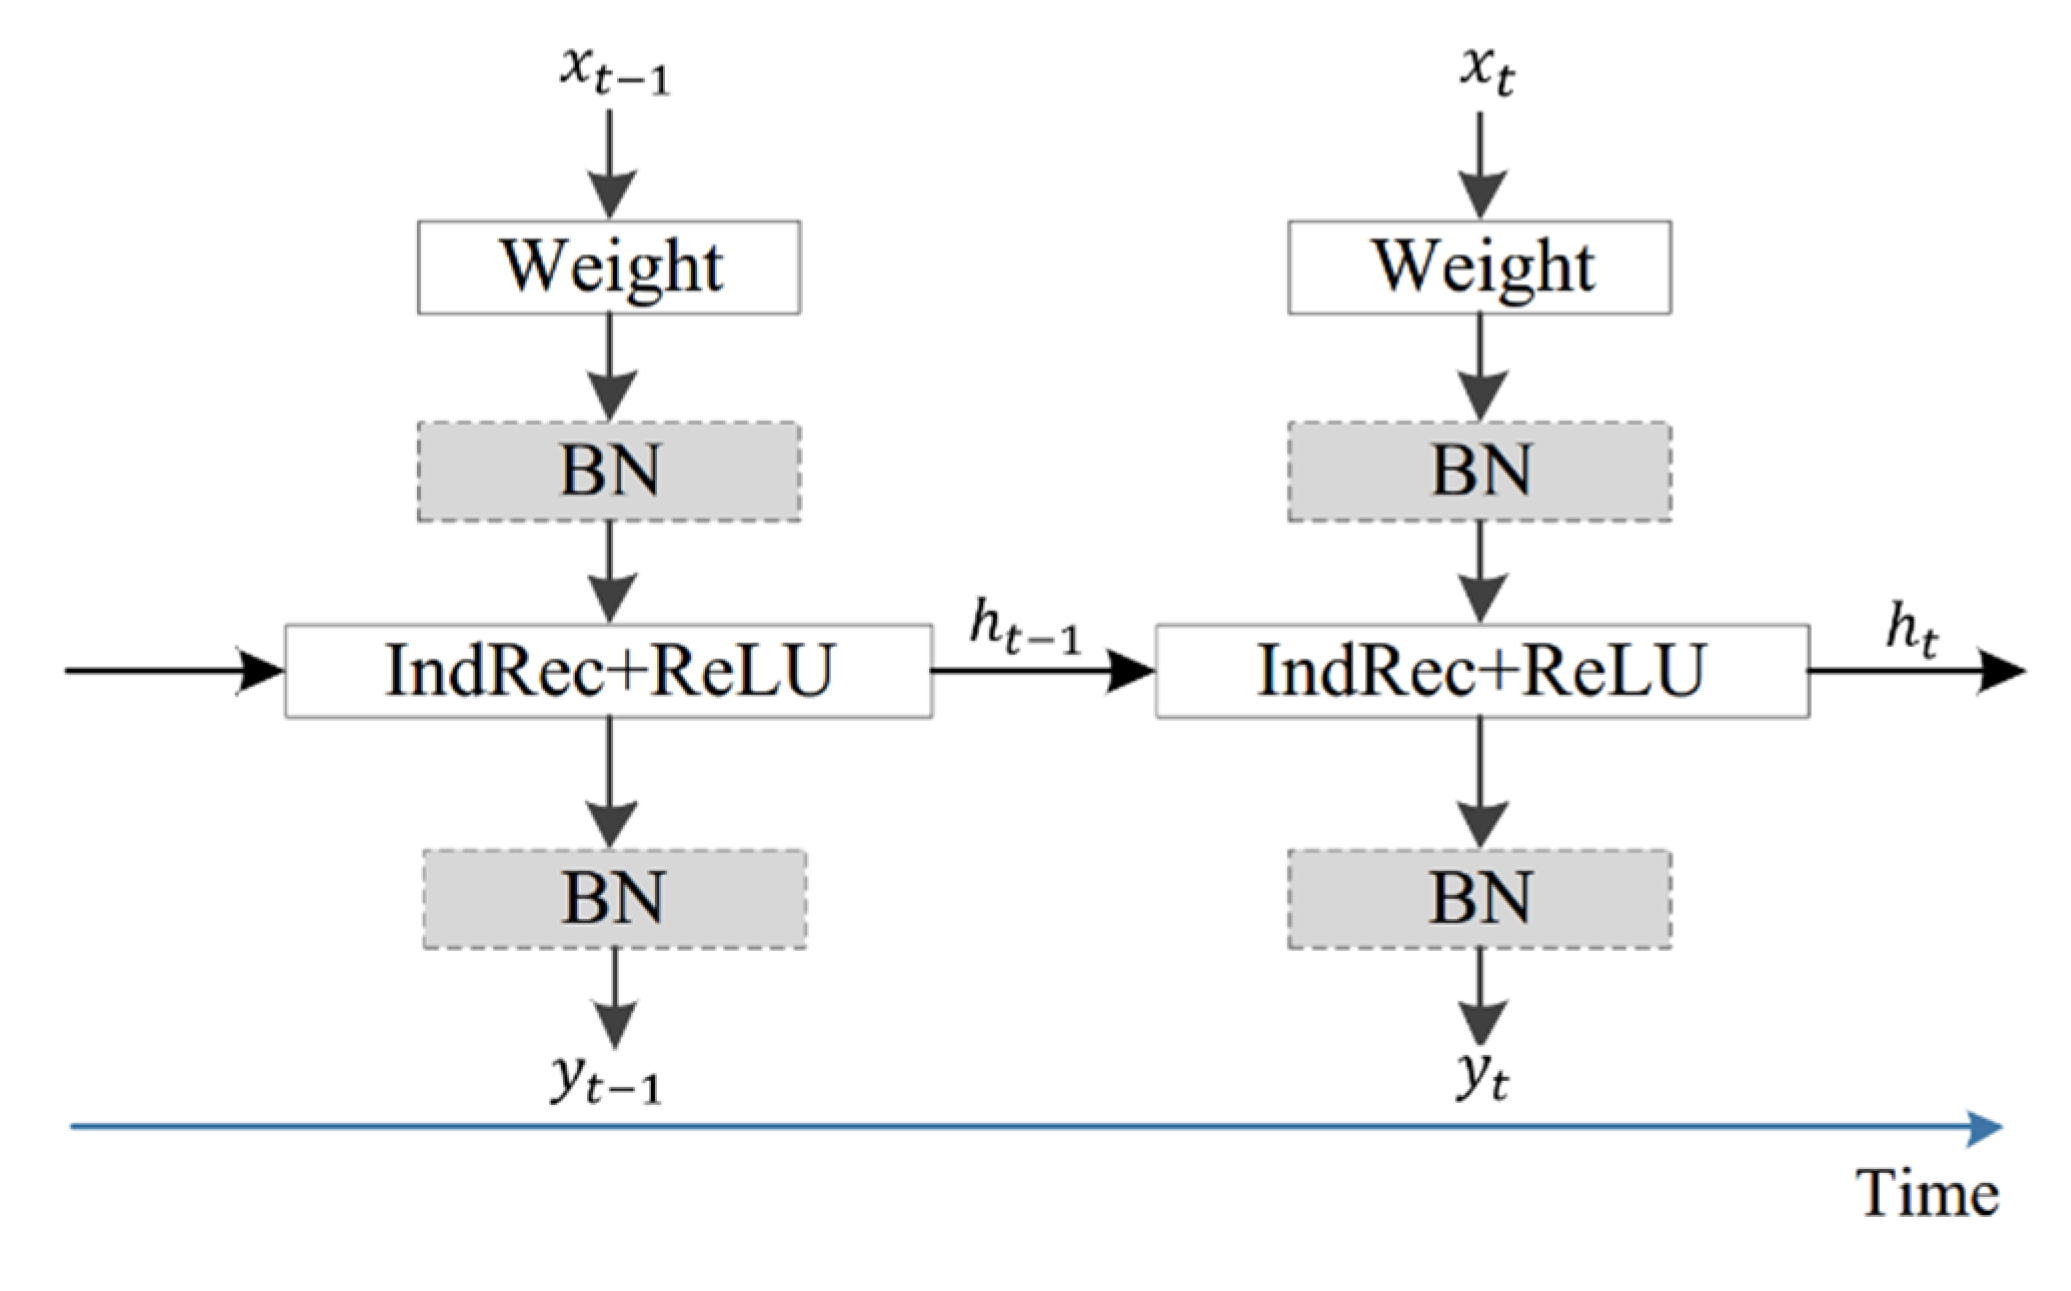
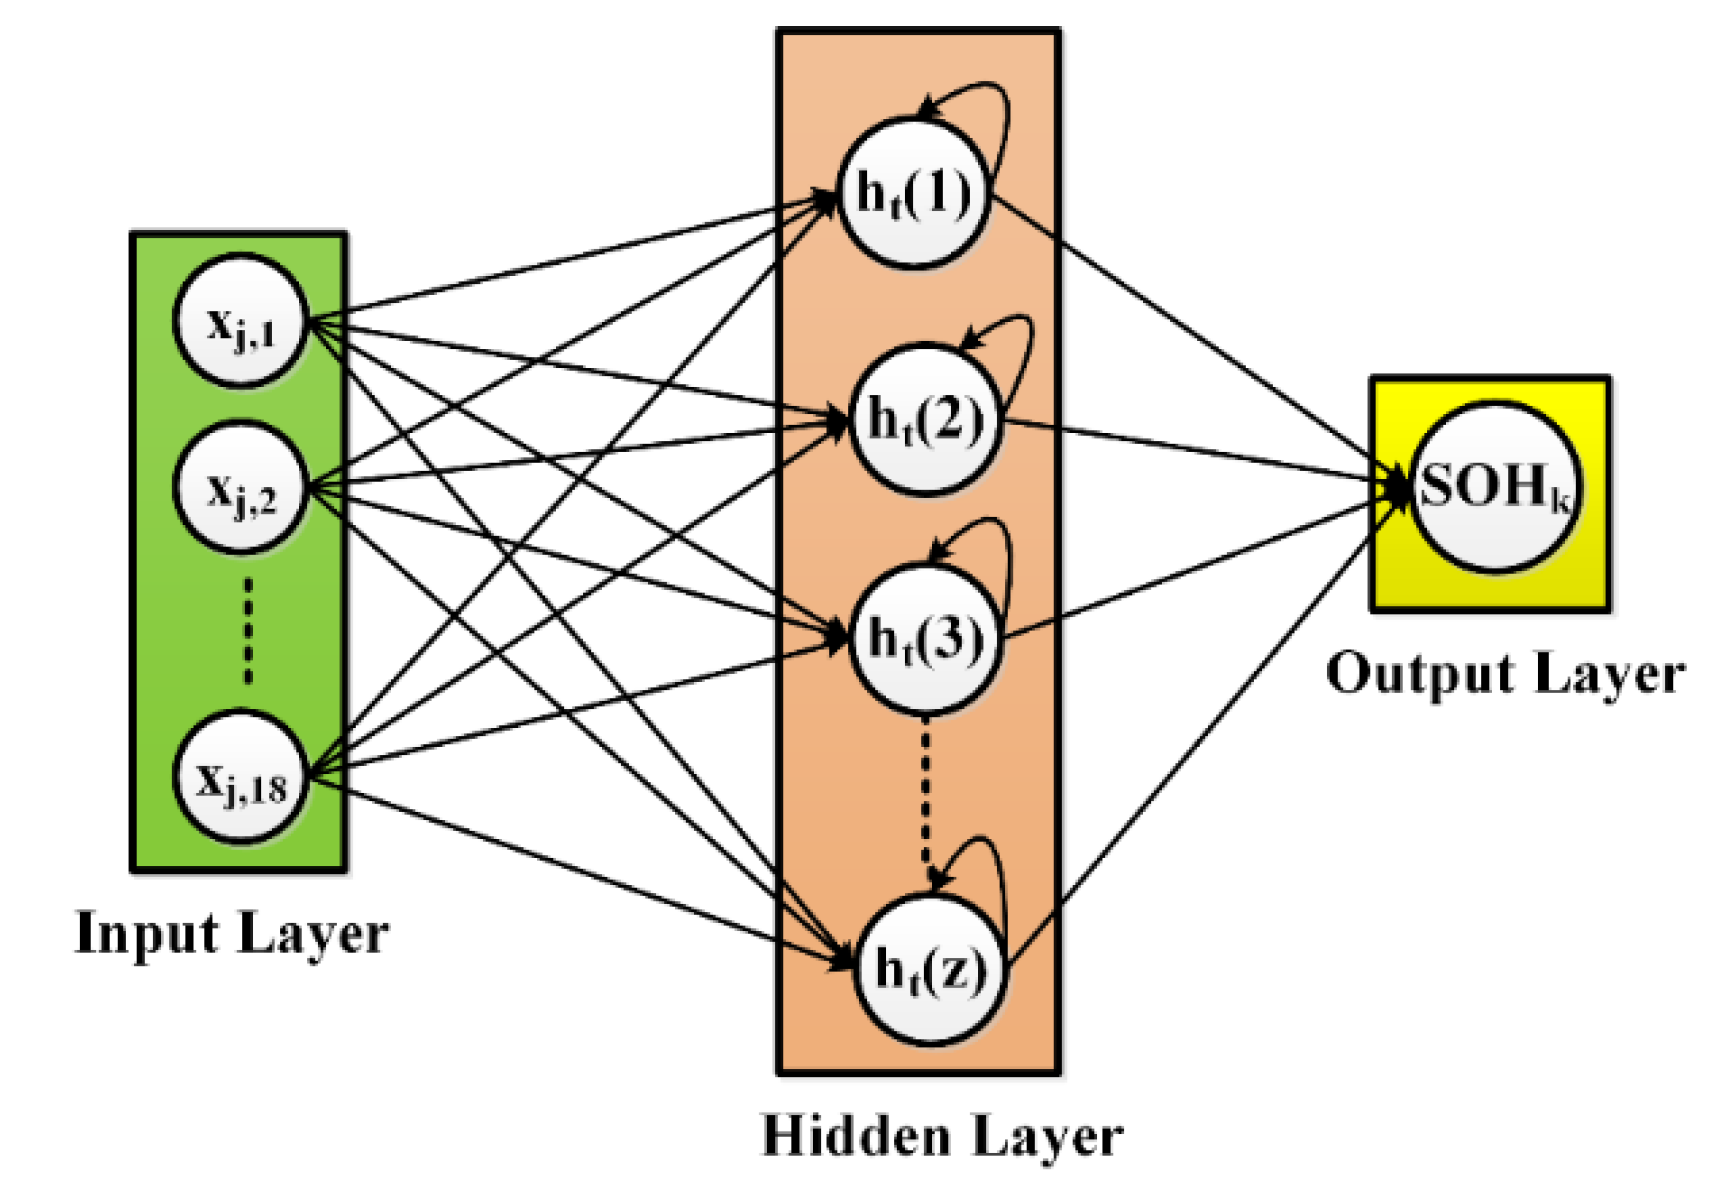
4.2. Independently Recurrent Neural Network (IndRNN) Based SOH Estimation

Unlike a conventional neural network, RNN is a class of deep neural network, which has unique features referred to as internal cell state or memory to study input features and time dependencies from sequential input data to predict the future output. Therefore, the output from each neuron not only depends on current input but also the history of previous hidden state outputs. Figure 8 illustrates the operation of unfolded RNN structure with the feedback loop on a simple RNN. Depending upon the number of time steps, RNN can efficiently retain information about the past. RNN has been extensively useful in natural language processing, speech recognition and machine translation by providing words or characters as input parameters. In addition, RNN can be more suitable for time-series forecasting applications like SOC and SOH estimation, which predict their present output based on a history of previous output and present input over a time. But, RNN and its variants LSTM and GRU are easily prone to long-range dependency problem, which either vanishes or explode the gradient during backpropagation operation. Nevertheless, these variants lead to gradient decay over layers due to the use of sigmoid or tangent as an activation function.
To overcome such issues a new RNN architecture known as IndRNN is proposed [43]. The proposed IndRNN is an enhanced version of simple RNN where neurons in the same layer are independent of each other and they are connected across layers. Figure 9 represents the structure of conventional simple RNN and IndRNN that unfolded in time [43]. Each solid dot represents a neuron in a layer and each line represents a connection. Therefore, in a particular hidden layer of IndRNN as shown in Figure 9b each neuron only receives its own past as context information instead of having full connectivity among all other neuron layers like simple RNN as shown in Figure 9b and thus these neurons are independent of each other’s history. This signifies that each neuron in IndRNN deals with one type of spatial-temporal pattern independently whereas neurons in the simple RNN are connected over time by the recurrent weight connection. Furthermore, IndRNN delivers its robustness by using a non-saturated activation function like rectified linear unit (ReLU). The simulation result in [43] exhibits the ability of IndRNN under a long sequence of time steps, IndRNN provides better performance compared with LSTM.
In this research work, the IndRNN architecture proposed in [43] is adopted for SOH estimation to dissolve the gradient decay problem, meanwhile enabling the network to learn long-term dependencies effectively. In addition, because of simple structure it supports an easy and robust training process with different techniques such as batch normalization, ReLU activation function and dropout. Basic architecture of IndRNN is presented in Figure 10 where, “IndRec+ReLU” block represent input and recurrent process carried out at each time step with ReLU activation function and “BN” denote the batch normalization performed before and after the activation function [43]. A deep-layered IndRNN architecture can be formed by the stacking number of the basic IndRNN architecture.
The Hadamard product is used to process the recurrent inputs in the proposed IndRNN architecture’s hidden layer. Except for this modification, the remaining operation of IndRNN is same as the traditional RNN. For each time step t   , a hidden layer h t     retains and updated based on input layer x t 1 and previous hidden state h t 1 .
The hidden state h t can be updated by an equation as follows,
h t = σ h ( W h x x t + W h h h t 1 + b h )
where, W h x is a vector that represents input weight, W h h is a vector that represents recurrent weight, σ h is a ReLU activation function, denotes Hadamard product, and b h is the bias vector of the hidden layer.
The ReLU activation function σ h is used for the neuron present in the IndRNN hidden layer and it can be expressed as:
σ h =   f ( x ) = { x ,   x 0 0 ,   x < 0  
For the nth neuron on a hidden layer, the hidden state h n ,   t can be attained using the equation as follows,
h n ,   t = σ h ( W n ,   h x x t + W n ,   h h h n , t 1 + b n , h )
where, W n ,   h x and W n ,   h h are the nth row of the input and recurrent weight respectively.
The output of standard RNN structure is updated using equation y t as follows,
y t = σ y ( W y h h t + b y )
where σ y is the activation function of the output layer, W y h is the weight matrix between hidden and output layer, and b y is the bias vector of the output layer.
At the end of each forward propagation, the loss function (L) of the IndRNN is calculated as follows,
L =   1 N t = 1 N | y t y t |
where, y t and y t are the actual value and the estimated value at time step t respectively, and N is the length of the sequence. Since, there is no interactions among neurons on the hidden layer, the gradient of IndRNN is computed independently using the back propagation through time approach. For the n th neuron h n ,   t = σ h ( W n ,   h x x t + W n ,   h h h n , t 1 ) where, the bias is neglected, to minimize at time step T is J n . Then the gradient back propagated to the time step t is given in the following equation,
J n h n , t =   J n h n , T   h n , T h n , t =   J n h n , T   k = t T 1 h n , k + 1 h n , k   =   J n h n , T   k = t T 1 σ n , k + 1 W n , h h = J n h n , T W n , h h T t   k = t T 1 σ n , k + 1    
By computing Equations (10)–(15), the hidden states are updated; calculating loss function and propagating error loss backward using back propagation through time constitute a complete IndRNN training process.
The proposed IndRNN architecture for SOH estimation is illustrated in Figure 11 which consists of input, hidden and output layers. The number of neurons at each layer is configured as 18, 100 and 1 respectively. For the input layer, set of 18 battery features which are extracted from RW cycle and reference discharge cycles represented as Vavg(rwk), Iavg(rwk), Tavg(rwk), Q(rwk), ∆t(rwk), ∆t(rdm), T1(rwk) to T12(rwk). Next, IndRNN recurrent hidden layer node h t ( 1 ) ,   h t ( 2 ) , . h t ( z ) is followed to learn the dependence on the former input where, z denotes the number of neurons on the hidden layer and must be set to 100 prior to training. At the output layer, the output of battery SOH is calculated from the battery capacity using Equation (1) at time step t . In addition, hyperparameters of the IndRNN network initialized for the training process is presented in Table 3. After configuring the network with specified hyperparameters and loss function, the network is trained using Adam optimizer. During the training process, Adam optimizer is capable of reducing the error rate variation between actual and predicted value for every iteration. The process flow diagram of the SOH estimation method based on the IndRNN is shown in Figure 12.

4.3. Performance Evaluation Criteria

To evaluate the performance of the proposed SOH estimation using IndRNN, three performance metric criteria are chosen which include root mean square error (RMSE), mean absolute error (MAE) and maximum error (MAX). Evaluation of RMSE is to check the robustness of the SOH estimation; MAE signifies the accuracy of the SOH estimation and the MAX represents SOH value under the worst-case response of the network.
RMSE = t = 1 k ( y t y t ) 2 n
MAE =   1 k t = 1 k | y t y t |
MAX = max | y t y t |
where, y t and y t are the actual and the estimated SOH values at time step t respectively and k indicates length of RW cycles.

4.4. Experimental Settings

The proposed neural network model is implemented using MATLAB. The proposed SOH estimation approach consists of two phases, training and testing. Among four sets of battery datasets, RW9, RW10 and RW11 are chosen for training while RW12 chosen for testing. All 18 input features extracted from three battery sets are provided as an input to the IndRNN network to establish the relationship with battery capacity. The input vector fed into the IndRNN network is represented as xj. The IndRNN network produces the output as estimated SOH after every reference discharge cycle which is represented as yt = [SOHk]. For every time step t, the state of ht in the IndRNN hidden layer is updated by the present input xj and the previous time step of hidden state ht-1 as per Equation (10). For validation of the estimated SOH, the actual SOH value is calculated using Equation (1). Figure 13 shows the actual SOH values measured from battery cell under three different battery datasets, RW9, RW10, RW11 and RW12. After the training phase, the developed battery model is allowed to predict the SOH of the battery cell RW12 by providing set of input features extracted from -its dataset. Then, performance of the IndRNN is evaluated using Equations (16)–(18).

5. SOH Estimation Results and Discussion

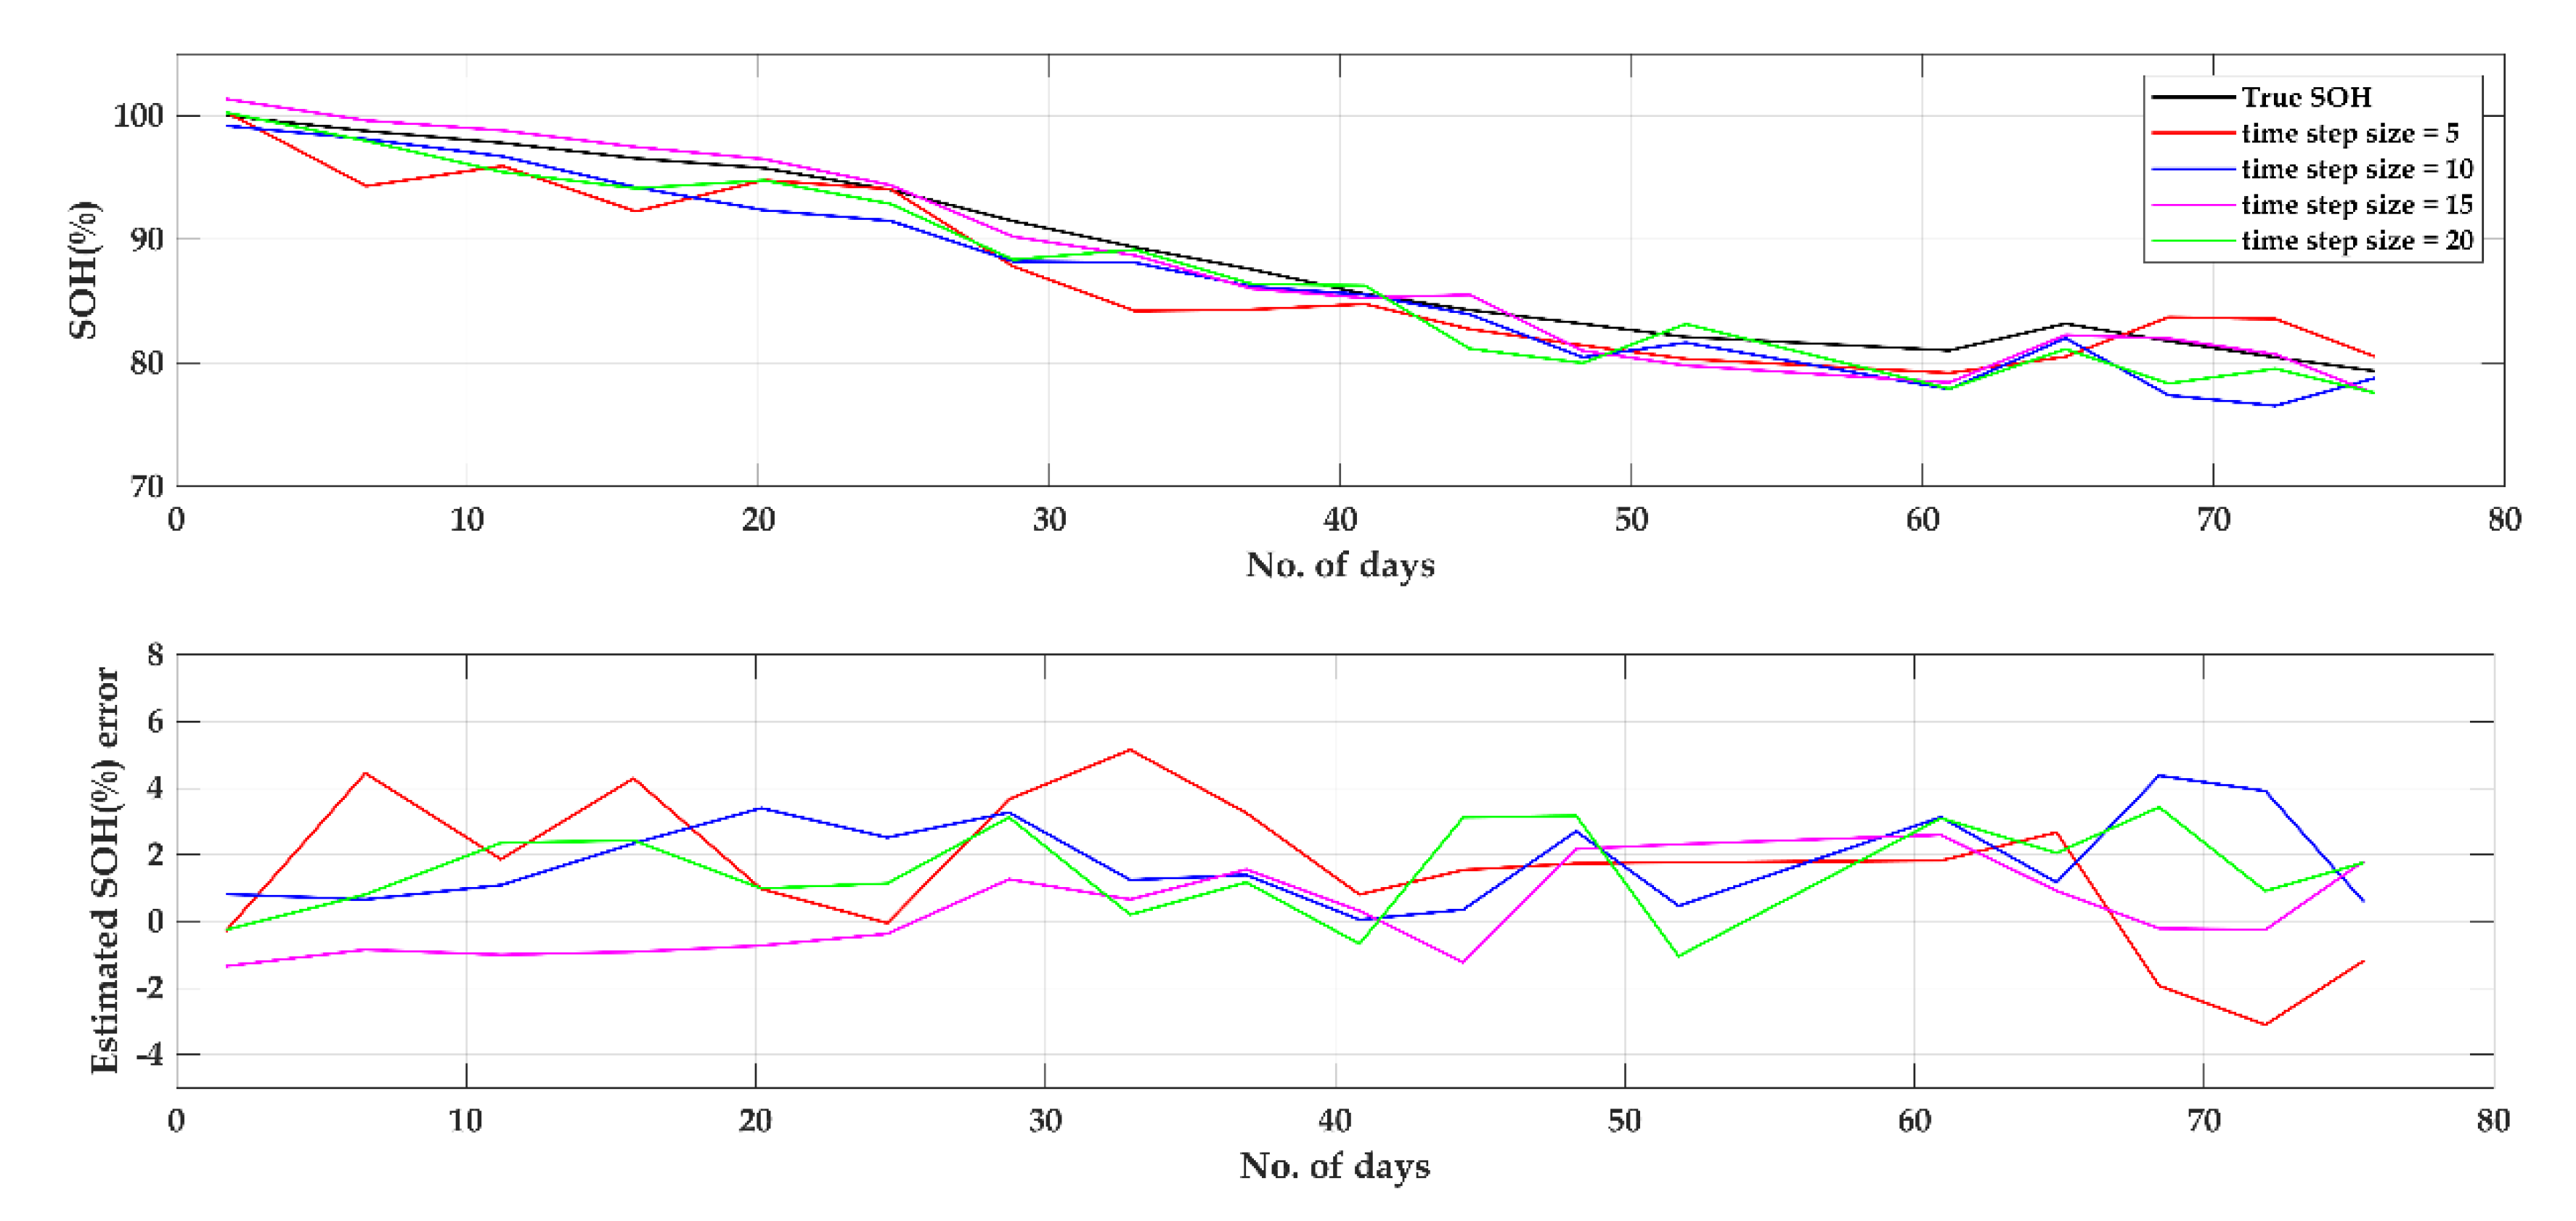
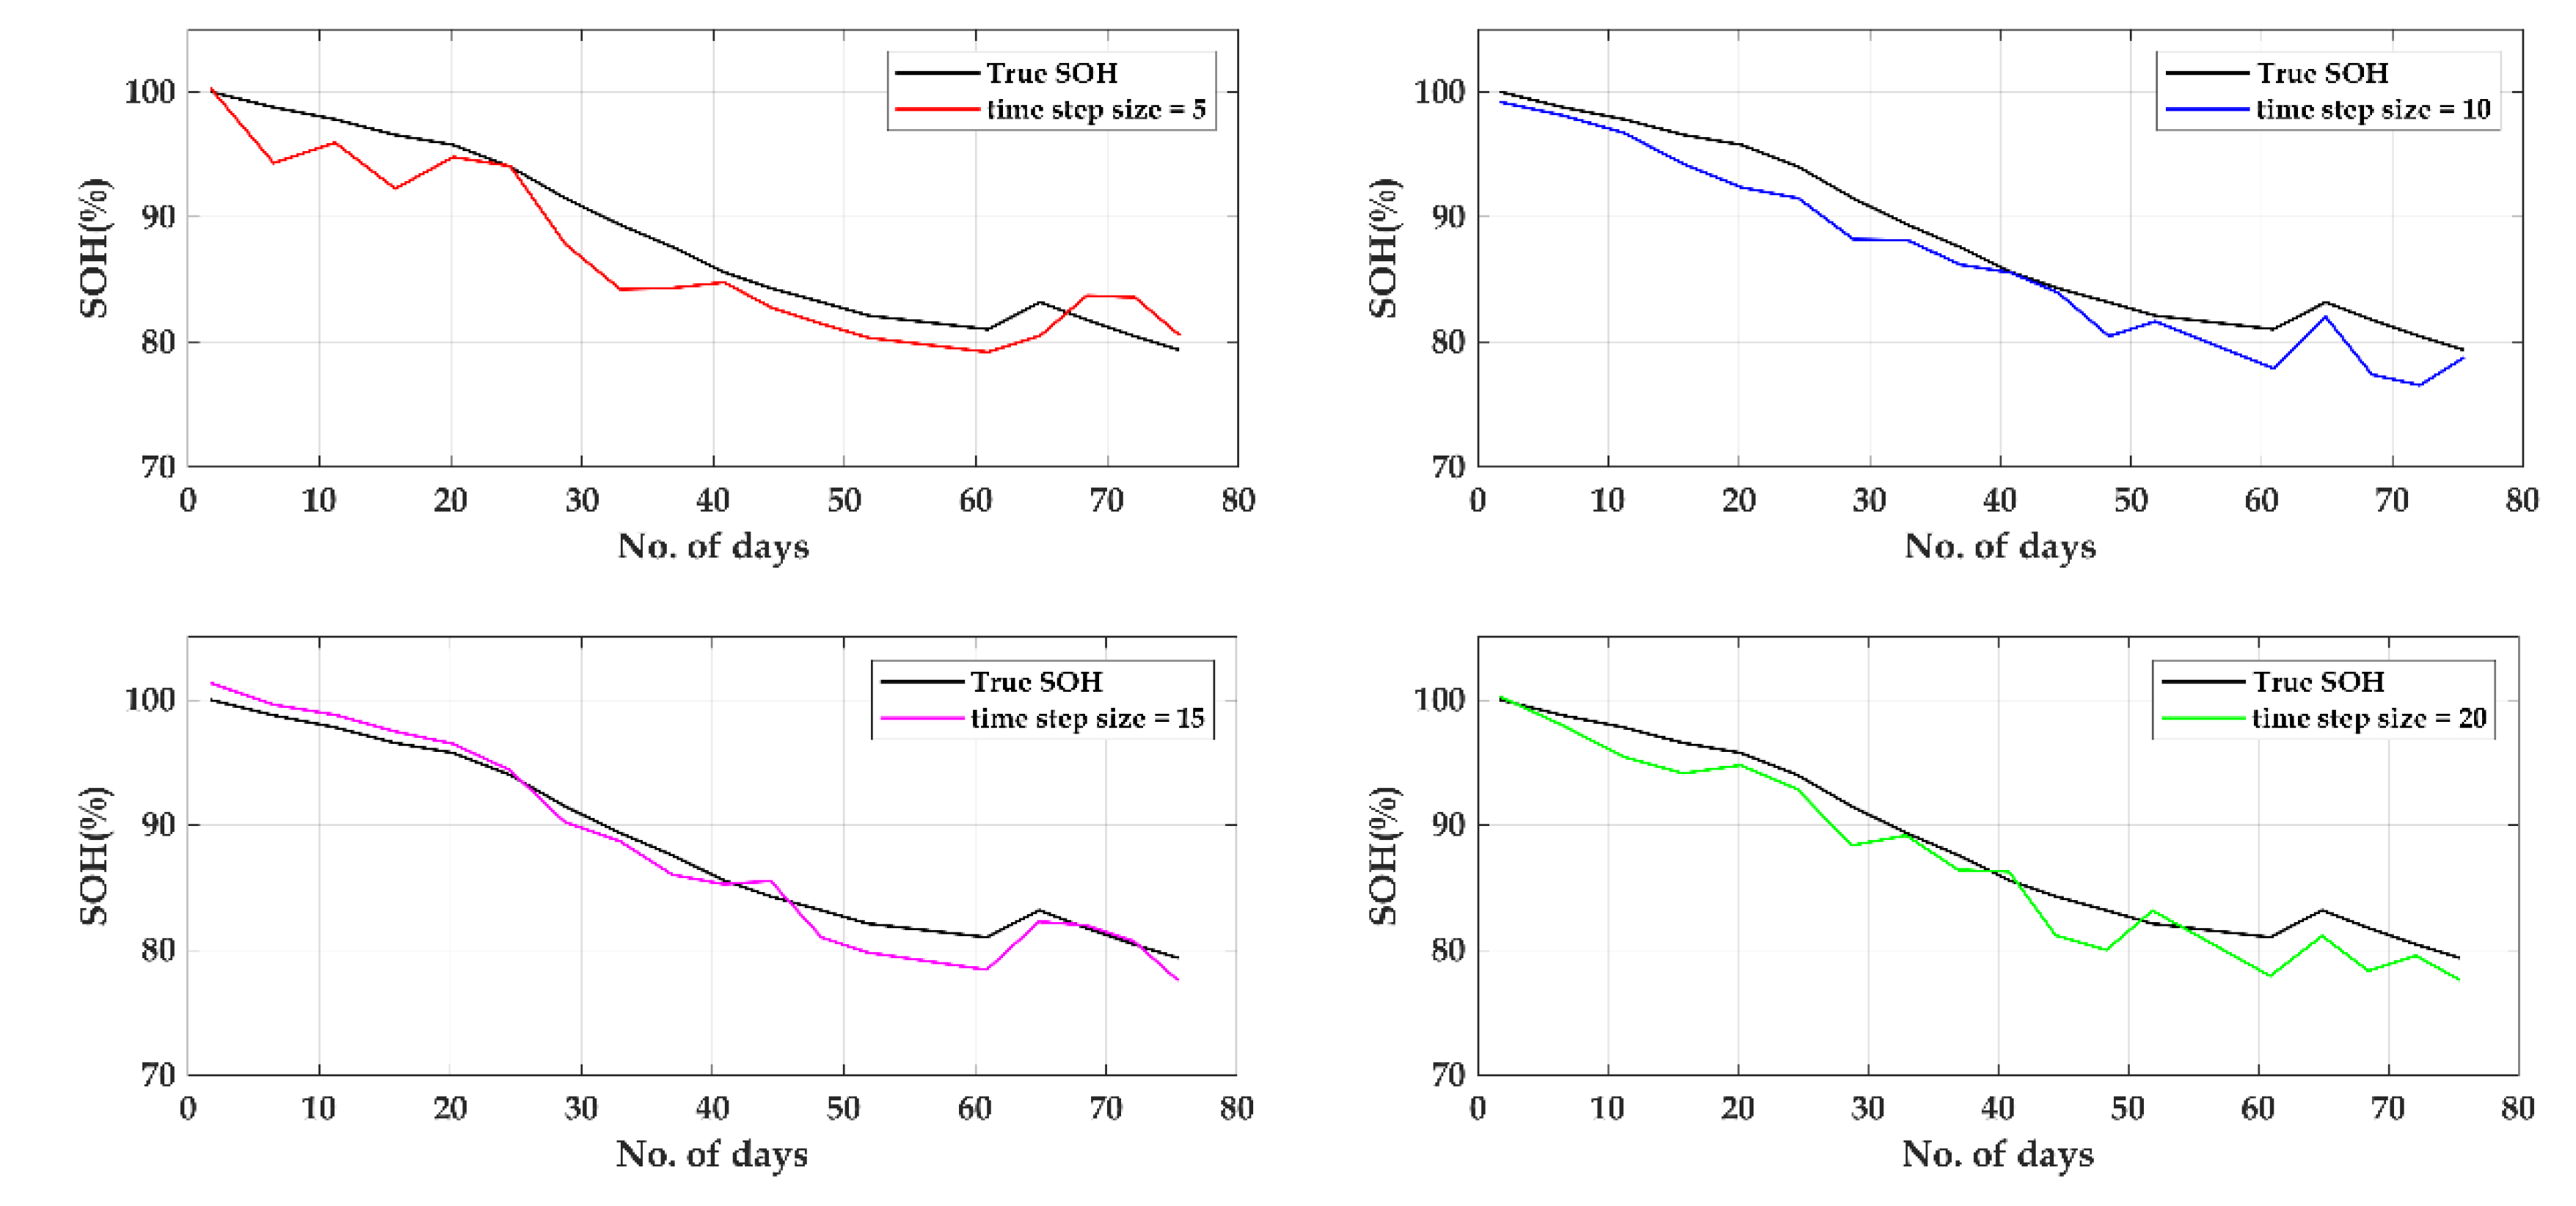
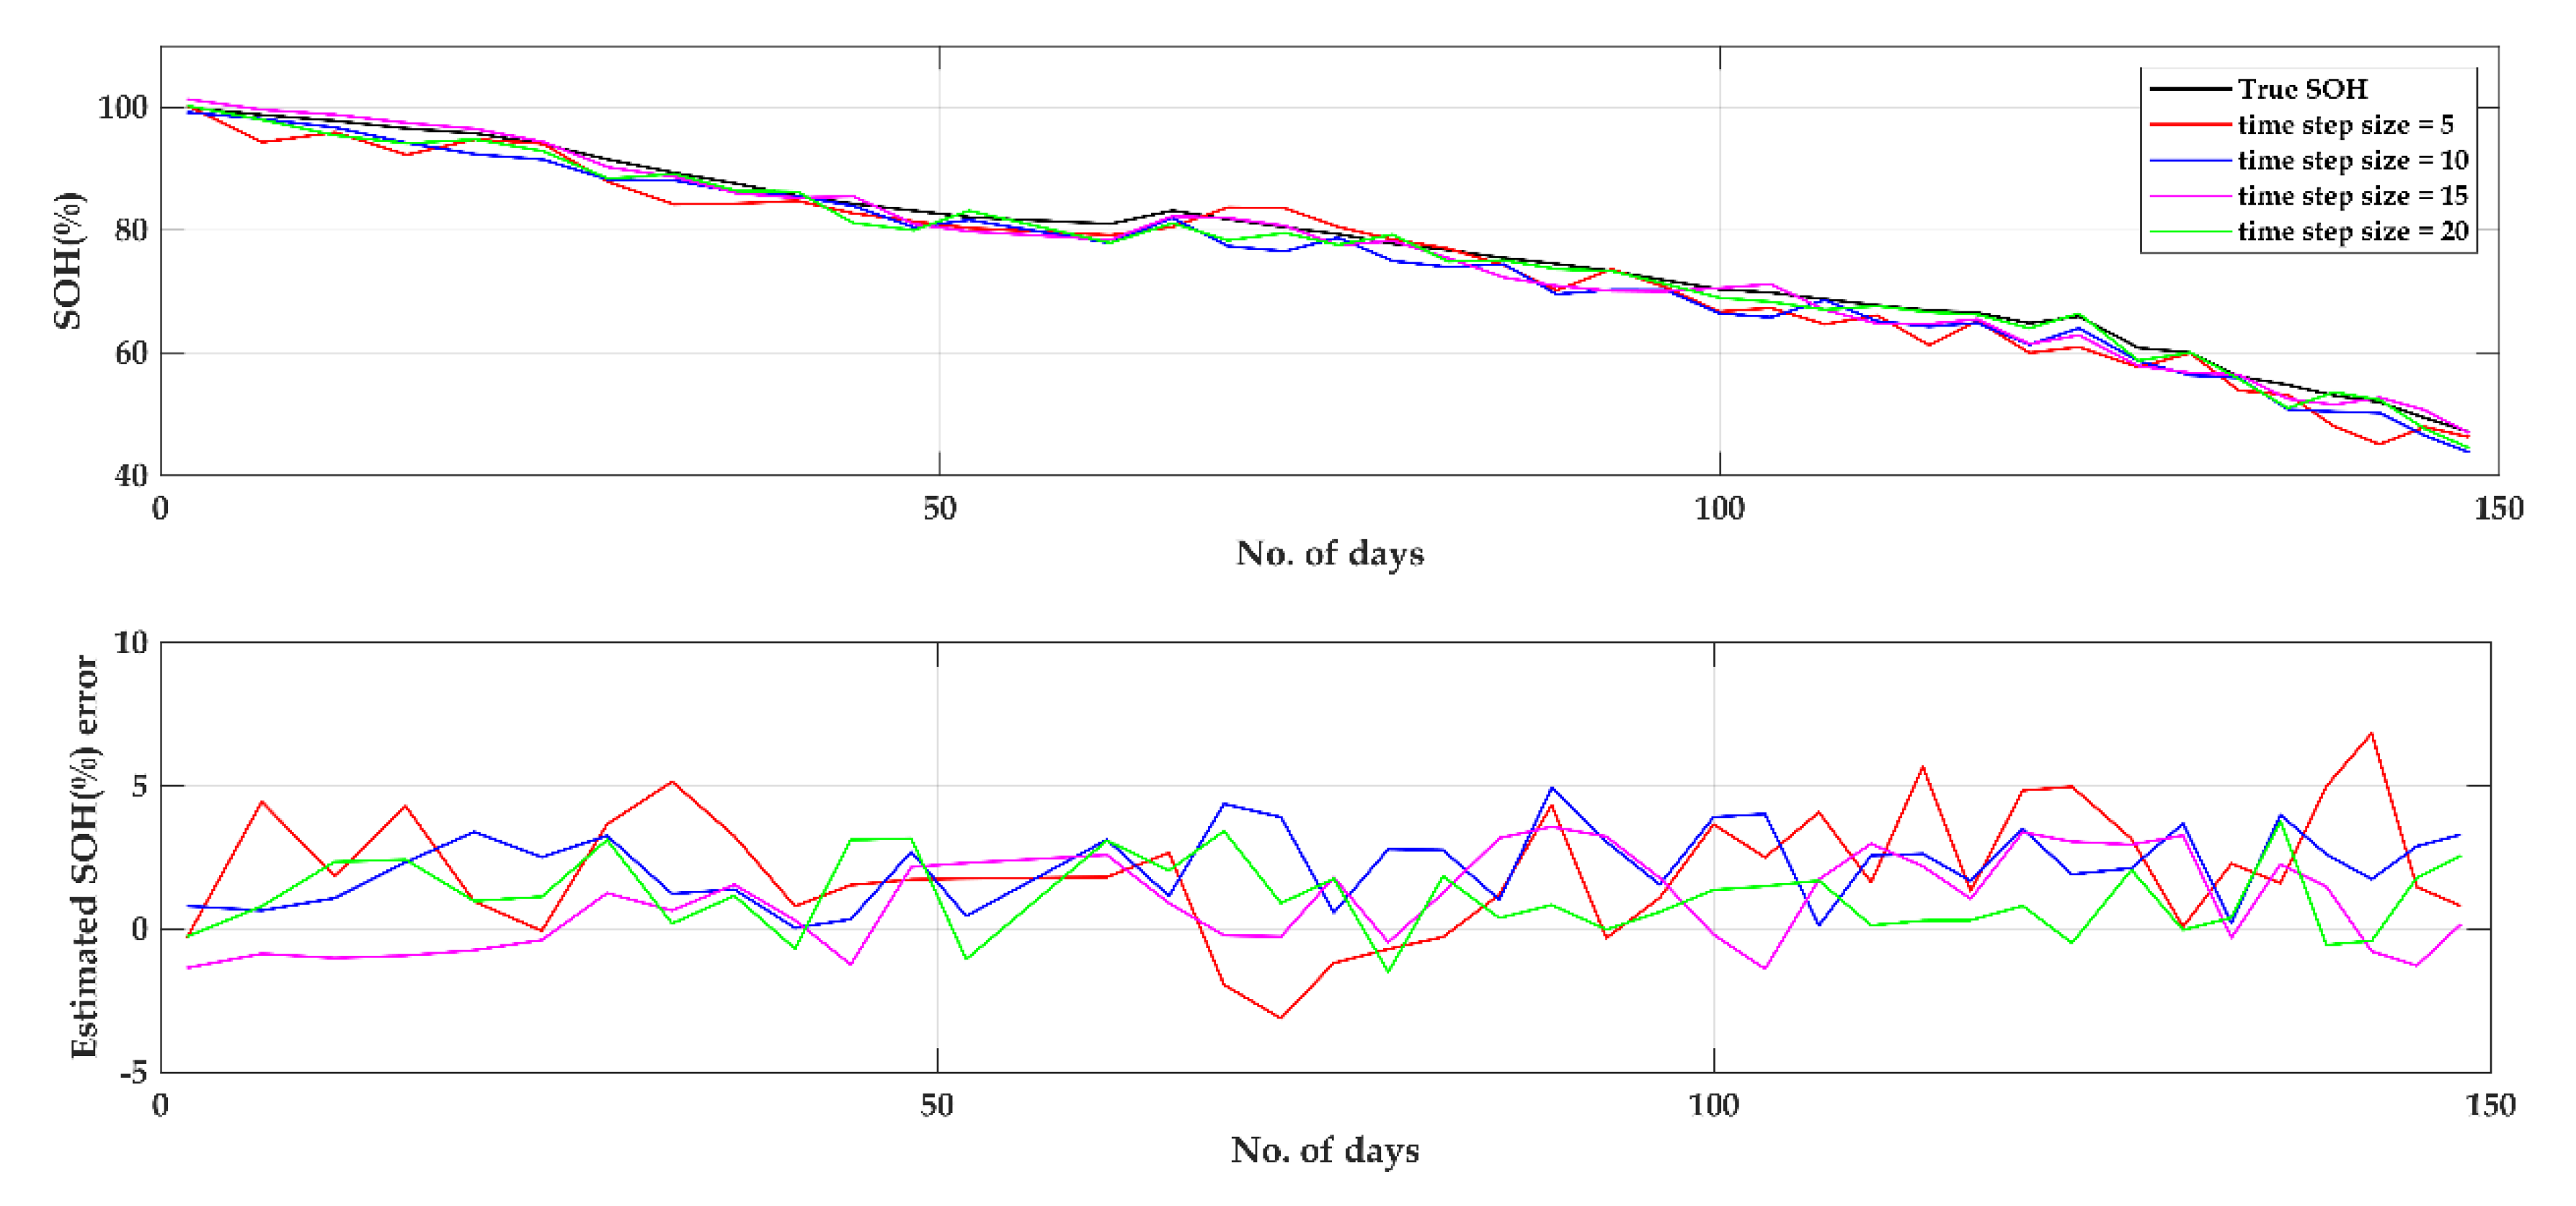
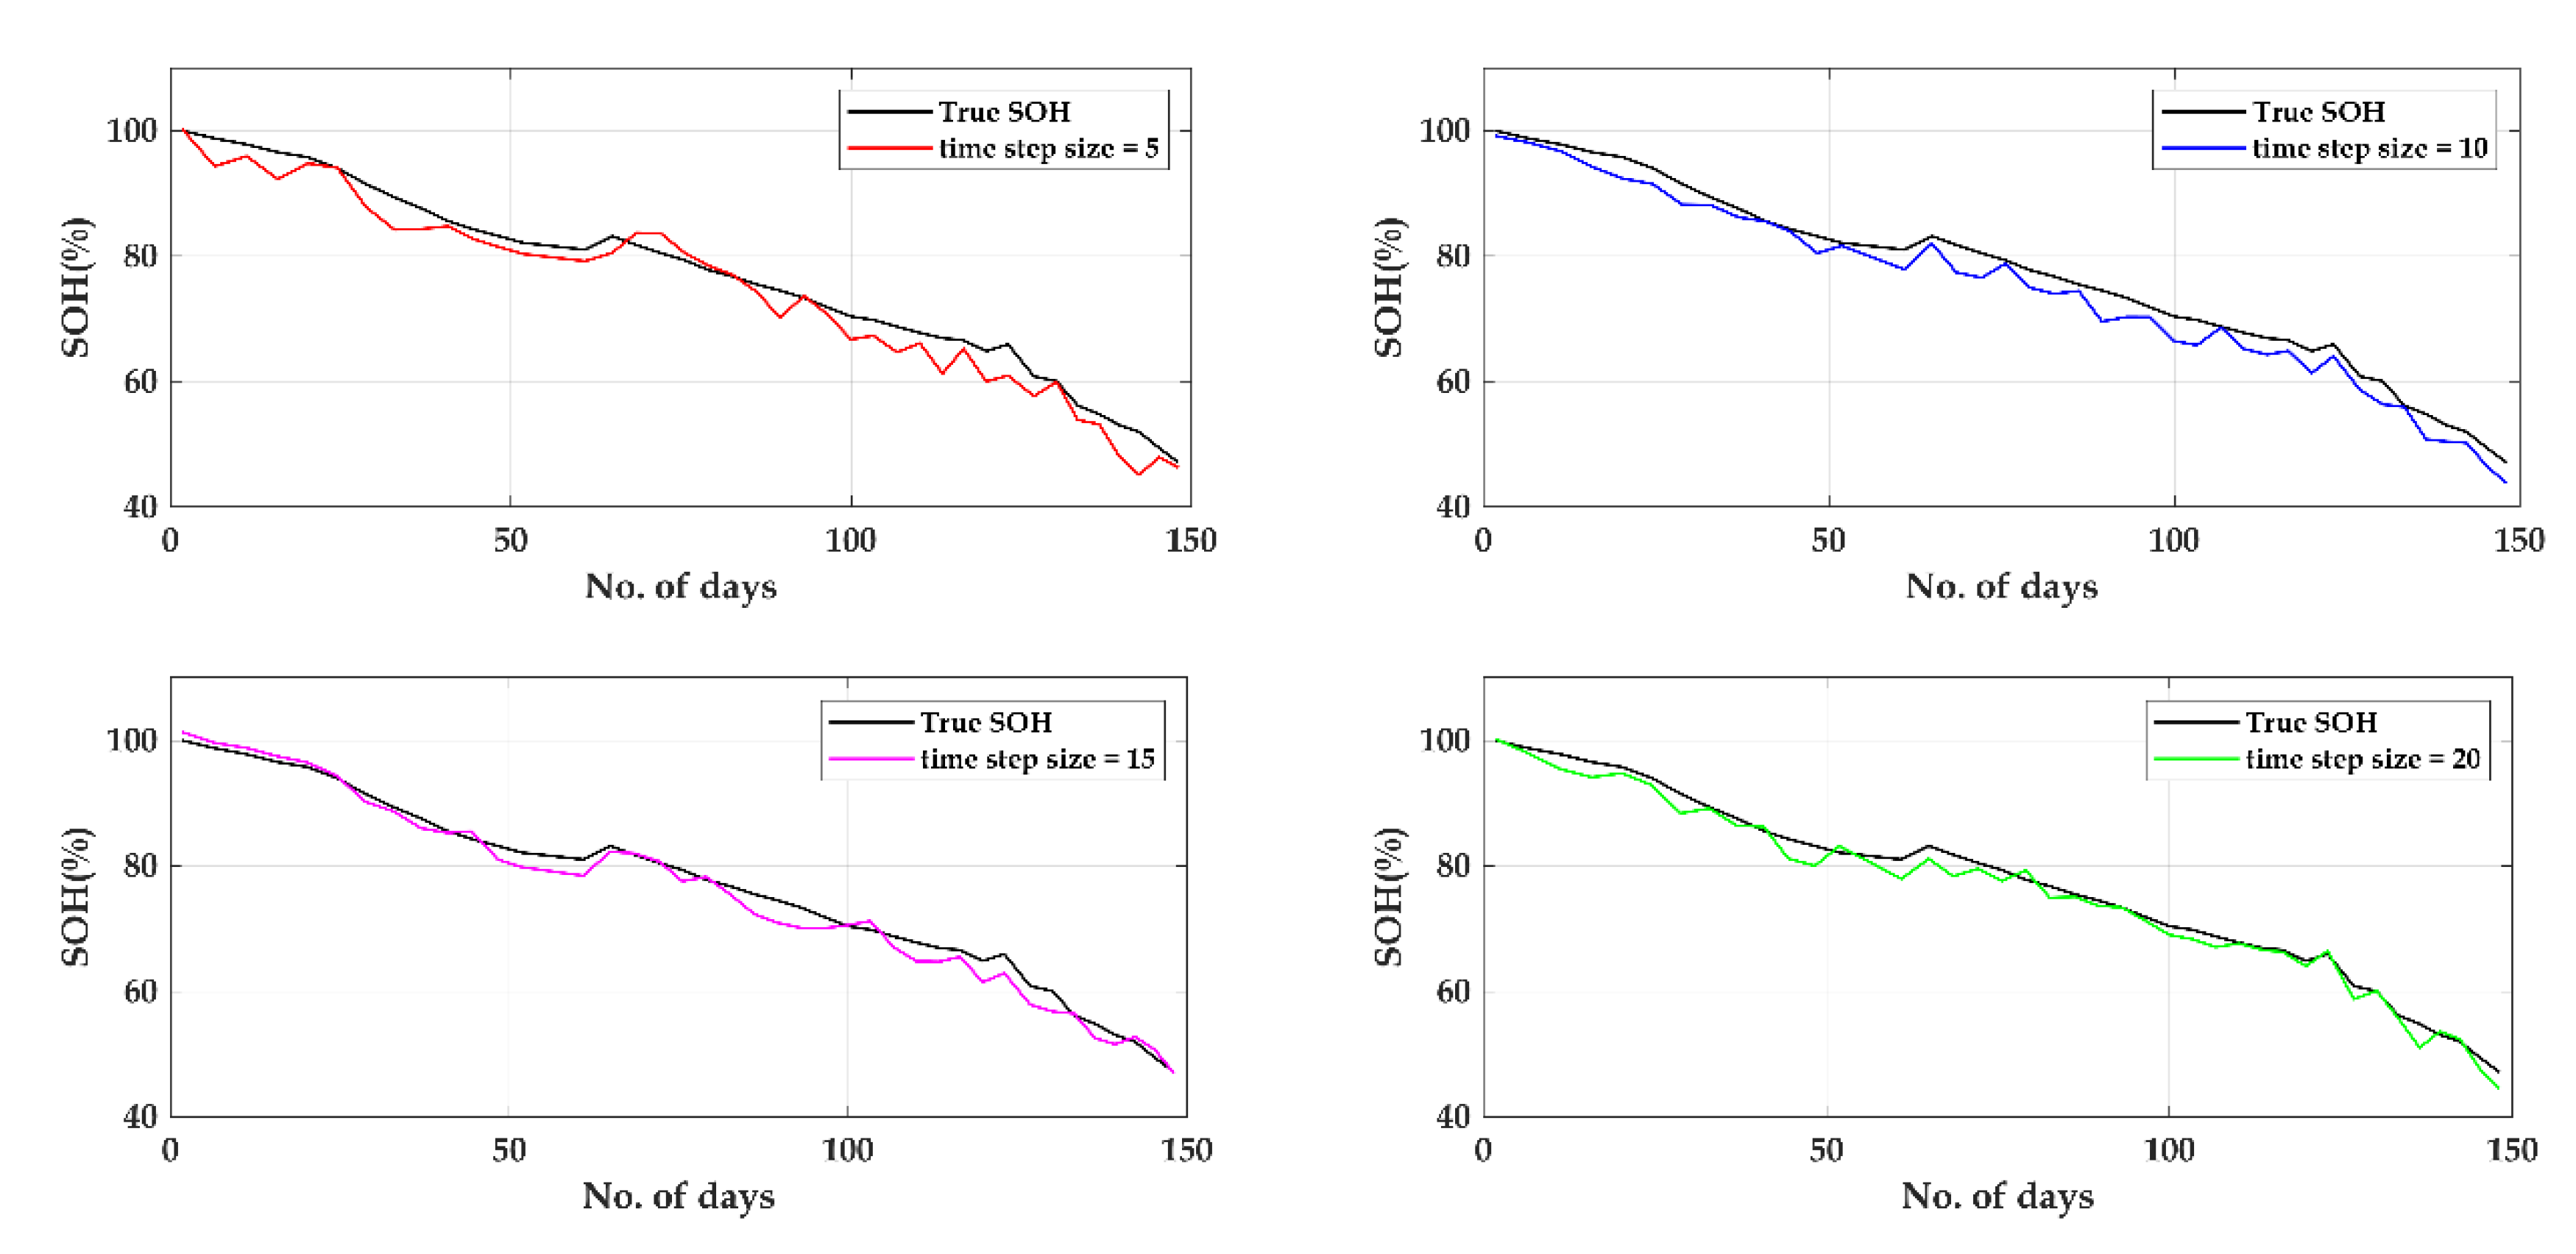
5.1. Effect of Time Step Size on IndRNN for SOH Estimation

For any neural network, the performance of the training model is mostly determined by their hyperparameters such as number of hidden layers, number of neurons in each hidden layer, activation function, optimizer, learning rate and number of training epochs. These hyperparameters must be defined prior to initiating the training process. However, for IndRNN the performance of the model under the training process is strongly depends on size of the time step. The finite value of time step in IndRNN describes the depth in time of the historical inputs that are taken into account for updating hidden layer neurons to produce the current output. The performance of the IndRNN is better for longer duration. However, for longer duration the network encounters high computational cost and training time.
The main objective of this experiment is to apply and analyze the performance of the IndRNN network for SOH estimation under different time-step sizes. The performance evaluation criteria such as RMSE, MAE and MAX considered for identification of an appropriate time step size. All hyperparameters associated with the proposed IndRNN network are listed in Table 3 and all parameters are fixed except the size of the time steps which are modified as 5, 10, 15 and 20. For every time step sizes, SOH estimation was carried out and compared with true SOH values. The purpose of choosing RW12 for the testing phase is that it demonstrates wilder SOH variation compared to other battery datasets, which represents the dynamic usage of EV. After training the model, an input vector is created with the help of 18 input features that represent the battery degradation process extracted from each RW cycle and reference discharge cycle of the RW12 dataset. Then applied as input to the trained IndRNN model for predicting the battery SOH value. There are 40 reference discharge cycles presented in the RW12 dataset and for each cycle SOH value will be predicted by IndRNN model and finally compared with true SOH value to indicate the estimation error deviation.
Figure 14 presents the results of the IndRNN network model for SOH estimation under each time step size along with true SOH value obtained from battery dataset. As discussed earlier, true SOH value is calculated using Equations (1) and (2). The results from Figure 14 show that the IndRNN model make its best effort to track and predict near true SOH values for all time step sizes. This is primarily due to the advantage of IndRNN to dissolve gradient problem and enable the network to learn long-term dependencies. The subplot of Figure 14 shows the distribution of the estimated SOH error produced between true SOH values and predicted SOH values using IndRNN at different time step sizes. In addition, it can be concluded that a time step size of 5 shows the least performance among all time step sizes and generate a MAX SOH error of 6.8403.
Figure 15 represents the individual time step response vs. true SOH value of the RW12 battery dataset. Although the best performance of the IndRNN is achieved at step size 20, a further increase in time step size leads to slow learning rate. This is due to less RMSE error reduction when compared with time step 15. As shown in Figure 15, all responses of different time steps are just below the true SOH response curve. This is mainly because of the battery datasets used for training the IndRNN network model. As shown in Figure 15, the SOH curve of battery RW12 completely deviates from other battery sets RW9, RW10 and RW11 SOH curves. This can be further confirmed by Figure 14 error subplot, which shows SOH error is mainly distributed towards positive values and much less distribution on negative values.
Table 4 highlights the quantitative results of IndRNN based SOH estimation with RMSE, MAE and MAX values under different time-step sizes for the entire lifetime of the battery as prescribed in the battery dataset. From the results obtained, it is evident that performance of the IndRNN model is better as indicated by lower RMSE, MAE and MAX values as time-step size increases except for MAX of time step size 20. Since, the network is exposed to a larger time step it can easily learn long-term dependencies of the historical battery’s SOH data than smaller step size. However, irregularities are encountered in IndRNN estimation performance as time-step size increases. In particular, at time step sizes 5, 10 and 15 all performance metric errors decrease in a good percentage during consecutive time steps. However, at time step 20, reduction in the error percentage is not satisfactory when compared with other time step’s error rate reduction. This can be confirmed by computing the percentage of RMSE and MAE error reduction rate for each time step as shown in Table 4. While moving from time step size 5 to 20, the IndRNN model offers RMSE and MAE error reduction percentage as 13.277 and 8, 28 and 30, 7.36 and 11.78, respectively, under consecutive time step size. Likewise, MAX error of SOH estimated under different time cycle presented with its lowest error percentage of 3.5786 at time step 20. To make the trade-off between time step size and performance of the network, an optimal value of time step size 15 is chosen for effective training of IndRNN networks and the same was used to carry out remaining experiments in this research work.

5.2. Effect of Time-Step Size on IndRNN for SOH Estimation of up to 80% of SOH

As defined by battery manufacturers, if any battery capacity drops below 80% (SOH) from its rated capacity then a battery reaches its end of life (EOL) and it is not useful for any applications. This is because the performance of a battery starts to decrease significantly at faster rate below 80%. Therefore, it is essential to perform an experiment to analyze the effect of time steps on IndRNN for SOH estimation upto 80% of SOH. The capacity of a battery considered for this research work is 2.1 Ah and its end of life i.e., 80% of its rated capacity is 1.68 Ah. In the given randomized battery usage dataset, each battery is allowed to operate even below 80% of its rated capacity (1.68 Ah) to understand the behavior of the batteries in detail. In the previous experiment, different time steps for IndRNN are chosen and applied to entire battery lifetime (ranges between 30% to 50% SOH) which involves 40 reference discharge cycles to measure battery capacity. In contrast, this experiment analyzes the results of IndRNN for different time-step sizes up to SOH of 80% which involves with 18 reference discharge cycle to measure battery capacity (approximately 75 days).
This experiment tries to illustrate the practical use in which a battery model is developed by utilizing battery datasets with its entire lifetime (ranges between 30% to 50%) then the model is allowed to predict the battery SOH level upto 80%. The rationale behind considering the entire life time of a battery for training is to effectively capture the dynamic behavior of a battery which will improve the SOH estimation accuracy. Table 5 highlights the SOH estimation results of the IndRNN under different sizes of time steps up to 80% of a battery SOH. Similar to previous experiments, the IndRNN SOH estimation delivers better performance on a time-step size of 15 compared to other time step sizes. One again, it is proven that time step size of 15 is an appropriate choice for the proposed SOH estimation approach. At time step size 15, the IndRNN produces very low RMSE of 1.3369%, MAE of 1.1403% and MAX error of 2.5943% compared with other existing approaches which utilize same battery dataset. With MAX error of 2.5953% at time step 15, at any point of time during SOH estimation the deviation from true SOH never exceeds 2.593% which shows the efficiency of the IndRNN. While comparing results with previous experiments, the performance of this experiment is enhanced with much less RMSE, MAE and MAX error for every time step. The main reason is that battery starts to demonstrates high dynamic behavior only after 80% of SOH.
The SOH estimation results of IndRNN with estimated error percentage for different time-step sizes upto 80% of SOH is shown in Figure 16. This result shows that when battery approaches 80% of SOH, the battery exhibits irregularities which are effectively captured by IndRNN at time step 15. Figure 17 shows SOH estimation results of IndRNN for individual time step size vs. true SOH upto 80% of SOH. It is clearly evident that, performance at step size 15 is better than 20 because time step 15 can effectively capture dynamic nature of battery from the beginning whereas large variation is displayed at time step 20. For any EV application, allowable error range of SOH is ±5%, whereas for IndRNN based SOH estimation at time step size 15 the maximum error obtained is well below the prescribed as 2.5943% which is ideal for real world EV SOH estimations.

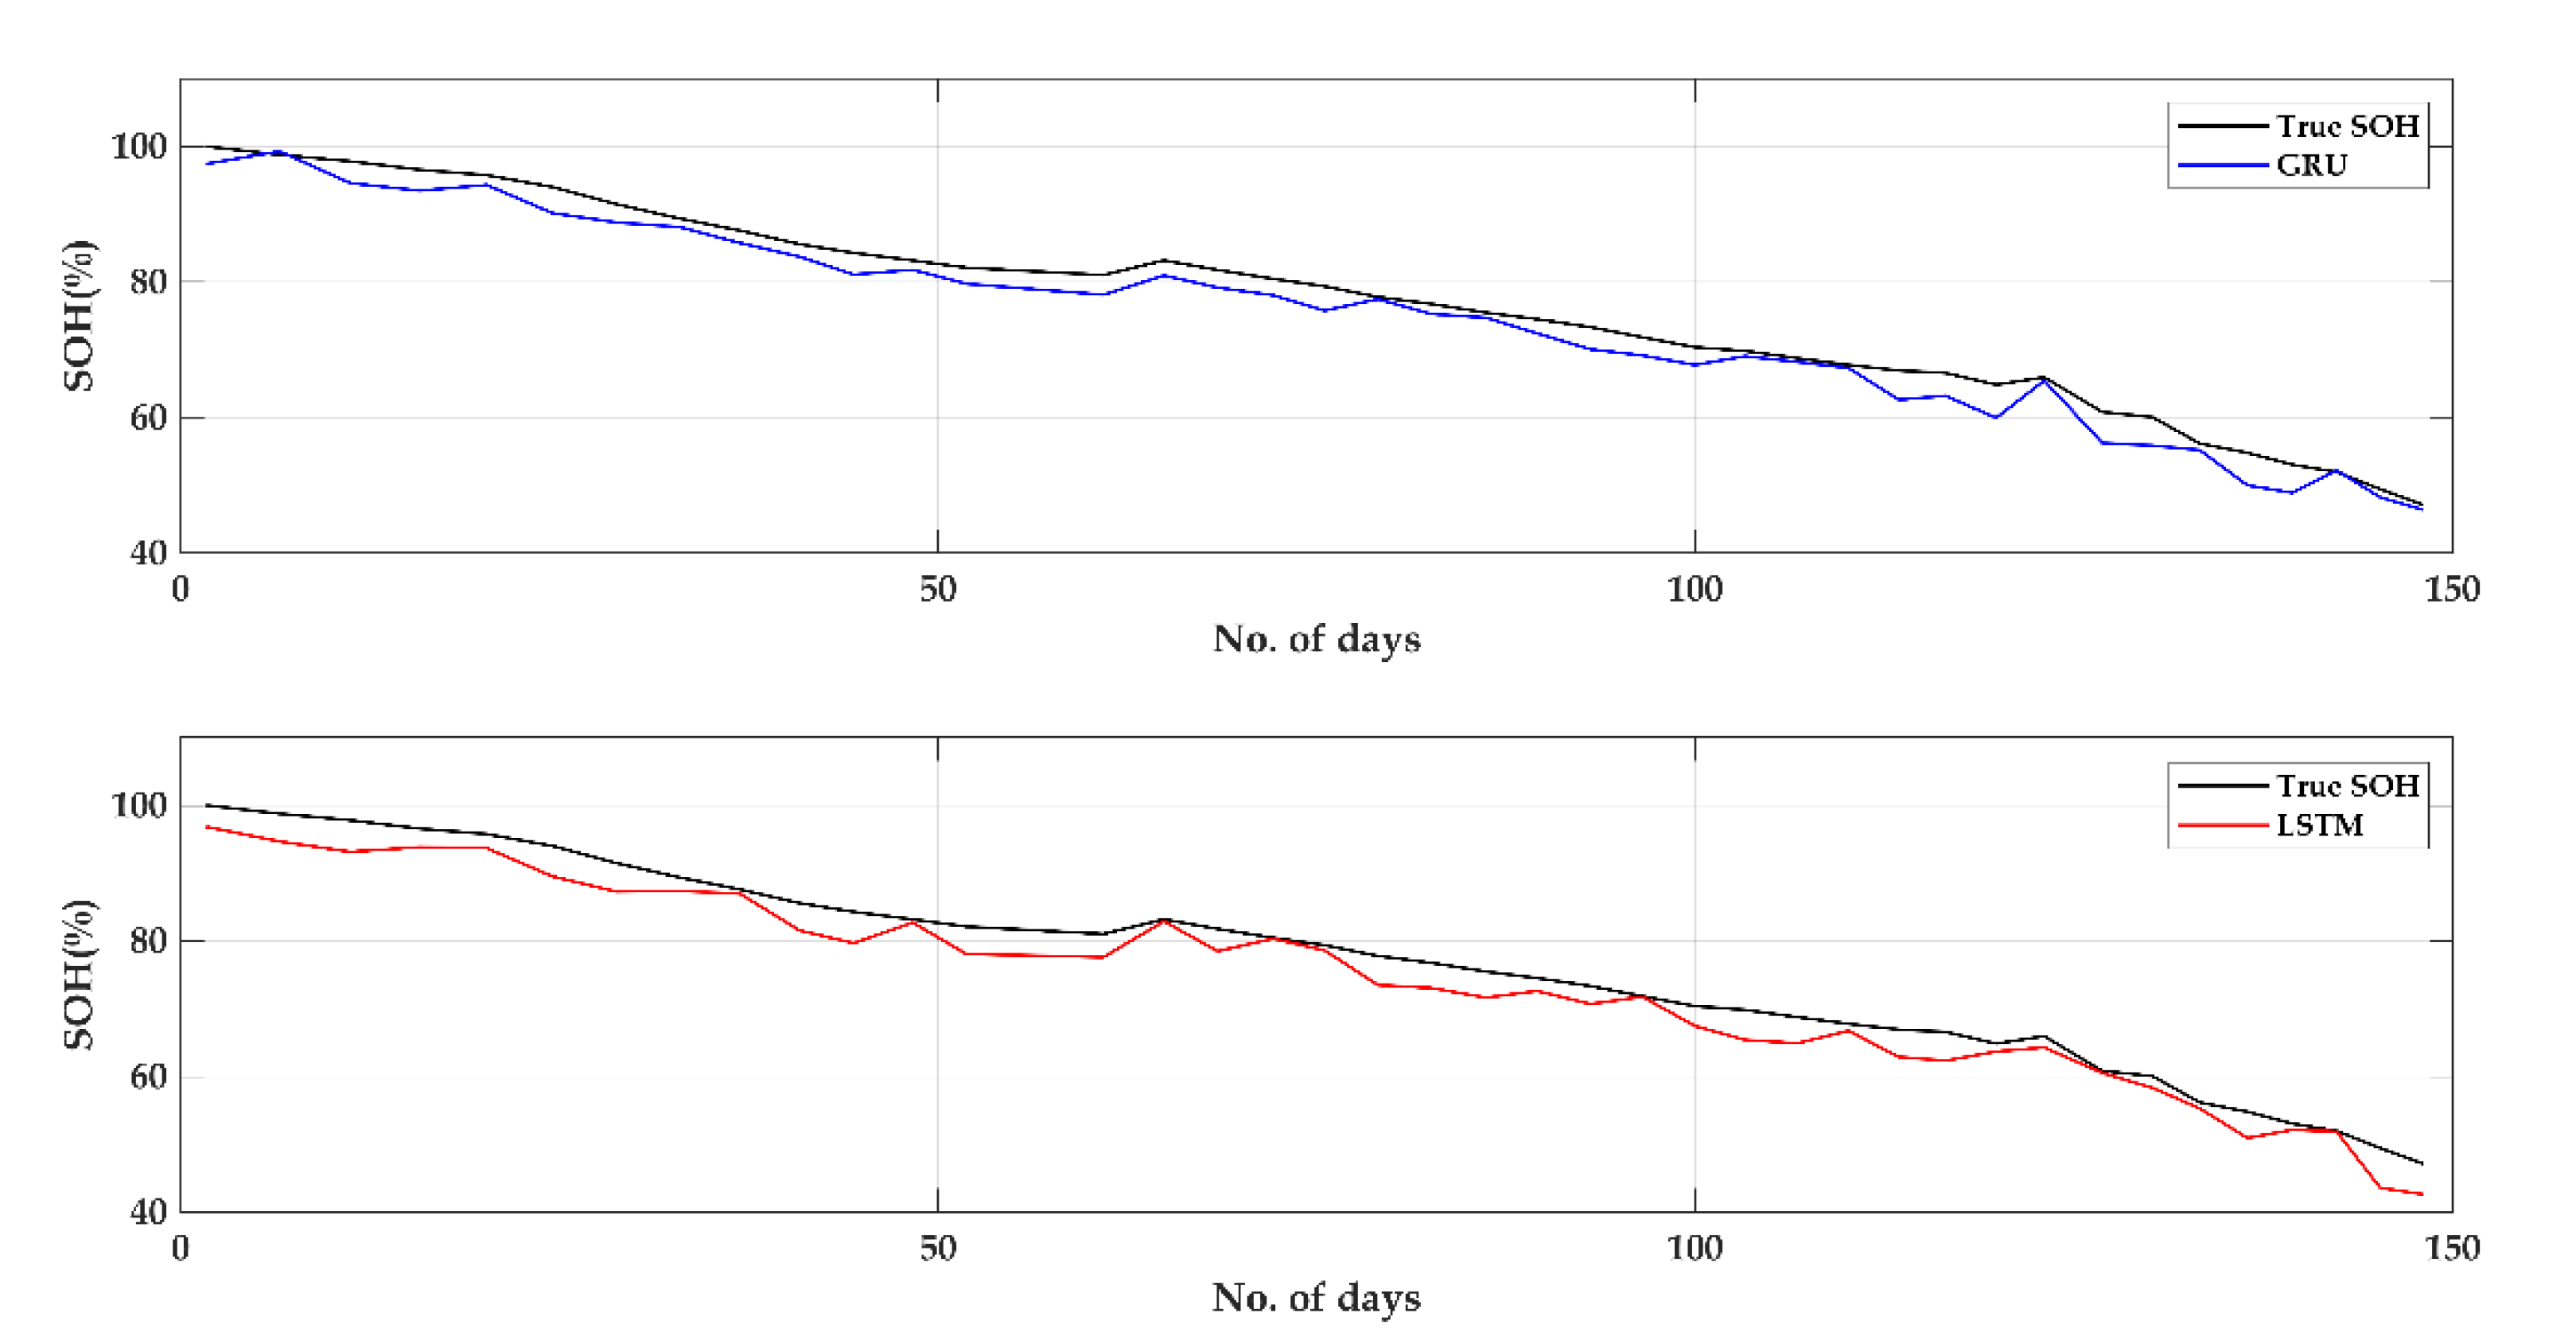
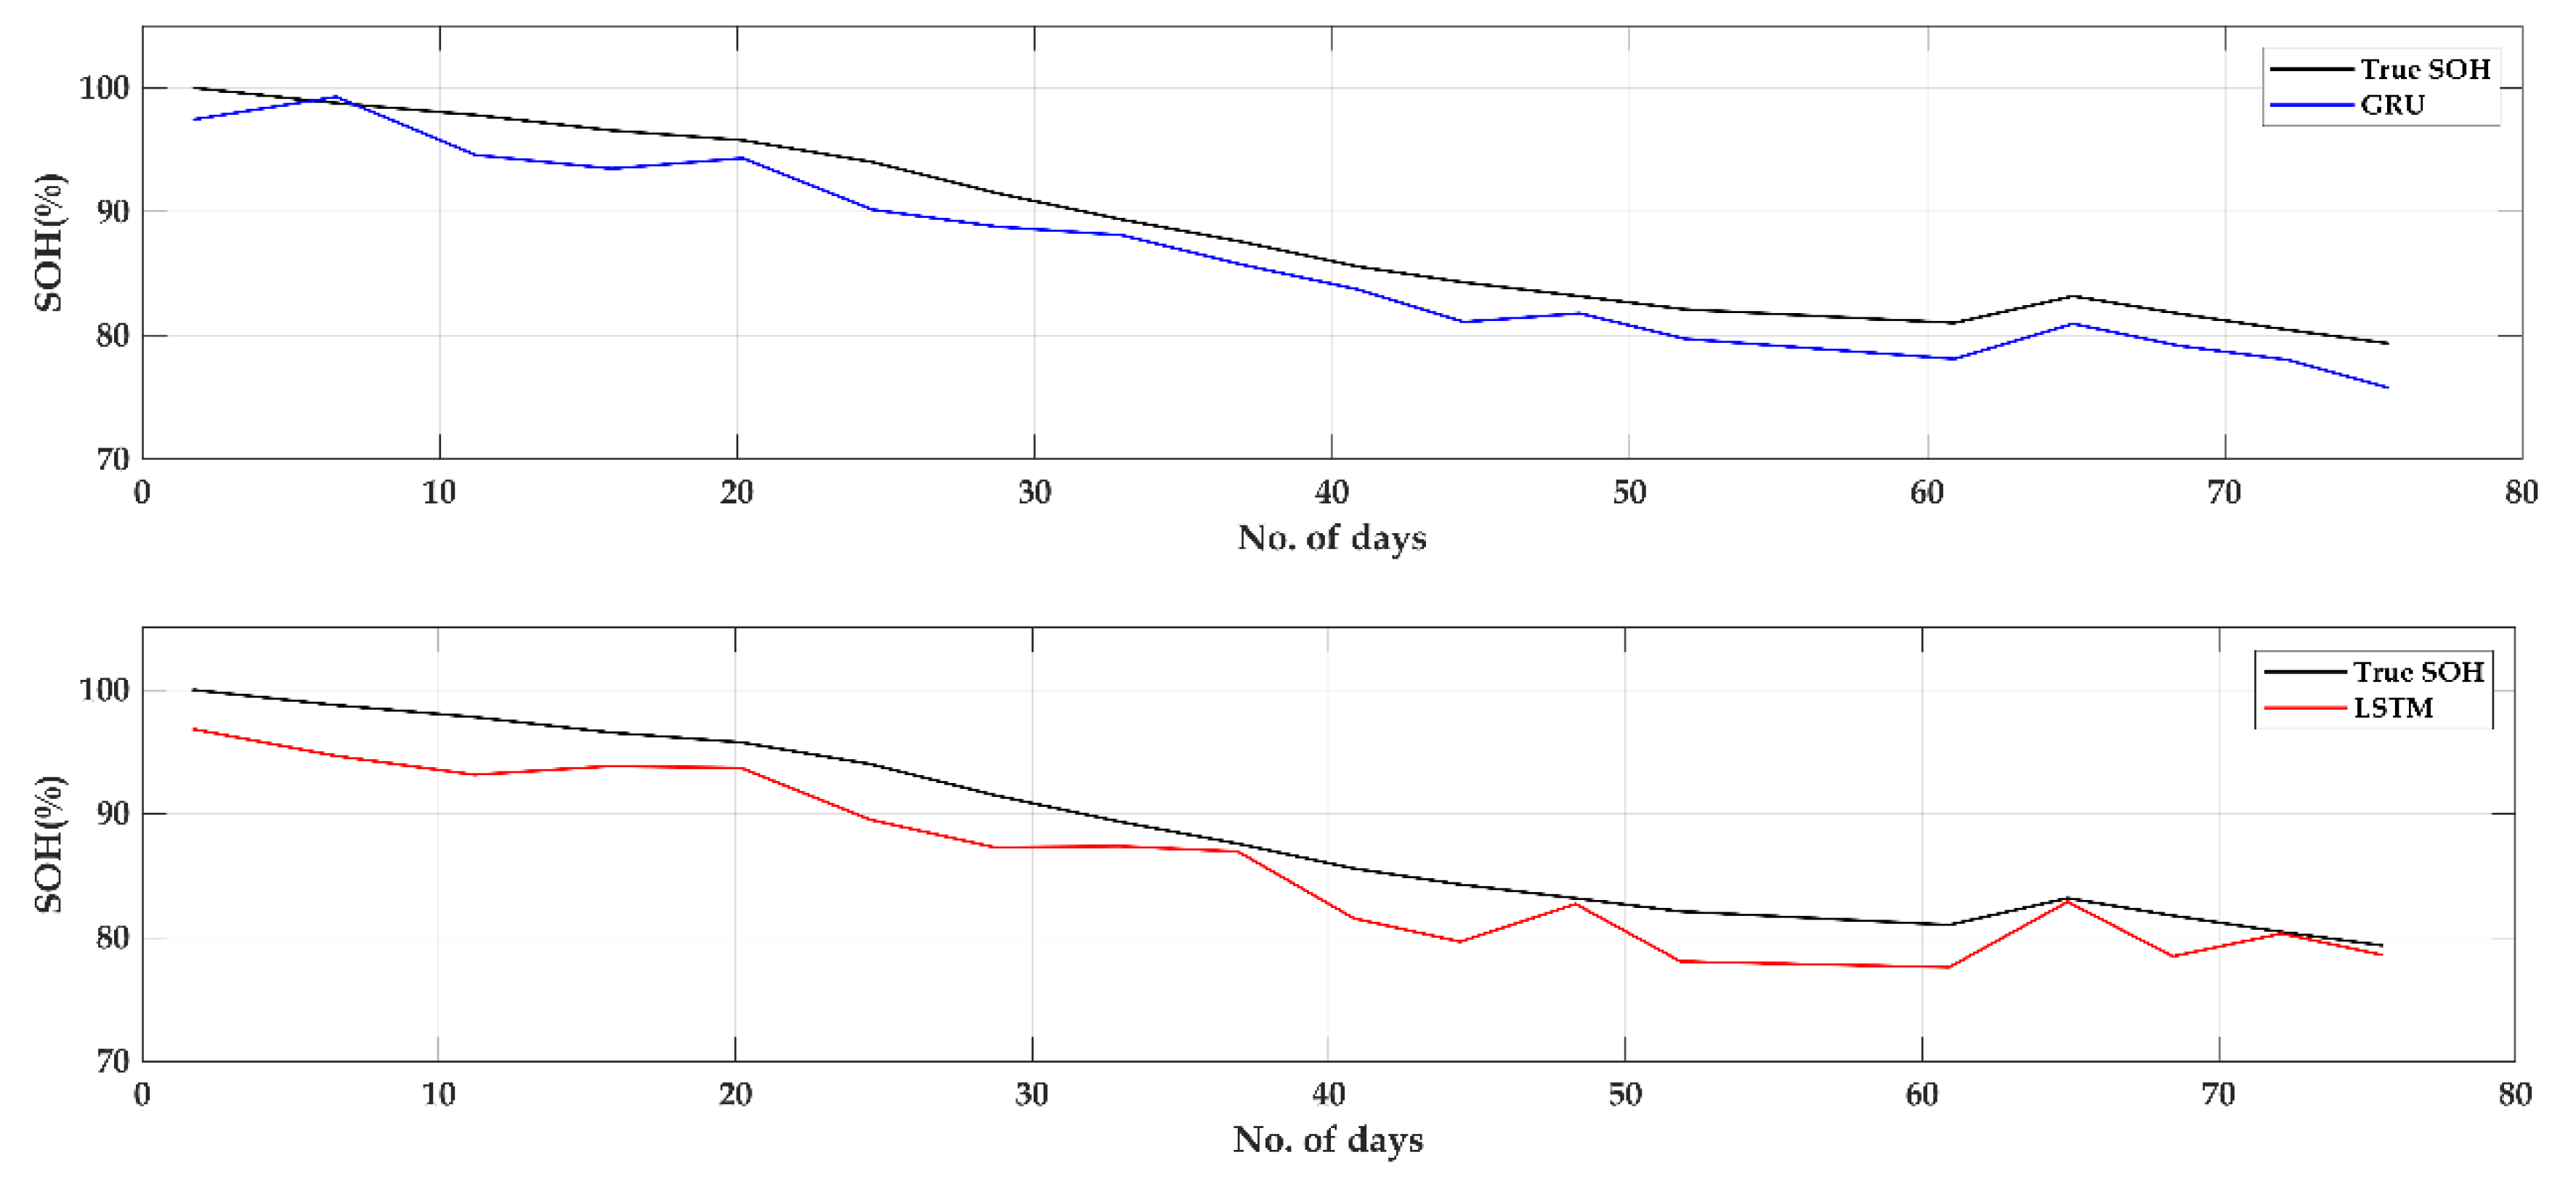
5.3. SOH Estimation Results Comparison between IndRNN, Gated Recurrent Unit (GRU) and Long Short-Term Memory (LSTM)

To showcase the effectiveness of the proposed IndRNN based SOH estimation, results obtained at time step size 15 are considered and compared with similar enhanced RNN architectures such as GRU and LSTM. For unbiased comparison, the same network architecture and hyperparameters listed in Table 3 utilized to train IndRNN were employed for training the GRU and LSTM network with time-step size 15. Similar to the first experiment, this also performs the analysis of SOH estimation considering the entire lifetime of a battery as per the given dataset. Table 6 indicates the result of performance evaluation criteria RMSE, MAE and MAX for different RNN architectures such as IndRNN, GRU and LSTM. Once again the IndRNN network showcased its capability by outperforming both GRU and LSTM under all aspect of performance evaluation metrics with RMSE of 1.8742%, MAE of 1.5639% and MAX of 3.5786% respectively. From the results attained, it can be concluded that IndRNN architecture is able to capture long-term dependencies effectively with time series data. Whereas, GRU and LSTM have long-term dependencies only to a certain extent and unable to resolve for large time step due to the vanishing gradient and exploding gradient problem.
Figure 18 shows SOH estimation results using IndRNN, GRU and LSTM with estimated error percentage. While comparing IndRNN, GRU and LSTM SOH estimation curves, many variations are displayed by LSTM than others. In addition, it generates MAX error of 5.8633% which is not acceptable for an EV’s SOH. Meanwhile, GRU performs better than LSTM in all aspects of evaluation metrics with RMSE of 2.6678%, MAE of 2.2979% and MAX error of 4.8978%.
Figure 19 represents SOH estimation results of true SOH against GRU and LSTM SOH estimation. It can be concluded that, although LSTM delivers least performance compared to GRU, LSTM delivers better perform as time increases. This can be confirmed from the 100th day to the 147th day where LSTM shows less variation with respect to true SOH compared to GRU. This is due to the characteristic of LSTM which take longer time to learn a non-linear battery pattern.

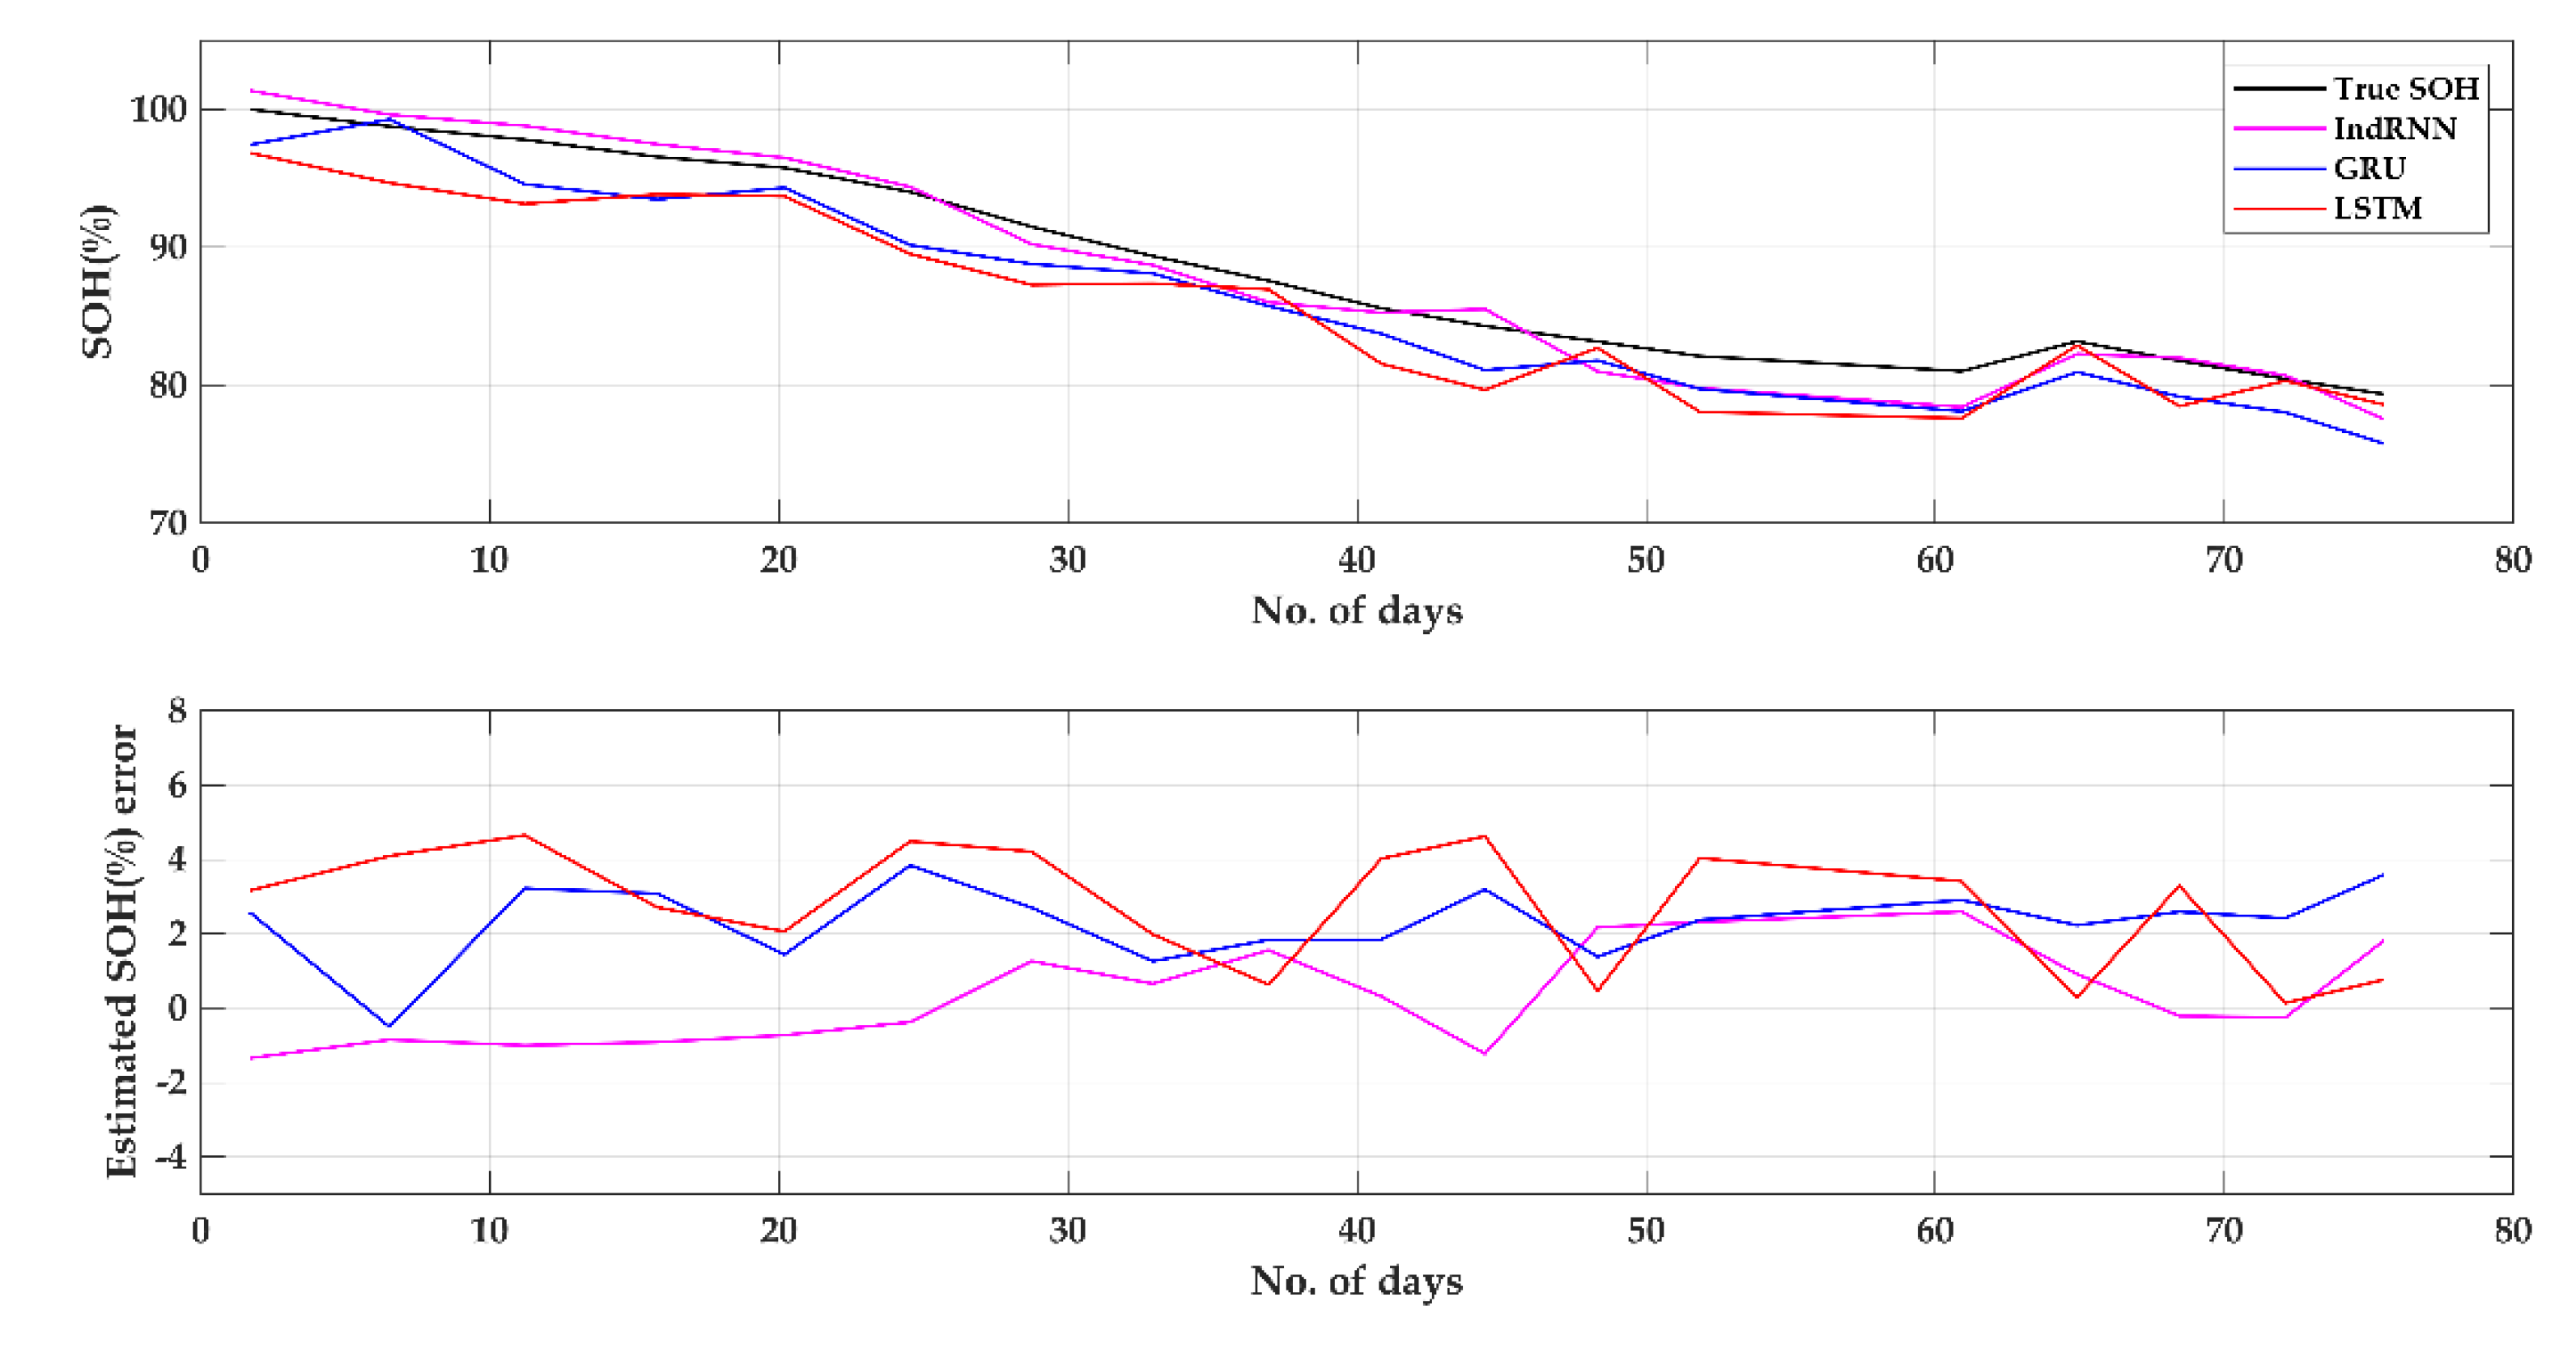
5.4. SOH Estimation Results Comparison Between IndRNN, GRU and LSTM up to 80% of SOH

To validate the competency of the proposed IndRNN based SOH estimation approach compared with the GRU and LSTM models under a real-world EV scenario, SOH estimation needs to be carried out only up to 80%. To realize this real-world scenario an experiment is carried out as described in Section 5.2 for both GRU and LSTM with the same hyperparameters mentioned in Table 3 with time-step size 15. Table 7 presents the SOH estimation results of the proposed IndRNN, GRU and LSTM network models upto 80% of a battery SOH. Once again IndRNN confirms its learning ability towards capturing the battery dynamics compared with others by producing less error percentage. In addition to that, all mentioned model outperforms their own performance demonstrated in previous experiment described in Section 5.3. The main reason for such a performance improvement is due to the fact that battery starts to exhibits its non-uniform behavior just after 80% of SOH.
Figure 20 represents the SOH estimation response of different RNN architectures IndRNN, GRU, LSTM compared with true SOH values. The estimated error subplot indicates error deviation for GRU and LSTM are high during initial days, especially upto 20 days, whereas IndRNN showcases its learning ability by generating less error from the beginning stage. However, all networks struggled to behave efficiently while battery SOH is nearing to 80% as shown from the 60th day to 75th day of the estimated SOH error subplot.
Figure 21 shows SOH estimation results of GRU and LSTM compared with true SOH values upto 80% of SOH condition. Comparing the ability of capturing the battery dynamics, the LSTM network struggle to predict the correct SOH all the time, whereas GRU was able to predict near true SOH value all the time with constant error rate.

6. Conclusions

This research work proposed an IndRNN based SOH estimation model to estimate the SOH of LIBs used in EV applications. To emulate the dynamic driving behavior of a real-world EVs with non-uniform variable load requirement, NASA’s randomized battery usage datasets were chosen. This dataset represents the dynamic load condition of an EV with the help of the Random walk (RW) cycle, in which the battery is allowed to operate under variable load condition for every 5 min. Then, a series of reference benchmarking tests were carried out to evaluate the battery capacity. From the RW cycle and reference discharge cycle, a set of 18 input features (including V, I and T) which affects battery capacity are identified and extracted to develop the IndRNN model. To verify the capability of the proposed IndRNN based SOH estimation approach, four different experimental analyses were carried out. Results obtained from each test reveals IndRNN with a time-step size of 15 is optimal time step size for accurate SOH estimation with 80% of SOH is considered as end of battery life (EOL). In addition, IndRNN outperforms other similar RNN models such as GRU and LSTM with much less RMSE and MAE error values of 1.33% and 1.14%, respectively. The maximum error produced by IndRNN throughout testing process is only 2.5943% which is well below the acceptable SOH error range of ±5% for EVs. Due to the lower error rate provided by this approach, this is more appropriate for BMS of EV applications. The major strength of this method includes real-time estimation, suitable for different LIBs, and robust and accurate SOH estimation. Meanwhile the limitation of the approach is that, a detailed analysis is required on experimental dataset to understand and identify input parameters for different battery chemistries. The proposed model is developed with the help of a dataset produced from three battery cells, but to increase the SOH accuracy further additional datasets with real-world EV driving patterns, operating under different temperatures and high-current discharge conditions is required.

Author Contributions

Conceptualization, P.V., V.T.; Methodology, P.V.; Software, P.V.; Validation, P.V., V.T.; Formal Analysis, P.V.; Data Curation, P.V., V.T.; Writing-Original Draft Preparation, P.V.; Writing-Review & Editing, P.V.; Visualization, P.V.; Supervision, V.T.

Funding

This research received no external funding.

Conflicts of Interest

The authors declare no conflict of interest.

References

  1. CO2 emissions from cars: The facts. Available online: https://www.transportenvironment.org/publications/co2-emissions-cars-facts (accessed on 25 August 2019).
  2. Ren, G.; Ma, G.; Cong, N. Review of electrical energy storage system for vehicular applications. Renew. Sustain. Energy Rev. 2015, 41, 225–236. [Google Scholar] [CrossRef]
  3. Liu, K.; Li, K.; Peng, Q.; Zhang, C. A brief review on key technologies in the battery management system of electric vehicles. Front. Mech. Eng. 2018, 14, 47–64. [Google Scholar] [CrossRef]
  4. Young, K.; Wang, C.; Wang, L.Y.; Strunz, K. Electric vehicle battery technologies. In Electric Vehicle Integration into Modern Power Networks; Rodrigo Garcia-Valle, J.A.P.L., Ed.; Springer: New York, NY, USA, 2013; ISBN 9781461401346. [Google Scholar]
  5. Ruiz, V.; Pfrang, A.; Kriston, A.; Omar, N.; Bossche, P.V.D.; Boon-Brett, L. A review of international abuse testing standards and regulations for lithium ion batteries in electric and hybrid electric vehicles. Renew. Sustain. Energy Rev. 2018, 81, 1427–1452. [Google Scholar] [CrossRef]
  6. Xiong, R.; Cao, J.; Yu, Q.; He, H.; Sun, F. Critical Review on the Battery State of Charge Estimation Methods for Electric Vehicles. IEEE Access 2017, 6, 1832–1843. [Google Scholar] [CrossRef]
  7. Yang, D.; Wang, Y.; Pan, R.; Chen, R.; Chen, Z. A Neural Network Based State-of-Health Estimation of Lithium-ion Battery in Electric Vehicles. Energy Procedia 2017, 105, 2059–2064. [Google Scholar] [CrossRef]
  8. Lipu, M.H.; Hannan, M.; Hussain, A.; Hoque, M.; Ker, P.J.; Saad, M.; Ayob, A. A review of state of health and remaining useful life estimation methods for lithium-ion battery in electric vehicles: Challenges and recommendations. J. Clean. Prod. 2018, 205, 115–133. [Google Scholar] [CrossRef]
  9. Balagopal, B.; Chow, M.-Y. The state of the art approaches to estimate the state of health (SOH) and state of function (SOF) of lithium Ion batteries. In Proceedings of the 2015 IEEE 13th International Conference on Industrial Informatics (INDIN), Cambridge, UK, 22–24 July 2015; pp. 1302–1307. [Google Scholar]
  10. Singh, P.; Khare, N.; Chaturvedi, P.K. A Comprehensive Review on Li-Ion Battery Ageing Estimation Techniques for Green Energy Technology. Int. J. Eng. Sci. Res. Technol. 2017, 6, 22–39. [Google Scholar]
  11. Barré, A.; Deguilhem, B.; Grolleau, S.; Gerard, M.; Suard, F.; Riu, D. A review on lithium-ion battery ageing mechanisms and estimations for automotive applications. J. Power Sources 2013, 241, 680–689. [Google Scholar] [CrossRef]
  12. You, G.-W.; Park, S.; Oh, D. Real-time state-of-health estimation for electric vehicle batteries: A data-driven approach. Appl. Energy 2016, 176, 92–103. [Google Scholar] [CrossRef]
  13. Remmlinger, J.; Buchholz, M.; Meiler, M.; Bernreuter, P.; Dietmayer, K. State-of-health monitoring of lithium-ion batteries in electric vehicles by on-board internal resistance estimation. J. Power Sources 2011, 196, 5357–5363. [Google Scholar] [CrossRef]
  14. Tseng, K.-H.; Liang, J.-W.; Chang, W.; Huang, S.-C. Regression Models Using Fully Discharged Voltage and Internal Resistance for State of Health Estimation of Lithium-Ion Batteries. Energies 2015, 8, 2889–2907. [Google Scholar] [CrossRef]
  15. Zhu, M.; Hu, W.; Kar, N.C. The SOH estimation of LiFePO4 battery based on internal resistance with Grey Markov Chain. In Proceedings of the 2016 IEEE Transportation Electrification Conference and Expo (ITEC), Dearborn, MI, USA, 27–29 June 2016; pp. 1–6. [Google Scholar]
  16. Galeotti, M.; Cinà, L.; Giammanco, C.; Cordiner, S.; Di Carlo, A. Performance analysis and SOH (state of health) evaluation of lithium polymer batteries through electrochemical impedance spectroscopy. Energy 2015, 89, 678–686. [Google Scholar] [CrossRef]
  17. Hung, M.-H.; Lin, C.-H.; Lee, L.-C.; Wang, C.-M. State-of-charge and state-of-health estimation for lithium-ion batteries based on dynamic impedance technique. J. Power Sources 2014, 268, 861–873. [Google Scholar] [CrossRef]
  18. Tong, S.; Klein, M.P.; Park, J.W. On-line optimization of battery open circuit voltage for improved state-of-charge and state-of-health estimation. J. Power Sources 2015, 293, 416–428. [Google Scholar] [CrossRef]
  19. Weng, C.; Sun, J.; Peng, H. A unified open-circuit-voltage model of lithium-ion batteries for state-of-charge estimation and state-of-health monitoring. J. Power Sources 2014, 258, 228–237. [Google Scholar] [CrossRef]
  20. Ng, K.S.; Moo, C.-S.; Chen, Y.-P.; Hsieh, Y.-C. Enhanced coulomb counting method for estimating state-of-charge and state-of-health of lithium-ion batteries. Appl. Energy 2009, 86, 1506–1511. [Google Scholar] [CrossRef]
  21. Bian, X.; Liu, L.; Yan, J. A model for state-of-health estimation of lithium ion batteries based on charging profiles. Energy 2019, 177, 57–65. [Google Scholar] [CrossRef]
  22. Grandjean, T.R.B.; McGordon, A.; Jennings, P.A. Structural Identifiability of Equivalent Circuit Models for Li-Ion Batteries. Energies 2017, 10, 90. [Google Scholar] [CrossRef]
  23. He, H.; Xiong, R.; Fan, J. Evaluation of Lithium-Ion Battery Equivalent Circuit Models for State of Charge Estimation by an Experimental Approach. Energies 2011, 4, 582–598. [Google Scholar] [CrossRef]
  24. Huang, M.; Kumar, M. Electrochemical Model-Based Aging Characterization of Lithium-Ion Battery Cell in Electrified Vehicles. In Proceedings of the ASME 2018 Dynamic Systems and Control Conference (DSCC 2018), Atlanta, GA, USA, 30 September–3 October 2018; Volume 3, pp. 1–10. [Google Scholar]
  25. Fang, L.; Li, J.; Peng, B. Online Estimation and Error Analysis of both SOC and SOH of Lithium-ion Battery based on DEKF Method. Energy Procedia 2019, 158, 3008–3013. [Google Scholar] [CrossRef]
  26. Zhang, F.; Liu, G.; Fang, L. Battery state estimation using Unscented Kalman Filter. In Proceedings of the 2009 IEEE International Conference on Robotics and Automation, Kobe, Japan, 12–17 May 2009; Volume 3, pp. 1863–1868. [Google Scholar]
  27. Topan, P.A.; Ramadan, M.N.; Fathoni, G.; Cahyadi, A.I.; Wahyunggoro, O. State of Charge (SOC) and State of Health (SOH) estimation on lithium polymer battery via Kalman filter. In Proceedings of the 2016 2nd International Conference on Science and Technology-Computer (ICST), Yogyakarta, Indonesia, 27–28 October 2016; pp. 93–96. [Google Scholar]
  28. Schwunk, S.; Armbruster, N.; Straub, S.; Kehl, J.; Vetter, M. Particle filter for state of charge and state of health estimation for lithium–iron phosphate batteries. J. Power Sources 2013, 239, 705–710. [Google Scholar] [CrossRef]
  29. Bakas, E.; Rosca, B.; Wilkins, S.; Donkers, T. Least-Squares-Based Capacity Estimation for Lithium-ion Battery Cells. In Proceedings of the EEVC 2017—The European Battery, Hybrid & Fuel Cell Electric Vehicle Congress, Geneva, Switzerland, 14–17 March 2017. [Google Scholar]
  30. Todeschini, F.; Onori, S.; Rizzoni, G. An experimentally validated capacity degradation model for Li-ion batteries in PHEVs applications. IFAC Proc. Vol. 2012, 8, 456–461. [Google Scholar] [CrossRef]
  31. Ananto, P.; Syabani, F.; Indra, W.D.; Wahyunggoro, O.; Cahyadi, A.I. The state of health of Li-Po batteries based on the battery’s parameters and a fuzzy logic system. In Proceedings of the 2013 Joint International Conference on Rural Information & Communication Technology and Electric-Vehicle Technology (rICT & ICeV-T), Bandung, Indonesia, 26–28 November 2013. [Google Scholar]
  32. Kim, J. Fuzzy logic-controlled online state-of-health (SOH) prediction in large format LiMn2O4 cell for energy storage system (ESS) applications BT. In Proceedings of the 2014 IEEE International Conference on Industrial Technology, ICIT 2014, Busan, Korea, 26 February–1 March 2014; pp. 474–479. [Google Scholar]
  33. Nuhic, A.; Terzimehic, T.; Soczka-Guth, T.; Buchholz, M.; Dietmayer, K. Health diagnosis and remaining useful life prognostics of lithium-ion batteries using data-driven methods. J. Power Sources 2013, 239, 680–688. [Google Scholar] [CrossRef]
  34. Chen, Z.; Sun, M.; Shu, X.; Xiao, R.; Shen, J. Online State of Health Estimation for Lithium-Ion Batteries Based on Support Vector Machine. Appl. Sci. 2018, 8, 925. [Google Scholar] [CrossRef]
  35. Lin, H.T.; Liang, T.J.; Chen, S.M. Estimation of battery state of health using probabilistic neural network. IEEE Trans. Ind. Inform. 2013, 9, 679–685. [Google Scholar] [CrossRef]
  36. Wu, J.; Wang, Y.; Zhang, X.; Chen, Z. A novel state of health estimation method of Li-ion battery using group method of data handling. J. Power Sources 2016, 327, 457–464. [Google Scholar] [CrossRef]
  37. Kim, J.; Yu, J.; Kim, M.; Kim, K.; Han, S. Estimation of Li-ion Battery State of Health based on Multilayer Perceptron: as an EV Application. IFAC-PapersOnLine 2018, 51, 392–397. [Google Scholar] [CrossRef]
  38. Chaoui, H.; Ibe-Ekeocha, C.C. State of Charge and State of Health Estimation for Lithium Batteries Using Recurrent Neural Networks. IEEE Trans. Veh. Technol. 2017, 66, 8773–8783. [Google Scholar] [CrossRef]
  39. You, G.-W.; Park, S.; Oh, D. Diagnosis of Electric Vehicle Batteries Using Recurrent Neural Networks. IEEE Trans. Ind. Electron. 2017, 64, 4885–4893. [Google Scholar] [CrossRef]
  40. Lui, Y.; Zhao, G.; Peng, X.; Hu, C. Lithium-ion battery remaining useful life prediction with long short-term memory recurrent neural network. In Proceedings of the Annual Conference of the Prognostics and Health Management Society, St. Petersburg, FL, USA, 2–5 October 2017; pp. 1–7. [Google Scholar]
  41. Zhang, Y.; Xiong, R.; He, H.; Pecht, M.G. Long Short-Term Memory Recurrent Neural Network for Remaining Useful Life Prediction of Lithium-Ion Batteries. IEEE Trans. Veh. Technol. 2018, 67, 5695–5705. [Google Scholar] [CrossRef]
  42. Bole, B.; Kulkarni, C.; Daigle, M. Randomized battery usage data set. In NASA AMES Prognostics Data Repository; NASA Ames Research Center: Moffett Field, CA, USA, 2014. [Google Scholar]
  43. Li, S.; Li, W.; Cook, C.; Zhu, C.; Gao, Y. Independently Recurrent Neural Network (IndRNN): Building A Longer and Deeper RNN. In Proceedings of the 2018 IEEE/CVF Conference on Computer Vision and Pattern Recognition 2018, Salt Lake City, UT, USA, 18–22 June 2018; pp. 5457–5466. [Google Scholar]
Figure 1. Classification of state-of-health (SOH) estimation methods.
Energies 12 04338 g001
Figure 2. V, I and T of first 50 RW steps observed on battery cell RW9.
Energies 12 04338 g002
Figure 3. V, I and T of last 50 RW steps observed on battery cell RW9.
Energies 12 04338 g003
Figure 4. First RW cycle of battery cell RW9.
Energies 12 04338 g004
Figure 5. Last RW cycle of battery cell RW9.
Energies 12 04338 g005
Figure 6. Reference discharge profile observed on battery cell RW9.
Energies 12 04338 g006
Figure 7. Measured battery capacity degradation of battery cell RW9.
Energies 12 04338 g007
Figure 8. Structure of simple recurrent neural network (RNN) and unfolded RNN.
Energies 12 04338 g008
Figure 9. Illustration of a simple RNN and the proposed independently recurrent neural network (IndRNN) unfolded in time.
Energies 12 04338 g009
Figure 10. Basic architecture of IndRNN.
Energies 12 04338 g010
Figure 11. IndRNN architecture for SOH estimation.
Energies 12 04338 g011
Figure 12. Proposed IndRNN based SOH estimation process flow.
Energies 12 04338 g012
Figure 13. SOH of battery cells RW9, RW10, RW11 and RW12.
Energies 12 04338 g013
Figure 14. SOH estimation using IndRNN with estimated error under different time-step sizes.
Energies 12 04338 g014
Figure 15. SOH estimation results of true SOH vs. different time step size using IndRNN.
Energies 12 04338 g015
Figure 16. SOH estimation using IndRNN with estimated error under different time-step sizes up to 80% of SOH.
Energies 12 04338 g016
Figure 17. SOH estimation results of true SOH vs different time step sizes up to 80% of SOH using IndRNN.
Energies 12 04338 g017
Figure 18. SOH estimation results using IndRNN, GRU and LSTM with estimated error percentage.
Energies 12 04338 g018
Figure 19. SOH estimation results of true SOH vs. GRU and LSTM.
Energies 12 04338 g019
Figure 20. SOH estimation results using IndRNN, GRU and LSTM with estimated error percentage upto 80% of SOH.
Energies 12 04338 g020
Figure 21. SOH estimation results of true SOH vs. GRU and LSTM up to 80% of SOH.
Energies 12 04338 g021
Table 1. Comparative analysis of SOH estimation methods.
SOH
Method
Algorithm/Approach UsedAdvantagesDisadvantages Improvement RequiredSOH
Error %
References
EISTheory of evidence (ToE)
  • Less computational complexity
  • Achieves good accuracy
  • Accuracy decays if battery model parameters are not properly extracted
  • Restricted to specific battery chemistries
  • Further improvement can be made to the battery model by integrating with other techniques
3.73%[16]
OCVParameter varying approach (PVA)
  • Easy to implement
  • Tested for various vehicle driving cycles profiles under different temperature conditions
  • Time-consuming process
  • Errors accumulate when estimation performance degrades
  • Scenario driven-based algorithms shall be developed
  • Estimation accuracy can be increased further by extracting resistance, capacity and OCV as an individual task
0.5% to 3%[18]
CCLinear function and operations
  • Simple calculation
  • Easy to implement in hardware
  • Estimation error increases after every charge/discharge cycle
  • Battery is tested with fewer charge/discharge cycles
  • Calibration is required to sustain its accuracy
  • Battery must be tested for more charge/discharge cycles
1.08%
(after 28th cycle when correction is applied)
[20]
ECMIncremental capacity analysis based model
  • Suitable for different type of LIBs
  • High accuracy
  • Battery allowed to cycle under constant load discharge condition
  • Time-consuming process
  • Effectiveness of this method needs to be validated under real world EV applications
  • Algorithm for accurate model parameter extraction needs to be improved
Proprietary dataset: 0.12%
NASA dataset:
–0.57% to 0.19
[21]
EchMReduced order single particle model (SPM), Brute force nearest neighbour search (NNS)
  • Captures battery degradation process effectively by extracting both electrochemical and physical parameters
  • Increase in SOH accuracy by combining with other SOH methods
  • Accurate model parameterization is essential
  • Not suitable for online estimation
  • Need to adopt simplified approach for battery characterization
-[24]
KFForgetting factor recursive least square
  • Good accuracy
  • Online estimation approach
  • High computational cost
  • Accuracy depends on battery model parameters
  • Complexity of the algorithm should be reduced with the help of an efficient algorithm
1.52%[25]
PFMonte Carlo sampling methods
  • Good precision
  • Validation carried out on EV driving profile
  • To increase robustness of the method, large volume of experimental dataset is required
  • To increase the accuracy, a better battery model could be adopted instead of a simplified model
-[28]
LSOrdinary least squares and total least squares
  • Acceptable accuracy
  • Performed on experimental data of different automotive profiles
  • Online estimation method
  • SOH estimation performed with many assumptions
  • Proposed methods can be tested on cell modules or EV battery packs
<5%[29]
FLCenter-of-gravitytechnique
  • No complex mathematical model is needed
  • Directly measures SOH without any intermediate transformation steps
  • High accuracy
  • Other essential battery ageing factors are ignored, and only temperature and current alone are taken into account
  • Accuracy depends on effective training process
  • By considering additional battery ageing parameters accuracy can be improved
<2%[31]
SVMGrid search method, Radial basis function
  • Online method with good estimation precision
  • Good non-linearity mapping
  • Computational intensity and limitation on data storage
  • Sensitive to amount and quality of training data
  • For better results additional factors such as sampling error, temperature must be included in the input vector
  • Must be validated with the help of real EV driving profile
<2%[34]
ANNMultilayer perceptron (MLP)
  • Online estimation method
  • Capable to estimate SOH using discrete life span data of the battery instead of whole life span
  • Effectively capture the non-linear characteristics of the battery
  • Need large amount of data to train the network
  • The precision depends on the accuracy of the model applied for experimental dataset
  • Better approach must be proposed to effectively represent battery degradation process
<1.5%[37]
RNNNon-linear autoregressive with exogenous inputs (NARX),global feedback theorem (GFT)
  • Battery model or knowledge of battery’s internal parameters is not needed
  • Battery temperature effect is considered
  • Battery ageing is forced by exposing under high temperature
  • Constant charging/discharge profile applied for generating experimental dataset
  • Dynamic/variable load profile must be used to apply this approach to real-world EVs
0.1 to 0.45%
(For LiFePO4)
[38]
LSTM-RNNSnapshot-based approach, Noise-robust approach
  • Practical EV environments which support real-world driving patterns
  • Temperature impact on battery ageing is considered
  • Requires specific I/V patterns to infer battery degradation process which is different for different battery chemistry
  • Leads to gradient decay over layers due to the use of sigmoid or tangent as an activation function
  • Further improvement can be made on the RNN architecture’s activation function for better learning process
<2.46%[39]
Table 2. Battery specifications of NASA’s randomized battery usage data set.
Battery Key CharacteristicsSpecifications
ManufacturerLG Chem
Battery chemistry18,650 Lithium cobalt oxide vs. graphite
Nominal capacity2100 mAh
Lower cut-off voltage3.2 V
Upper threshold voltage4.2 V
Table 3. Hyperparameters for proposed IndRNN network.
HyperparametersInitialized Values
Time step10
Number of neuron in IndRNN hidden layer100
Number of IndRNN hidden layer1
OptimizerAdam
Learning rate0.0001
Batch size 10
Epoch100
Activation functionReLU
Table 4. SOH estimation results of IndRNN under different time step sizes.
Time Step SizeRMSE (%)MAE (%)MAX (%)
53.01492.46246.8403
102.61462.26494.94
151.87421.56393.5786
201.73621.37963.7795
Table 5. SOH estimation results of IndRNN under different sizes of time steps up to 80% of SOH.
Time Step SizeRMSE (%)MAE (%)MAX (%)
52.66392.25455.1516
102.27751.85814.3752
151.33691.14032.5943
202.06071.76323.4287
Table 6. SOH estimation results of IndRNN, gated recurrent unit (GRU) and long short-term memory (LSTM).
RNN TypeRMSE (%)MAE (%)MAX (%)
IndRNN1.87421.56393.5786
GRU2.66782.29794.8978
LSTM3.13762.67545.8633
Table 7. SOH estimation results of IndRNN, GRU and LSTM up to 80% of SOH.
RNN TypeRMSE (%)MAE (%)MAX (%)
IndRNN1.33691.14032.5943
GRU2.53762.38903.8415
LSTM3.15792.72514.6522

