Sector Coupling in the North Sea Region—A Review on the Energy System Modelling Perspective


Abstract

1. Introduction
2. Motivation, Objective and Methodology
2.1. Motivation
2.2. Objective
- How can sector coupling be defined and realized from the far-reaching perspective of energy system modelling?
- Which of the state-of-the-art tools are accessible to model sector-coupled energy systems, and how to choose an appropriate tool?
- To understand the definition of sector coupling and its potential role and applicability in the energy transition.
- To comprehend the progression of state-of-the-art energy system models, and selection of appropriate modelling tools based on the rationale of the research.
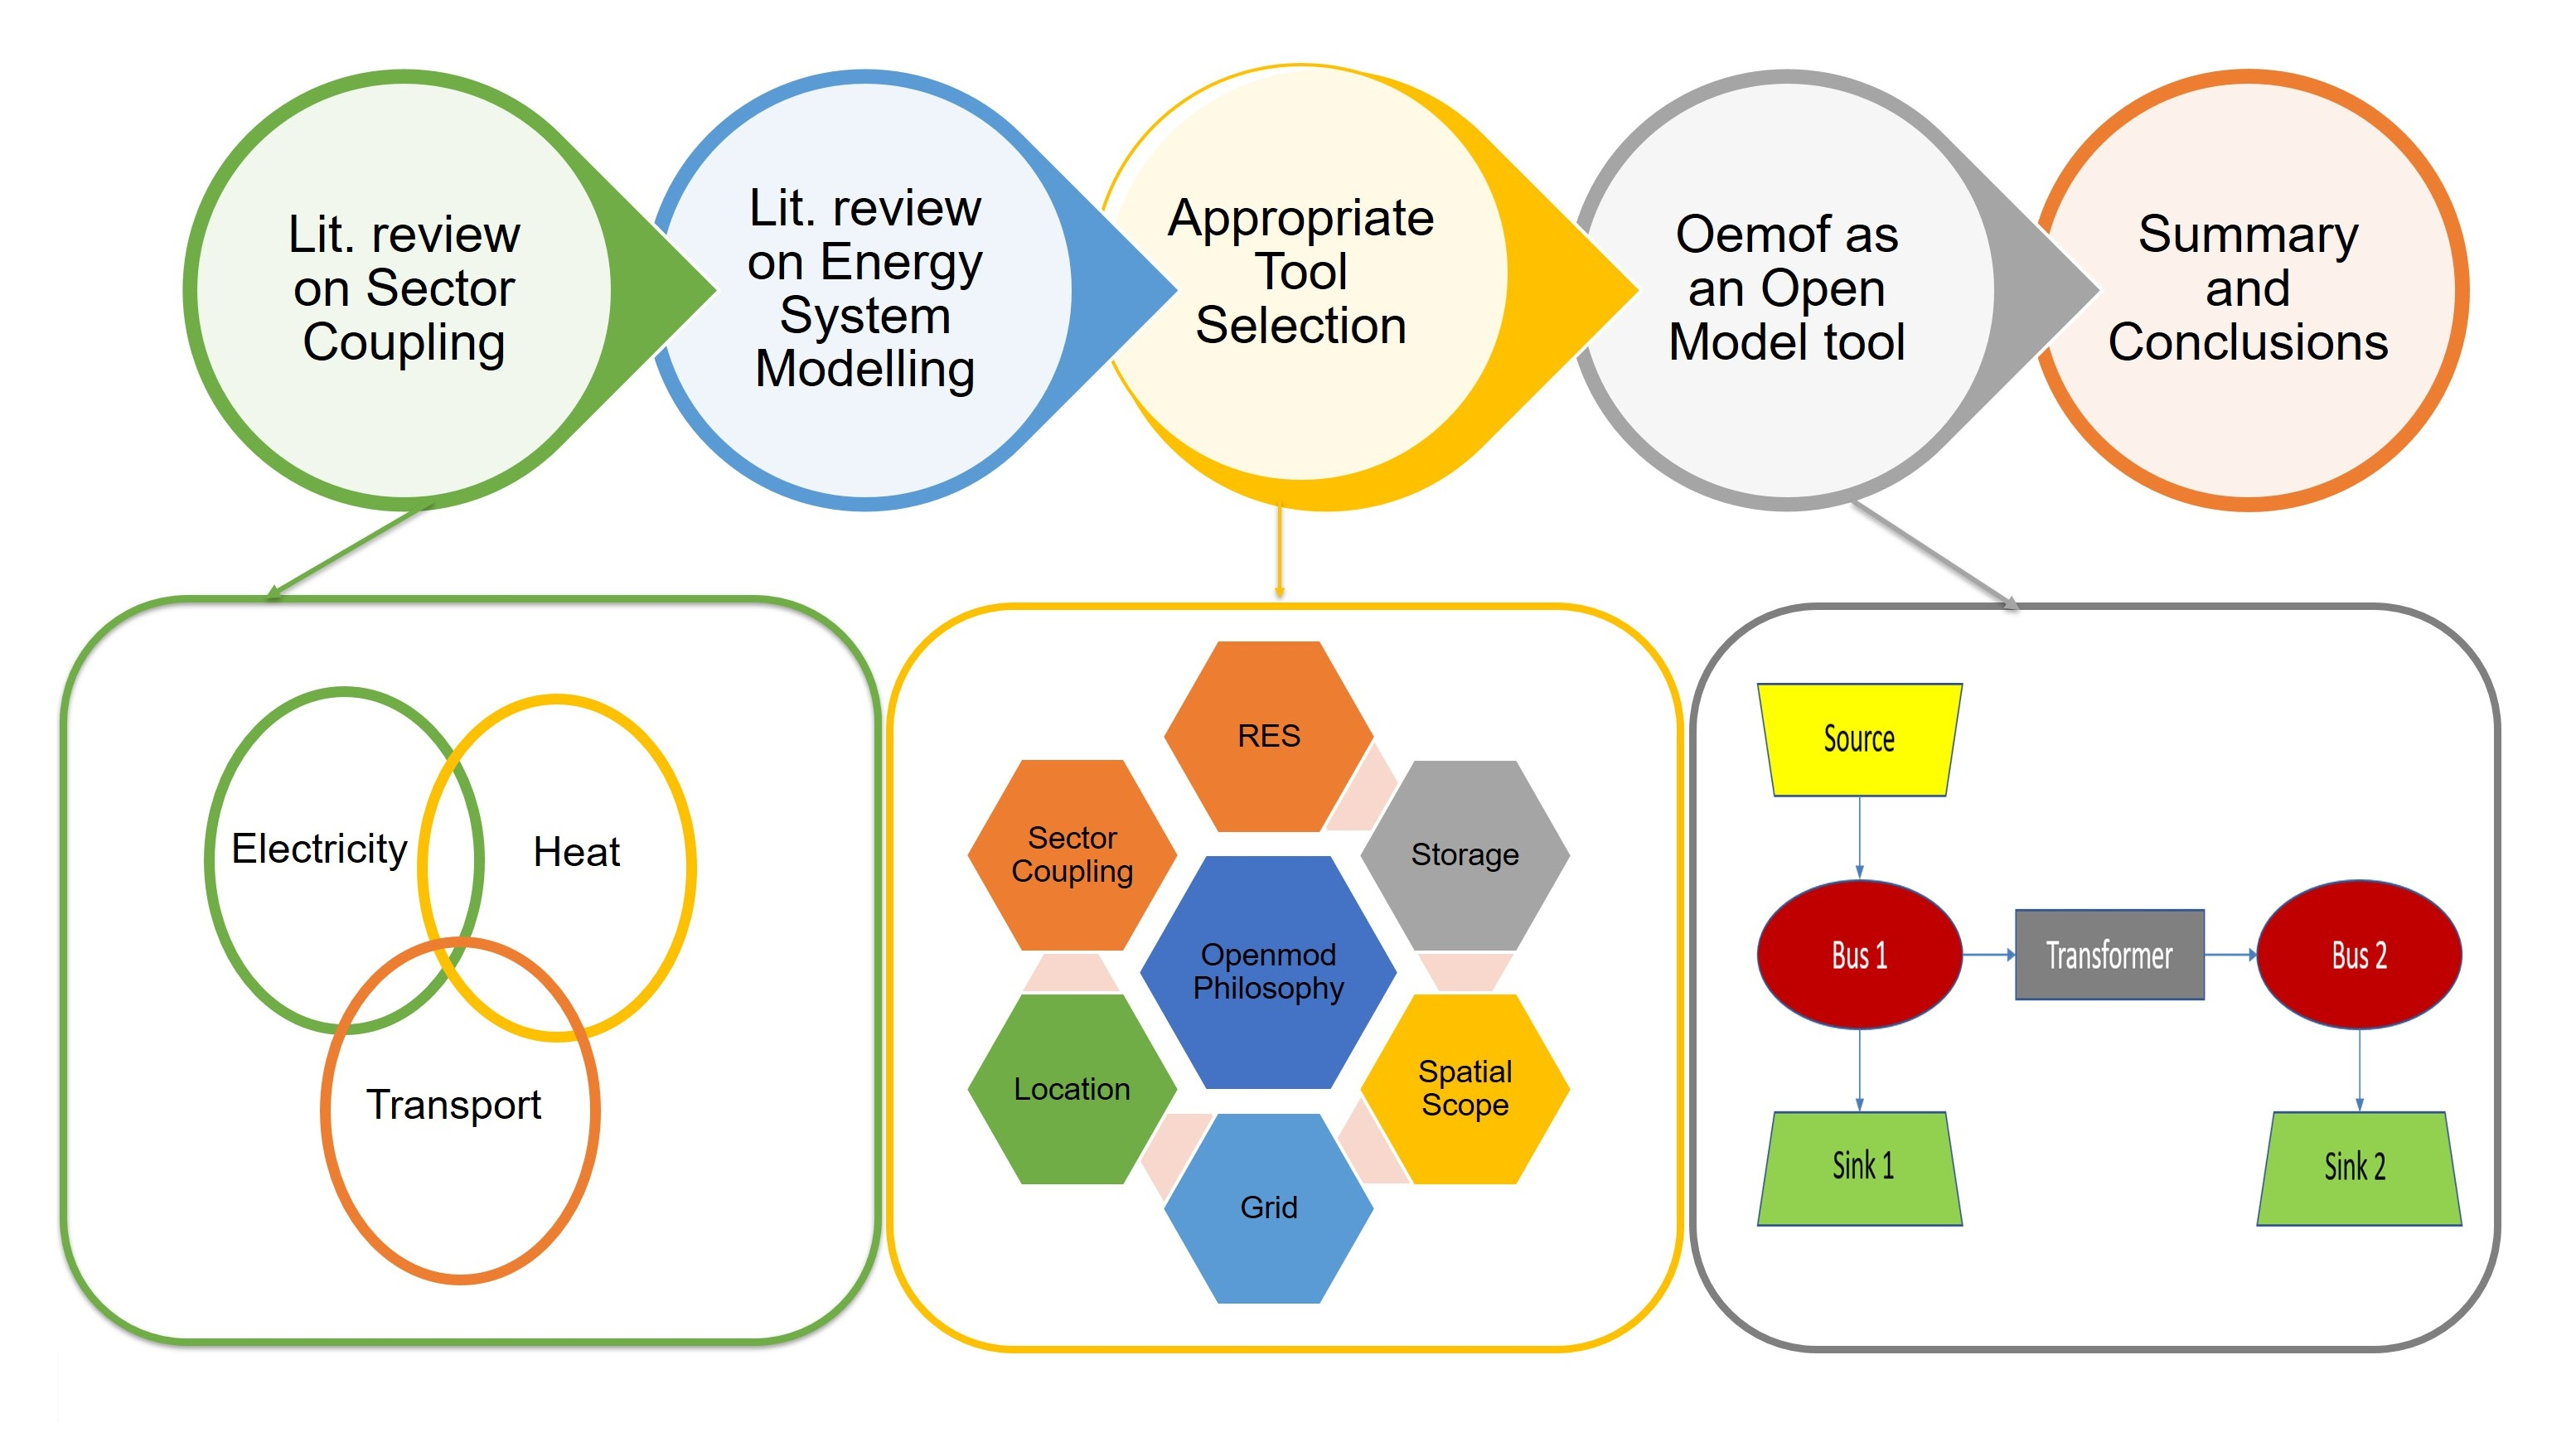
2.3. Methodology
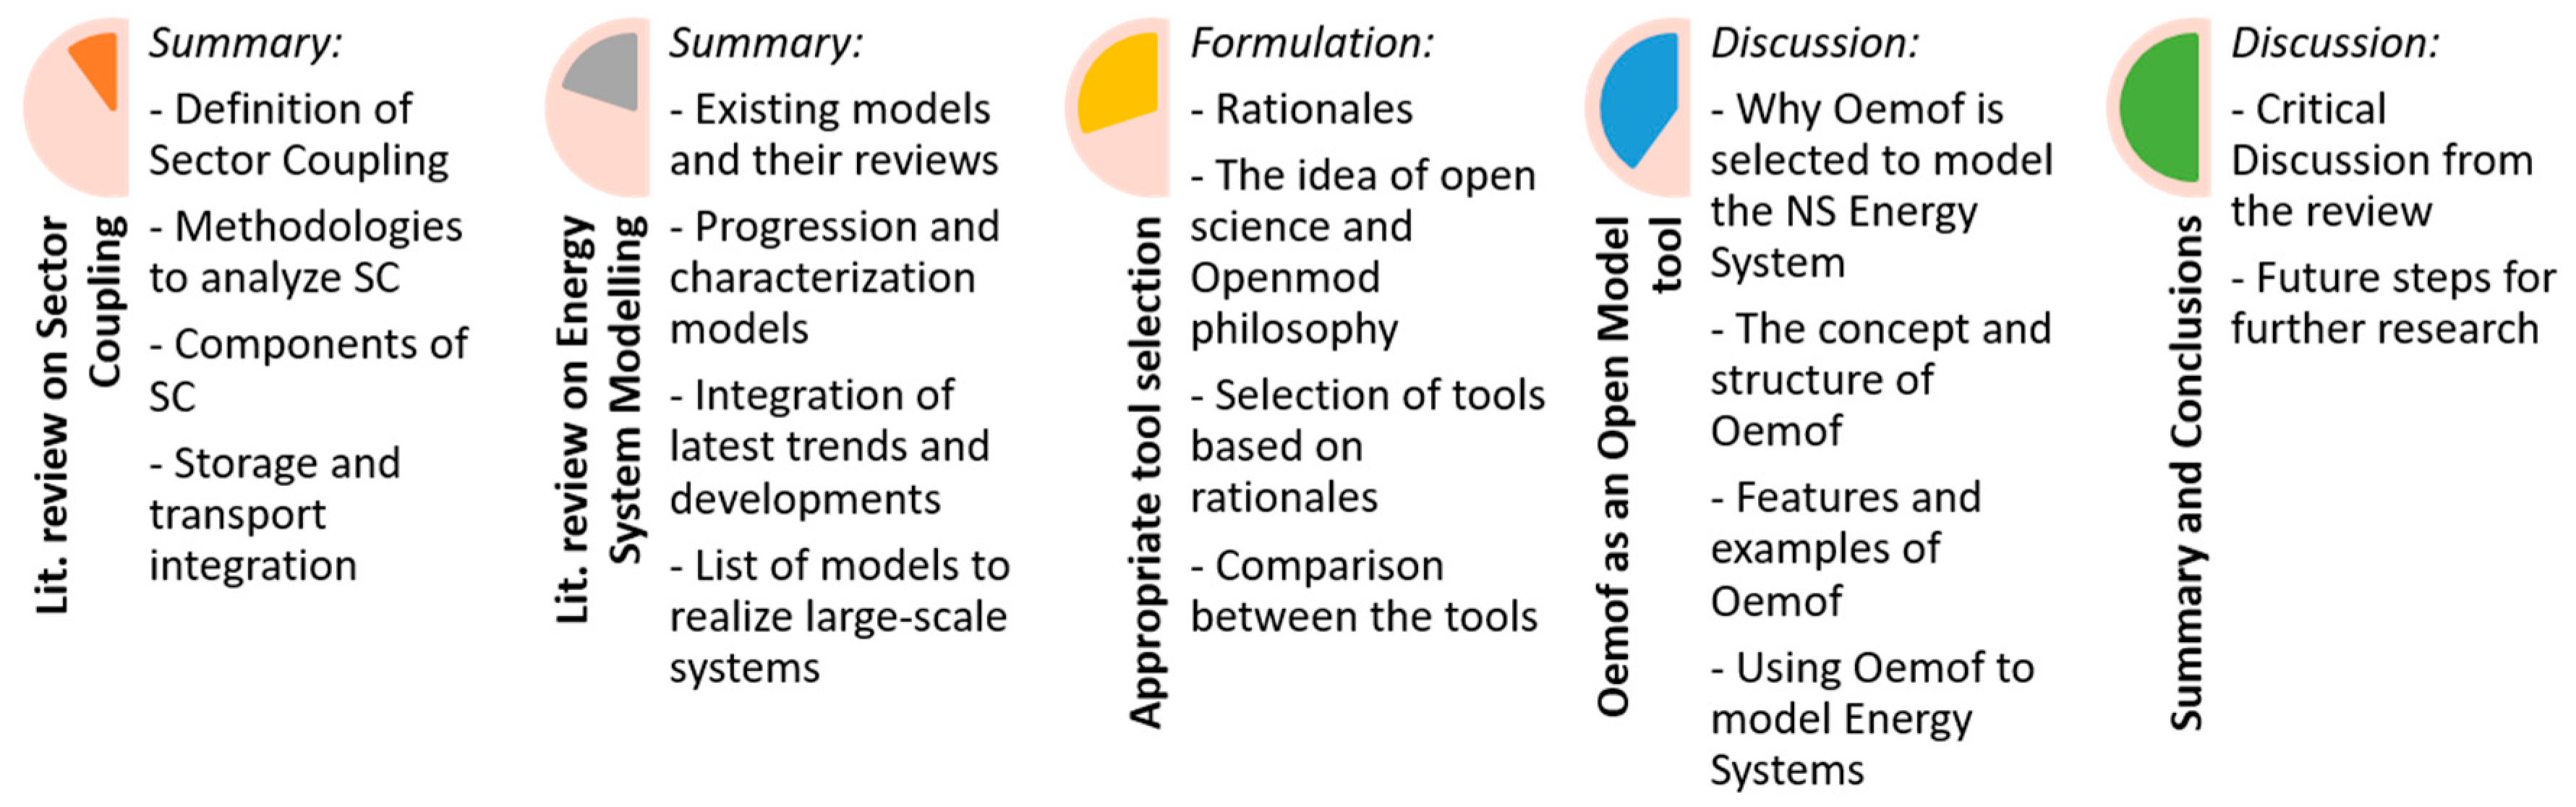
3. Literature Review on Sector Coupling
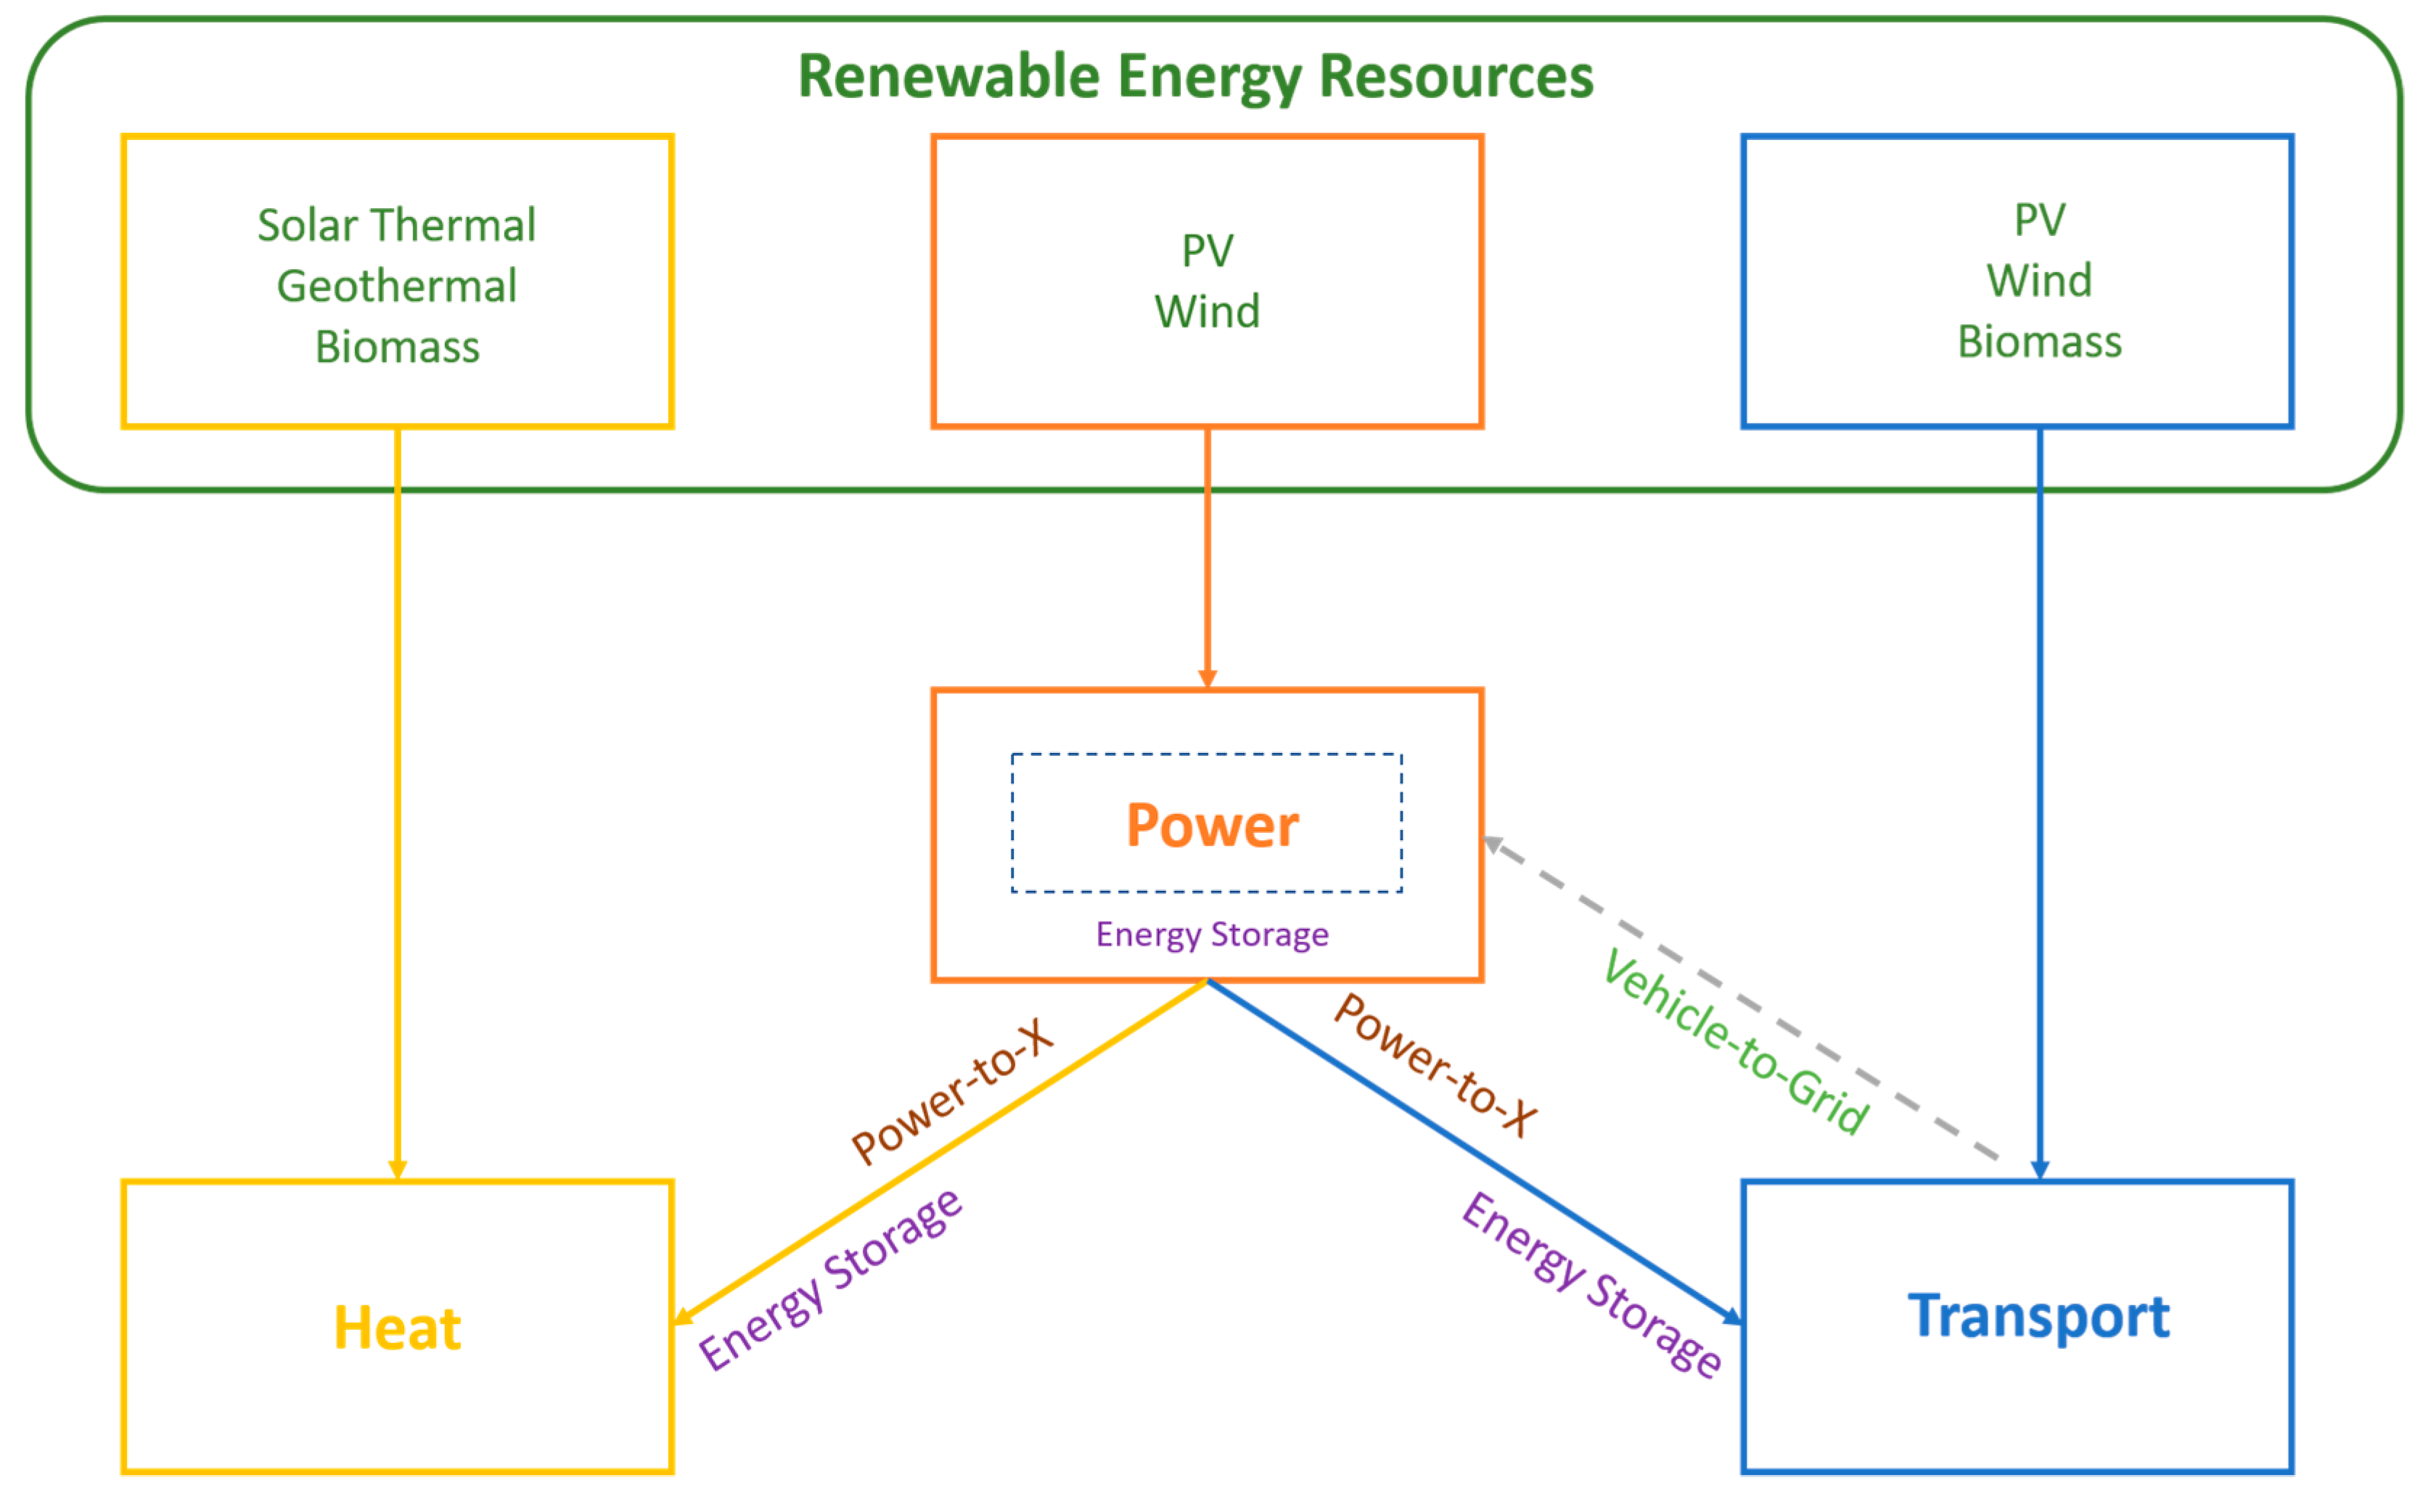
3.1. Definition of Sector Coupling
3.2. Literature Review on Sector Coupling from 2001 to 2010
3.3. Literature Review on Sector Coupling from 2011 to Present
4. Literature Review on Energy System Modelling
4.1. Reviews of Energy Models from 1970 to 2000
4.2. Reviews of Energy Models from 2001 to 2010
4.3. Reviews of Energy Models from 2010 to Present
5. Appropriate Tool Selection
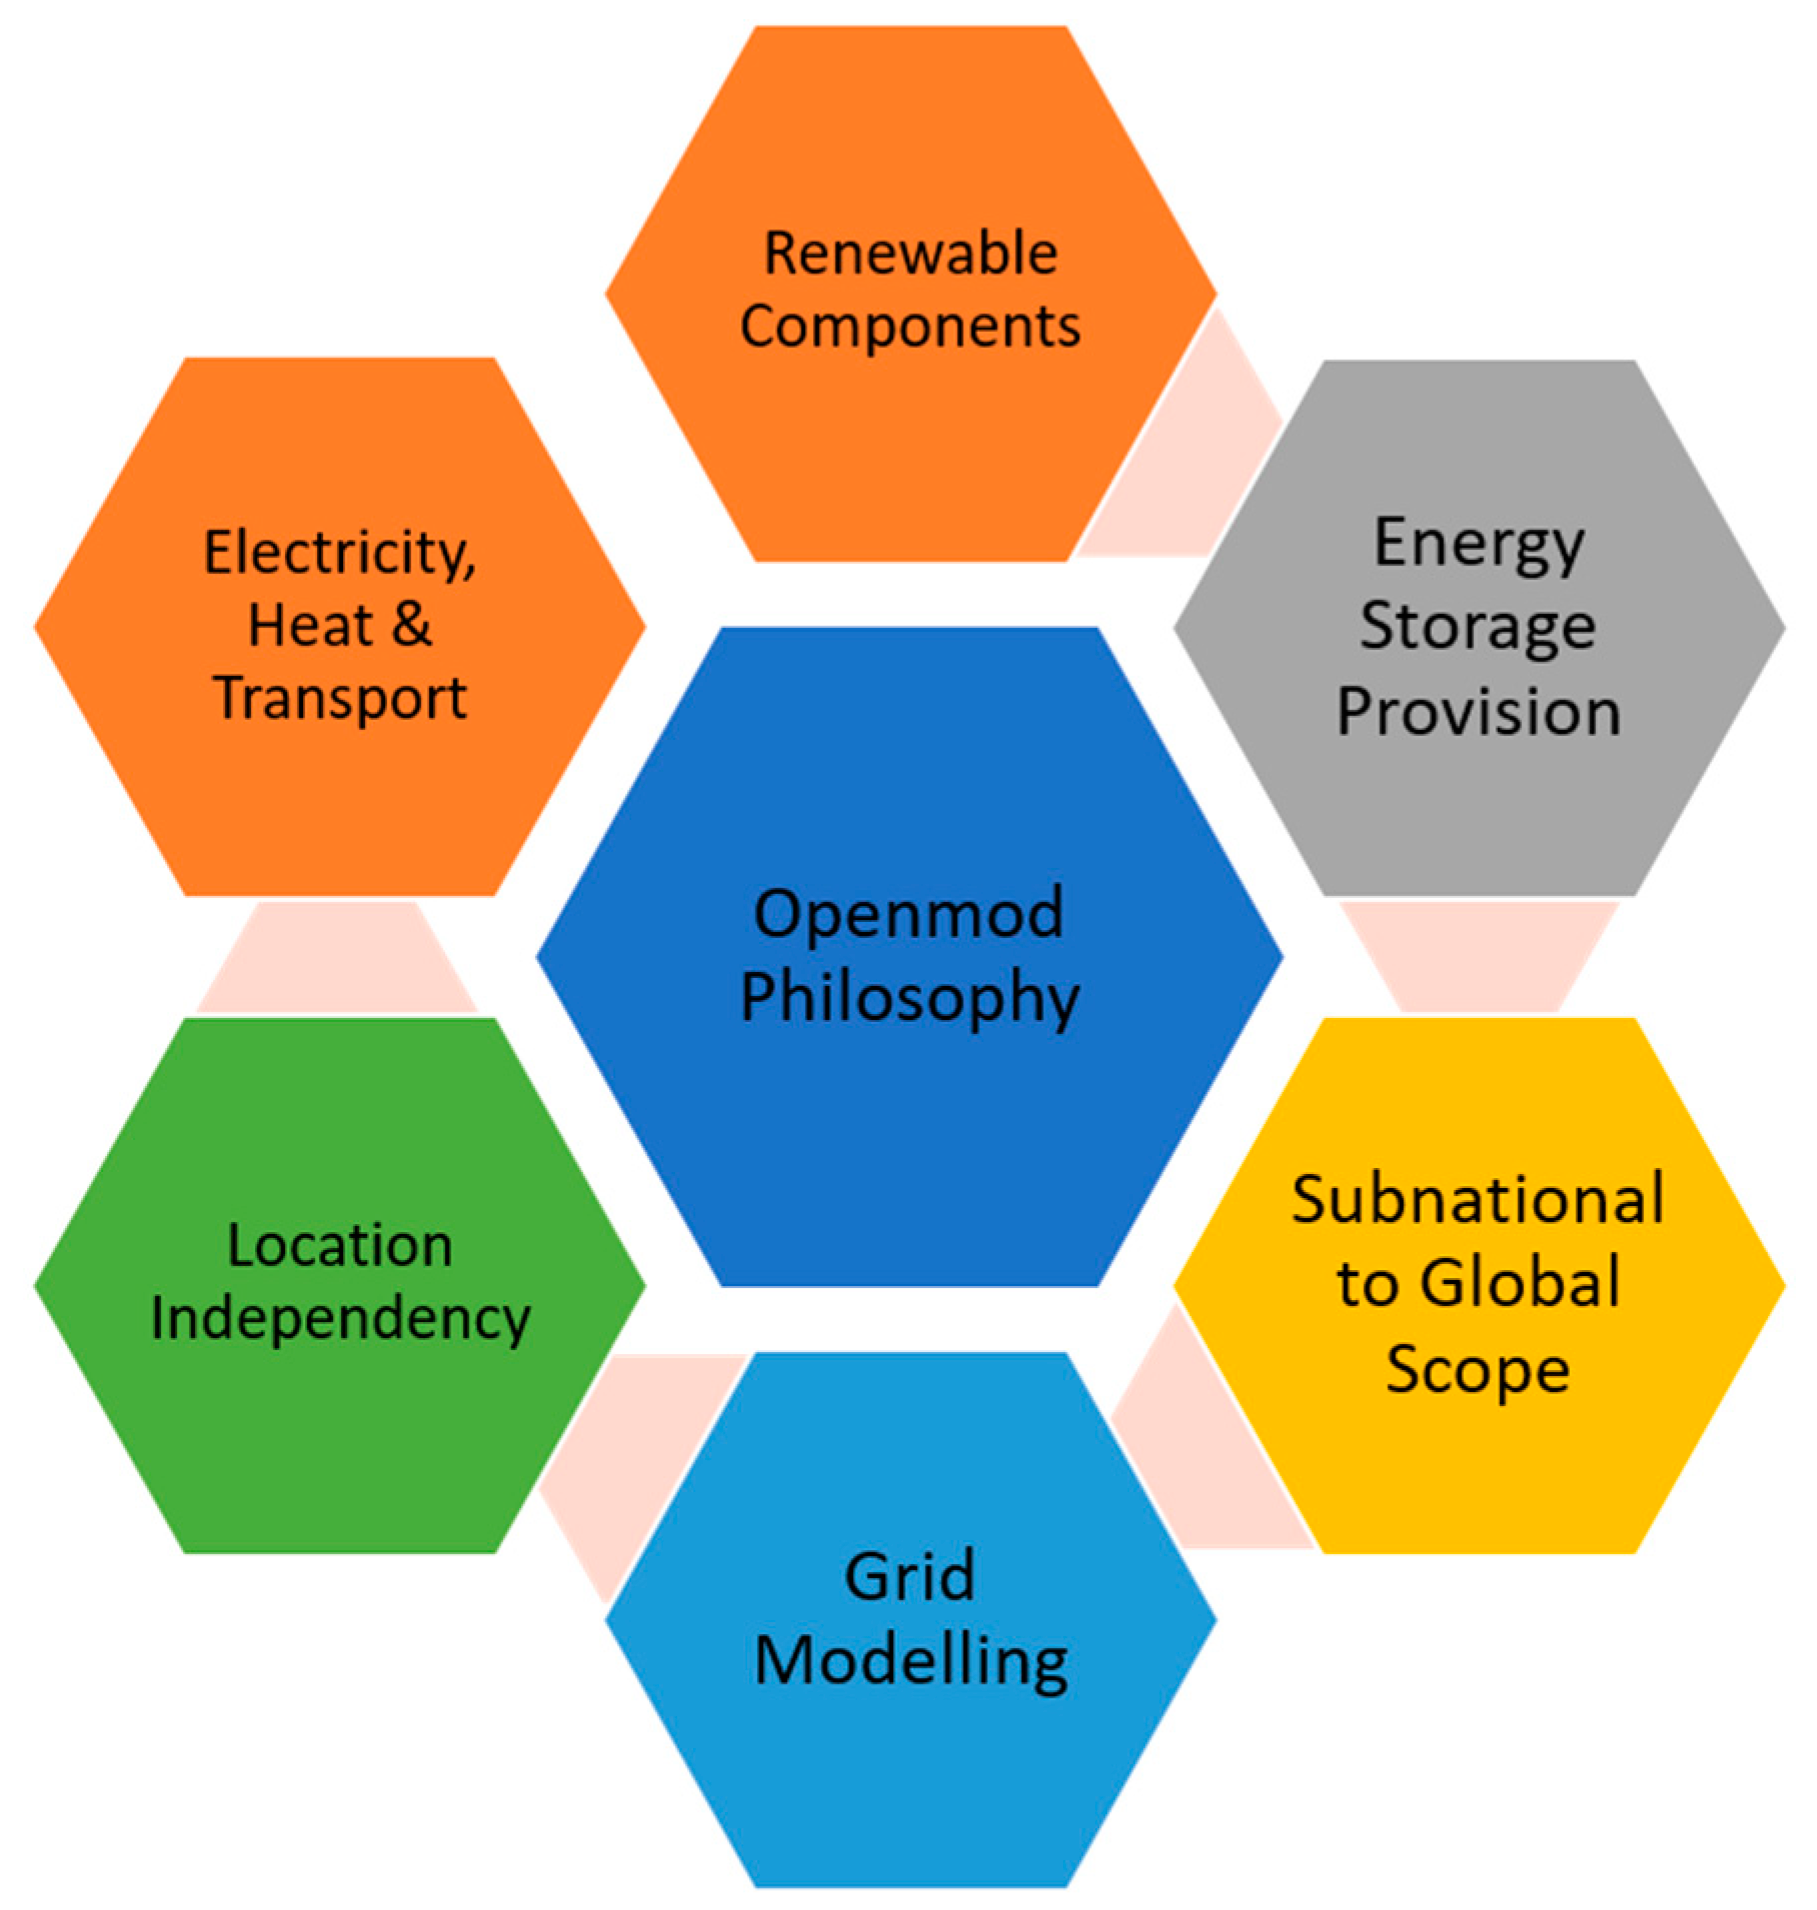
5.1. Rationale-Based Methodology for Selection of Tools
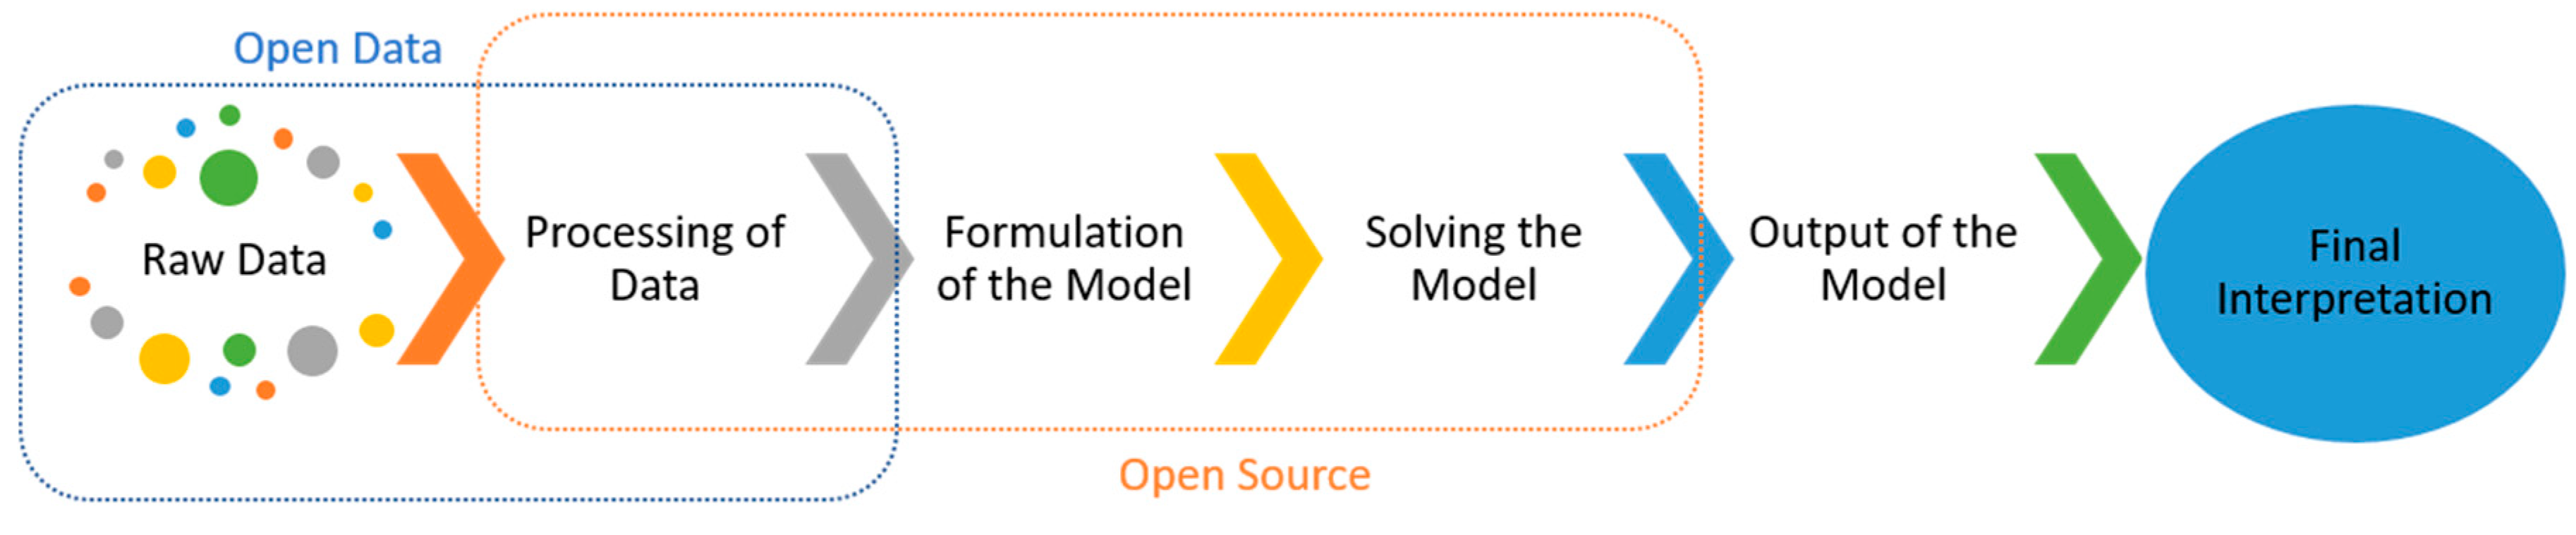
- The models follow ‘Openmod Philosophy’ of sharing code and data;
- The model either provides all proven renewable components or the users have access to code to build and modify different components;
- Energy storage is present or can be added to the model;
- Realization and integration of different sectors (e.g., electricity, heat, and transport) are possible in the model;
- The models can be replicated for any geographical contexts;
- The model allows grid modelling;
- The model horizon varies from sub-national to global levels to allow for modelling from different resolution aspects.
5.2. Short Description of the Selected Tools
5.2.1. Calliope
5.2.2. DESSTinEE
5.2.3. Dispa-SET
5.2.4. ELMOD
5.2.5. ficus
5.2.6. LEAP
5.2.7. LUSYM
5.2.8. MEDEAS
5.2.9. Oemof
5.2.10. OSeMOSYS
5.2.11. PowerGAMA
5.2.12. PyPSA
5.2.13. RETScreen
5.2.14. SIREN
5.2.15. SWITCH
5.2.16. urbs
6. Oemof as an Open Model Tool
6.1. Why Oemof Can Be Used as A Tool to Model the North Sea (NS) Energy System
- Oemof is able to create flexible energy system models due to its easily integrable generic structures and object-oriented approach.
- Oemof addresses the uncertainty through the use of collaborative modelling to look deep into various decisive features of energy systems.
- Oemof allows interdisciplinary modelling to understand common research problems in energy systems.
- Oemof follows strict scientific standards via different levels of control mechanism to ensure transparency and reliability. Oemof also allows repeatability, reproducibility, and scrutiny of the model.
- The open-source, open data approach of Oemof also allows communication between modellers policymakers and other stakeholders, which enhances the understanding of energy systems and accelerates the energy transition.
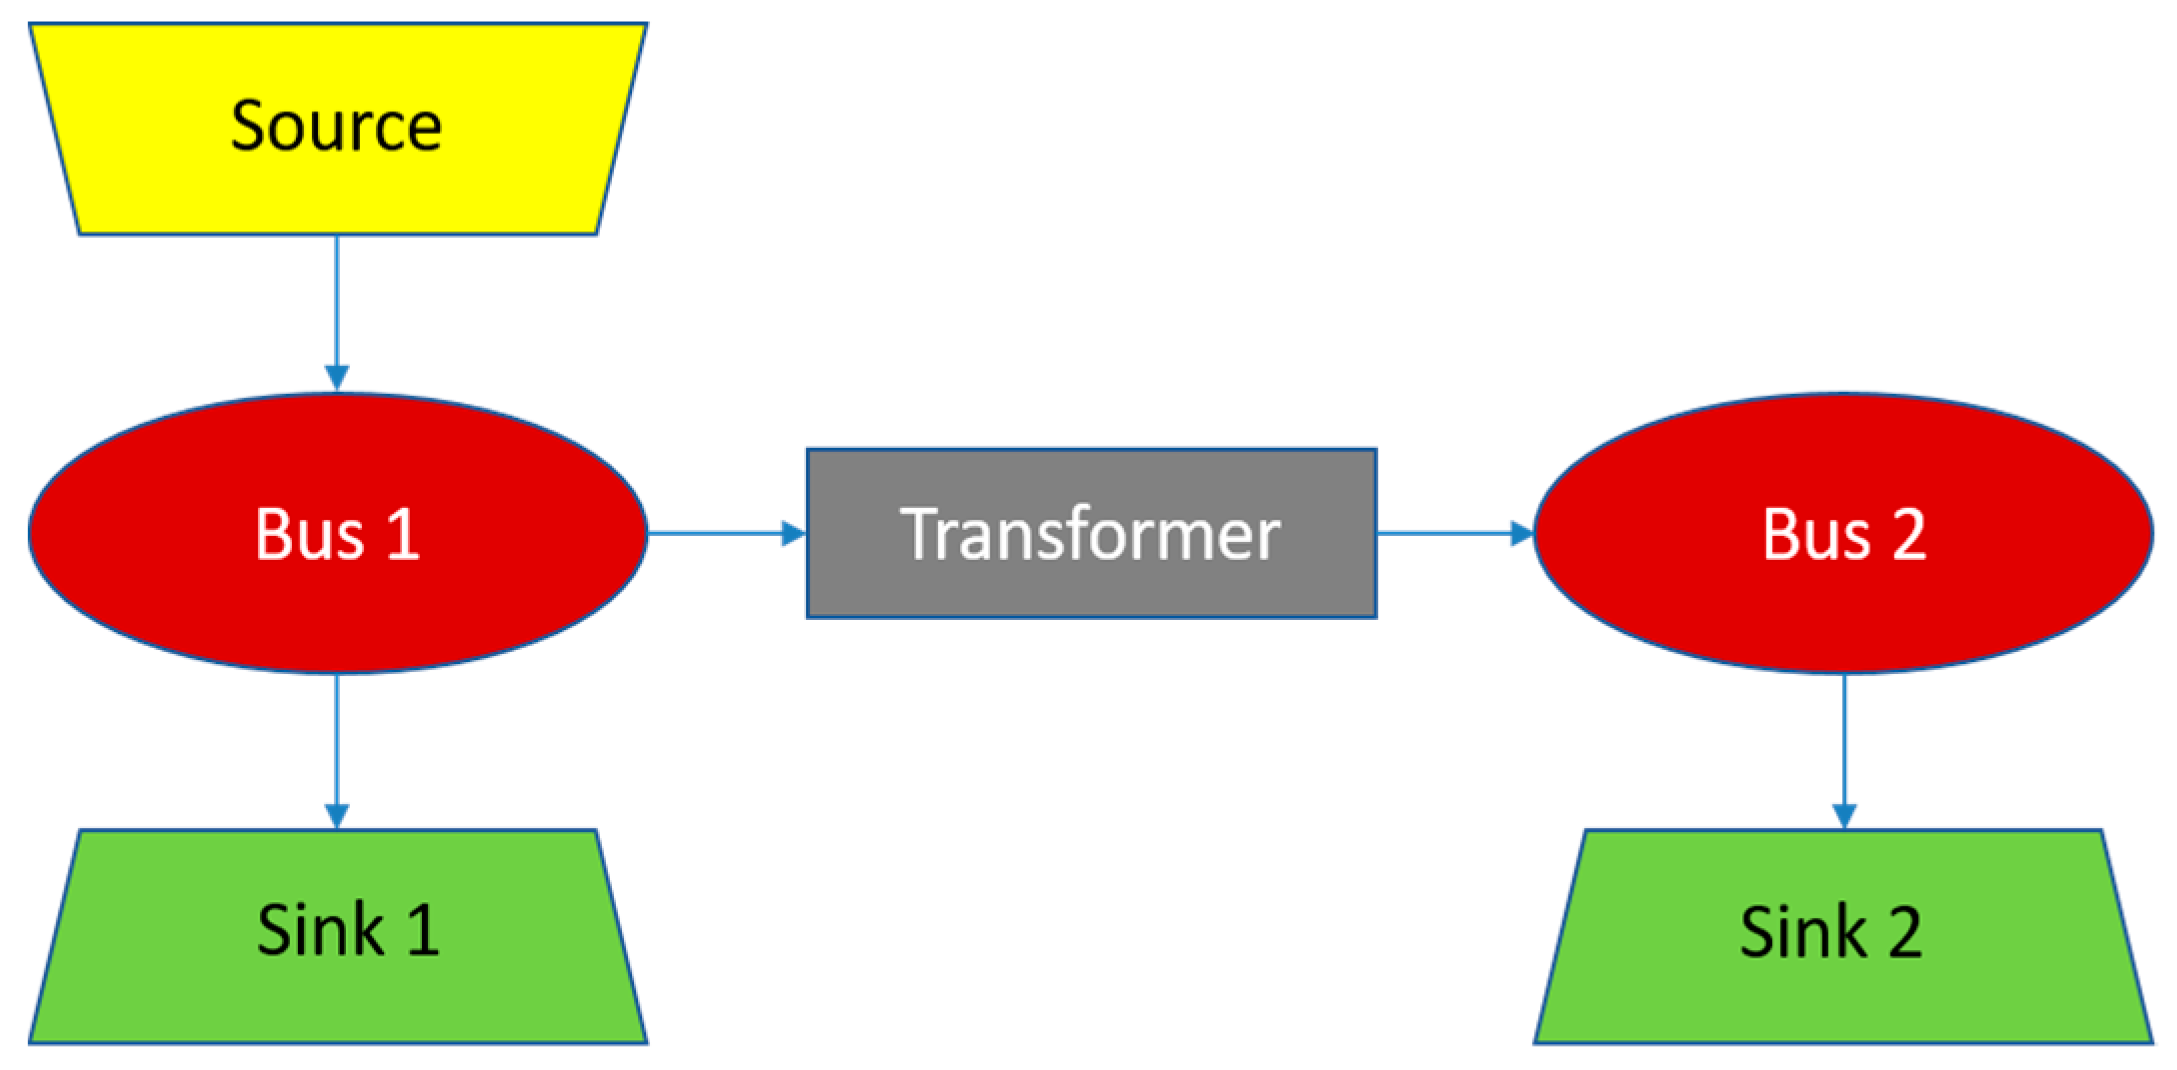
6.2. The Concept of Oemof
6.3. Using Oemof to Model Energy Systems
7. Summary and Conclusions
7.1. Lessons Learned
7.2. Future Steps
Funding
Acknowledgments
Conflicts of Interest
Appendix A

| Serial | Tool | Geographical Scope | Serial | Tool | Geographical Scope |
|---|---|---|---|---|---|
| 1 | BALMOREL (Bottom-up partial equilibrium energy system optimisation model) | Global | 31 | JMM (Joint Market Model) | Multi-regional |
| 2 | Calliope | User-defined | 32 | LEAP | National |
| 3 | COMPETES (Comprehensive Market Power in Electricity Transmission and Energy Simulator) | National, Continental | 33 | LUSYM | National, Continental |
| 4 | COMPOSE (Compare Options for Sustainable Energy) | Single System | 34 | MEDEAS | National, Continental, Global |
| 5 | DER-CAM (Distributed Energy Resources Customer Adoption Model) | Single System, Local, Regional | 35 | MOCES (Modeling of Complex Energy Systems) | User-defined |
| 6 | DESSTinEE | National, Continental (Europe) | 36 | NEMO (National Electricity Market Optimiser) | National |
| 7 | DIETER (Dispatch and Investment Evaluation Tool with Endogenous Renewables) | Germany | 37 | Oemof | User-defined |
| 8 | Dispa-SET | NUTS 1 (EU) | 38 | OnSSET (Open Source Spatial Electrification Tool) | Sub-Saharan Africa, developing Asia, Latin America |
| 9 | DynPP (Dynamic Power Plant Model) | Single System | 39 | OpenDSS (Open Distribution System Simulator) | Distribution Networks |
| 10 | EA-PSM (Energy Advice Power System Modelling)Electric Arc Flash | National, Continental, Global | 40 | OSeMOSYS | Community, Continental |
| 11 | EA-PSM Electric Short Circuit | National, Continental, Global | 41 | PLEXOS Open EU (PLEXOS Integrated Energy Model) | Northwest Europe |
| 12 | ELMOD | National, Continental | 42 | PowerGAMA | Regional, National |
| 13 | EMLab-Generation (Energy Modelling Laboratory-Generation) | Central Western Europe | 43 | PowerMatcher | Distribution Networks |
| 14 | EMMA (The European Electricity Market Model) | North-western Europe | 44 | PyPSA | National, Continental |
| 15 | EMPIRE (European Model for Power system Investment with Renewable Energy) | Continental (Europe) | 45 | RAPSim (Renewable Alternative Powersystems Simulation) | Local |
| 16 | Energy Numbers-Balancing | National | 46 | Region4FLEX | Germany |
| 17 | EnergyPlan | Local, National | 47 | renpass (Renewable Energy Pathways Simulation System) | Regional, National |
| 18 | EnergyRt (Energy systems modeling R-toolbox) | Multi-regional | 48 | RETScreen | All |
| 19 | ESO-X ESO refers to Electricity Systems Optimisation (ESO) framework | Single node | 49 | SAM (System Advisor Model) | Single System |
| 20 | ETM (1) (EUROfusion Times Model) | Global (17 Regions) | 50 | SciGRID (Open Source Model of European Energy Networks) | Europe and Germany (any other EU country also possible) |
| 21 | ETM (2) (Energy Transition Model) | Community - International | 51 | SimSES (Simulation of stationary energy storage systems) | Global |
| 22 | ETSAP-TIAM (The TIMES Integrated Assessment Model) | Global (15 Regions) | 52 | SIREN | Regional, National |
| 23 | ficus | Local, National | 53 | SNOW (Statistics Norway’s World Model) | National, Global |
| 24 | GAMAMOD (The Gas Market Model) | Europe | 54 | stELMOD | National, Continental |
| 25 | GCAM (Global Change Assessment Model) | Global | 55 | SWITCH | Regional, National |
| 26 | GENESYS (Genetic Optimization of a European Energy Supply System) | EU-MENA (21 Regions) | 56 | TIMES Évora (TIMES refers to The Integrated MARKAL-EFOM System) | Évora (Portugal) |
| 27 | GridCal | Transmission Networks | 57 | TIMES-PT | Portugal |
| 28 | GridLAB-D | Local, National | 58 | Temoa (Tools for Energy Model Optimization and Analysis) | US |
| 29 | iHOGA (Improved Hybrid Optimization by Genetic Algorithms) | Local | 59 | urbs | Local, Regional, National |
| 30 | IRiE (Integrated Regulating power market in Europe) | 26 Areas of Northern Europe |
Appendix B
| Serial | Modelling Tools | Objective | Approach | Modelling Horizon | Spatial Coverage |
|---|---|---|---|---|---|
| 1 | Calliope | Investment and Operation Decision Support | Bottom-up | Unlimited | User-defined |
| 2 | DESSTinEE | Scenario, Investment and Operation Decision Support | Bottom-up | 2050 | National, Continental |
| 3 | Dispa-SET | Investment and Operation Decision Support | - | Typically 1 year | NUTS1 (Nomenclature of Territorial Units for Statistics 1) |
| 4 | ELMOD | Investment and Operation Decision Support | Bottom-up | Typically 1 year | Germany, Europe |
| 5 | ficus | Investment and Operation Decision Support | Bottom-up | 1 year | National, Local |
| 6 | LEAP | Scenario | Hybrid | Typically 20 to 50 years | National |
| 7 | LUSYM | Operation Decision Support | Bottom-up | Daily, Weekly and Yearly | National, Continental |
| 8 | MEDEAS | CO2 equivalent emissions, energy, social, economic costs, RE-share | Top-down | 1 year | Global, Continents, Nations |
| 9 | Oemof | Investment and/or Operation Decision Support, Scenario | Top-down, Bottom-up, Hybrid | Depending on application | Depending on application |
| 10 | OSeMOSYS | Investment Decision Support | Bottom-up | User-defined | Community - Continental |
| 11 | PowerGAMA | Investment Decision support and Scenario | Bottom-up | Typically 1 year | Regional, National |
| 12 | PyPSA | Investment and Operation Decision Support, Power System Analysis | Bottom-up | 1 year | National |
| 13 | RETScreen | Investment Decision Support and Scenario | Hybrid | Max 100 years | All |
| 14 | SIREN | Scenario | Bottom-up | 1 year | Regional, National |
| 15 | SWITCH | Investment and Operation Decision Support | Bottom-up | User-defined | Regional, National |
| 16 | urbs | Investment and Operation Decision Support | Bottom-up | User-defined | Local, Regional, National |
| Serial | Modelling Tools | Conventional Generation | Renewable Generation | Storage Inclusion | Grid | Commodity | Demand Sectors |
|---|---|---|---|---|---|---|---|
| 1 | Calliope | All | All | All | Net Transfer Capacity (NTC) | Electricity, Hydrogen, Heat and Fuels | Aggregated |
| 2 | DESSTinEE | All | All | Pumped Hydro Storage | NTC | Electricity | Building, Transport and Industry |
| 3 | Dispa-SET | All | All | All | NTC | Electricity, Heat | Aggregated |
| 4 | ELMOD | All | All | All | Transmission, DC load flow | Electricity, Heat | Aggregated |
| 5 | ficus | All | All | All | Import, Export | Any commodity | Aggregated |
| 6 | LEAP | All | All | All | None | Electricity and heat | Building, Transport and Industry |
| 7 | LUSYM | All | All | All | Linearised DC Power Flow | Electricity | Aggregated |
| 8 | MEDEAS | All | All | - | - | Electricity, Heat, Liquid fuels, Gas, Solid fuels | Aggregated |
| 9 | Oemof | All | All | All | Import, Export, NTC | Electricity, Heat, Natural synthetic gas, hydrogen plus all primary energy sources | Building, transport and industry |
| 10 | OSeMOSYS | All | All | All | None | Electricity | Aggregated |
| 11 | PowerGAMA | All | All | All | Linearised Optimal Power Flow | Electricity | Aggregated |
| 12 | PyPSA | All | All | All | Non-linear, Linear Power Flow, NTC | Any commodity | Aggregated |
| 13 | RETScreen | All | All | Batteries | Central, Isolated, Off-Grid | Electricity and Heat | Building, Industry (and Commercial, Institutional, residential) |
| 14 | SIREN | All | All | All | NTC | Electricity | Aggregated |
| 15 | SWITCH | All | All | All | NTC | Electricity, Hydroelectric flows, Electric Vehicles | Aggregated |
| 16 | urbs | All | All | All | NTC (+ Linearized Load Flow) | Any Commodity | Aggregated |
| Serial | Modelling Tools | Demand Elasticity | Costs * | Market Modelling | Emissions | Software |
|---|---|---|---|---|---|---|
| 1 | Calliope | Inelastic | I, O&M, F, CO2 | Supply-Demand | Any | Python |
| 2 | DESSTinEE | Inelastic | I, O&M, F, CO2 | Spot | CO2 | Excel/Visual Basic for Applications |
| 3 | Dispa-SET | Inelastic | I, O&M, F, CO2 | Supply-Demand | CO2 | Python, GAMS |
| 4 | ELMOD | I, O&M, F, CO2 | Supply-Demand | CO2 | GAMS | |
| 5 | ficus | Inelastic | I, O&M, F, CO2 | Supply-Demand | Any | Python |
| 6 | LEAP | Elastic | I, O&M, F, CO2 | Supply-Demand | Any | Stand-alone |
| 7 | LUSYM | Inelastic | O&M, F, CO2, B | Supply-Demand | CO2 | GAMS & Matlab |
| 8 | MEDEAS | I, O&M, F, CO2 | Post-Keynesian Approach | Any | Python | |
| 9 | Oemof | Inelastic | I, O&M, F, CO2, T, B | Supply-Demand | Any | Python |
| 10 | OSeMOSYS | Inelastic | I, O&M, F, CO2, B | Supply-Demand | Any | GNU MathProg |
| 11 | PowerGAMA | Inelastic | Marginal Costs | Supply-Demand | No (but can be computed) | Python |
| 12 | PyPSA | Inelastic | Capital Cost and Marginal Cost | Supply-Demand | CO2 | Python |
| 13 | RETScreen | Inelastic | I, O&M, F, CO2, T | Supply-Demand | GHG Emission Factor | Windows with .NET |
| 14 | SIREN | Inelastic | I, O&M, F | Supply-Demand | CO2 | Stand-alone |
| 15 | SWITCH | Elastic, Inelastic | I, O&M, F | Supply-Demand | CO2 (optionally including upstream intensity) | Python |
| 16 | urbs | Inelastic | I, O&M, F, CO2, B | No | Any | Python |
Appendix C
| Serial | Abbreviation | Elaboration | Serial | Abbreviation | Elaboration |
|---|---|---|---|---|---|
| 1 | CCS | Carbon Capture and Storage | 13 | Openmod | Open Energy Modelling |
| 2 | CHP | Combined Heat and Power | 14 | OTEC | Ocean Thermal-Energy Conversion |
| 3 | CoP | Coefficient of Performance | 15 | P2G | Power-to-gas |
| 4 | ENSYSTRA | Energy System in Transition | 16 | P2H | Power-to-heat |
| 5 | EV | Electric Vehicle | 17 | P2L | Power-to-liquid |
| 6 | EU | European Union | 18 | P2X | Power-to-X |
| 7 | GHG | Greenhouse Gas | 19 | PV | Photovoltaic |
| 8 | KWH | Kilowatt-hour | 20 | RES | Renewable Energy Sources |
| 9 | LP | Linear Programming | 21 | SC | Sector Coupling |
| 10 | MILP | Mixed-Integer Linear Programming | 22 | STET | Socio-technical Energy Transition |
| 11 | NS | North Sea | 23 | V2G | Vehicle-to-Grid |
| 12 | NTC | Net Transfer Capacity | 24 | UK | United Kingdom |
References
- Pellerin-Carlin, T.; The European Energy Union. Research Handbook on EU Energy Law and Policy; Edward Elgar Publishing: Cheltenham, UK, 2017; pp. 67–102. [Google Scholar]
- Jayaraman, T.; Kanitkar, T. The Paris Agreement. Econ. Political Weekly 2016, 51, 10–13. [Google Scholar]
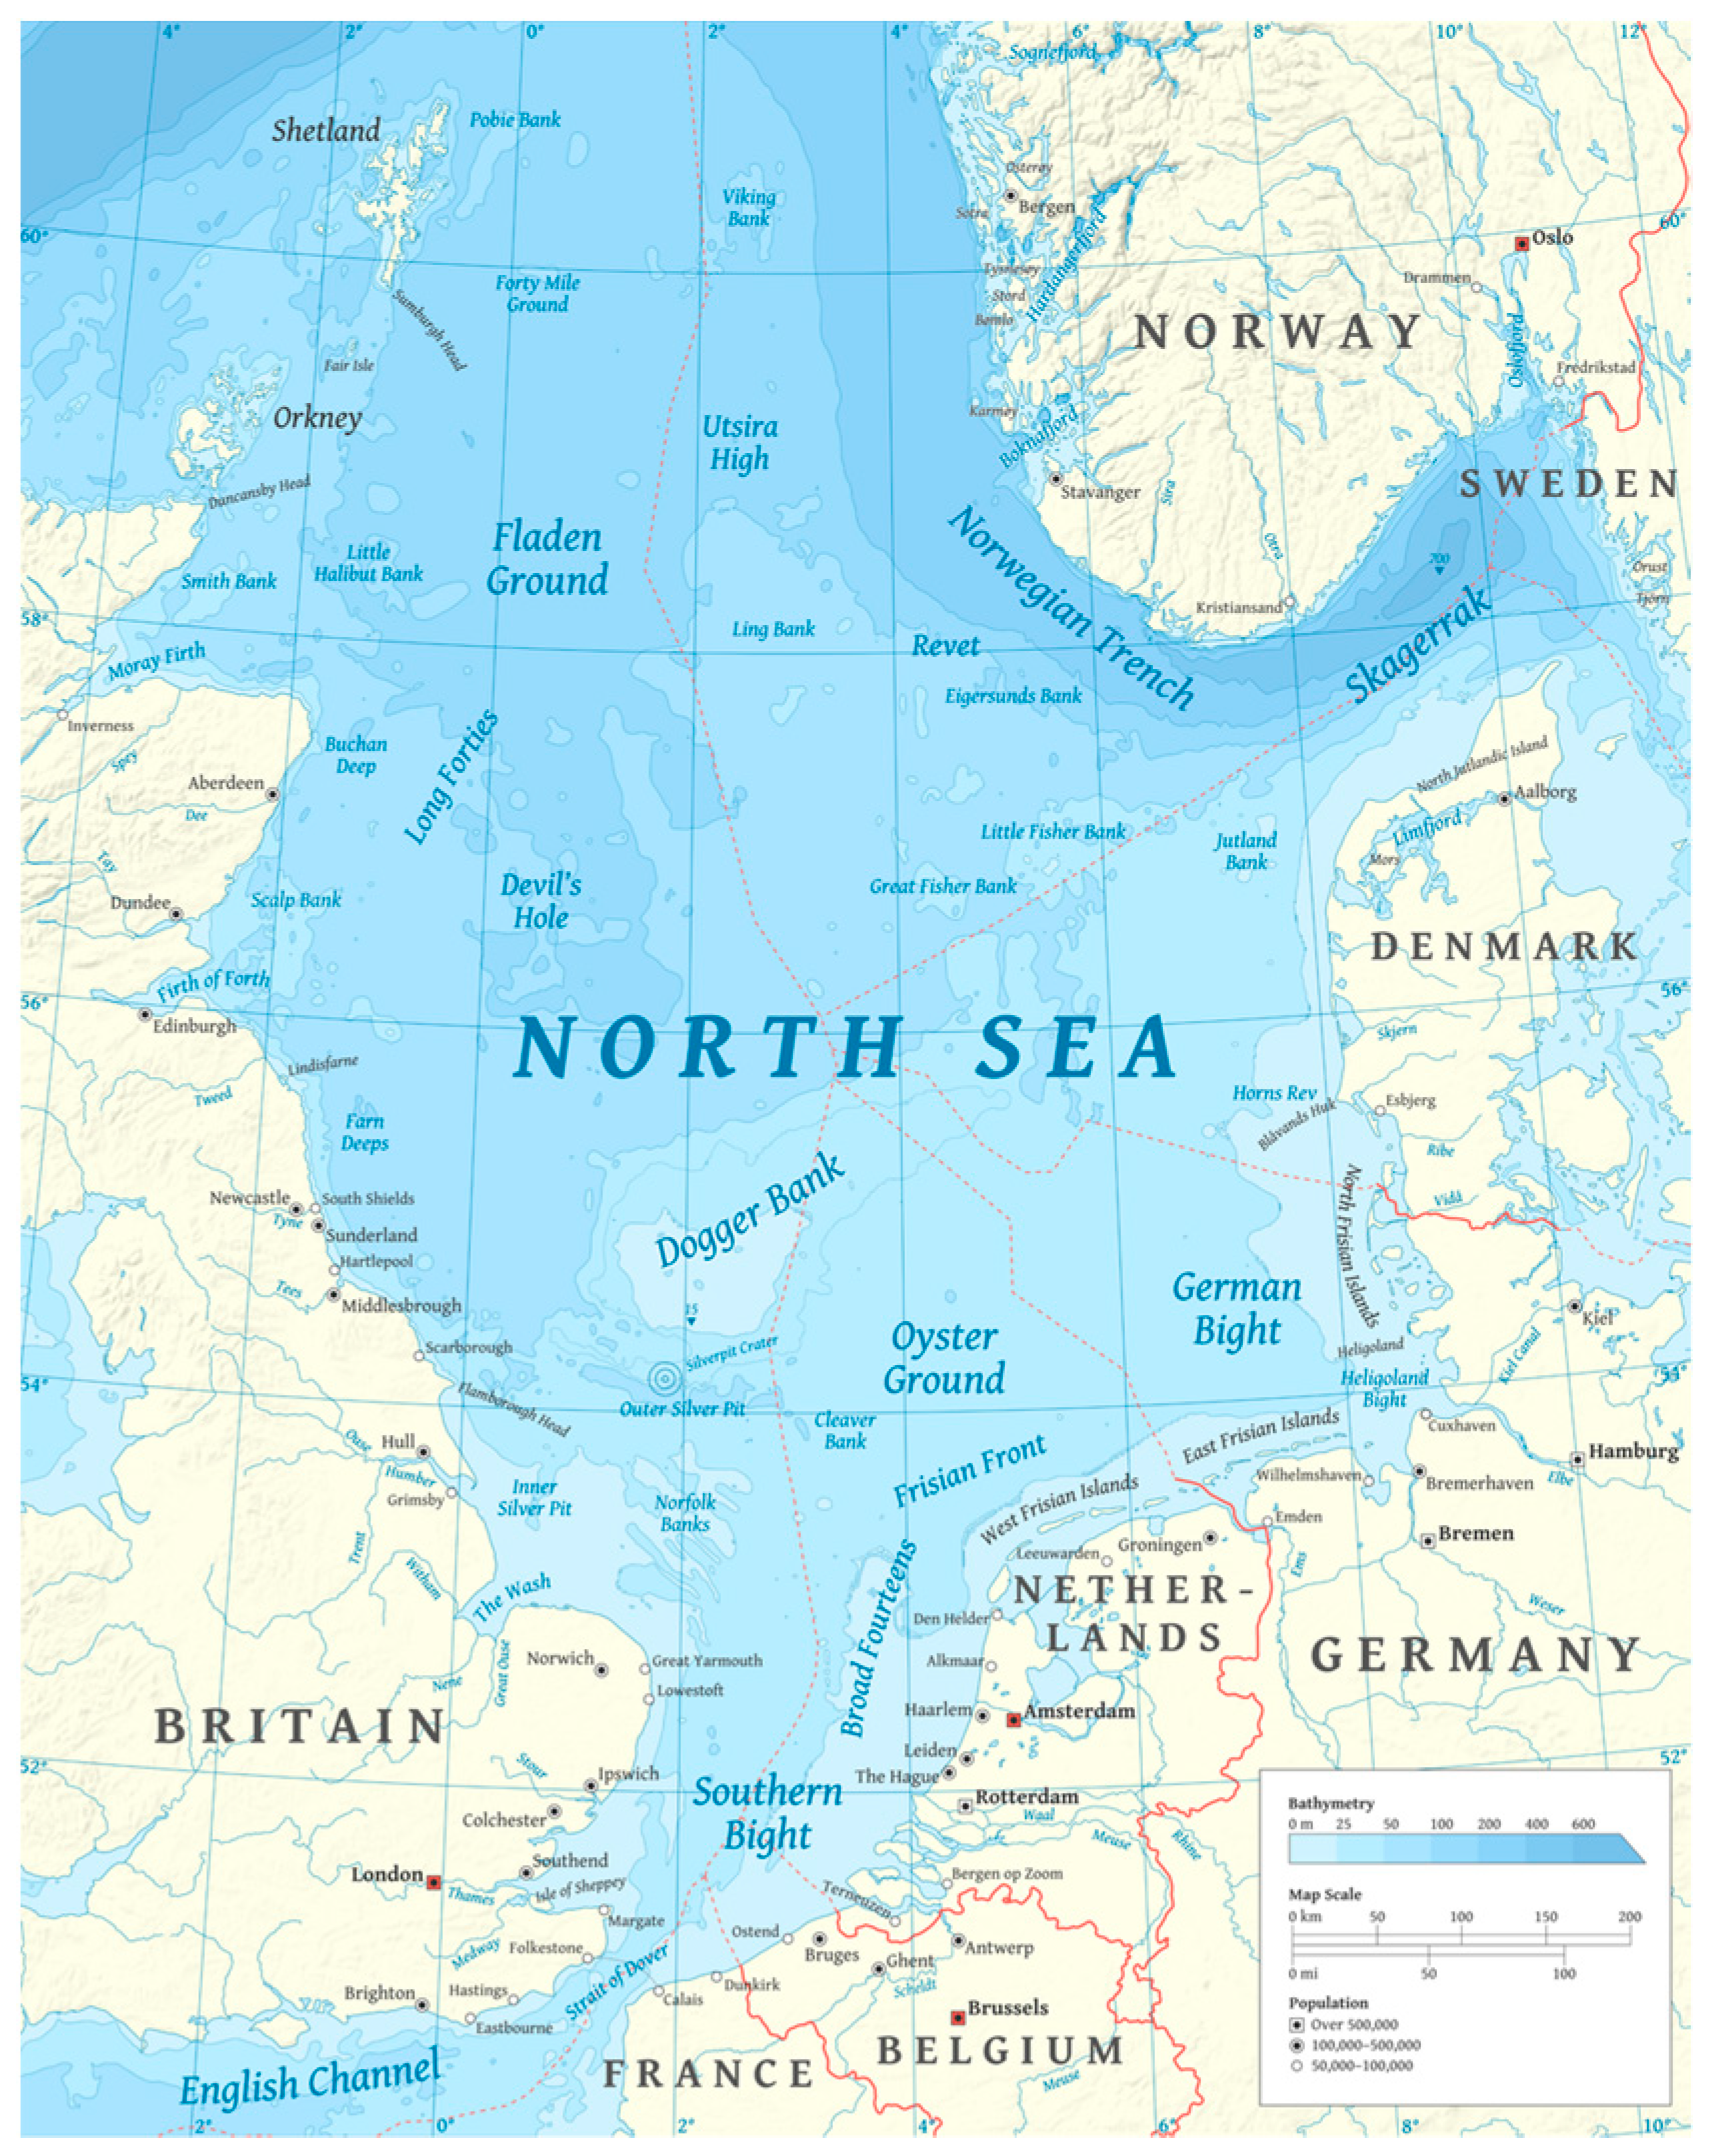
- North Sea Map. Available online: https://commons.wikimedia.org/wiki/File:North_Sea_map-en.png (accessed on 21 August 2019).
- Hajer, M.A.; Pelzer, P. 2050—An Energetic Odyssey: Understanding ‘Techniques of Futuring’ in the transition towards renewable energy. Energy Res. Soc. Sci. 2018, 44, 222–231. [Google Scholar] [CrossRef]
- Hybrid Offshore Energy Transition Options—The Merits and Challenges of Combining Offshore System Integration Options; Synthesis Paper NSE II. 2019, pp. 1–23. Available online: https://www.north-sea-energy.eu/documents/NSE2%20%20Deliverable%20Synthesis%20paper.pdf (accessed on 21 August 2019).
- Europe Powered by Green Energy—How the North Seas Can Lead the Change; Paper by Ørsted A/S, Denmark. 2017, pp. 1–16. Available online: https://orstedcdn.azureedge.net/-/media/WWW/Docs/Corp/COM/About-us/North-seas/rsted-Paper-01---Europe-Powered-by-Green-Energy_UK.ashx?la=en&hash=2CD90870F9B48DF55F2DB3EF51DD6D411873A31F%2C2CD90870F9B48DF55F2DB3EF51DD6D411873A31F&rev=0568da28b1954084b341f2f1827323d7 (accessed on 21 August 2019).
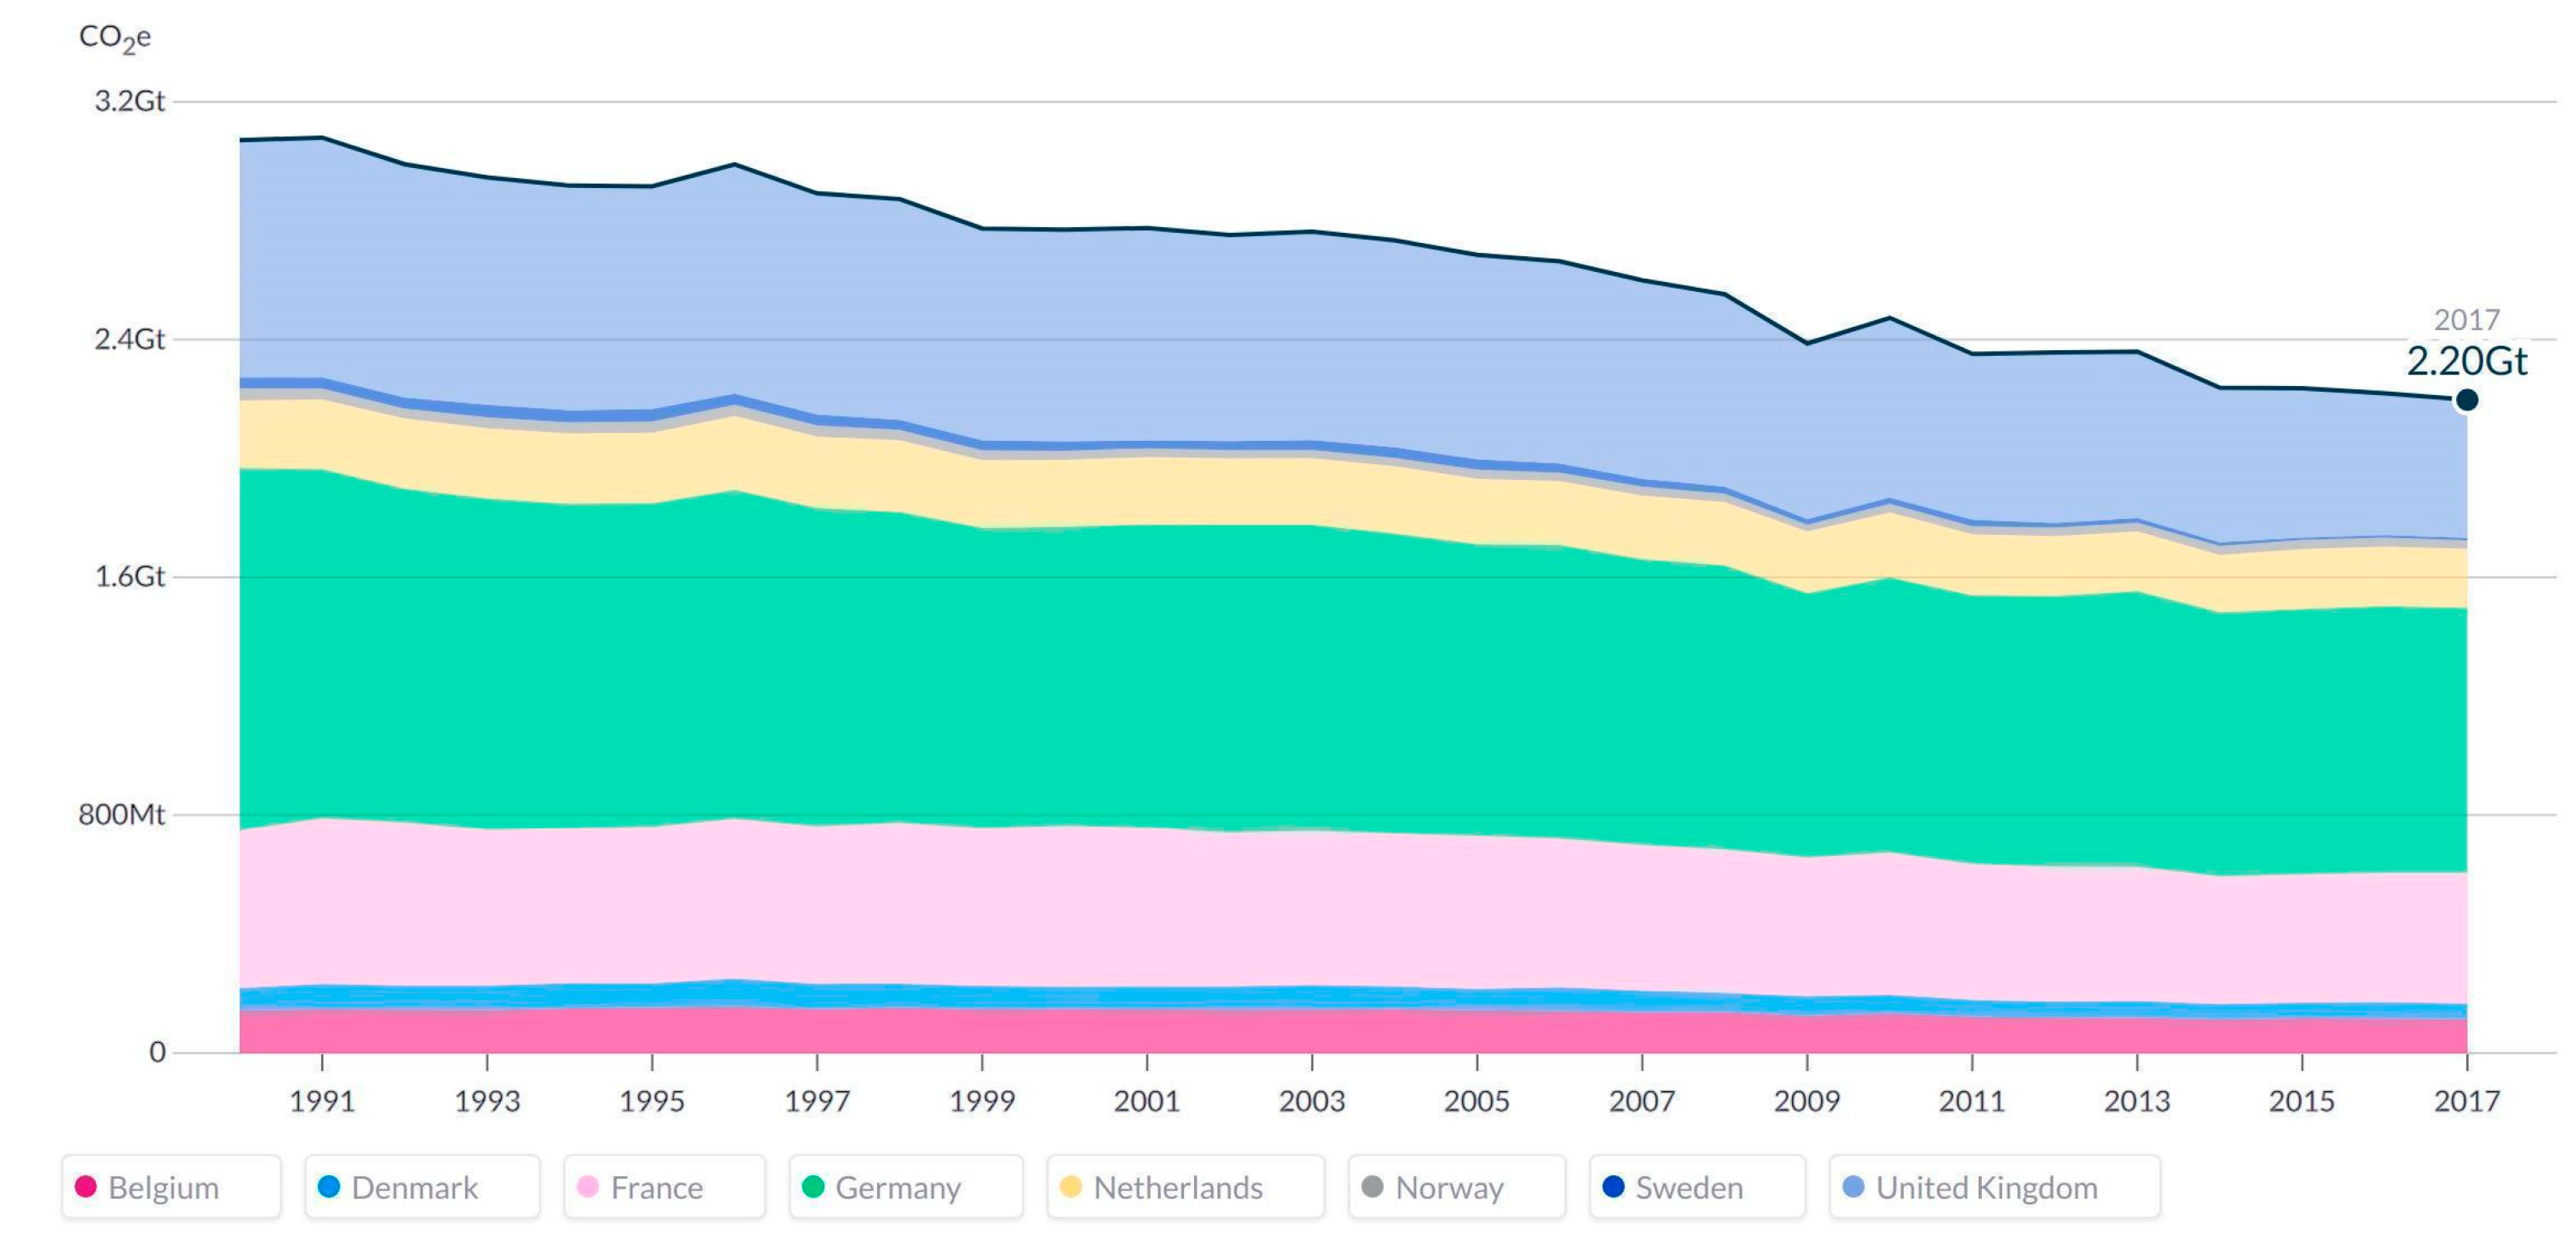
- UNFCCC. Greenhouse Gas Inventory Data—Detailed Data by Party. 2017. Available online: http://di.unfccc.int/detailed_data_by_party (accessed on 21 August 2019).
- Climate Watch; World Resources Institute: Washington, DC, USA, 2018. Available online: https://www.climatewatchdata.org (accessed on 21 August 2019).
- Interreg North Sea Region Project Database. Available online: http://projects.northsearegion.eu/vb/overview/ (accessed on 21 August 2019).
- Energy Systems in Transition. Available online: https://ensystra.eu/ (accessed on 21 August 2019).
- Sector Coupling—Shaping an Integrated Renewable Energy System. 2018. Available online: https://www.cleanenergywire.org/factsheets/sector-coupling-shaping-integrated-renewable-power-system (accessed on 22 August 2019).
- Blundell, D. How Efficient Is a Heat Pump? Available online: https://help.leonardo-energy.org/hc/en-us/articles/203047881-How-efficient-is-a-heat-pump (accessed on 22 August 2019).
- Bundesministerium für Wirtschaft und Energie. Was Bedeutet “Sektorkopplung”? Available online: https://www.bmwi-energiewende.de/EWD/Redaktion/Newsletter/2016/14/Meldung/direkt-erklaert.html (accessed on 22 August 2019).
- A Collective View of the Storage Market. Presentation by Christian Brennig, BVES—German Energy Storage Association. Available online: https://www.german-energy-solutions.de/GES/Redaktion/EN/Publications/Presentations/180718-presentation-ir-norway-bves.pdf (accessed on 22 August 2019).
- Lehmann, H. Energy-Rich Japan; ISSI Report. 2003. Available online: http://www.energyrichjapan.info/pdf/EnergyRichJapan_summary.pdf (accessed on 24 August 2019).
- Lund, H.; Mathiesen, B.V. Energy system analysis of 100% renewable energy systems—The case of Denmark in years 2030 and 2050. Energy 2009, 34, 524–531. [Google Scholar] [CrossRef]
- Lund, H.; Möller, B.; Mathiesen, B.V.; Dyrelund, A. The role of district heating in future renewable energy systems. Energy 2010, 35, 1381–1390. [Google Scholar] [CrossRef]
- Lund, H.; Kempton, W. Integration of renewable energy into the transport and electricity sectors through V2G. Energy Policy 2008, 36, 3578–3587. [Google Scholar] [CrossRef]
- Madlener, R.; Kowalski, K.; Stagl, S. New ways for the integrated appraisal of national energy scenarios: The case of renewable energy use in Austria. Energy Policy 2007, 35, 6060–6074. [Google Scholar] [CrossRef]
- Sørensen, B. A renewable energy and hydrogen scenario for northern Europe. Int. J. Energy Res. 2008, 32, 471–500. [Google Scholar] [CrossRef]
- Krajačić, G.; Martins, R.; Busuttil, A.; Duić, N.; da Graça Carvalho, M. Hydrogen as an energy vector in the islands’ energy supply. Int. J. Hydrogen Energy 2008, 33, 1091–1103. [Google Scholar] [CrossRef]
- Kim, J.; Moon, I. The role of hydrogen in the road transportation sector for a sustainable energy system: A case study of Korea. Int. J. Hydrogen Energy 2008, 33, 7326–7337. [Google Scholar] [CrossRef]
- Mason, I.; Page, S.; Williamson, A. A 100% renewable electricity generation system for New Zealand utilising hydro, wind, geothermal and biomass resources. Energy Policy 2010, 38, 3973–3984. [Google Scholar] [CrossRef]
- Zervos, A.; Lins, C.; Muth, J. RE-Thinking 2050: A 100% Renewable Energy Vision for the European Union; EREC: Brussels, Belgium, 2010. [Google Scholar]
- Connolly, D.; Lund, H.; Mathiesen, B.V.; Leahy, M. The first step towards a 100% renewable energy-system for Ireland. Appl. Energy 2011, 88, 502–507. [Google Scholar] [CrossRef]
- Krajačić, G.; Duić, N.; Zmijarević, Z.; Mathiesen, B.V.; Vučinić, A.A.; da Graça Carvalho, M. Planning for a 100% independent energy system based on smart energy storage for integration of renewables and CO2 emissions reduction. Appl. Therm. Eng. 2011, 31, 2073–2083. [Google Scholar] [CrossRef]
- Liu, W.; Lund, H.; Mathiesen, B.V.; Zhang, X. Potential of renewable energy systems in China. Appl. Energy 2011, 88, 518–525. [Google Scholar] [CrossRef]
- Ćosić, B.; Krajačić, G.; Duić, N. A 100% renewable energy system in the year 2050: The case of Macedonia. Energy 2012, 48, 80–87. [Google Scholar] [CrossRef]
- Henning, H.-M.; Palzer, A. A comprehensive model for the German electricity and heat sector in a future energy system with a dominant contribution from renewable energy technologies—Part I: Methodology. Renew. Sustain. Energy Rev. 2014, 30, 1003–1018. [Google Scholar] [CrossRef]
- Palzer, A.; Henning, H.-M. A comprehensive model for the German electricity and heat sector in a future energy system with a dominant contribution from renewable energy technologies–Part II: Results. Renew. Sustain. Energy Rev. 2014, 30, 1019–1034. [Google Scholar] [CrossRef]
- Garmsiri, S.; Rosen, M.; Smith, G. Integration of Wind Energy, Hydrogen and Natural Gas Pipeline Systems to Meet Community and Transportation Energy Needs: A Parametric Study. Sustainability 2014, 6, 2506–2526. [Google Scholar] [CrossRef]
- Qadrdan, M.; Abeysekera, M.; Chaudry, M.; Wu, J.; Jenkins, N. Role of power-to-gas in an integrated gas and electricity system in Great Britain. Int. J. Hydrogen Energy 2015, 40, 5763–5775. [Google Scholar] [CrossRef]
- Teng, F.; Aunedi, M.; Strbac, G. Benefits of flexibility from smart electrified transportation and heating in the future UK electricity system. Appl. Energy 2016, 167, 420–431. [Google Scholar] [CrossRef]
- Guandalini, G.; Robinius, M.; Grube, T.; Campanari, S.; Stolten, D. Long-term power-to-gas potential from wind and solar power: A country analysis for Italy. Int. J. Hydrogen Energy 2017, 42, 13389–13406. [Google Scholar] [CrossRef]
- Delucchi, M.A.; Jacobson, M.Z. Providing all global energy with wind, water, and solar power, Part II: Reliability, system and transmission costs, and policies. Energy Policy 2011, 39, 1170–1190. [Google Scholar] [CrossRef]
- Connolly, D.; Mathiesen, B.V. A technical and economic analysis of one potential pathway to a 100% renewable energy system. Int. J. Sustain. Energy Plan. Manag. 2014, 1, 7–28. [Google Scholar]
- Mathiesen, B.V.; Lund, H.; Connolly, D.; Wenzel, H.; Østergaard, P.A.; Möller, B.; Nielsen, S.; Ridjan, I.; Karnøe, P.; Sperling, K. Smart Energy Systems for coherent 100% renewable energy and transport solutions. Appl. Energy 2015, 145, 139–154. [Google Scholar] [CrossRef]
- Nastasi, B.; Lo Basso, G. Hydrogen to link heat and electricity in the transition towards future Smart Energy Systems. Energy 2016, 110, 5–22. [Google Scholar] [CrossRef]
- Samsatli, S.; Staffell, I.; Samsatli, N.J. Optimal design and operation of integrated wind-hydrogen-electricity networks for decarbonising the domestic transport sector in Great Britain. Int. J. Hydrogen Energy 2016, 41, 447–475. [Google Scholar] [CrossRef]
- Rogge, M.; Wollny, S.; Sauer, D. Fast Charging Battery Buses for the Electrification of Urban Public Transport—A Feasibility Study Focusing on Charging Infrastructure and Energy Storage Requirements. Energies 2015, 8, 4587–4606. [Google Scholar] [CrossRef]
- Buttler, A.; Spliethoff, H. Current status of water electrolysis for energy storage, grid balancing and sector coupling via power-to-gas and power-to-liquids: A review. Renew. Sustain. Energy Rev. 2018, 82, 2440–2454. [Google Scholar] [CrossRef]
- Schaber, K. Integration of Variable Renewable Energies in the European Power System: A Model-Based Analysis of Transmission Grid Extensions and Energy Sector Coupling. Ph.D. Thesis, Technische Universität München, München, Germany, 2014. [Google Scholar]
- Gils, H.; Simon, S.; Soria, R. 100% renewable energy supply for Brazil—The role of sector coupling and regional development. Energies 2017, 10, 1859. [Google Scholar] [CrossRef]
- Liu, W.; Hu, W.; Lund, H.; Chen, Z. Electric vehicles and large-scale integration of wind power–The case of Inner Mongolia in China. Appl. Energy 2013, 104, 445–456. [Google Scholar] [CrossRef]
- Liu, W.; Lund, H.; Mathiesen, B.V. 2013. Modelling the transport system in China and evaluating the current strategies towards the sustainable transport development. Energy Policy 2013, 58, 347–357. [Google Scholar] [CrossRef]
- Mathiesen, B.V.; Lund, H.; Karlsson, K. 100% Renewable energy systems, climate mitigation and economic growth. Appl. Energy 2011, 88, 488–501. [Google Scholar] [CrossRef]
- Lund, H.; Werner, S.; Wiltshire, R.; Svendsen, S.; Thorsen, J.E.; Hvelplund, F.; Mathiesen, B.V. 4th Generation District Heating (4GDH): Integrating smart thermal grids into future sustainable energy systems. Energy 2014, 68, 1–11. [Google Scholar] [CrossRef]
- Lund, H.; Andersen, A.N.; Østergaard, P.A.; Mathiesen, B.V.; Connolly, D. From electricity smart grids to smart energy systems—A market operation based approach and understanding. Energy 2012, 42, 96–102. [Google Scholar] [CrossRef]
- Connolly, D.; Lund, H.; Mathiesen, B.V.; Werner, S.; Möller, B.; Persson, U.; Boermans, T.; Trier, D.; Østergaard, P.A.; Nielsen, S. Heat Roadmap Europe: Combining district heating with heat savings to decarbonise the EU energy system. Energy Policy 2014, 65, 475–489. [Google Scholar] [CrossRef]
- Xiong, W.; Wang, Y.; Mathiesen, B.V.; Lund, H.; Zhang, X. Heat roadmap China: New heat strategy to reduce energy consumption towards 2030. Energy 2015, 81, 274–285. [Google Scholar] [CrossRef]
- David, A.; Mathiesen, B.V.; Averfalk, H.; Werner, S.; Lund, H. Heat roadmap Europe: Large-scale electric heat pumps in district heating systems. Energies 2017, 10, 578. [Google Scholar] [CrossRef]
- Connolly, D.; Lund, H.; Mathiesen, B.V. Smart Energy Europe: The technical and economic impact of one potential 100% renewable energy scenario for the European Union. Renew. Sustain. Energy Rev. 2016, 60, 1634–1653. [Google Scholar] [CrossRef]
- Lund, H.; Østergaard, P.A.; Connolly, D.; Ridjan, I.; Mathiesen, B.V.; Hvelplund, F.; Thellufsen, J.Z.; Sorknæs, P. Energy storage and smart energy systems. Int. J. Sustain. Energy Plan. Manag. 2016, 11, 3–14. [Google Scholar]
- Brown, T.W.; Bischof-Niemz, T.; Blok, K.; Breyer, C.; Lund, H.; Mathiesen, B.V. Response to ‘Burden of proof: A comprehensive review of the feasibility of 100% renewable-electricity systems’. Renew. Sustain. Energy Rev. 2018, 92, 834–847. [Google Scholar] [CrossRef]
- Lund, H.; Østergaard, P.A.; Connolly, D.; Mathiesen, B.V. Smart energy and smart energy systems. Energy 2017, 137, 556–565. [Google Scholar] [CrossRef]
- Lund, H. Renewable heating strategies and their consequences for storage and grid infrastructures comparing a smart grid to a smart energy systems approach. Energy 2018, 151, 94–102. [Google Scholar] [CrossRef]
- Robinius, M.; Otto, A.; Heuser, P.; Welder, L.; Syranidis, K.; Ryberg, D.S.; Grube, T.; Markewitz, P.; Peters, R.; Stolten, D. Linking the Power and Transport Sectors—Part 1: The Principle of Sector Coupling. Energies 2017, 10, 956. [Google Scholar] [CrossRef]
- Robinius, M.; Otto, A.; Syranidis, K.; Ryberg, D.S.; Heuser, P.; Welder, L.; Grube, T.; Markewitz, P.; Tietze, V.; Stolten, D. Linking the Power and Transport Sectors—Part 2: Modelling a Sector Coupling Scenario for Germany. Energies 2017, 10, 957. [Google Scholar] [CrossRef]
- Brown, T.; Schlachtberger, D.; Kies, A.; Schramm, S.; Greiner, M. 2018. Synergies of sector coupling and transmission reinforcement in a cost-optimised, highly renewable European energy system. Energy 2018, 160, 720–739. [Google Scholar] [CrossRef]
- Charpentier, J.P. A Review of Energy Models No. 1 RR-74-10; IIASA Research Report; IIASA: Laxenburg, Austria, 1974. [Google Scholar]
- Beaujean, J.M.; Charpentier, J.P.; Nakicenovic, N. Global and international energy models: A survey. Annu. Rev. Energy 1977, 2, 153–170. [Google Scholar] [CrossRef]
- Meier, P.M. Energy Systems Analysis for Developing Countries; Springer: Berlin/Heidelberg, Germany, 1984. [Google Scholar]
- Markandya, A. Environmental costs and power system planning. Util. Policy 1990, 1, 13–27. [Google Scholar] [CrossRef]
- Grubb, M.; Edmonds, J.; Ten Brink, P.; Morrison, M. The costs of limiting fossil-fuel CO2 emissions: A survey and analysis. Annu. Rev. Energy Environ. 1993, 18, 397–478. [Google Scholar] [CrossRef]
- Shukla, P.R. Greenhouse gas models and abatement costs for developing nations: A critical assessment. Energy Policy 1995, 8, 677–687. [Google Scholar] [CrossRef]
- Bhattacharyya, S.C. Applied general equilibrium models for energy studies: A survey. Energy Econ. 1996, 18, 145–164. [Google Scholar] [CrossRef]
- Krause, F. The costs of mitigating carbon emissions: A review of methods and findings from European studies. Energy Policy 1996, 24, 899–915. [Google Scholar] [CrossRef]
- Hourcade, J.C.; Robinson, J. Mitigating factors: Assessing the costs of reducing GHG emissions. Energy Policy 1996, 24, 863–873. [Google Scholar] [CrossRef]
- Kelly, D.L.; Kolstad, C.D. Integrated assessment models for climate change control. Int. Yearb. Environ. Resour. Econ. 1999, 171–197. [Google Scholar]
- Van Beeck, N. Classification of Energy Models; Tilburg University, Faculty of Economics and Business Administration: Tilburg, The Netherlands, 2000. [Google Scholar]
- Jebaraj, S.; Iniyan, S. A review of energy models. Renew. Sustain. Energy Rev. 2006, 10, 281–311. [Google Scholar] [CrossRef]
- Connolly, D.; Lund, H.; Mathiesen, B.V.; Leahy, M. A review of computer tools for analysing the integration of renewable energy into various energy systems. Appl. Energy 2010, 87, 1059–1082. [Google Scholar] [CrossRef]
- Pandey, R. Energy policy modelling: Agenda for developing countries. Energy Policy 2002, 30, 97–106. [Google Scholar] [CrossRef]
- Bahn, O.; Haurie, A.; Zachary, D.S. Mathematical modeling and simulation methods in energy systems. In Groupe D’études Et De Rech. En Anal. Des Décisions; HEC Montréal: Montréal, QC, Canada, 2004. [Google Scholar]
- Nakata, T. Energy-economic models and the environment. Prog. Energy Combust. Sci. 2004, 30, 417–475. [Google Scholar] [CrossRef]
- Ventosa, M.; Baıllo, A.; Ramos, A.; Rivier, M. Electricity market modeling trends. Energy Policy 2005, 33, 897–913. [Google Scholar] [CrossRef]
- Urban, F.R.M.J.; Benders, R.M.J.; Moll, H.C. Modelling energy systems for developing countries. Energy Policy 2007, 35, 3473–3482. [Google Scholar] [CrossRef]
- Hiremath, R.B.; Shikha, S.; Ravindranath, N.H. Decentralized energy planning; modeling and application—A review. Renew. Sustain. Energy Rev. 2007, 11, 729–752. [Google Scholar] [CrossRef]
- Sensfuß, F.; Ragwitz, M. An agent-based simulation platform as support tool for the analysis of the interactions of renewable electricity generation with the electricity and CO2 market. In Proceedings of the New methods for Energy Market Modelling, Karlsruhe, Germany, 26 October 2007; pp. 63–76. [Google Scholar]
- Van Ruijven, B.; Urban, F.; Benders, R.M.; Moll, H.C.; Van Der Sluijs, J.P.; De Vries, B.; Van Vuuren, D.P. Modeling energy and development: An evaluation of models and concepts. World Dev. 2008, 36, 2801–2821. [Google Scholar] [CrossRef]
- Möst, D.; Keles, D. A survey of stochastic modelling approaches for liberalised electricity markets. Eur. J. Oper. Res. 2010, 207, 543–556. [Google Scholar] [CrossRef]
- Foley, A.M.; Gallachóir, B.Ó.; Hur, J.; Baldick, R.; McKeogh, E.J. A strategic review of electricity systems models. Energy 2010, 35, 4522–4530. [Google Scholar] [CrossRef]
- Bhattacharyya, S.C.; Timilsina, G.R. A review of energy system models. Int. J. Energy Sect. Manag. 2010, 4, 494–518. [Google Scholar] [CrossRef]
- Bazmi, A.A.; Zahedi, G. Sustainable energy systems: Role of optimization modeling techniques in power generation and supply—A review. Renew. Sustain. Energy Rev. 2011, 15, 3480–3500. [Google Scholar] [CrossRef]
- Keirstead, J.; Jennings, M.; Sivakumar, A. A review of urban energy system models: Approaches, challenges and opportunities. Renew. Sustain. Energy Rev. 2012, 16, 3847–3866. [Google Scholar] [CrossRef]
- DeCarolis, J.F.; Hunter, K.; Sreepathi, S. The case for repeatable analysis with energy economy optimization models. Energy Econ. 2012, 34, 1845–1853. [Google Scholar] [CrossRef]
- Suganthi, L.; Samuel, A.A. Energy models for demand forecasting—A review. Renew. Sustain. Energy Rev. 2012, 16, 1223–1240. [Google Scholar] [CrossRef]
- Hedenus, F.; Johansson, D.; Lindgren, K. A critical assessment of Energy-economy-climate models for policy analysis. J. Appl. Econ. Bus. Res. 2013, 3, 118–132. [Google Scholar]
- Pfenninger, S.; Hawkes, A.; Keirstead, J. Energy systems modeling for twenty-first century energy challenges. Renew. Sustain. Energy Rev. 2014, 33, 74–86. [Google Scholar] [CrossRef]
- Olanrewaju, O.A.; Jimoh, A.A. Review of energy models to the development of an efficient industrial energy model. Renew. Sustain. Energy Rev. 2014, 30, 661–671. [Google Scholar] [CrossRef]
- Li, F.G.; Trutnevyte, E.; Strachan, N. A review of socio-technical energy transition (STET) models. Technol. Forecast. Soc. Chang. 2015, 100, 290–305. [Google Scholar] [CrossRef]
- Sinha, S.; Chandel, S.S. Review of recent trends in optimization techniques for solar photovoltaic–wind based hybrid energy systems. Renew. Sustain. Energy Rev. 2015, 50, 755–769. [Google Scholar] [CrossRef]
- Després, J.; Hadjsaid, N.; Criqui, P.; Noirot, I. Modelling the impacts of variable renewable sources on the power sector: Reconsidering the typology of energy modelling tools. Energy 2015, 80, 486–495. [Google Scholar] [CrossRef]
- Van Beuzekom, I.; Gibescu, M.; Slootweg, J.G. A review of multi-energy system planning and optimization tools for sustainable urban development. In Proceedings of the 2015 IEEE Eindhoven Power Tech, Eindhoven, Netherlands, 29 June–2 July 2015; pp. 1–7. [Google Scholar]
- Hall, L.M.; Buckley, A.R. A review of energy systems models in the UK: Prevalent usage and categorisation. Appl. Energy 2016, 169, 607–628. [Google Scholar] [CrossRef]
- Mahmud, K.; Town, G.E. A review of computer tools for modeling electric vehicle energy requirements and their impact on power distribution networks. Appl. Energy 2016, 172, 337–359. [Google Scholar] [CrossRef]
- Sola, A.; Corchero, C.; Salom, J.; Sanmarti, M. Simulation Tools to Build Urban-Scale Energy Models: A Review. Energies 2018, 11, 3269. [Google Scholar] [CrossRef]
- Ringkjøb, H.K.; Haugan, P.M.; Solbrekke, I.M. A review of modelling tools for energy and electricity systems with large shares of variable renewables. Renew. Sustain. Energy Rev. 2018, 96, 440–459. [Google Scholar] [CrossRef]
- Lopion, P.; Markewitz, P.; Robinius, M.; Stolten, D. A review of current challenges and trends in energy systems modeling. Renew. Sustain. Energy Rev. 2018, 96, 156–166. [Google Scholar] [CrossRef]
- Open Models. Available online: https://wiki.openmod-initiative.org/wiki/Open_Models#List_of_models (accessed on 3 September 2019).
- Openmod in a Nutshell. Available online: http://openmod-initiative.org/manifesto (accessed on 3 September 2019).
- Pfenninger, S.; Hirth, L.; Schlecht, I.; Schmid, E.; Wiese, F.; Brown, T.; Davis, C.; Gidden, M.; Heinrichs, H.; Heuberger, C.; et al. 2018. Opening the black box of energy modelling: Strategies and lessons learned. Energy Strategy Rev. 2018, 19, 63–71. [Google Scholar] [CrossRef]
- Openmod Open Energy Modelling Initiative. Available online: https://www.openmod-initiative.org/ (accessed on 3 September 2019).
- Calliope: A Multi-Scale Energy Systems Modelling Framework. Available online: https://sites.google.com/site/2050desstinee/ (accessed on 30 October 2019).
- 2050 Desstinee. Available online: https://calliope.readthedocs.io/en/stable/ (accessed on 30 October 2019).
- The Dispa-SET Model. Available online: http://www.dispaset.eu/en/latest/index.html (accessed on 30 October 2019).
- Energy, Transportation, Environment Department Models. Available online: https://www.diw.de/en/diw_01.c.599753.en/models.html (accessed on 30 October 2019).
- Ficus: A (Mixed Integer) Linear Optimisation Model for Local Energy Systems. Available online: https://ficus.readthedocs.io/en/latest/ (accessed on 30 October 2019).
- LEAP. Available online: https://www.energycommunity.org/default.asp?action=introduction (accessed on 30 October 2019).
- Van den Bergh, K.; Bruninx, K.; Delarue, E.; D’haeseleer, W. LUSYM: A unit commitment model formulated as a mixed-integer linear program. Ku Leuventme Branch Work. Pap. 2016, 7, 1–20. [Google Scholar]
- MEDEAS—Modelling the Energy Development under Environmental and Socioeconomic Constraints. Available online: https://www.medeas.eu/ (accessed on 31 October 2019).
- Oemof—Open Energy Modelling Framework. Available online: https://oemof.org/ (accessed on 4 September 2019).
- Oemof Community (on Github). Available online: https://github.com/oemof (accessed on 4 September 2019).
- Oemof Documentation. Available online: https://oemof.readthedocs.io/en/stable/ (accessed on 4 September 2019).
- OSeMOSYS Documentation. Available online: https://osemosys.readthedocs.io/en/latest/index.html (accessed on 31 October 2019).
- Svendsen, H.G.; Spro, O.C. PowerGAMA: A new simplified modelling approach for analyses of large interconnected power systems, applied to a 2030 Western Mediterranean case study. J. Renew. Sustain. Energy 2016, 8, 055501. [Google Scholar] [CrossRef]
- PyPSA. Available online: https://pypsa.org/ (accessed on 31 October 2019).
- RETScreen. Available online: https://www.nrcan.gc.ca/energy/retscreen/7465 (accessed on 31 October 2019).
- Modelling Overview—The SIREN Toolkit and More. Available online: https://www.sen.asn.au/modelling_overview (accessed on 31 October 2019).
- Switch Power System Planning Model. Available online: http://switch-model.org/ (accessed on 31 October 2019).
- urbs: A Linear Optimisation Model for Distributed Energy Systems. Available online: https://urbs.readthedocs.io/en/latest/index.html (accessed on 31 October 2019).
- Bird, L.; Milligan, M.; Lew, D. Integrating Variable Renewable Energy: Challenges and Solutions (No. NREL/TP-6A20-60451); National Renewable Energy Lab.(NREL): Golden, CO, USA, 2013. [Google Scholar]
- Maruf, M.N.I.; Munoz, L.H.; Nguyen, P.H.; Ferreira, H.L.; Kling, W.L. An enhancement of agent-based power supply-demand matching by using ann-based forecaster. In Proceedings of the IEEE PES ISGT Europe, Lyngby, Denmark, 6–9 October 2013; pp. 1–5. [Google Scholar]
- Zunnurain, I.; Maruf, M.; Rahman, M.; Shafiullah, G.M. Implementation of advanced demand side management for microgrid incorporating demand response and home energy management system. Infrastructures 2018, 3, 50. [Google Scholar] [CrossRef]
- Rahman, M.; Cecchi, V.; Miu, K. Power handling capabilities of transmission systems using a temperature-dependent power flow. Electr. Power Syst. Res. 2019, 169, 241–249. [Google Scholar] [CrossRef]
- Rahman, M.; Braun, C.; Cecchi, V. Determination of Transmission Line Power Transfer Capabilities Using Temperature Dependent Continuation Power Flow. In Proceedings of the 2018 IEEE Power & Energy Society General Meeting (PESGM), Portland, OR, USA, 5–10 August 2018; pp. 1–5. [Google Scholar]
- Hilpert, S.; Kaldemeyer, C.; Krien, U.; Günther, S.; Wingenbach, C.; Plessmann, G. The Open Energy Modelling Framework (oemof)-A new approach to facilitate open science in energy system modelling. Energy Strategy Rev. 2018, 22, 16–25. [Google Scholar] [CrossRef]
- Möller, C.; Kuhnke, K.; Reckzugel, M.; Pfisterer, H.-J.; Rosenberger, S. Energy Storage Potential in the Northern German Region Osnabrück-steinfurt. In Proceedings of the IEEE International Energy and Sustainability Conference (IESC), Cologne, Germany, 30 June–1 July 2016; pp. 1–7. [Google Scholar]
- Müller;, U.P.; Cussmann, I.; Wingenbach, C.; Wendiggensen, J. Power Flow Simulations within an Open Data Model of a High Voltage Grid. In Advances and New Trends in Environmental Informatics; Progress in IS; Springer: Cham, Switzerland, 2017; pp. 181–193. [Google Scholar]
- Bunke, W.D.; Christ, M.; Degel, M. VerNetzen: Sozial-ökologische und technisch-ökonomische Modellierung von Entwicklungspfaden der Energiewende. Wissenschaftsdialog 2014, 107–128, The report is from a Workshop. [Google Scholar]
- Wingenbach, C.; Hilpert, S.; Günther, S. openMod.SH-ein regionales Strom-Wärme-Modell für Schleswig-Holstein basierend auf open source und open data. In Proceedings of the 14th Symposium on Energy Innovation, Graz, Austria, 10–12 February 2016. [Google Scholar]
- Kaldemeyer, C.; Boysen, C.; Tuschy, I. Compressed Air Energy Storage in the German Energy System–Status Quo & Perspectives. Energy Procedia 2016, 99, 298–313. [Google Scholar]
- Arnhold, O.; Fleck, M.; Goldammer, K.; Grüger, F.; Hoch, O.; Schachler, B. Transformation of the German energy and transport sector–a national analysis. In Netzintegration der Elektromobilität; Springer: Wiesbaden, Germany, 2017; pp. 9–21. [Google Scholar]
- Renpass—Renewable Energy Pathway Simulation System (on Github). Available online: https://github.com/znes/renpass (accessed on 5 September 2019).
- appBBB—An Oemof Application to Model the Heat and Power Systems of Brandenburg and Berlin (On Github). Available online: https://github.com/rl-institut/appBBB (accessed on 5 September 2019).
- HESYSOPT—A Heating System Simulation Tool (On Github). Available online: https://github.com/znes/HESYSOPT (accessed on 5 September 2019).
- Hilpert, S. HESYSOPT—An open source tool to support district heating system flexibilisation. In Environmental Informatics-Stability, Continuity, Innovation: Current Trends and Future Perspectives Based On 30 Years of History; Shaker Verlag Publishing House: Aachen, Germany, 2016; pp. 361–366. [Google Scholar]
- Wingenbach, C.; Hilpert, S.; Günther, S. The core concept of the Open Energy Modelling Framework (oemof). In Environmental Informatics-Stability, Continuity, Innovation: Current Trends and Future Perspectives Based On 30 Years of History; Shaker Verlag Publishing House: Aachen, Germany, 2016; pp. 361–366. [Google Scholar]


| Serial | Tool | Methodology | Temporal Resolution | Sectoral Coverage | Demand Response |
|---|---|---|---|---|---|
| 1 | Calliope | Linear Programming (LP) | User-defined | - | √ |
| 2 | DESSTinEE (Demand for Energy Services, Supply and Transmission in Europe) | Simulation | Hourly | - | - |
| 3 | Dispa-SET (Unit commitment and Dispatch model. SET refers to the European Strategic Energy Technology Plan) | LP, Mixed-Integer Linear Programming (MILP) | Hourly | √ | √ |
| 4 | ELMOD (Electricity Sector Model Family) | LP, MILP | Hourly | √ | - |
| 5 | ficus | MILP | 15 Minutes | √ | - |
| 6 | LEAP (Long-range Energy Alternatives Planning) | Simulation and Optimization | Yearly | √ | - |
| 7 | LUSYM (Leuven University System Modeling) | MILP | 15 Minutes, Hourly, Daily, Weekly | - | √ |
| 8 | MEDEAS (Modelling the Energy Development under Environmental and Social Constraints) | Mixed | Yearly | √ | - |
| 9 | Oemof (Open Energy Modelling Framework) | LP, MILP, Partial Equilibrium | User-defined | √ | √ |
| 10 | OSeMOSYS (Open Source Energy Modeling System) | LP | User-defined | - | √ |
| 11 | PowerGAMA (Power Grid and Market Analysis) | Simulation, LP | Hourly | - | - |
| 12 | PyPSA Python for Power System Analysis | LP | User-defined | √ | √ |
| 13 | RETScreen (RET refers to Renewable-energy and Energy-efficient Technologies) | Simulation | Daily, Monthly, Yearly | - | - |
| 14 | SIREN (SEN Integrated Renewable Energy Network. SEN refers to the Organization ‘Sustainable Energy Now Inc.’) | Simulation | Hourly | - | - |
| 15 | SWITCH (Solar, Wind, Transmission, Conventional Generation and Hydroelectricity) | MILP | Hourly | √ | √ |
| 16 | urbs (Urban Energy Systems) | LP | User-defined | √ | √ |
© 2019 by the author. Licensee MDPI, Basel, Switzerland. This article is an open access article distributed under the terms and conditions of the Creative Commons Attribution (CC BY) license (http://creativecommons.org/licenses/by/4.0/).
Share and Cite
Maruf, M.N.I. Sector Coupling in the North Sea Region—A Review on the Energy System Modelling Perspective. Energies 2019, 12, 4298. https://doi.org/10.3390/en12224298
Maruf MNI. Sector Coupling in the North Sea Region—A Review on the Energy System Modelling Perspective. Energies. 2019; 12(22):4298. https://doi.org/10.3390/en12224298
Chicago/Turabian StyleMaruf, Md. Nasimul Islam. 2019. "Sector Coupling in the North Sea Region—A Review on the Energy System Modelling Perspective" Energies 12, no. 22: 4298. https://doi.org/10.3390/en12224298
APA StyleMaruf, M. N. I. (2019). Sector Coupling in the North Sea Region—A Review on the Energy System Modelling Perspective. Energies, 12(22), 4298. https://doi.org/10.3390/en12224298