Article

Numerical Study of Highly Viscous Fluid Sloshing in the Real-Scale Membrane-Type Tank

1
State Key Laboratory of Hydraulics and Mountain River Engineering, Sichuan University, Chengdu 610065, China
2
Key Laboratory of Fluid and Power Machinery, Ministry of Education, Xihua University, Chengdu 610039, China
3
College of Energy, Chengdu University of Technology, Chengdu 610059, China
*
Author to whom correspondence should be addressed.
Energies 2019, 12(22), 4244; https://doi.org/10.3390/en12224244
Submission received: 20 September 2019 / Revised: 2 November 2019 / Accepted: 4 November 2019 / Published: 7 November 2019

Abstract

:
The highly viscous liquid (glycerin) sloshing is investigated numerically in this study. The full-scale membrane-type tank is considered. The numerical investigation is performed by applying a two-phase numerical model based on the spatially averaged Navier-Stokes equations. Firstly, the numerical model is validated against the available numerical model and a self-conducted experiment then is applied to systematically investigate the full-scale sloshing. In this study, two filling levels (50% and 70% of the tank height) are considered. The fluid kinematic viscosity is fixed at a value being 6.0 × 10⁻⁵ m2/s with comparative value to that of the crude oil. A wide range of forcing periods varying from 8.0 s to 12.0 s are used to identify the response process of pressures as well as free surface displacements. The pressures are analyzed along with breaking free surface snapshots and corresponding pressure distributions. The slamming effects are also demonstrated. Finally, the frequency response is further identified by the fast Fourier transformation technology.

Graphical Abstract

1. Introduction

Liquid sloshing in partially filled LNG (Liquefied Natural Gas)/crude-oil carriers may occur under different sea conditions. The highly nonlinear phenomenon can produce localized high impact loads on tank walls, potentially leading to structural damage. Hence, it is necessary to investigate the sloshing phenomena and associated structural behavior in the design of tanks.
For the analysis of the sloshing phenomenon, the model test can be undertaken under different sea conditions and filling levels. However, there exists uncertainty when the measured impact load from the model test is scaled up to the real size [1], and the liquid viscosity also has important effects on sloshing pressure [2,3,4]. The analytical works are mainly divided into two scenarios, one the linear potential flow theory including ideal and quasi-viscous liquid sloshing [5], and the other is nonlinear potential flow theory [6,7,8]. The real-viscous sloshing was also considered by Wu et al. [9] by neglecting the nonlinear advection terms, and the linear sloshing was obtained. However, the nonlinear viscous sloshing remains to be well solved.
Besides the model tests and analytical analysis, numerical methods are alternative tools in understanding the relevant sloshing problems. Rudman et al. used the smoothed particle hydrodynamics (SPH) to simulate sloshing in a 2-D water model that is a representation of a scaled LNG tank [10]. Luo et al. used the Consistent Particle Method (CPM) to study water sloshing in a scaled LNG tank under translational excitation [11]. Zhao et al. [12] investigated the motion induced by 3D sloshing in a partially-filled LNG tank using a new coupled Level-Set and Volume-of-Fluid (CLSVOF) method incorporated into Finite-Analytic Navier–Stokes (FANS) method. Kim et al. [13] developed a three-dimensional finite-element method to calculate the impact pressure due to liquid sloshing in the LNG tank. The effects of liquid viscosity on sloshing were obtained by Zou et al. [3], and the results also revealed that the boundary layer had significant influences on the response pressures. Xin and Lin [14] adopted the spatially averaged Navier-Stokes turbulence model to study the viscous effects on horizontally and multi-degree freedom excited sloshing, and the threshold of liquid viscosity that the response regularity shifts were obtained numerically.
Although there are many studies on viscous effects, the full-scale sloshing is rarely reported. Considering this situation, the present work focuses on the full-scale sloshing of highly viscous fluids. The 3D numerical model called NEWTANK developed by Liu and Lin [15] will be used to perform numerical investigations, and the full-scale prismatic tank is chosen. The two-phase fluid flow model solves the spatially averaged Navier-Stokes equations. The second-order accurate Volume-of-Fluid (VOF) method is used to track the distorted and broken free surface. The large-eddy simulation (LES) is used for turbulence modeling. The numerical validations of the sloshing especially the highly viscous fluids will be carried out with a self-conducted experiment test and available numerical data, and then the sloshing of the real-scale membrane-type tank was studied. Numerical experiments will be conducted for two different filling levels (50% and 70% of the tank height). The kinematic viscosity of the liquid is selected from the crude oil and its value is 6.0 × 10⁻⁵ m2/s, which is 60 times the water. A wide range of forcing periods varying from 8.0 s to 12.0 s are used to identify the response process of pressures as well as free surface displacements. The free surface displacements and pressures are analyzed with the nonlinearity being further discussed. The frequency responses are also identified by the fast Fourier transformation technology.

2. Numerical Methodology

In the present model, the motion of an incompressible fluid is described by Navier–Stokes equations in which turbulence is modeled LES (Large Eddy Simulation) method. The non-inertial reference frame that follows the tank motion is adopted to avoid the moving complicated boundary. The Navier-Stokes equations in this study are summarized below:
u ¯ i x i = 0
u ¯ i t + u ¯ i u ¯ j x j = 1 ρ p ¯ x i + f i + 1 ρ τ ¯ i j x j + 1 ρ τ i j r x j
where u ¯ i is the spatially averaged flow velocity in i direction, p ¯ is the effective pressure and ρ is the liquid density, f i is the i-th component of the external acceleration.
The LES method is employed to capture turbulence transport and dissipation in this model. After being filtered by the spatial filter top-hat function, the sub-grid stress terms appear in the momentum equations, which can be modeled by the Smagorinsky sub-grid scale model, where τ ¯ i j = 2 ρ ν σ ¯ i j is the molecular viscous stress tensor with ν being the kinematic viscosity and τ i j r = 2 ρ ν t σ ¯ i j is SGS Reynolds stress tensor. In the above definition, σ ¯ i j = 1 2 ( u ¯ i x j + u ¯ j x i ) is the rate of strain of the filtered flow. ν t represents the eddy viscosity and is modeled as:
ν t = l s 2 ( 2 σ ¯ i j σ ¯ i j )
where l s is the characteristic length scale which equals C s Δ with C s = 0.5 [16] and Δ is written as:
Δ = Δ x Δ y Δ z 3
where Δ x , Δ y and Δ z are the grid lengths in the three directions.
The external force f i includes the gravitational acceleration, translational and rotational inertia forces, whose expression can be found in Liu and Lin [15] and Liu [17], and the components are given as follows:
f x = g x d u d t [ d Ω y d t ( z z 0 ) d Ω z d t ( y y 0 ) ] { Ω y [ Ω x ( y y 0 ) Ω y ( x x 0 ) ] Ω z [ Ω z ( x x 0 ) Ω x ( z z 0 ) ] } ( 2 Ω y d ( z z 0 ) d t 2 Ω z d ( y y 0 ) d t )
f y = g y d v d t [ d Ω z d t ( x x 0 ) d Ω x d t ( z z 0 ) ] { Ω z [ Ω y ( z z 0 ) Ω z ( y y 0 ) ] Ω x [ Ω x ( y y 0 ) Ω y ( x x 0 ) ] } ( 2 Ω z d ( x x 0 ) d t 2 Ω x d ( z z 0 ) d t )
f z = g z d w d t [ d Ω x d t ( y y 0 ) d Ω y d t ( x x 0 ) ] { Ω x [ Ω z ( x x 0 ) Ω x ( z z 0 ) ] Ω y [ Ω y ( z z 0 ) Ω z ( y y 0 ) ] } ( 2 Ω x d ( y y 0 ) d t 2 Ω y d ( x x 0 ) d t )
where g = g ( g x , g y , g z ) , U = U ( u , v , w ) and Ω = Ω ( Ω x , Ω y , Ω z ) are gravitational vector, translational velocity, and rotational velocity vector, respectively. r and R are the position vector of the considered point and the rotational motion origin, respectively.
The above governing equations are solved by the two-step projection method originally proposed by Chorin [18]. The free surface is tracked by the second-order accurate Volume-Of-Fluid (VOF) method [19]. A combination of the upwind scheme and the central difference scheme is adopted in the discretization of the convection terms. A second-order central difference scheme is used for the diffusion terms. Readers are referred to [15] for more details of numerical implementation.

3. Model Validations

3.1. Validation of Sloshing of Glycerin under Surge Excitation

The low viscous liquid has been extensively investigated. Higher viscosity has also attracted much attention. To verify the accuracy of the present numerical model in handling the sloshing of highly viscous liquid, the experimental model test is performed in the Laboratory of Vibration Test and Liquid Sloshing at Hohai University of China [20] and Glycerin at 35 °C in degrees Celsius unit is chosen as the experimental liquid. The corresponding physical properties-viscosity and density are 0.000408 m2/s and 1252.2 kg/m3, respectively. The experimental tank is rectangular with dimensions 0.6 m in length, 0.3 m in width and 0.6 m in height. In the numerical simulation, the computational domain 0.6 m × 0.3 m × 0.35m is discretized into 64 × 40 × 76 non-uniform grids with a minimal grid size of 0.0025m near the bottom and walls. The no-slip velocity boundary condition is adopted accordingly. The displacement of the tank follows the harmonic function s = A cos ( ω h t ) , where A = 0.03   m and ω h = ω 1 , 0 = 5.3483   r a d / s according to the dispersion relationship:
ω m n 2 = ( m g π L ) 2 + ( n g π W ) 2 tanh ( m π h L ) 2 + ( n π h W ) 2 ( m , n = 0 , 1 , 2 )
where L and W are tank length and tank width, respectively.
The comparisons of dynamic pressures between the numerical result and experimental data at the left wall 0.03 m and 0.07 m away from the bottom are shown in Figure 1. The numerical results overestimate the experimental data a little in the crests. However, there exists no phase shift between the two results. The difference may due to the present numerical results neglect the unevenness of the tank walls. Overall, the difference between the two results is negligible.
Besides the dynamic pressures, the free surface snapshots of the numerical results at 2.5 s, 5.0 s, 10.0 s, and 15.0 s are further demonstrated in Figure 2. The wavelength is twice the tank length. The free surfaces of glycerin break significantly under the excitation. Due to strong viscous effect, the liquid has adhered to side walls, obvious 3D features were guaranteed although the excitation was only one dimension.

3.2. Validation of Membrane-Type Tank Sloshing under Roll Excitation

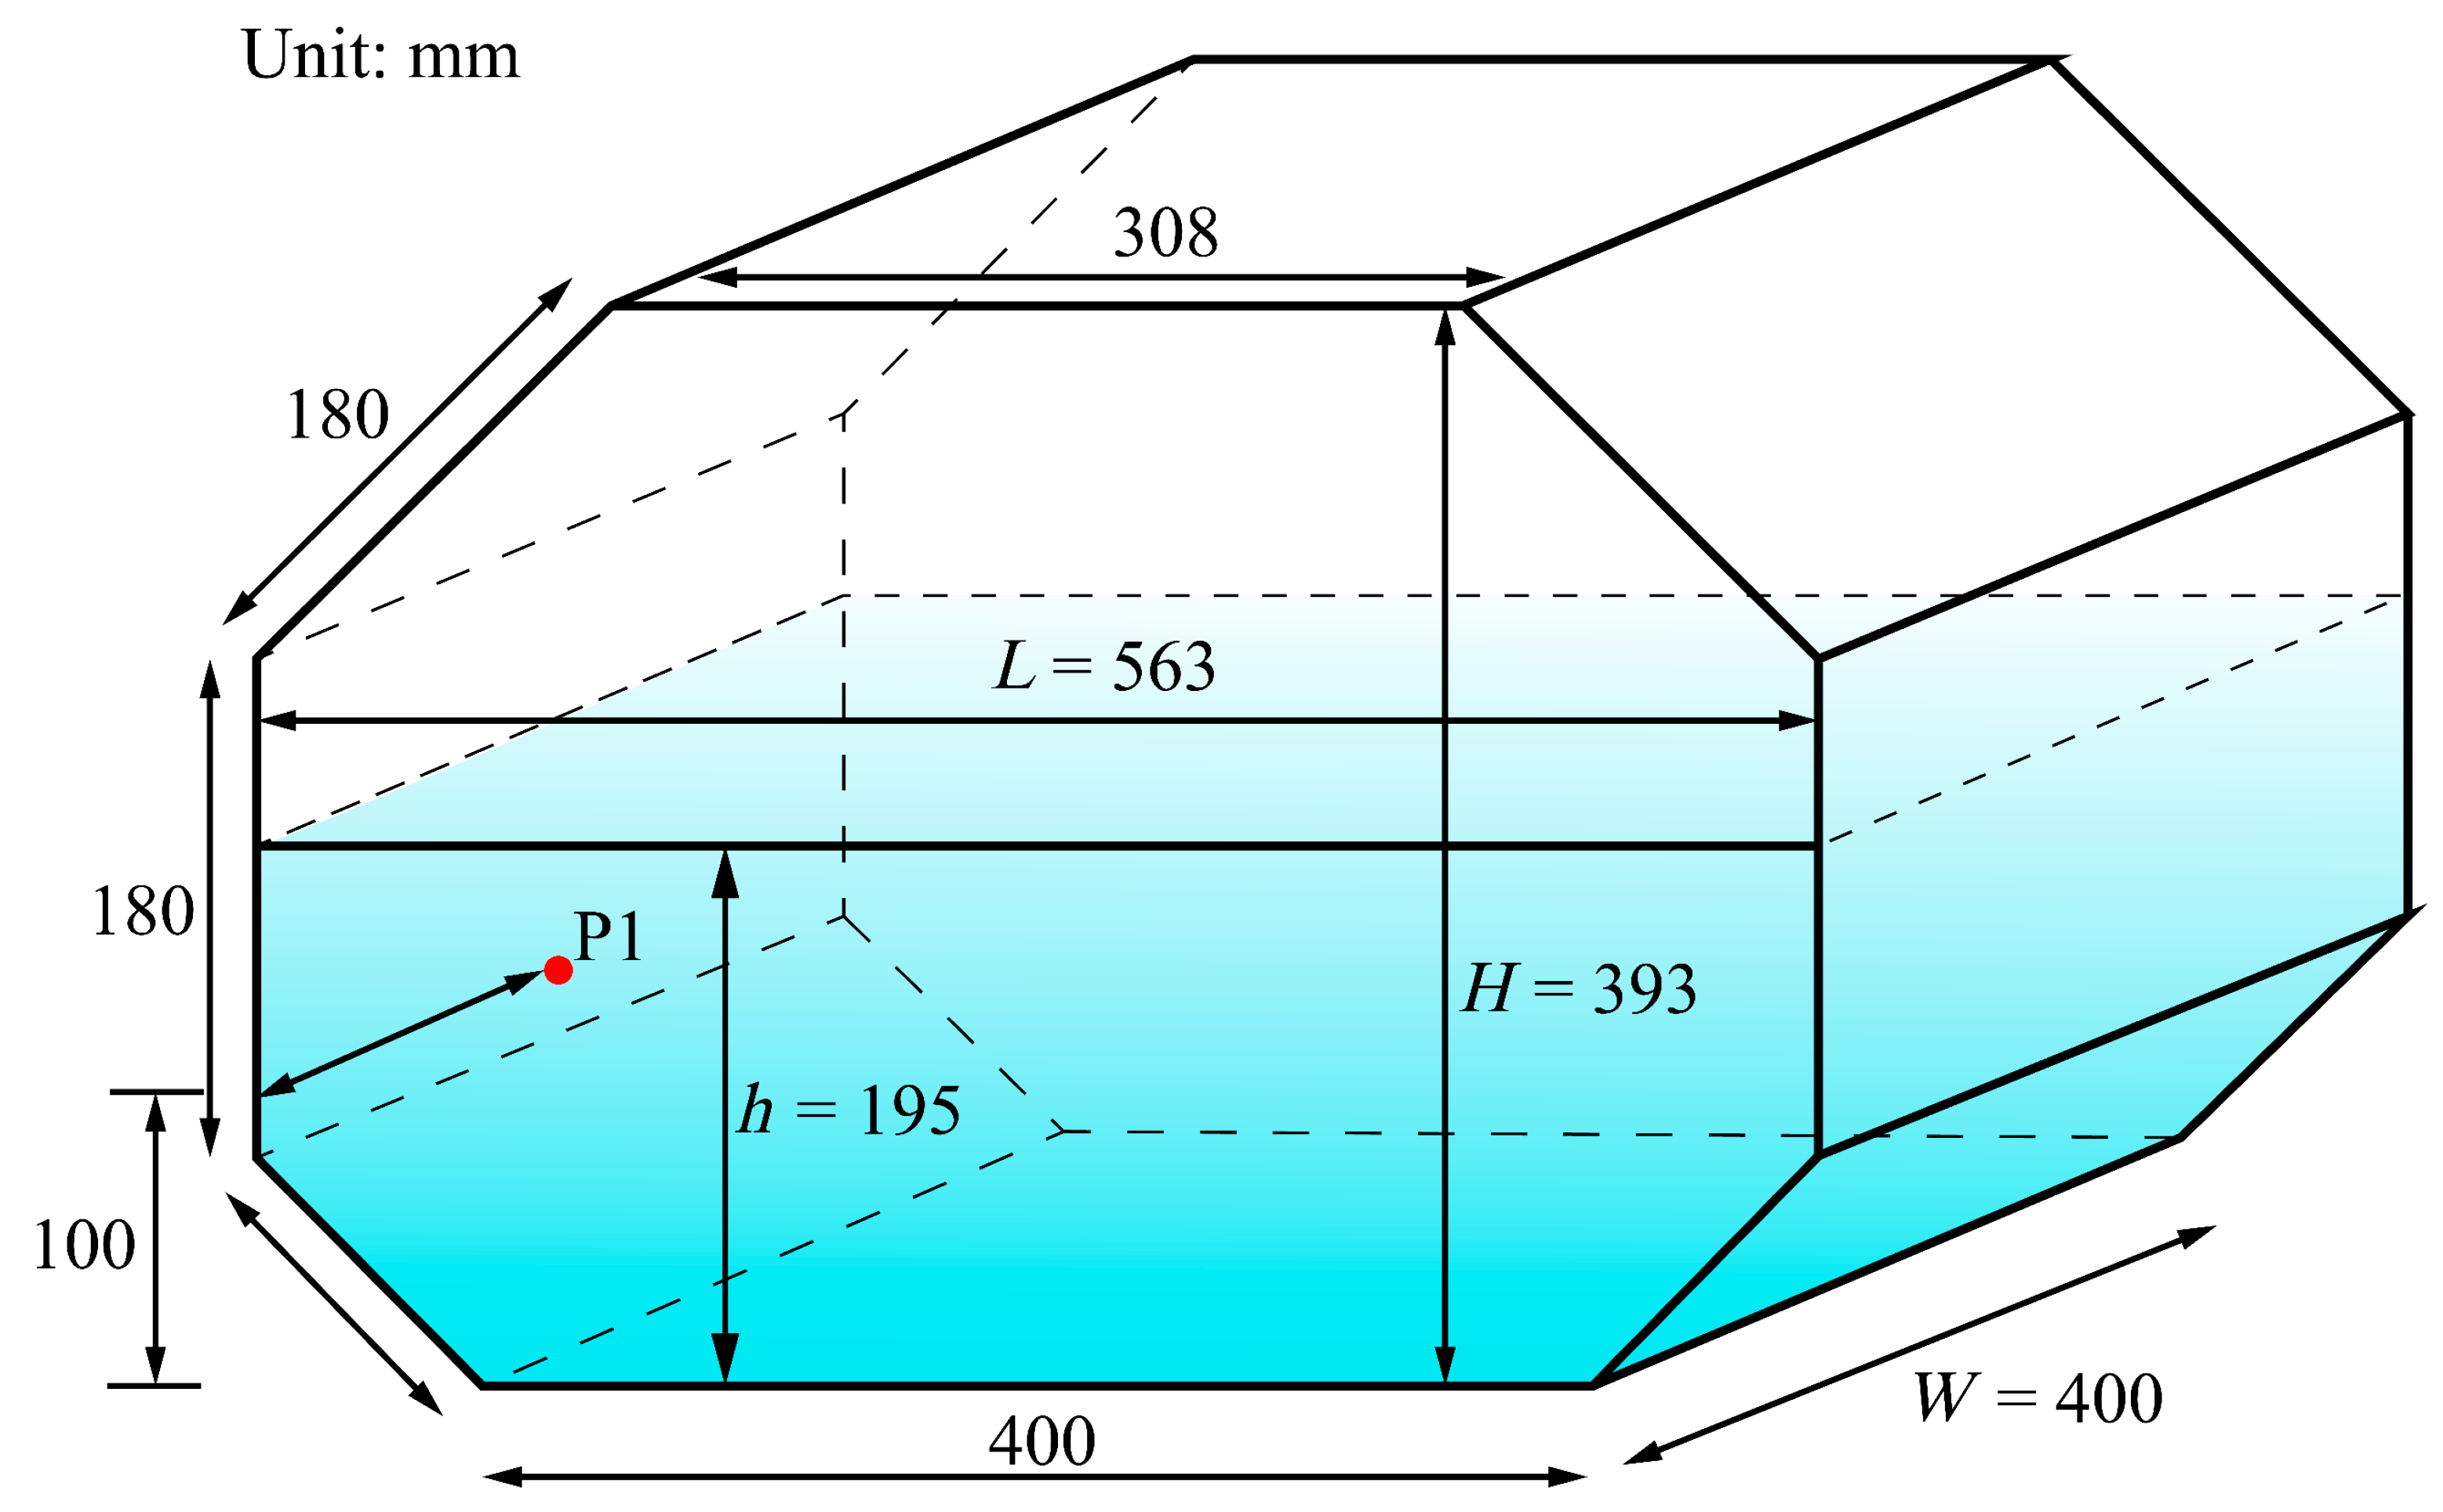
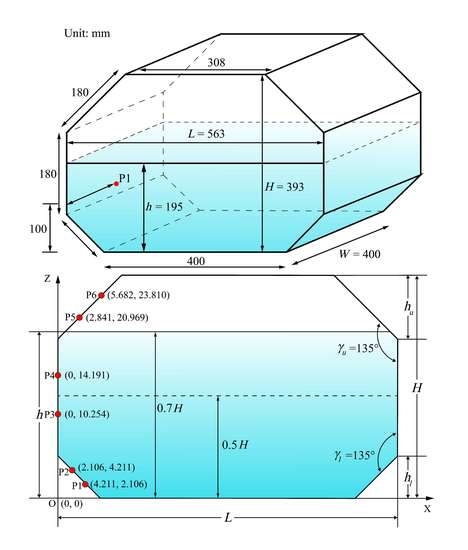
Except for the prismatic tank, the membrane-type tank is more preferred in engineers. Luo et al. [11] did experiments to study the sloshing in a membrane-type tank which was scaled down from the real scale [21]. The scale tank and its corresponding dimensions are shown in Figure 3, which P1 is the pressure measurement point. The filling level 50% of the tank height was considered by Luo et al. [11], and the forcing frequency of 6.618 rad/s was adopted. The tank displacement followed sinusoidal function: s = A ( t ) sin ( ω h t + π ) , where A ( t ) and ω h were the amplitude and forcing frequency, respectively. In this case, A ( t ) linearly increases in the first 10 s and finally reaches 0.005 m. In the numerical simulations, the 3D computation domain is discretized as 80 × 40 × 60 uniform grids, with Δ x = 0.007   m , Δ y = 0.001   m , and Δ z = 0.0066   m . The time step is automatically adjusted through CFL (Courant-Friedrichs-lewy) conditions to ensure numerical stability.
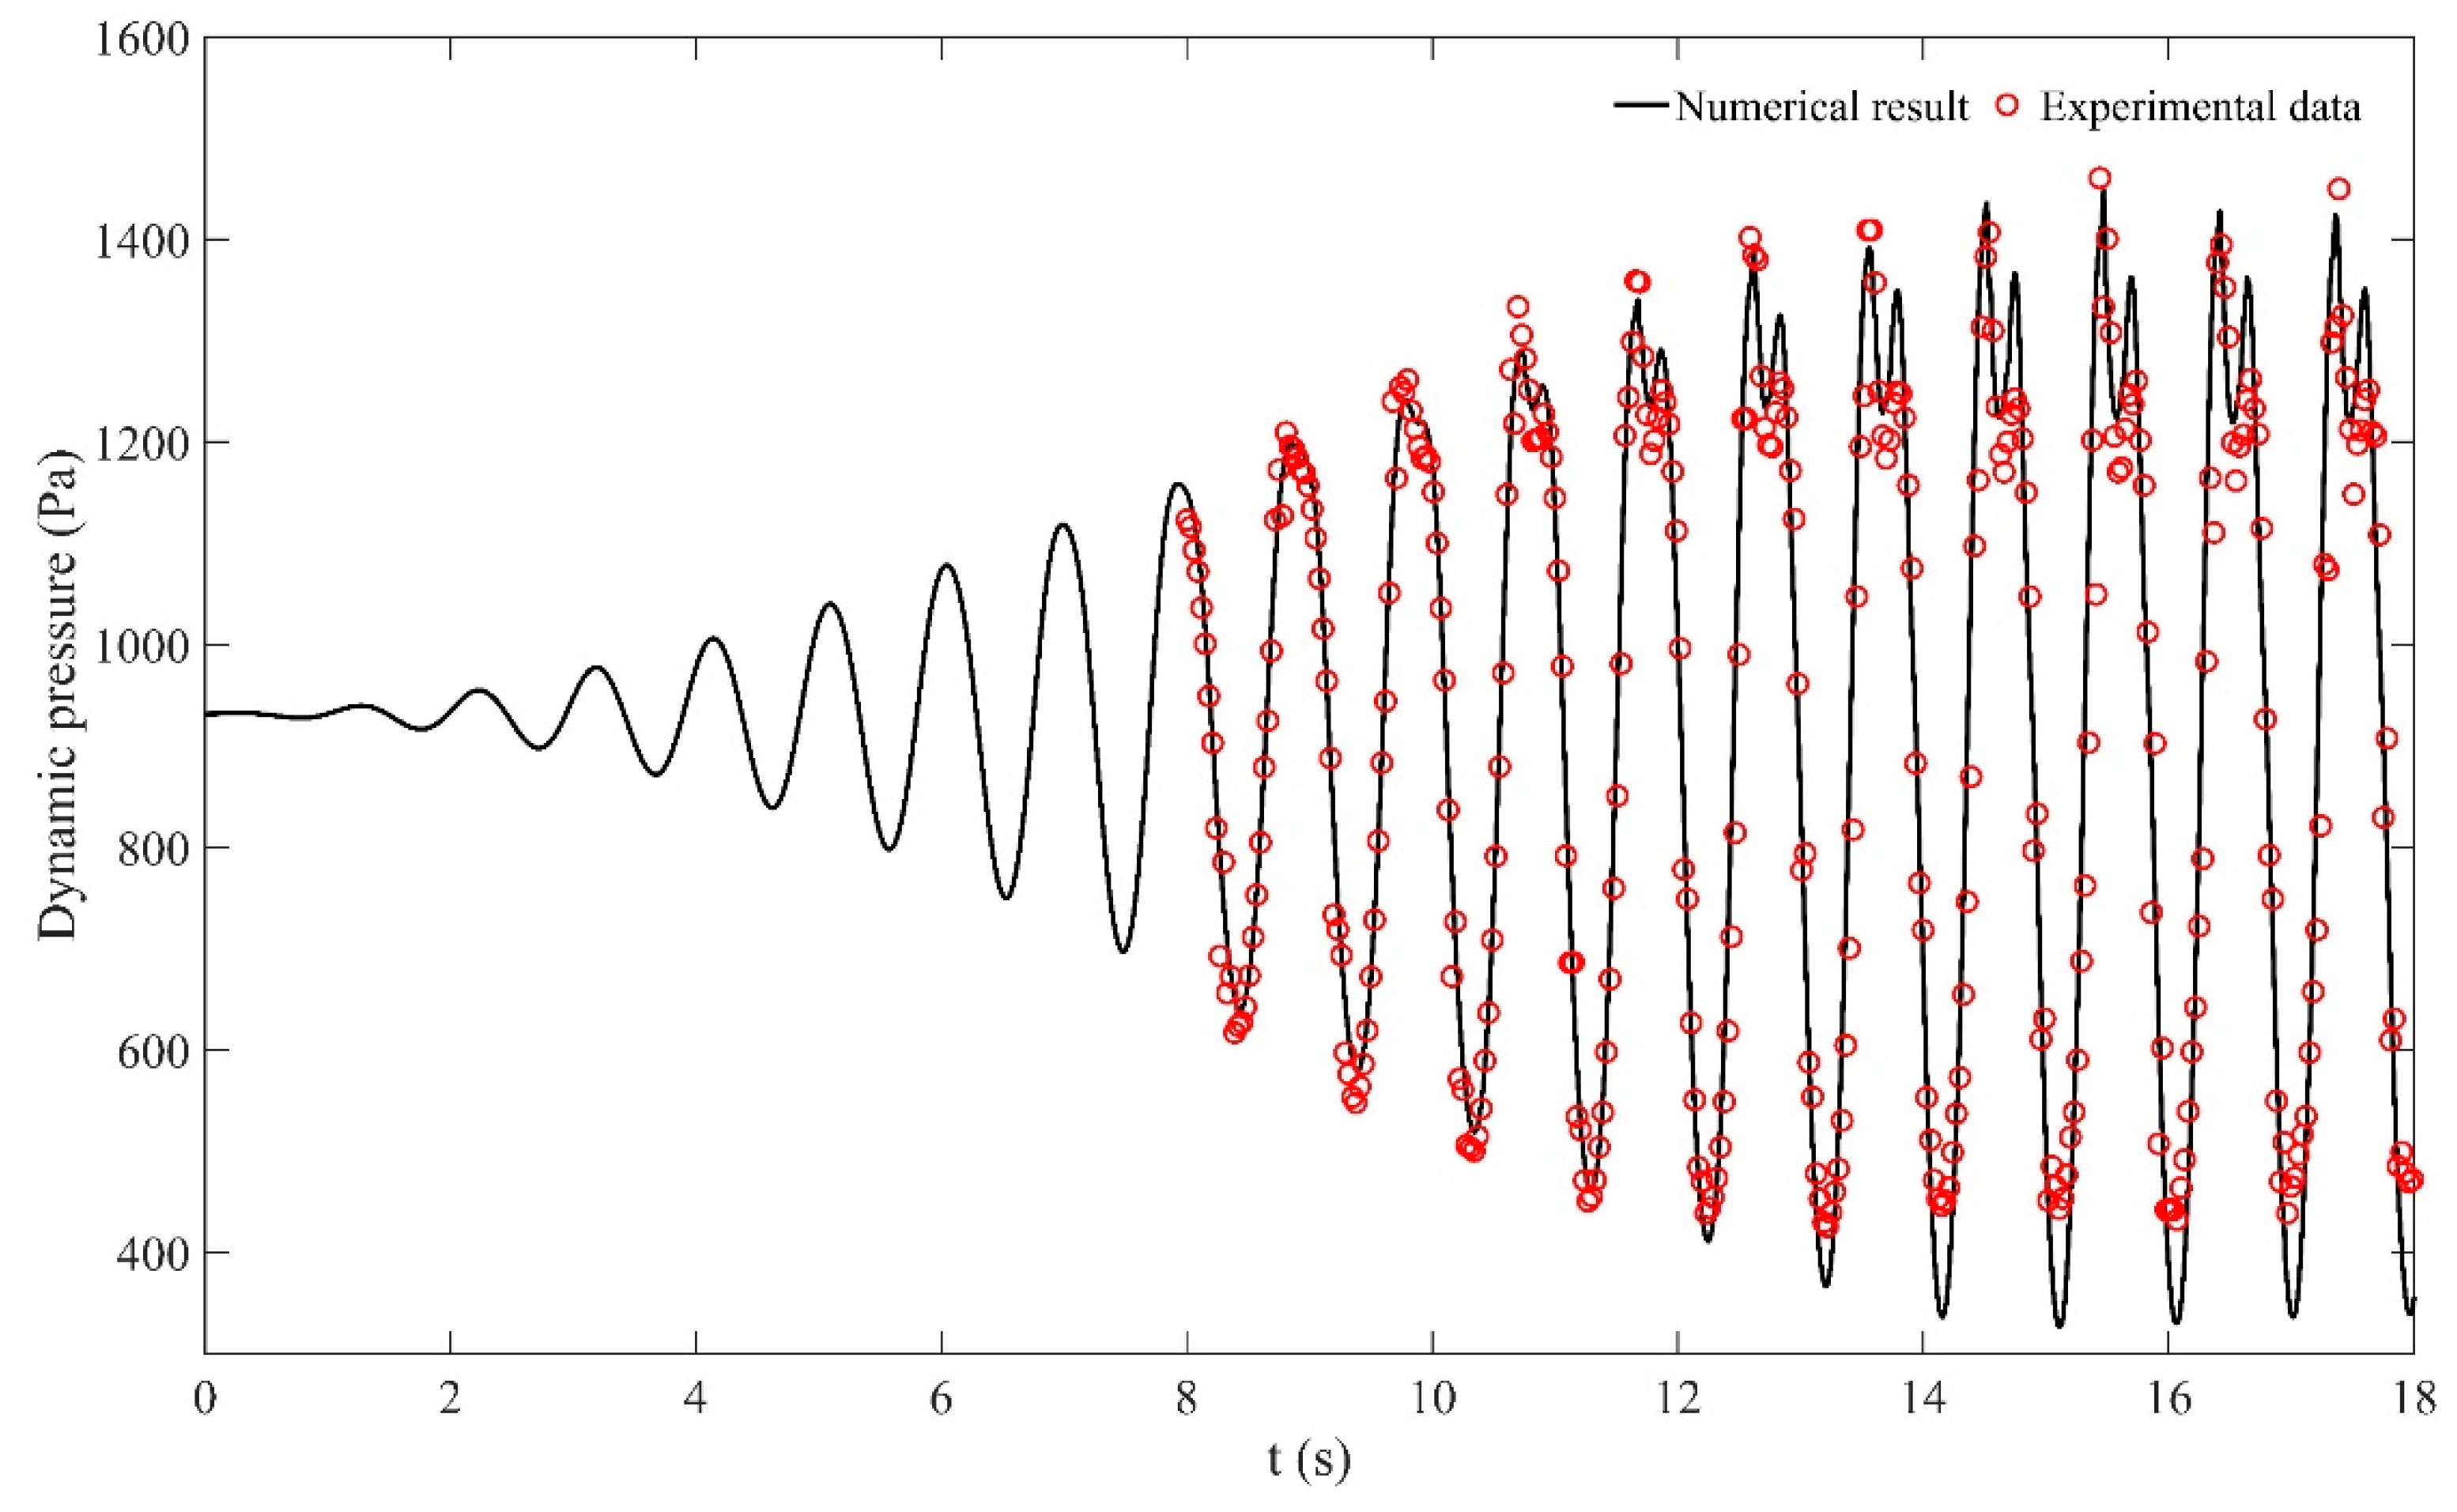
In the paper of Luo et al. [11], only the results from 8 s to 18 s were demonstrated. The full results of the first 18 s are presented in this study. The comparison of the dynamic pressures at P1 between experimental data of Luo et al. [11] and the present numerical result is shown in Figure 4. The present result generally matches the experimental data at the first 13 s, after that, the comparison among the crests agrees well enough, but there exists some discrepancy at the troughs with the maximal error less than 7%. On a whole, the results reveal that the present numerical model is of good accuracy in modeling sloshing in the membrane-type tank.
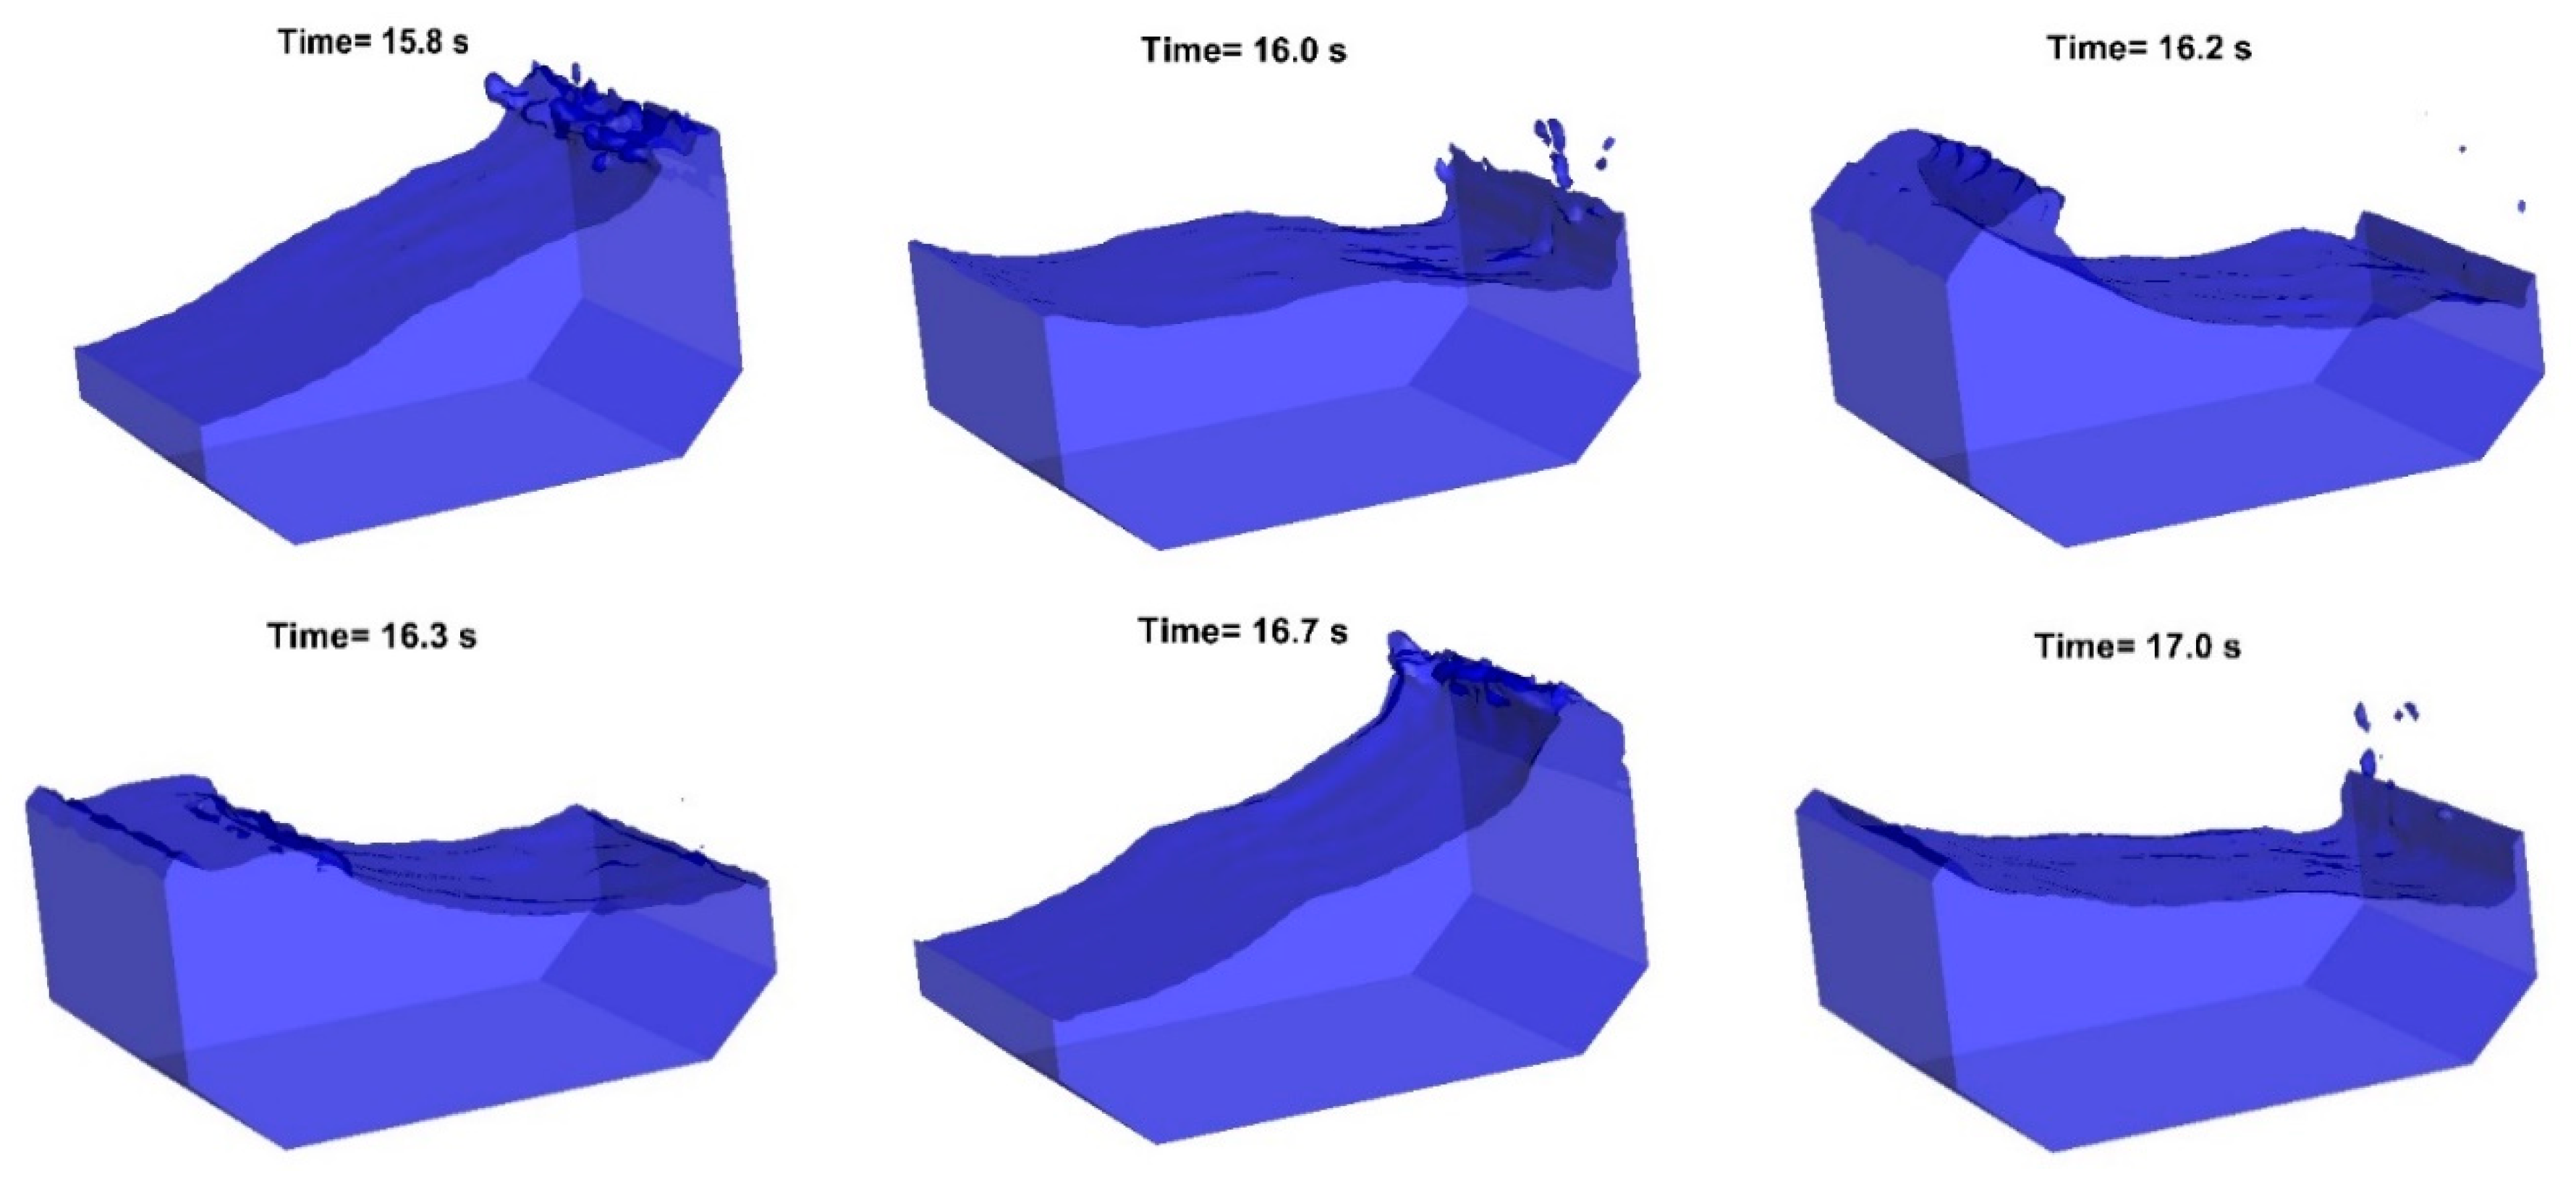
From the time history of dynamic pressures, it follows that there exist two obvious peaks, in order to better understand the two-peak features (already been found by Zou et al. [3] and Jin and Lin [14]), the free surface profiles at moments 15.8 s, 16.0 s, 16.2 s, 16.3 s, 16.7 s, and 17.0 s are shown in Figure 5, of which 15.8 s and 16.7 s stand for the second peaks which are induced by the falling water hitting the underline water, the moments 16.0 s and 17.0 s are close to the troughs which are nearly close to the minimal excitation. The moments 16.2 s and 16.0 s represent the first peak and trough within the first and second peaks. Besides, considering excitation is near-resonant, the free surface is violently broken.

4. Results and Discussion

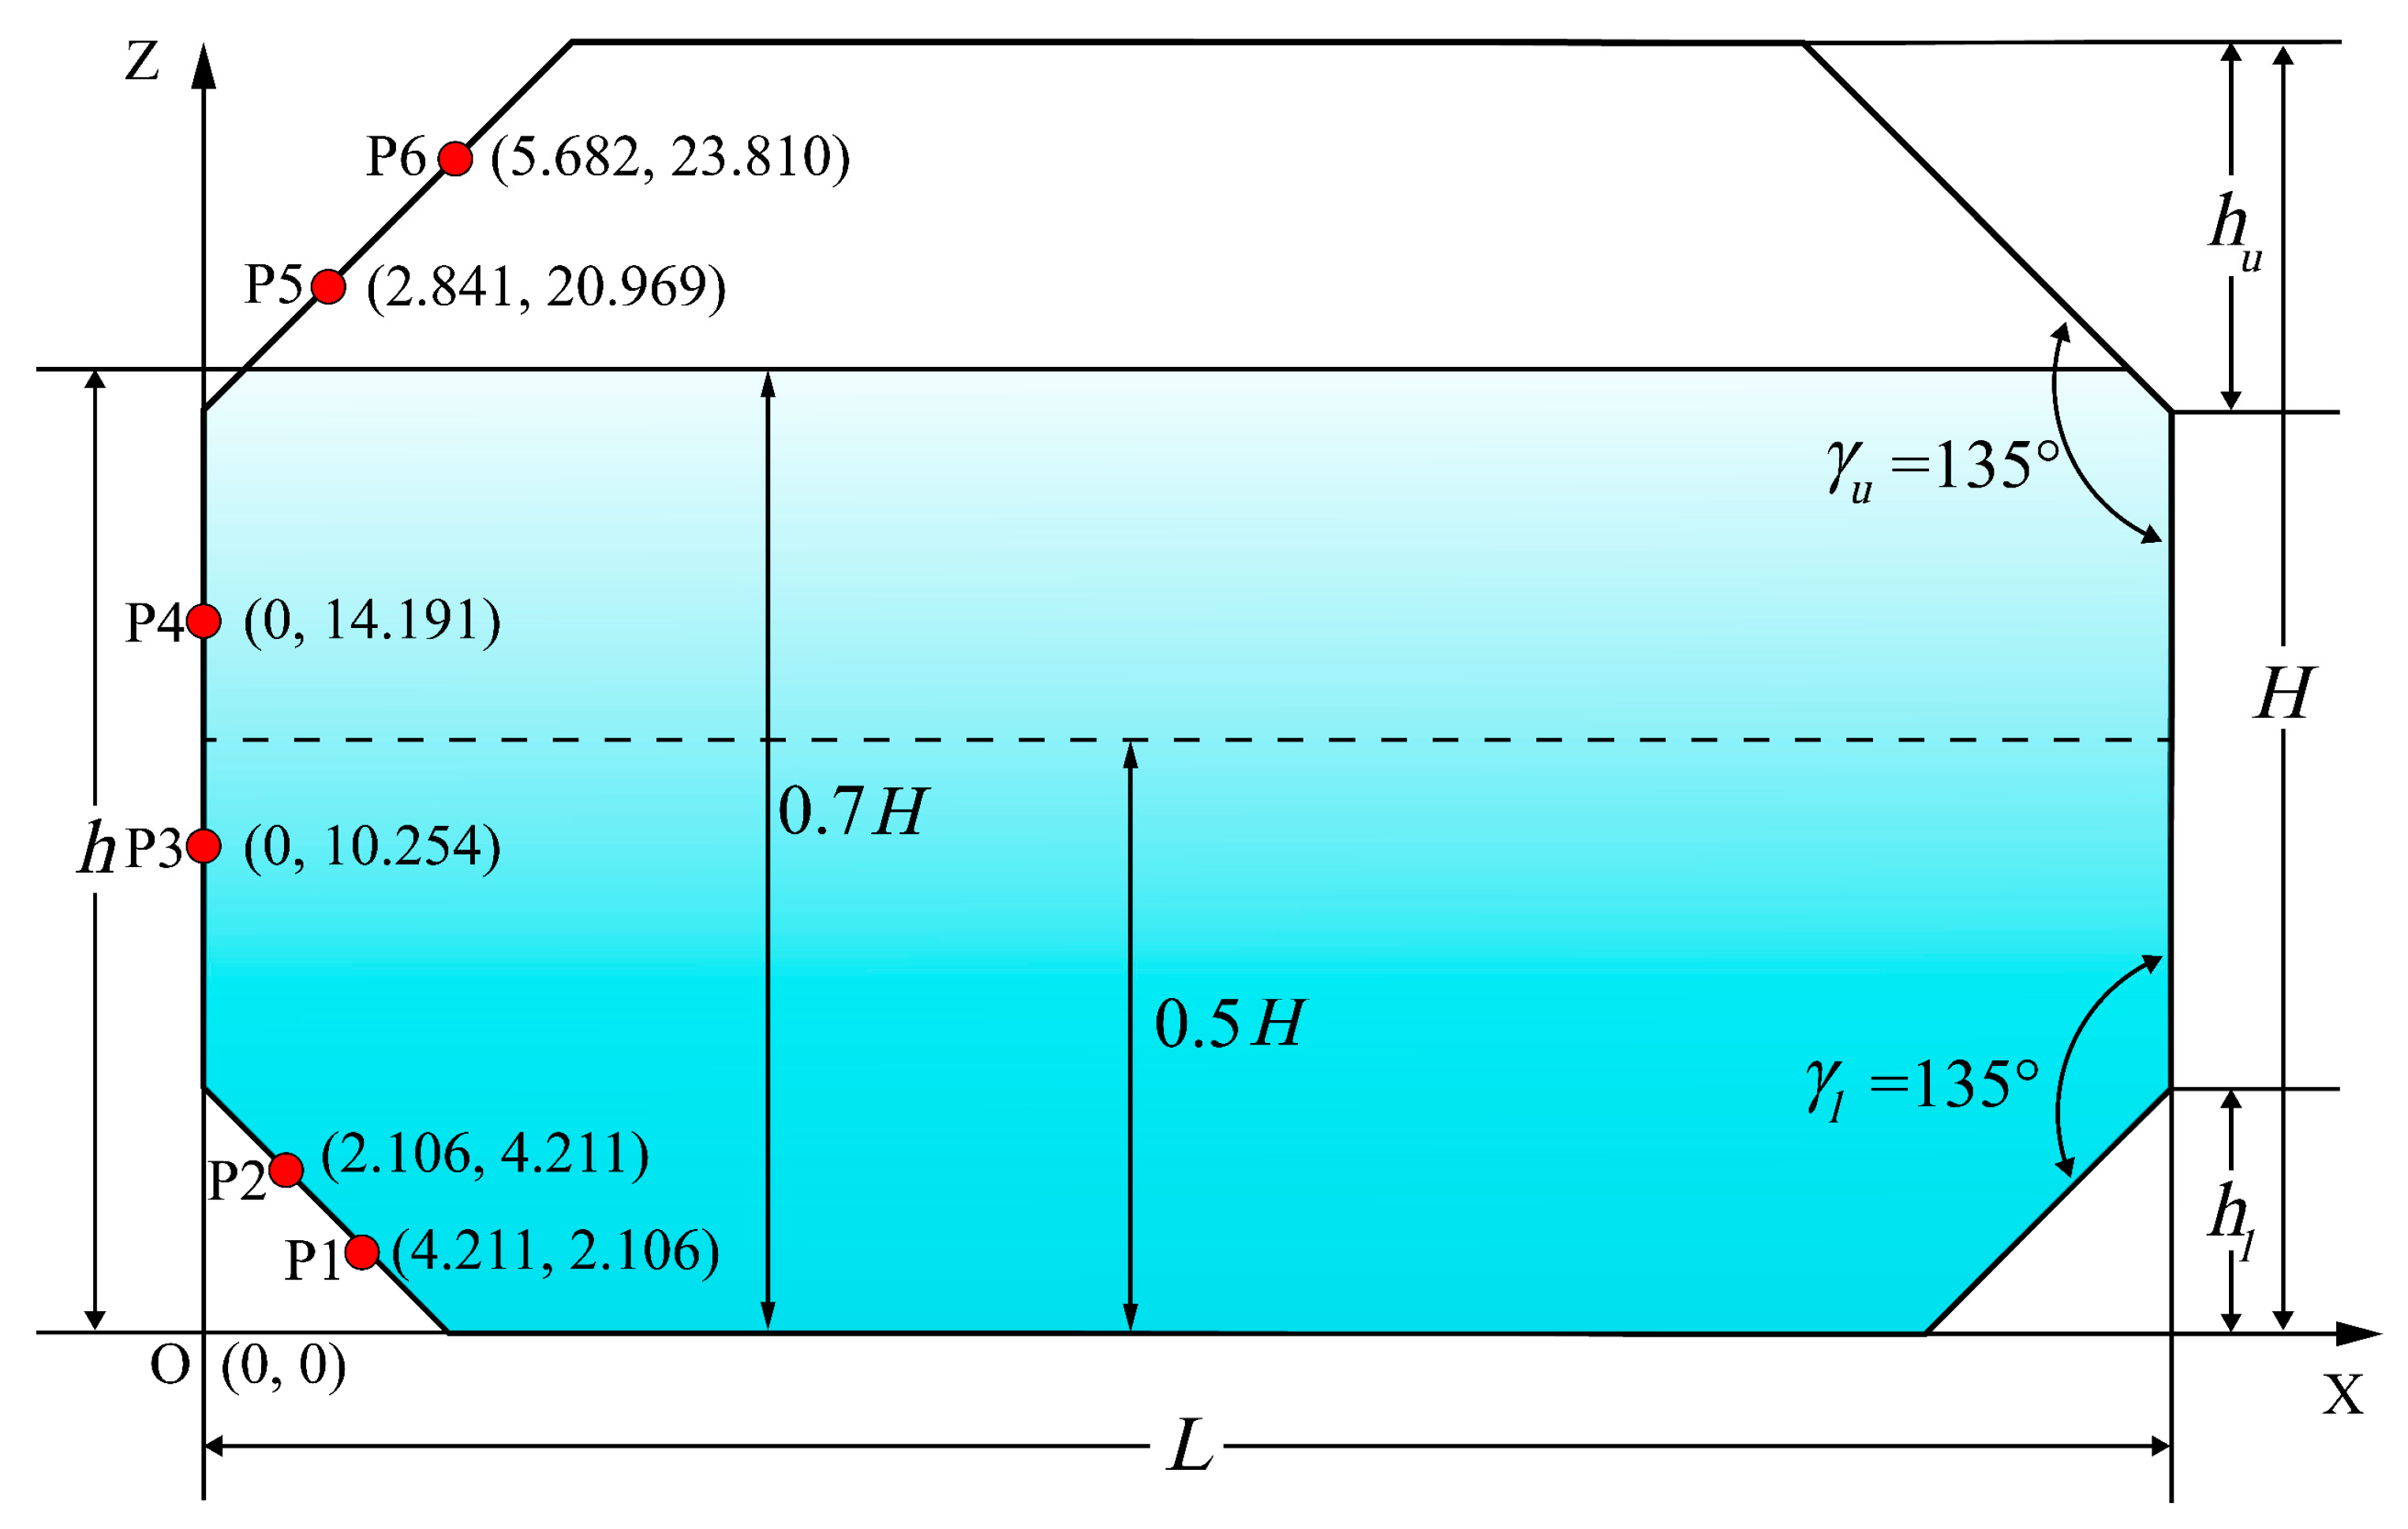
In real cases, the tank dimensions are of tens or hundreds of meters in length, width as well as height. Bass et al. [1] have concluded that small-scale physical model tests would overestimate slosh pressures as a result of improper liquid compressibility scaling, using Froude-scaled slosh and ullage pressures. To well predict the full-scale loads, the real-scale membrane-type tank [22] will be discussed. For fundamental research, here the 2D sloshing in the length direction with dimensions being length L = 46.605   m and height H = 26.651   m is simulated as shown in Figure 6. Other parameters h l and h u are equal to 6.317 m and 8.523 m, respectively. Six pressure transducers are set in the left tank wall, and the detail coordinates and arrangement of the tank can be found in Figure 6. In the transport industry, the filling level is strictly restricted and suggested with the range between 10% of L and 80% of H . However, several filling levels are evitable in real applications. In this study, two filling levels 50% and 70% of H are considered, and the corresponding two filling depths h are 13.3255 m and 18.6557 m, respectively, which are also equal to 28.6% and 40% of L , respectively.
According to the available literature, the prevailing sea states generally have a wide range of periods between 4.0 s to 15.0 s, and the most serious periods are between 6.0 s to 12.0 s [23,24,25,26]. To reveal the realistic responses of sloshing in real-scale tanks in the sea conditions, the forcing periods 8.0 s, 9.0 s, 10.0 s, 11.0 s, 12.0 s are adopted in this study. The single freedom of roll motion is considered, with a fixed roll angle of 8.0° being used. For a preliminary study, the rolling center is fixed at (23.3025, 18.6557) throughout the present work.
In the numerical simulations, the 2D computation domain 46.6 m × 26.65 m is discretized as 400 × 160 uniform grids, with Δ x = 0.1165   m and Δ z = 0.1666   m , respectively. To the numerical stability, the time step is automatically adjusted through CFL conditions. The sloshing of two different levels will be investigated first, and the nonlinearity will be discussed in detailed. Finally, the frequency response will be followed.

4.1. Sloshing Responses of Lower Filling Level 50% of Tank Height

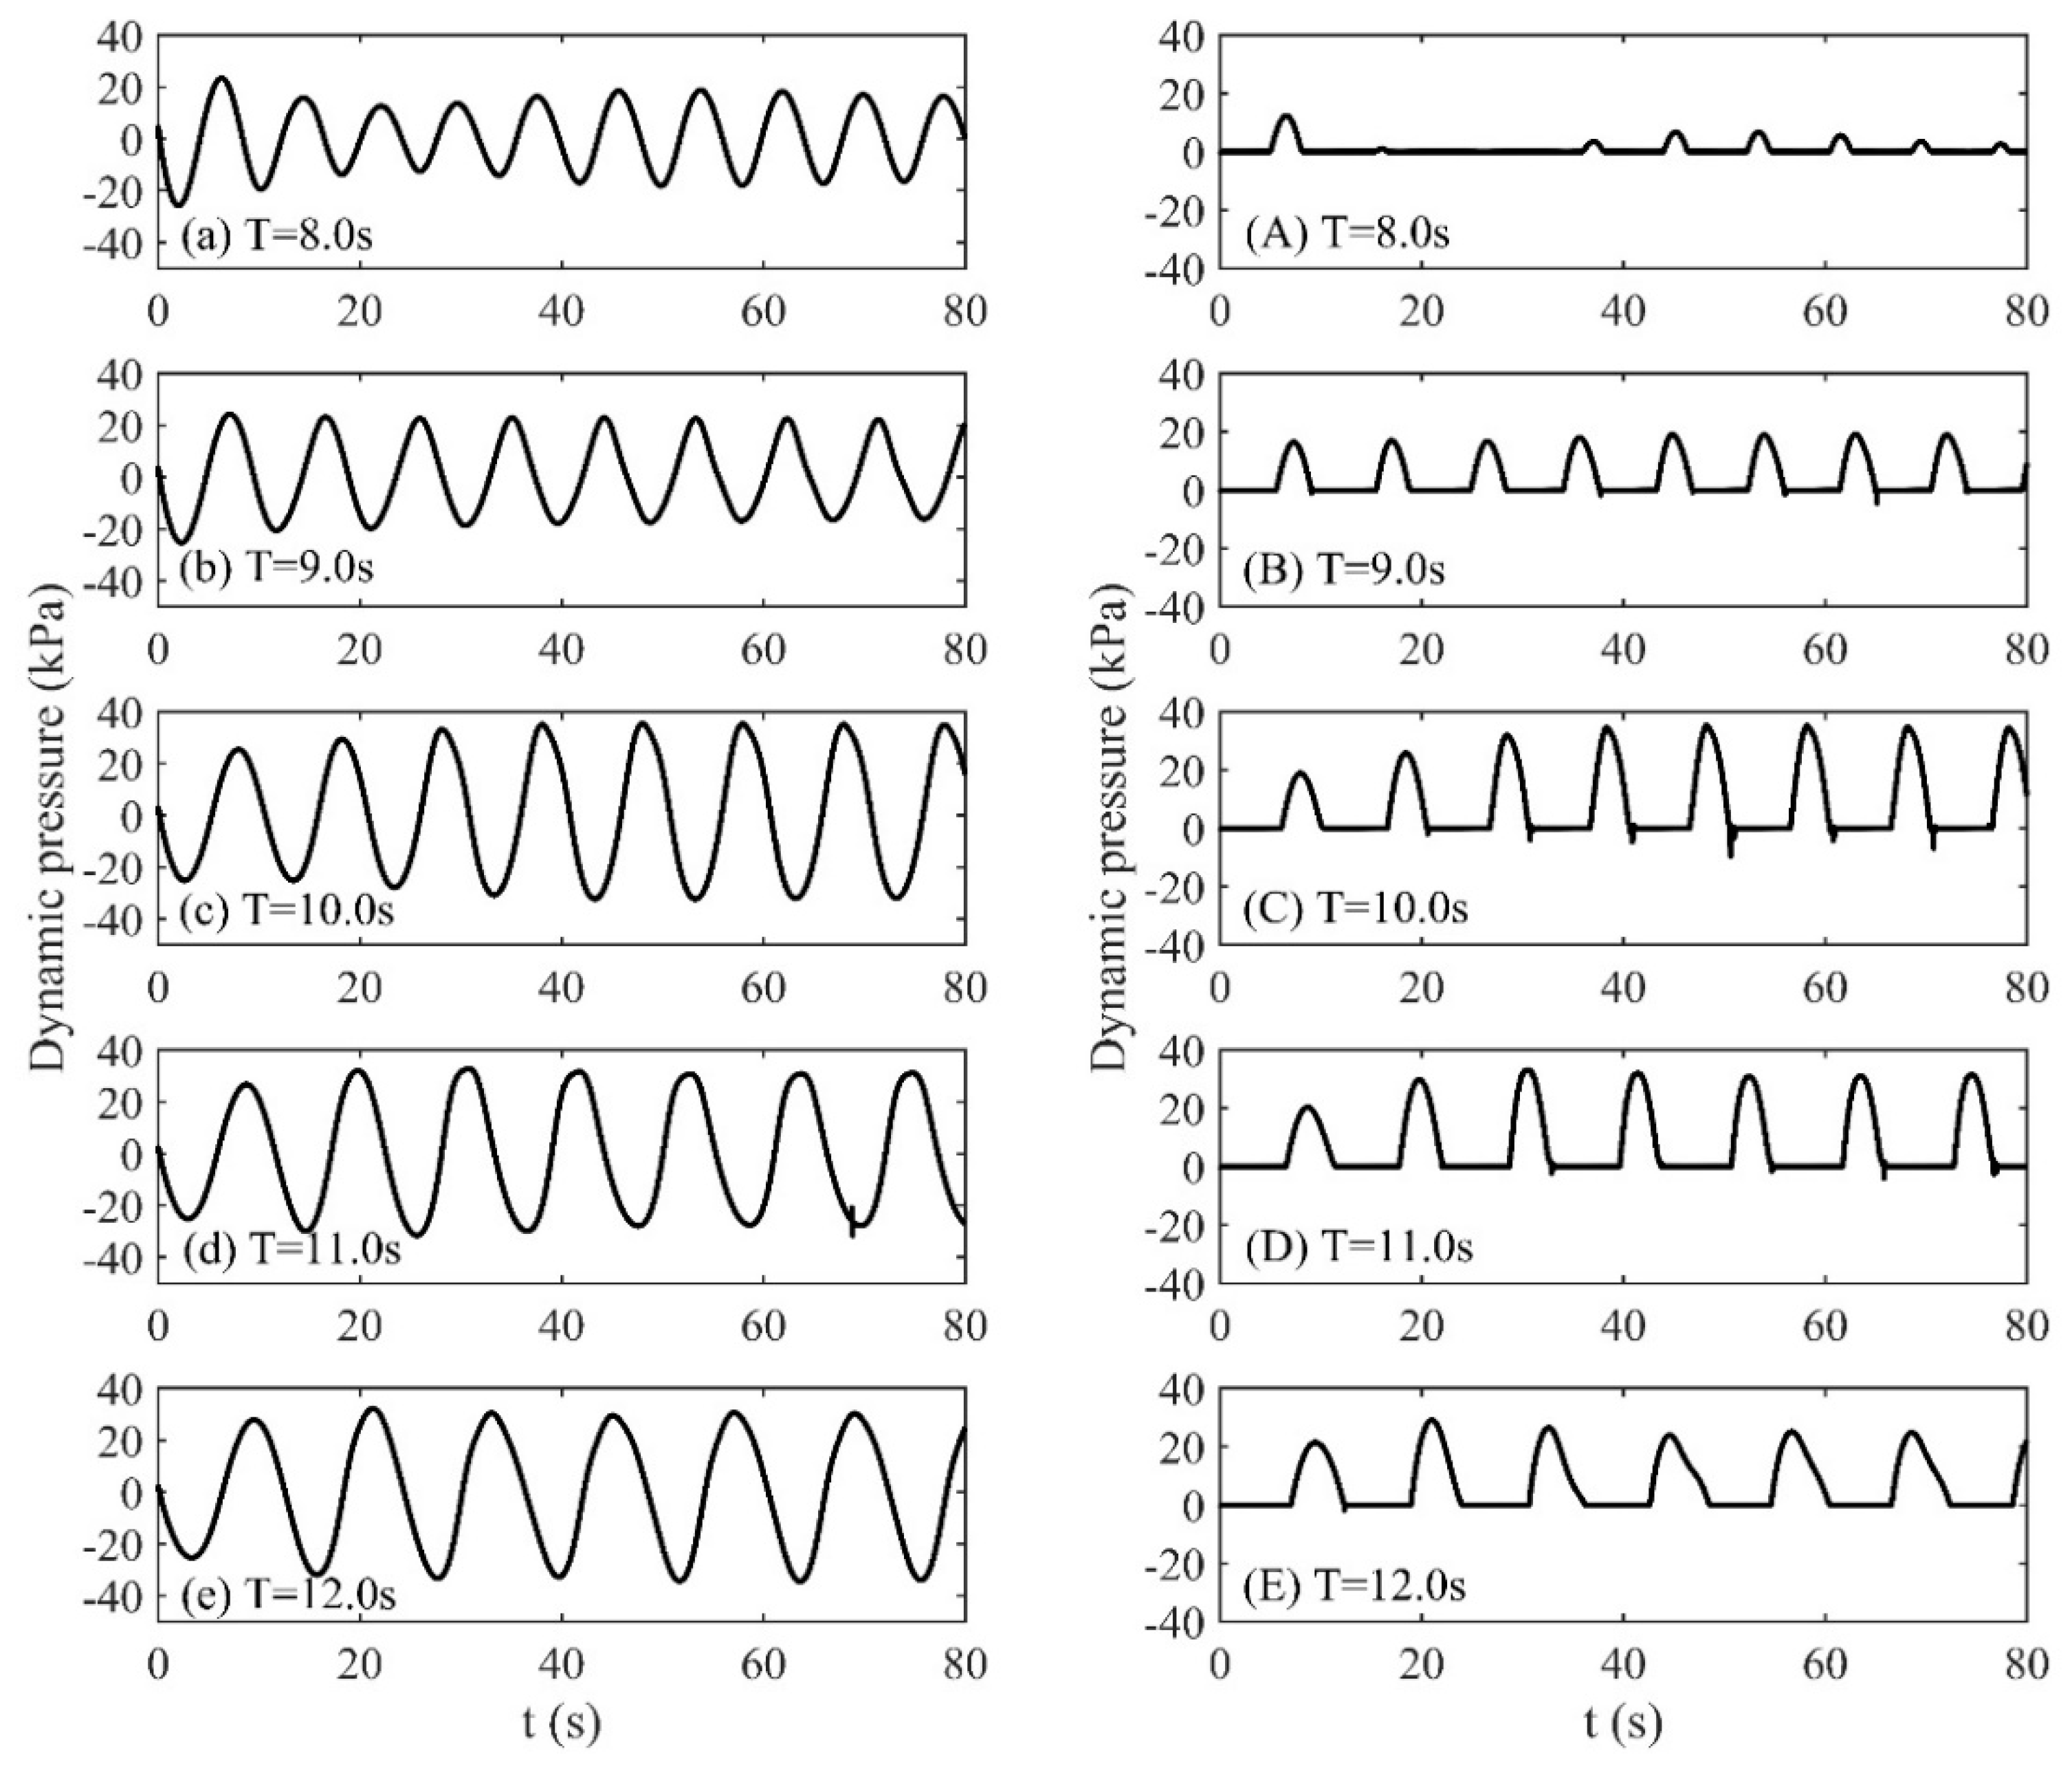
Firstly, the filling level 50% of h is discussed, with the corresponding ratio of filling depth to tank length being 28.6% which is also above the traditional shallow filling level (lower than 20% of tank length). The comparisons of dynamic pressures among various forcing periods at P2 and P4 are shown in Figure 7. The left column stands for the results of dynamic pressures at P2, and the right column represents those of P4. Both results reveal that the maximal dynamic pressures occur around the forcing periods 10.0 s, when the forcing period derivates from 10.0 s, the dynamic pressure reduces especially for the cases 8.0 s and 9.0 s. As for P4 which is initially located above the still filling depth, the results in the right column can also stand for the total pressures. When the forcing period increases, the dynamic pressure goes to a comparative value compared to the results of P2 especially for the case T = 10.0 s. We can also find that dynamic pressures in peaks have only one peak which reveals that the slamming effect is weak.
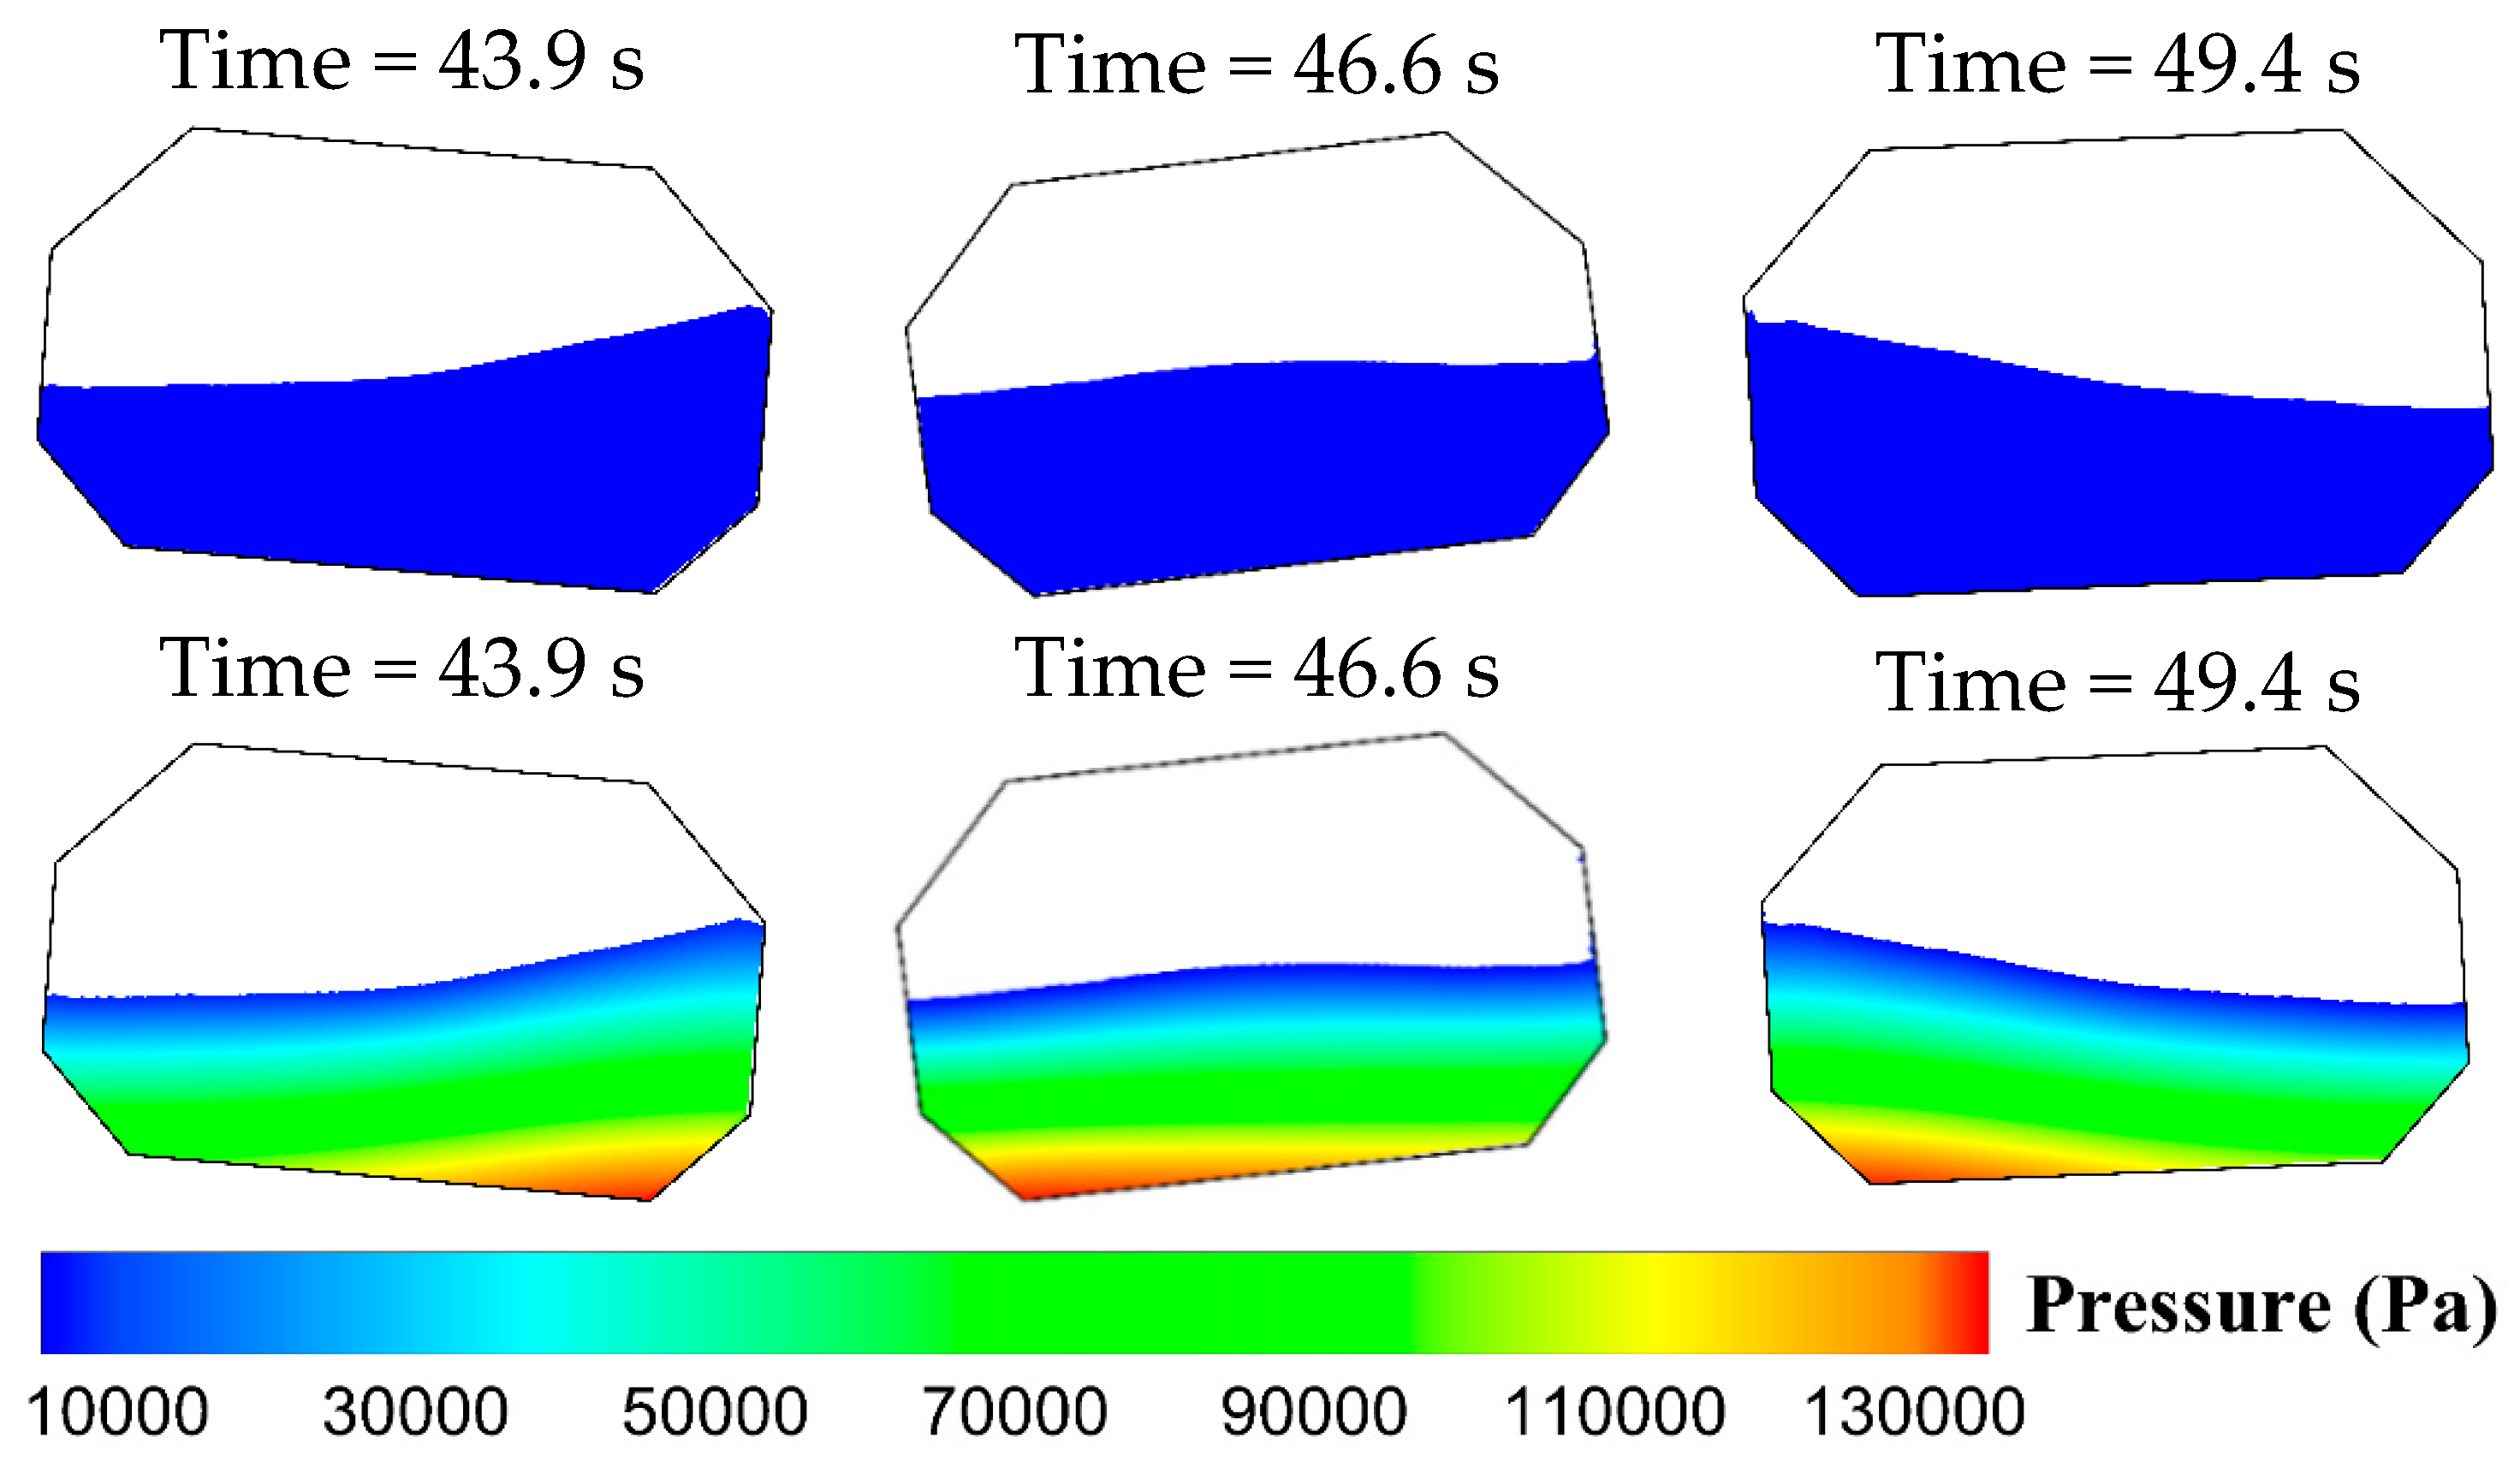
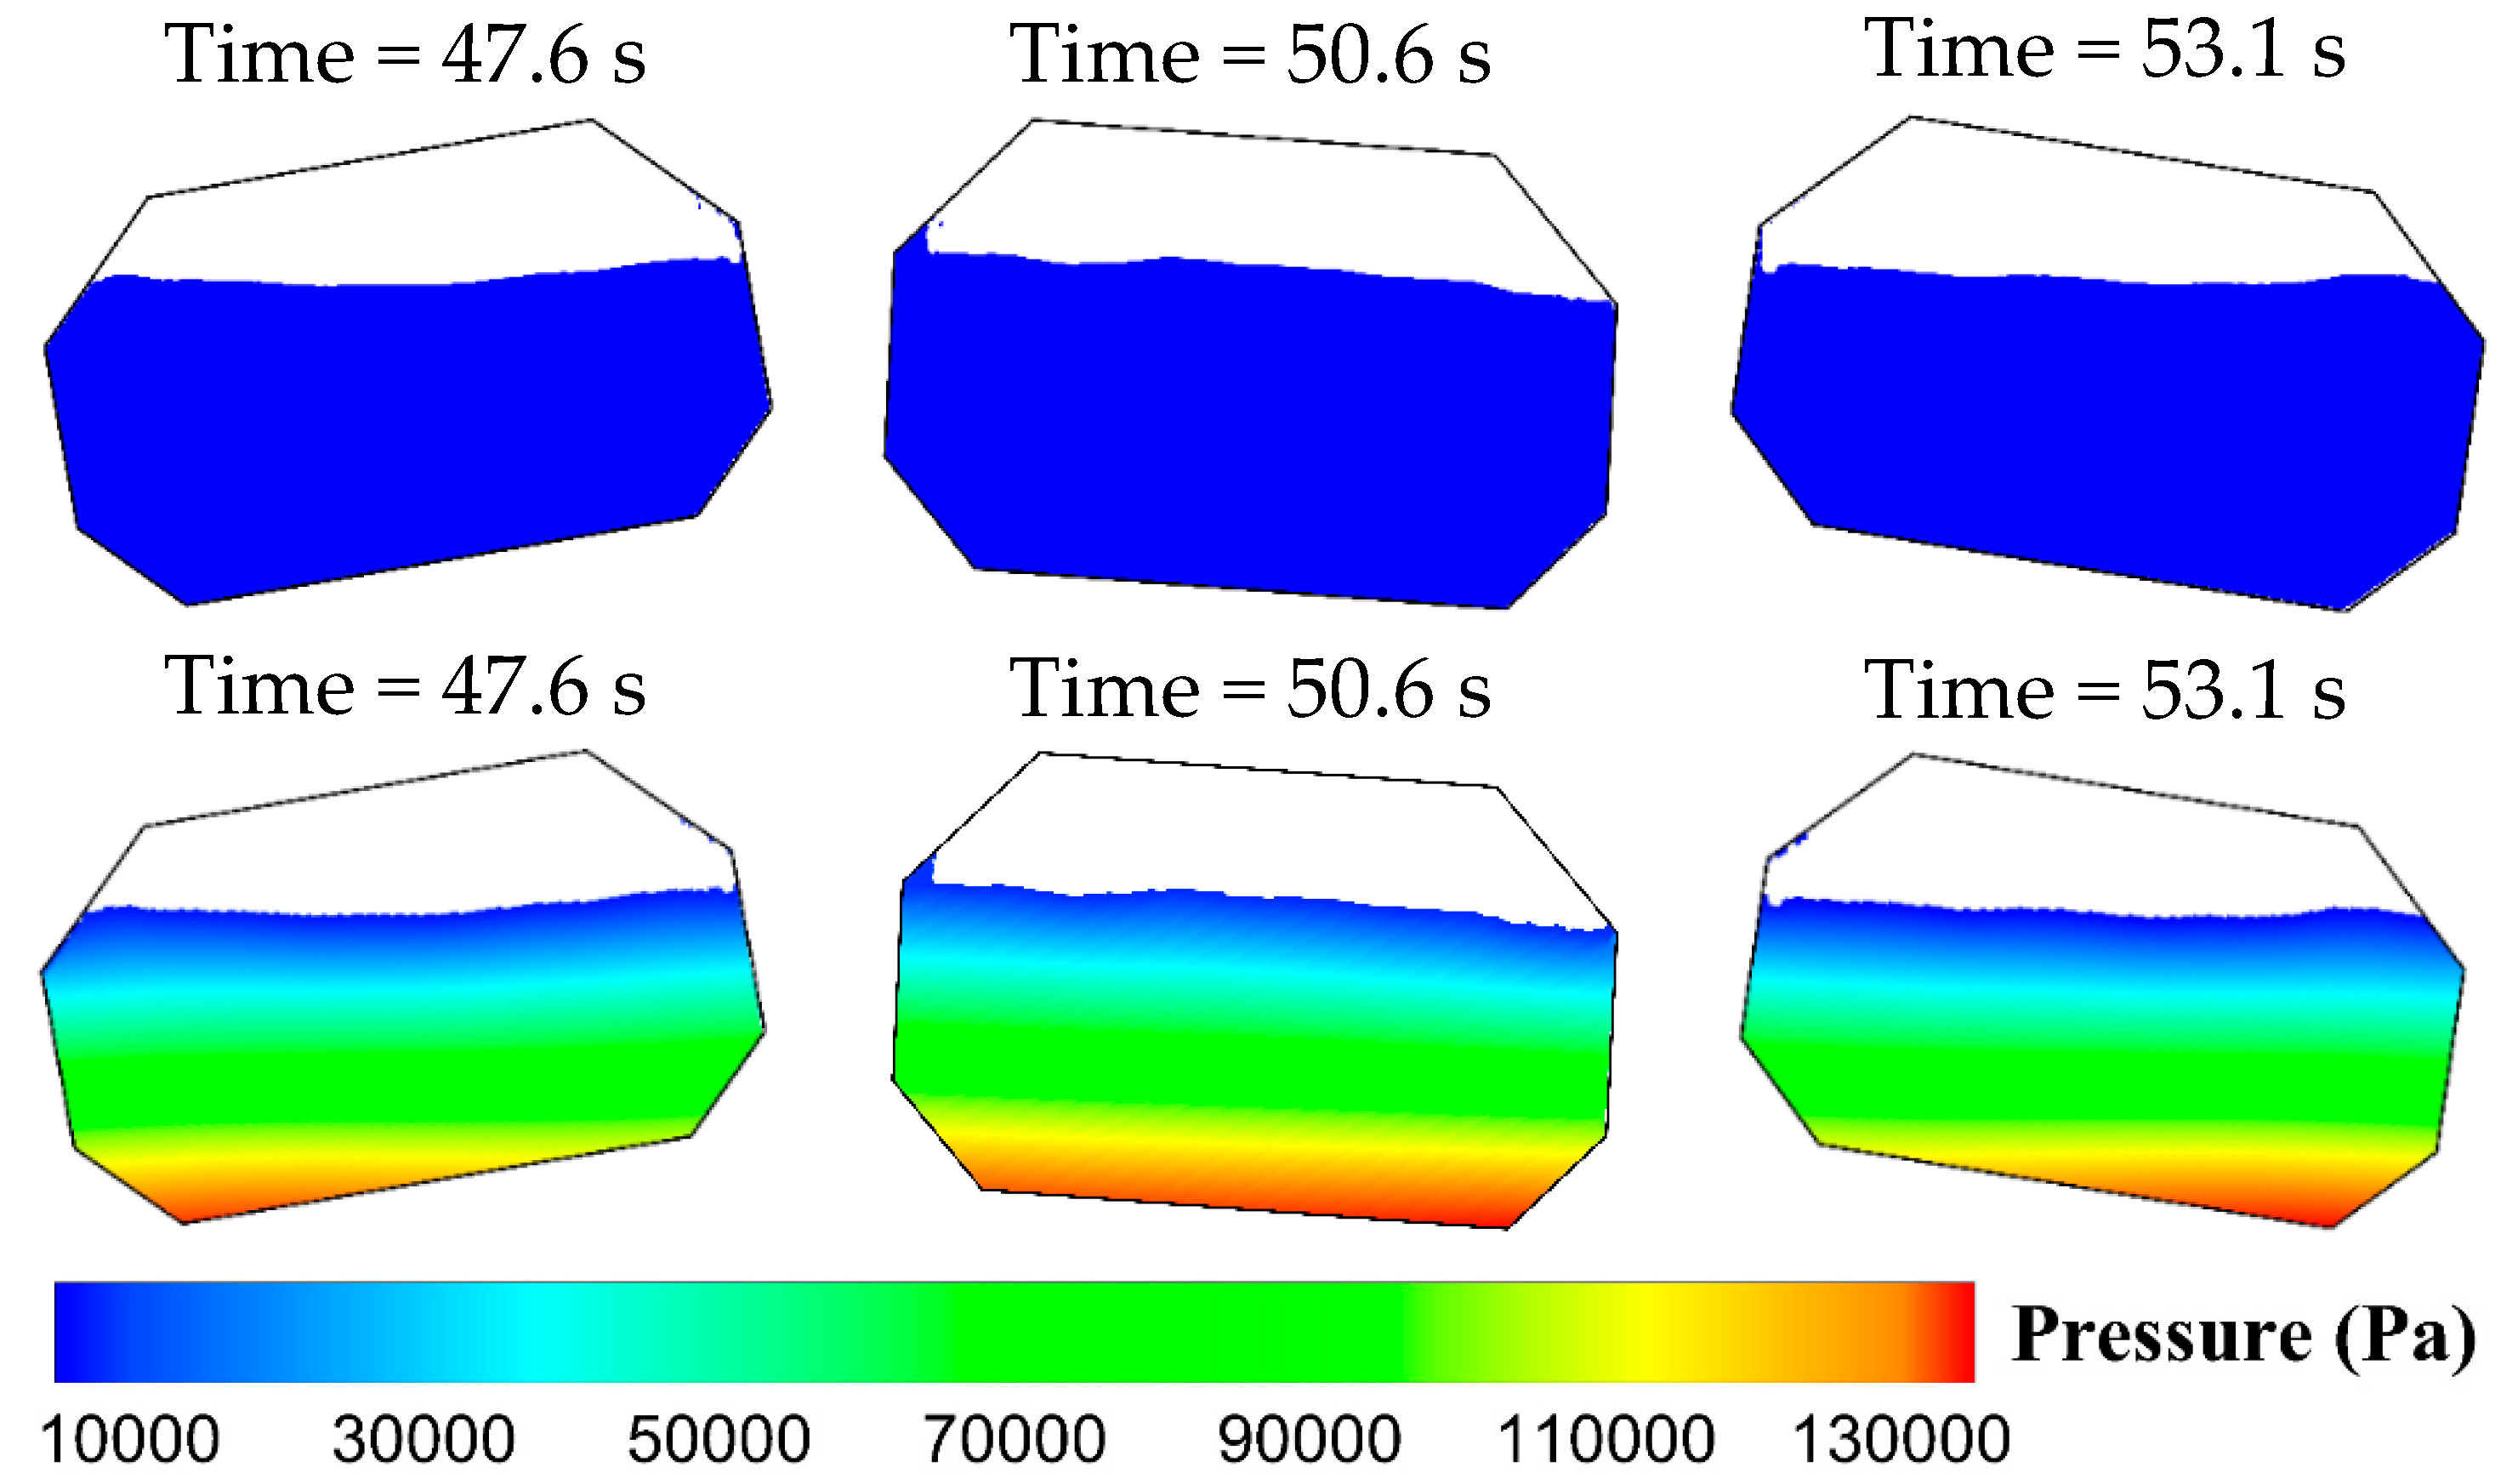
The free surface snapshots of forcing periods 10.0 s at various moments corresponding to three successive troughs and peak in Figure 7 are demonstrated in the first line of Figure 8. From the snapshots, we can find that the maximal free surface displacements at the walls can approach the upper inclined walls. The wave propagates back and forth and behaves like a traveling wave which is an obvious phenomenon in relatively shallow water sloshing. The corresponding snapshots of pressure distributions are displayed below the free snapshots. Due to slightly breaking and slamming, large dynamic loads impact on the upper corners. The maximal pressures are generally located near the tank bottom, especially in the lower corners.
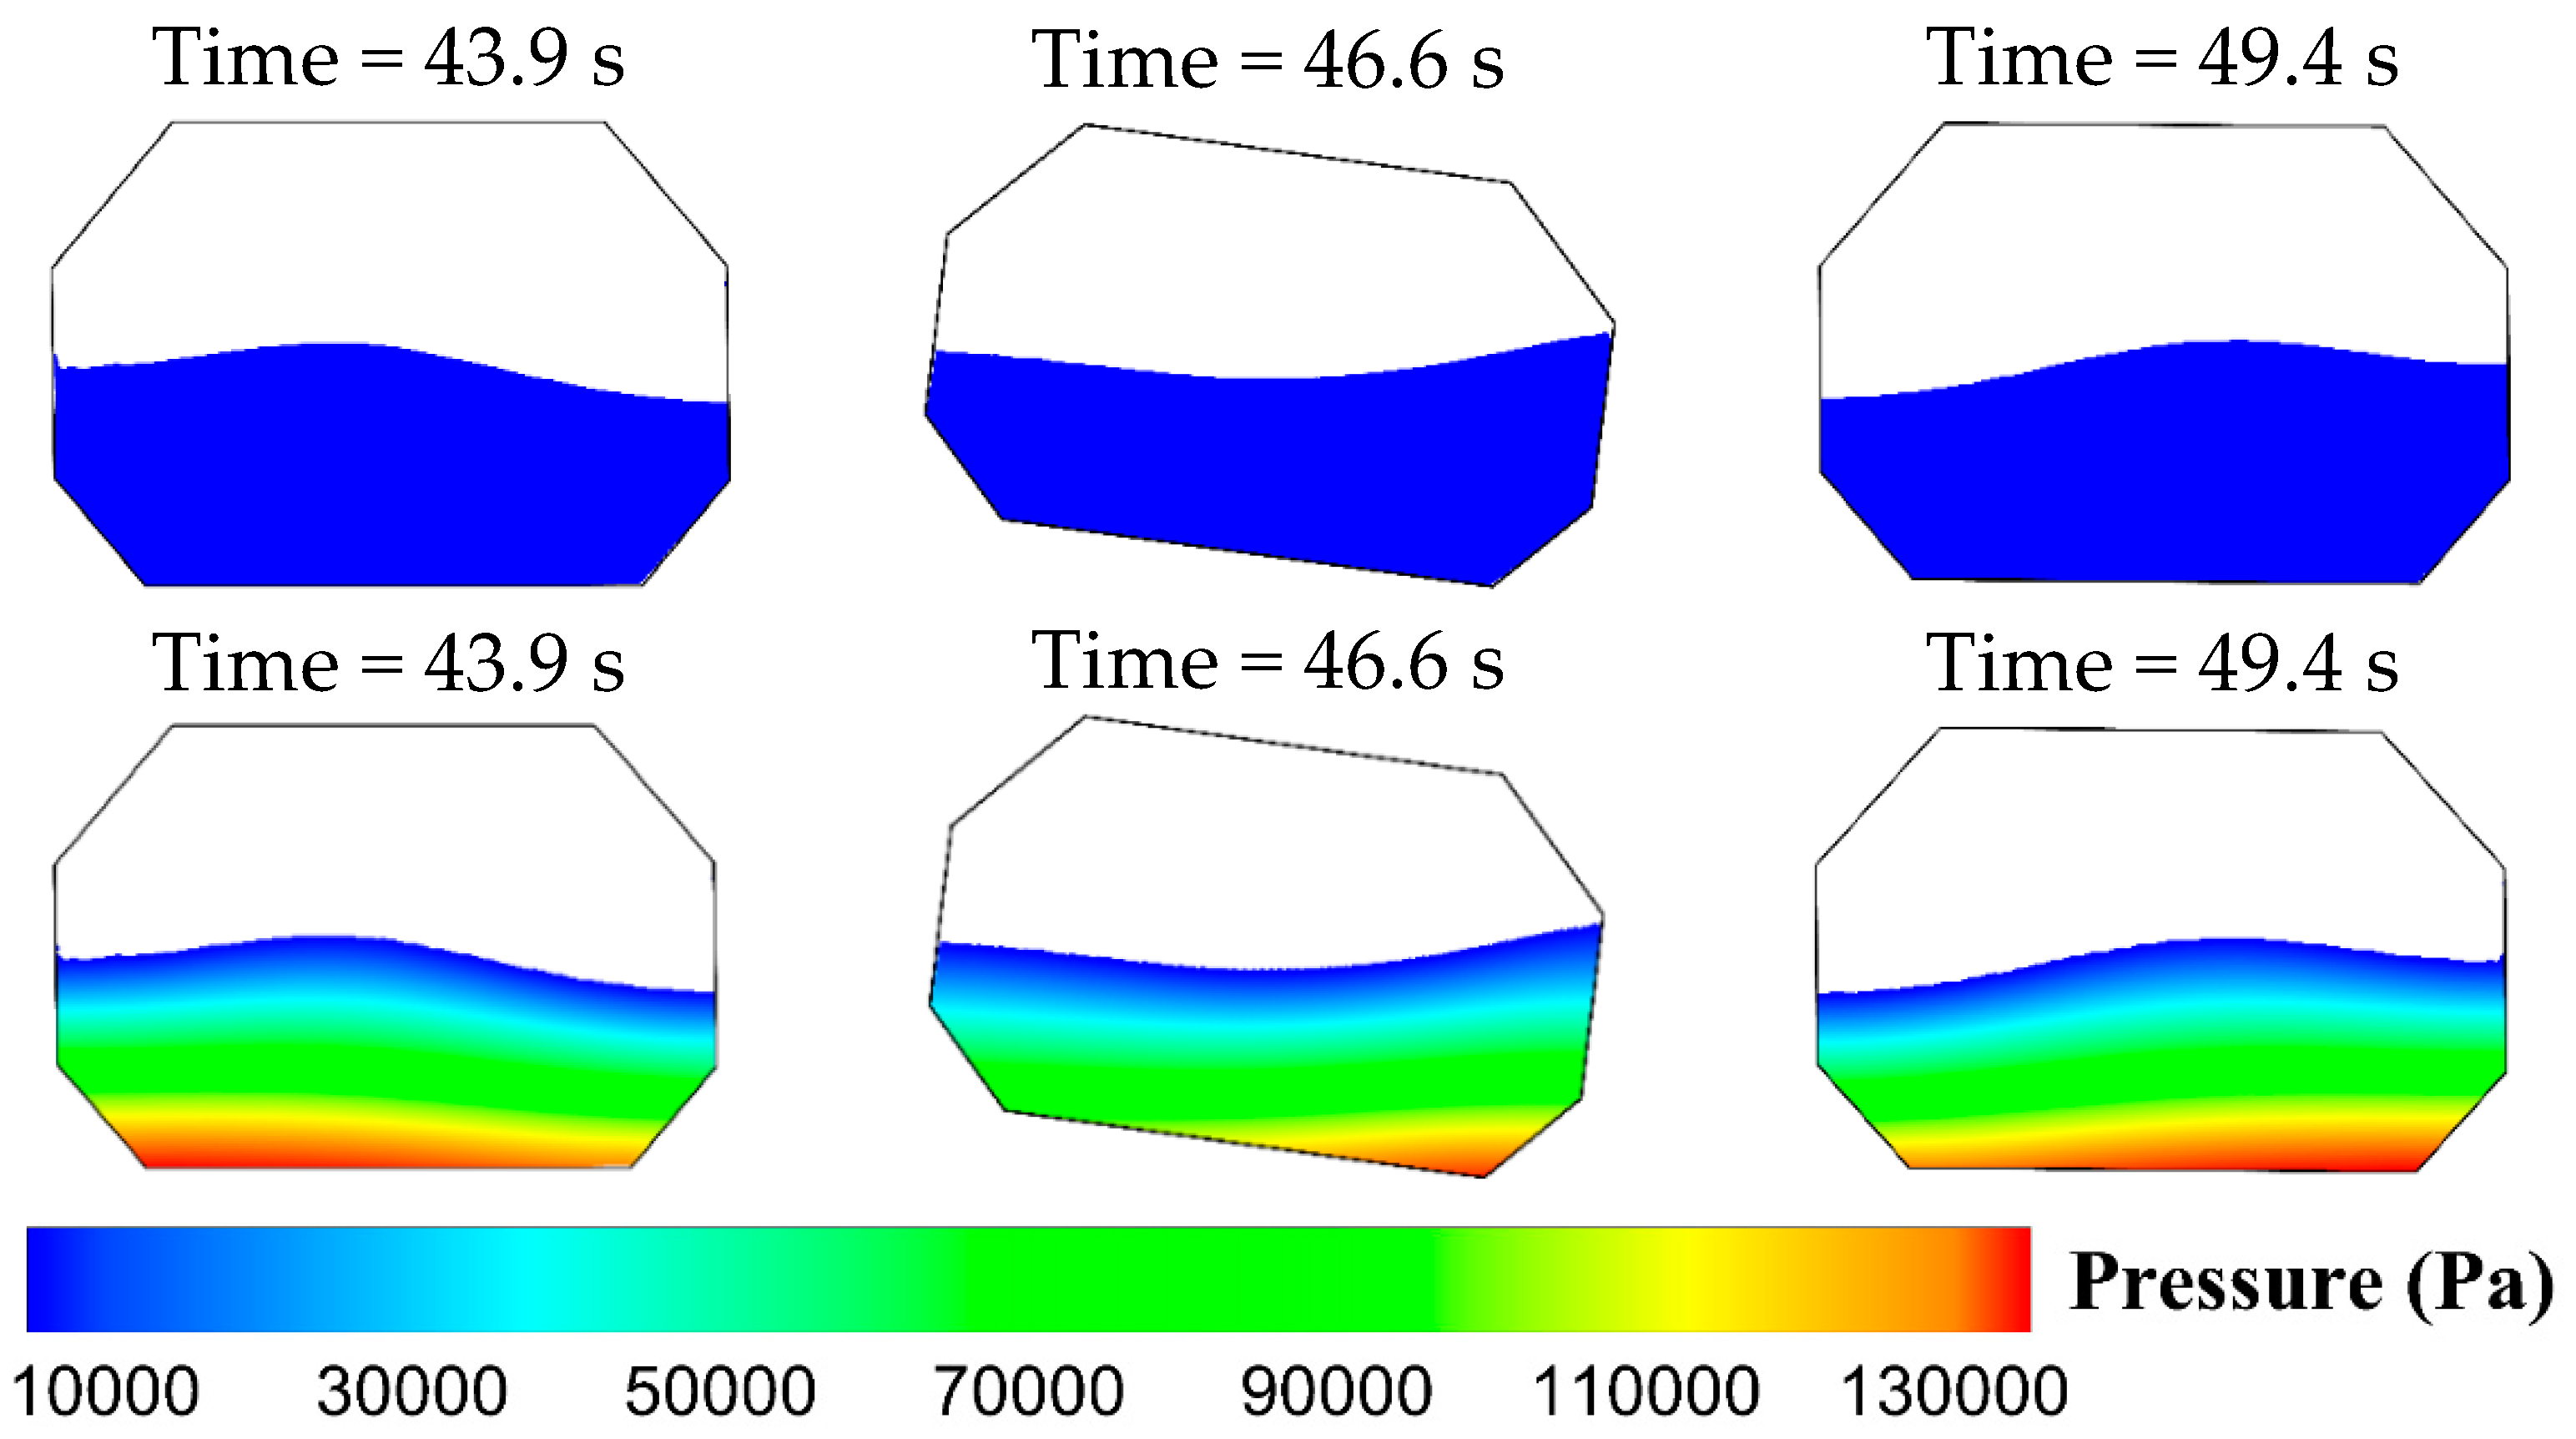
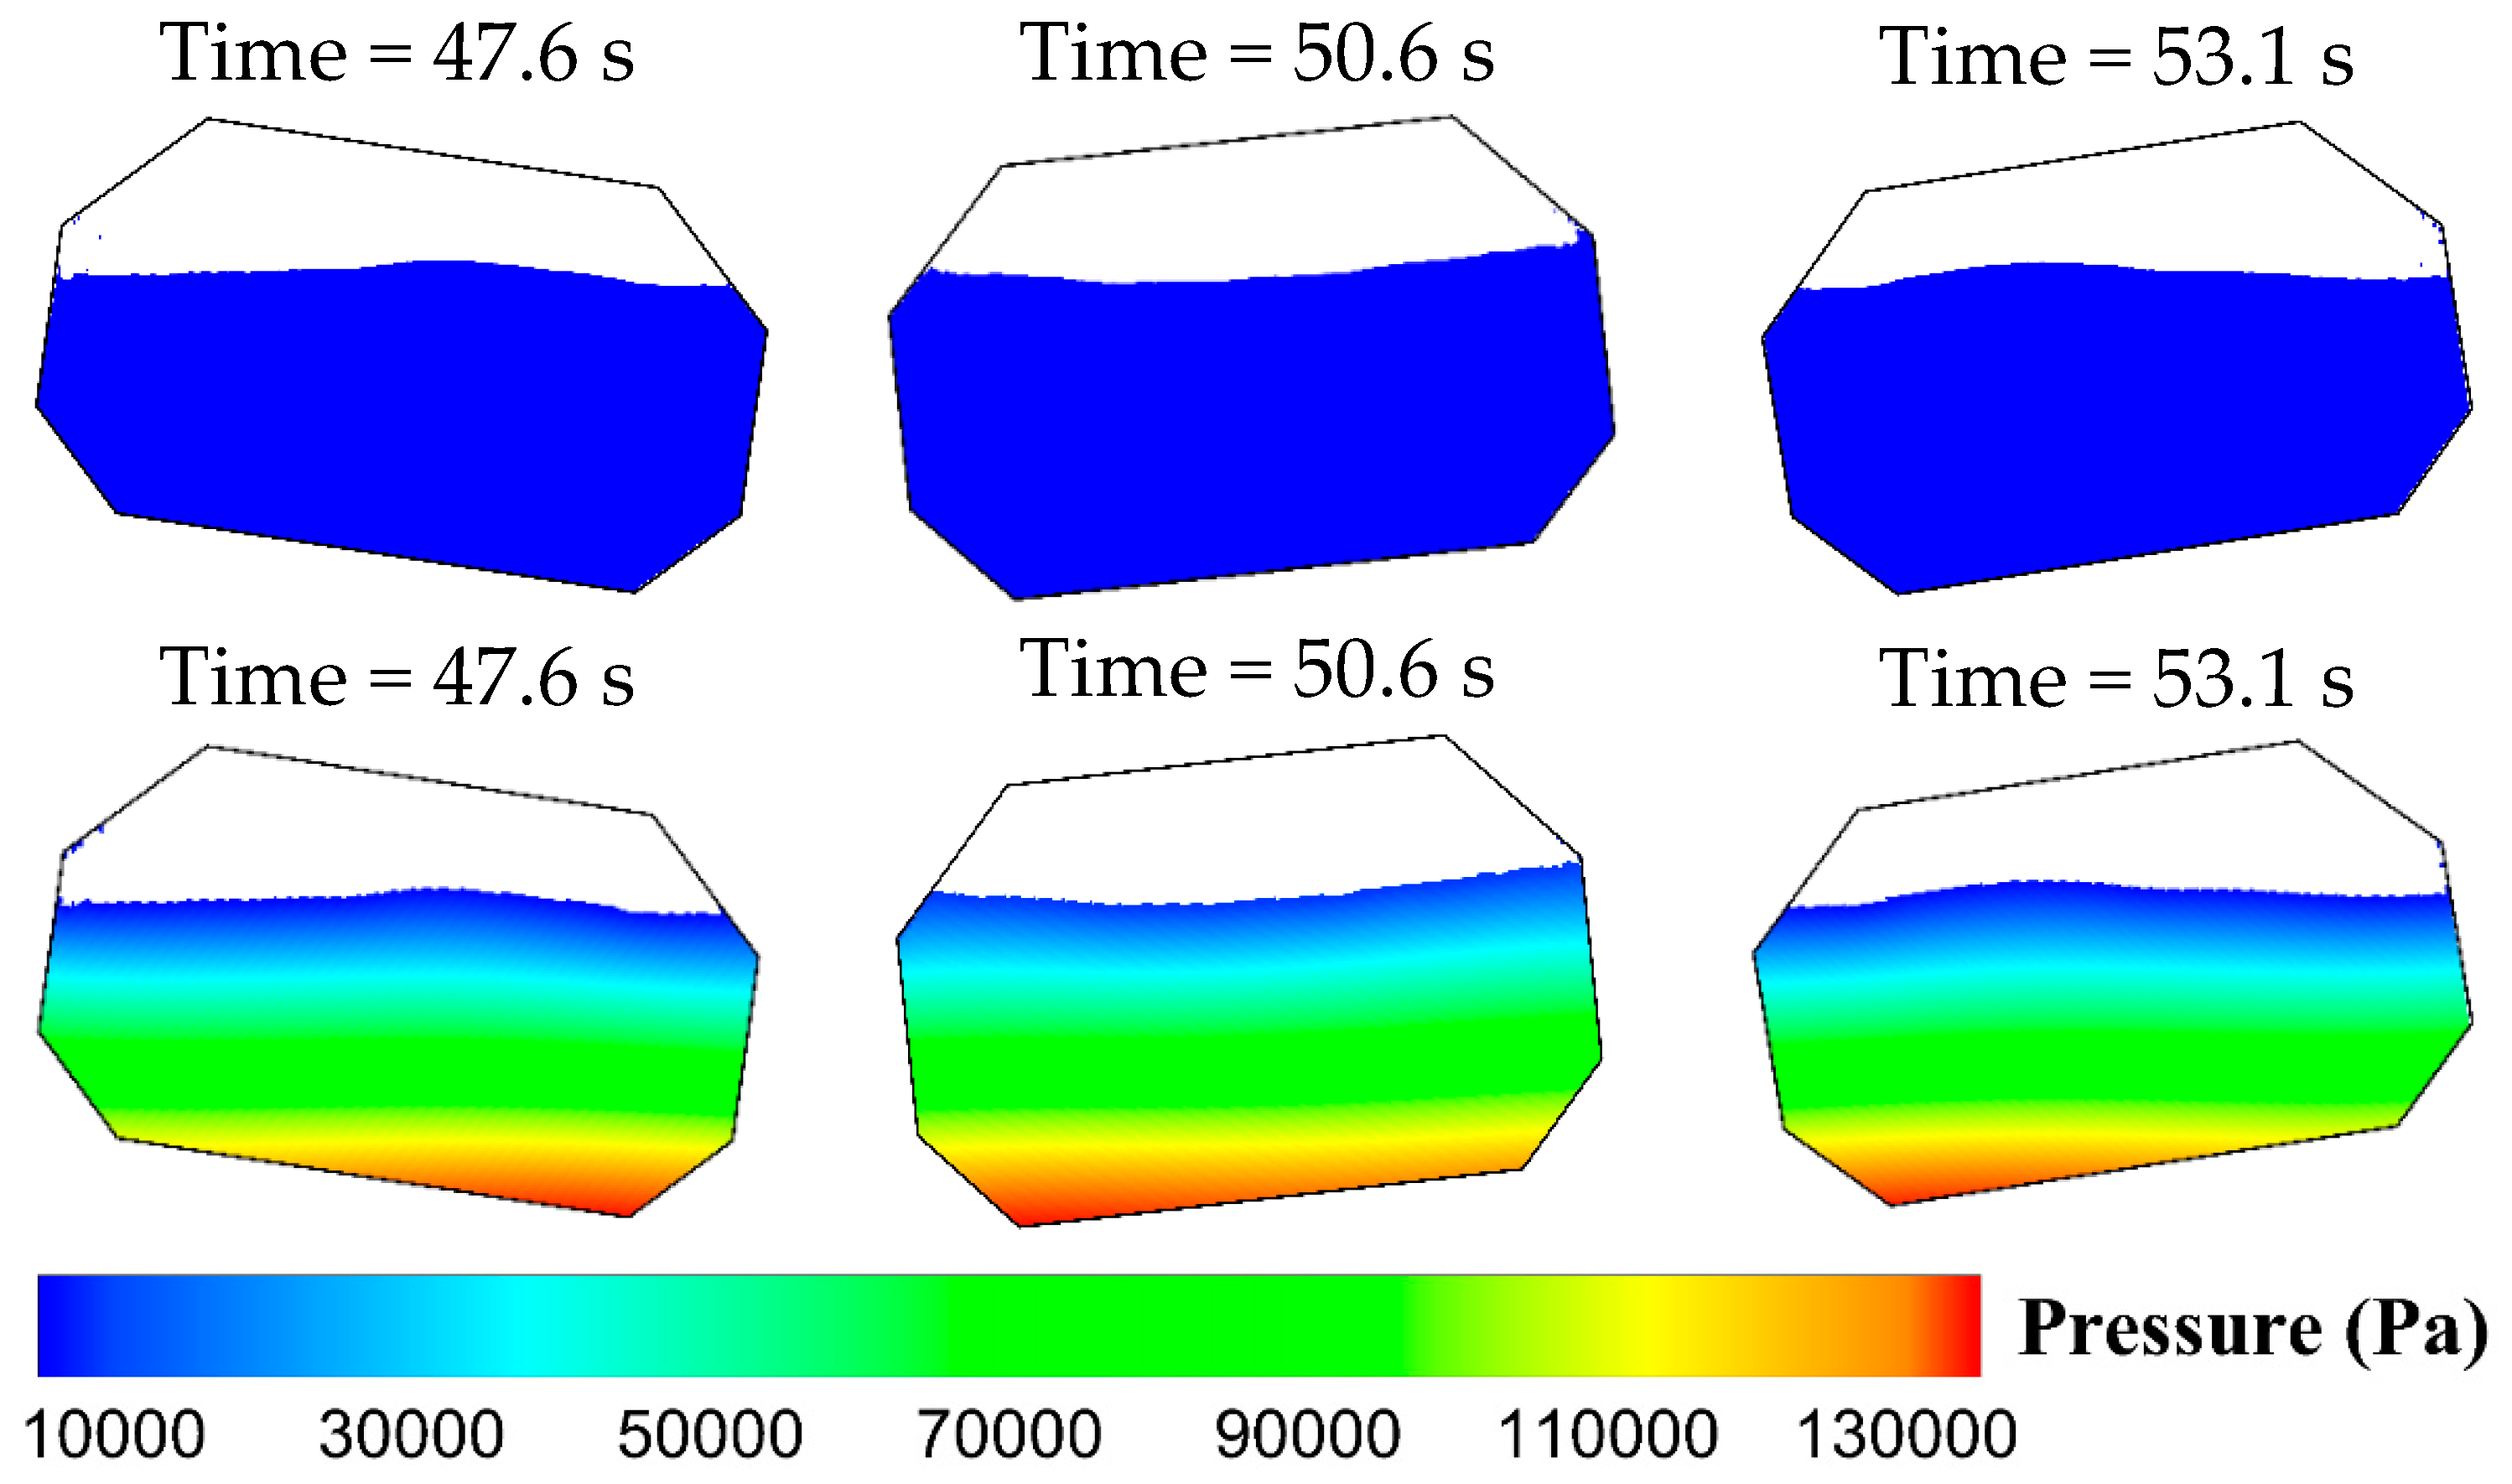
The corresponding results of the forcing period 11.0 s are also demonstrated in Figure 9. The maximal pressures are much close to the case of forcing period 10.0 s than the other two cases with a relatively smaller difference. The free surface snapshots reveal that the liquid is close to the inclined walls. From the two cases, we can conclude that the most serious and dangerous sloshing can occur around 10.0 s and 11.0 s. If this kind of tank is adopted in sea conditions with the peak period around 10.0 s and 11.0 s, moderately sloshing can occur and the safety problem should be paid attention with proper suppression devices being further considered.

4.2. Sloshing Responses of Higher Filling Level 70% of Tank Height

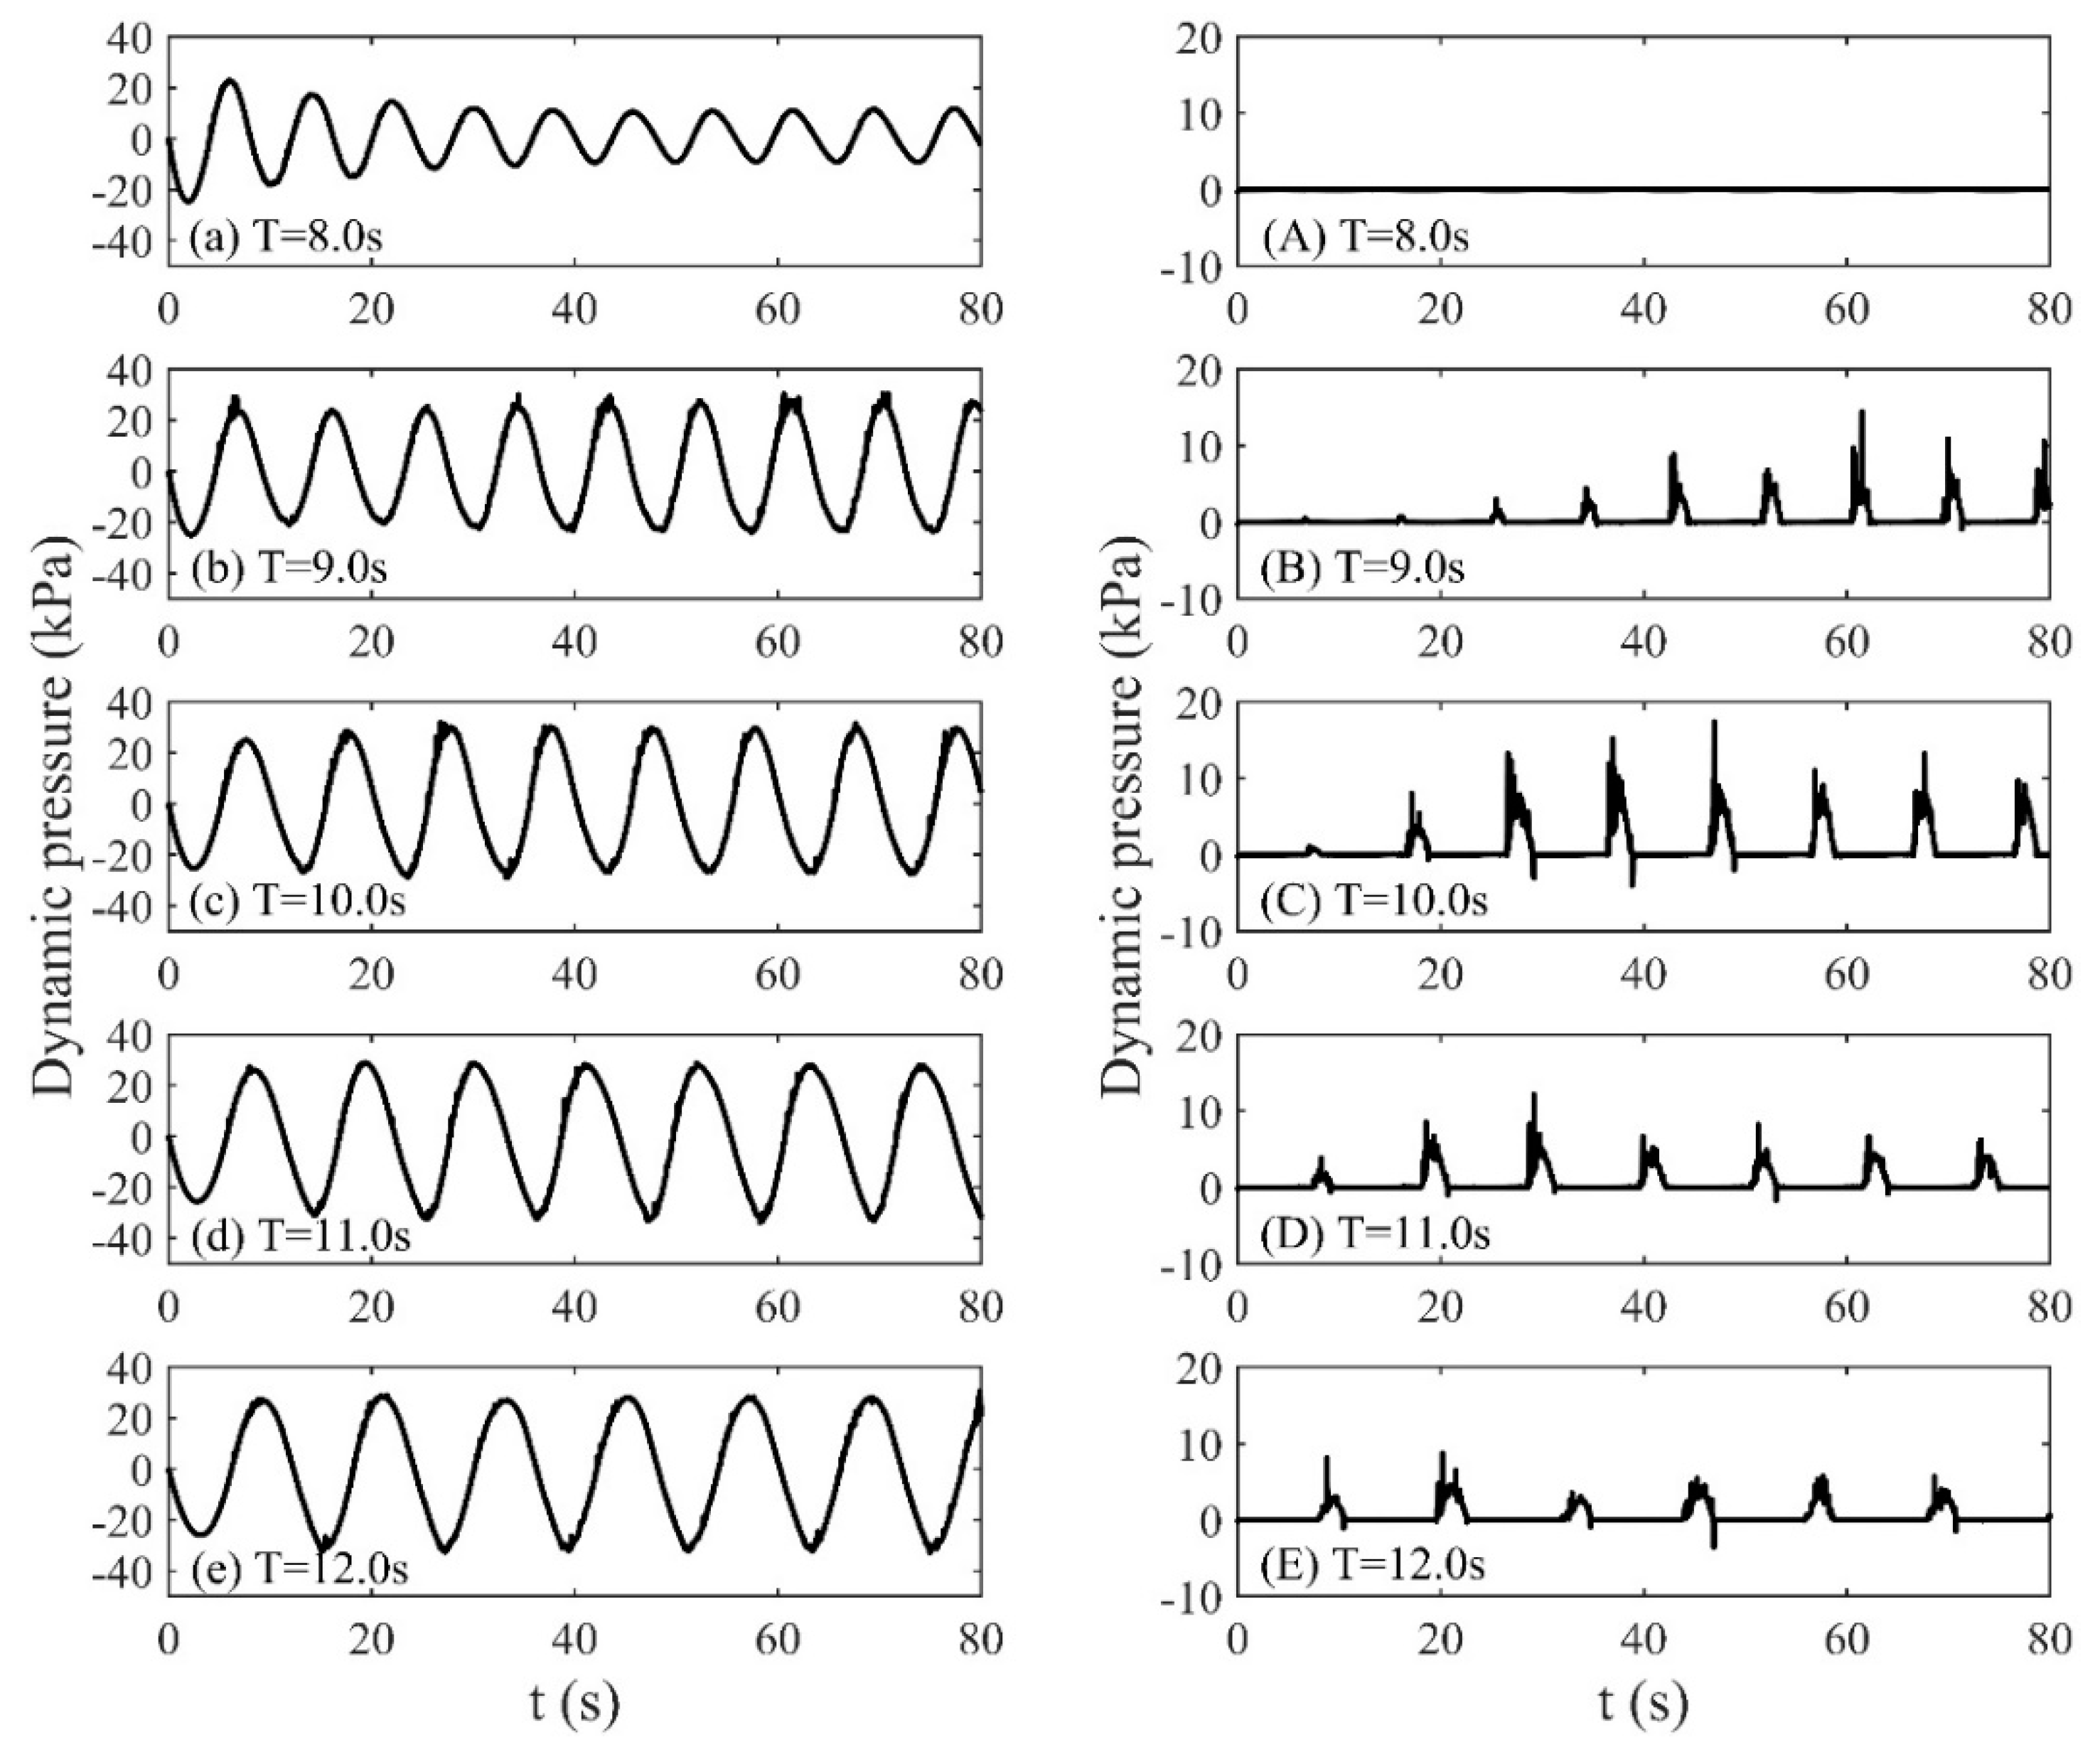
Except for the 50% filling level, a higher filling level 70% of H is also applicable in engineering, and the corresponding ratio of filling depth to tank length is 40.0%, which is an intermediate filling level and also within the operational category. To explore the response characteristics of the sloshing, the dynamic pressures among various forcing periods at P4 and P5 are shown in Figure 10. The left column stands for the results of dynamic pressures at P4, and the right column represents those at P5.
Similar to the former 50% filling case, the maximal dynamic pressures also appear in terms of the case with the forcing period 10.0 s, implying the most violent sloshing can be triggered under the forcing period 10.0 s. The left column reveals the crest of the case with the forcing period 10.0 s derivates from the balance more significantly than the trough compared to other four cases, which is an obvious nonlinear phenomenon. Considering that P5 is also above the still filling depth, the results in the right column can also represent the total pressure as well as dynamic pressure acting on the tank. The sloshing of the case with forcing period 8.0 is mild, and the glycerin cannot reach P5. Also, unlike the filling level 50% of H , the pressures above the still filling depth as shown in the right column of Figure 10, has several peaks resulting in a quick rising and falling which threats the safety of tanks. Although the present pressures in P5 are lower than those of P4 in the case of 50% filling of H , the quickly rising and falling can result in a high-frequency percussion which can cause fatigue damage and threat the safety of the long-distance transport. Besides, the quickly rising and falling slamming effect can also cause the instability of the storage tank. Thus, the present higher filling cases may have large safety issues than the lower filling level to some extent.
For a better understanding of the violent sloshing, the case with forcing period 10.0 s is discussed first, and the free surface snapshots at various moments corresponding to three successive troughs and peak in Figure 10 are demonstrated in the first line of Figure 11, and the corresponding pressure distributions are displayed below. From the snapshots, we can find that the liquid can reach the upper inclined wall with moderately breaking at some moments, little droplets climbing through the walls, and the breaking wave results in quickly slamming load on the tank wall. The quickly rising and falling of the pressures in P5 are due to the maximal free surface rising and receding of glycerin that pushes down [3,14].
Like the case with forcing period 10.0 s, the corresponding results of the forcing period 11.0 s at the same moments are demonstrated in Figure 12. We can find that both cases are violent and breaking, and there also exist some slashing droplets resulting in large loads on the upper inclined walls. The comparisons between the two cases also reveal that the case with the forcing period being 10.0 s is relatively much violent. To guarantee safety, the violent slamming should be avoided, and the most popular devices-internal horizontal, vertical, ring and performed baffles [27,28] should be introduced.

4.3. Frequency Responses of the Sloshing

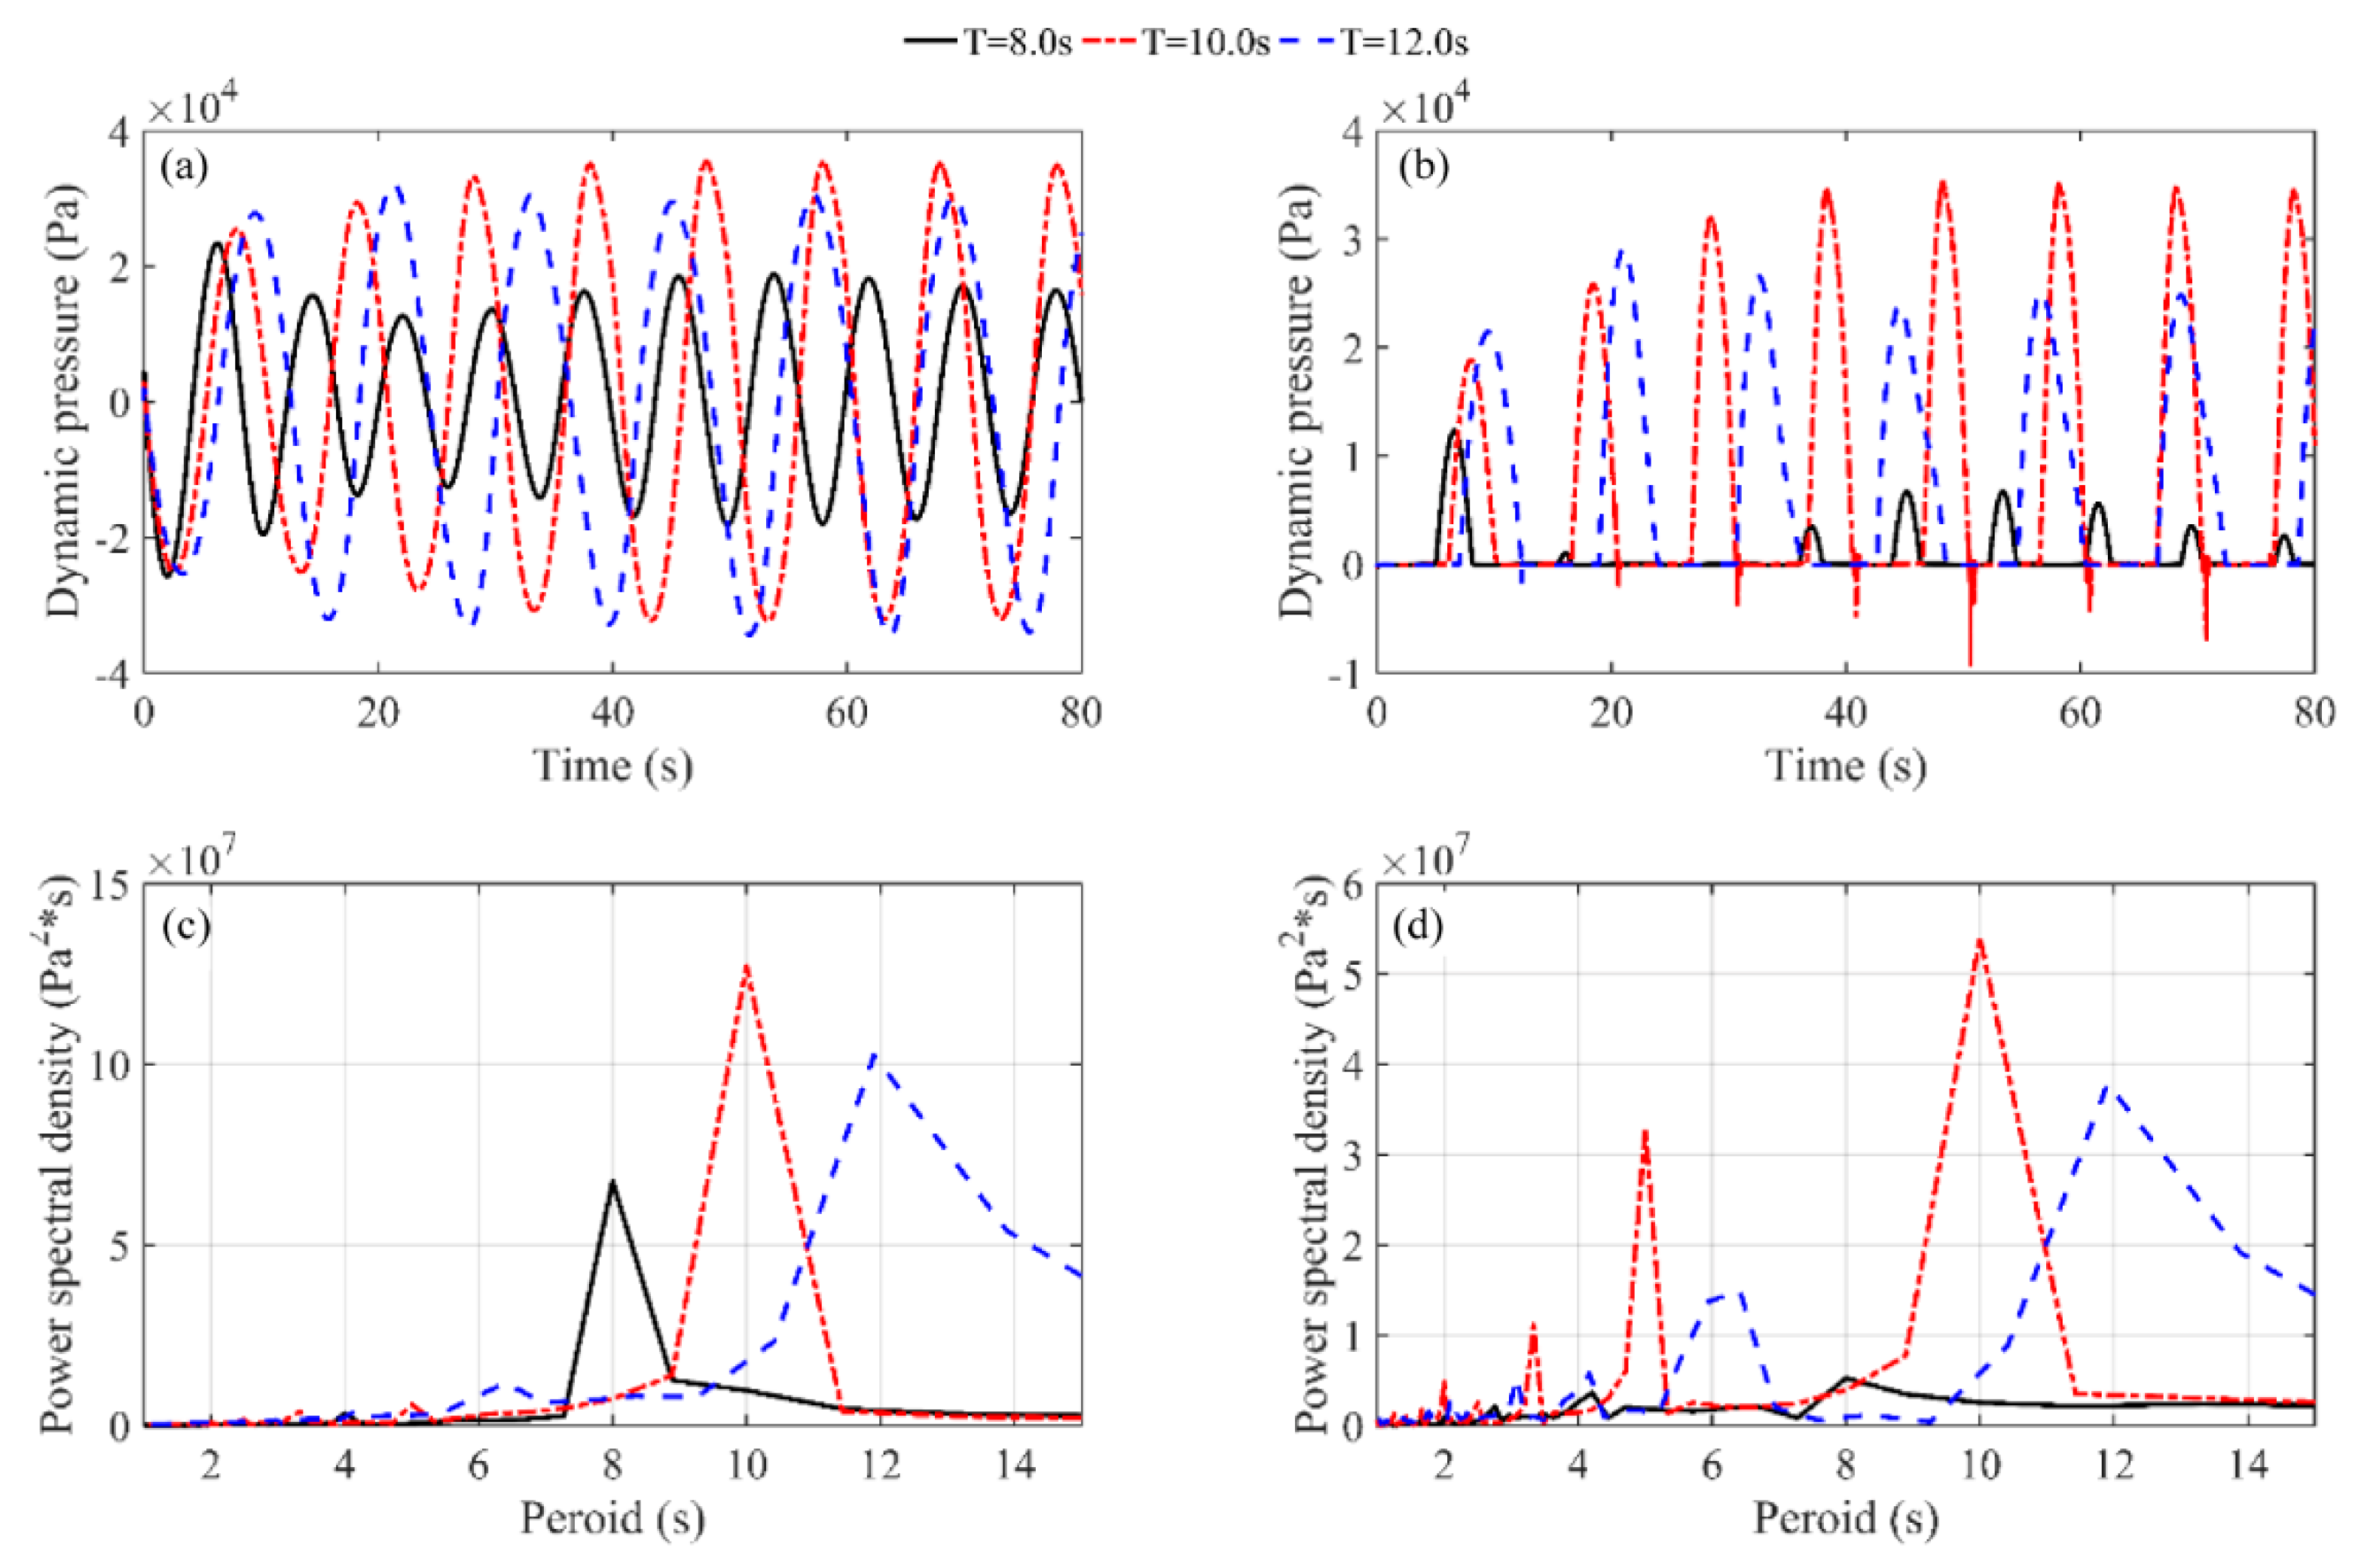
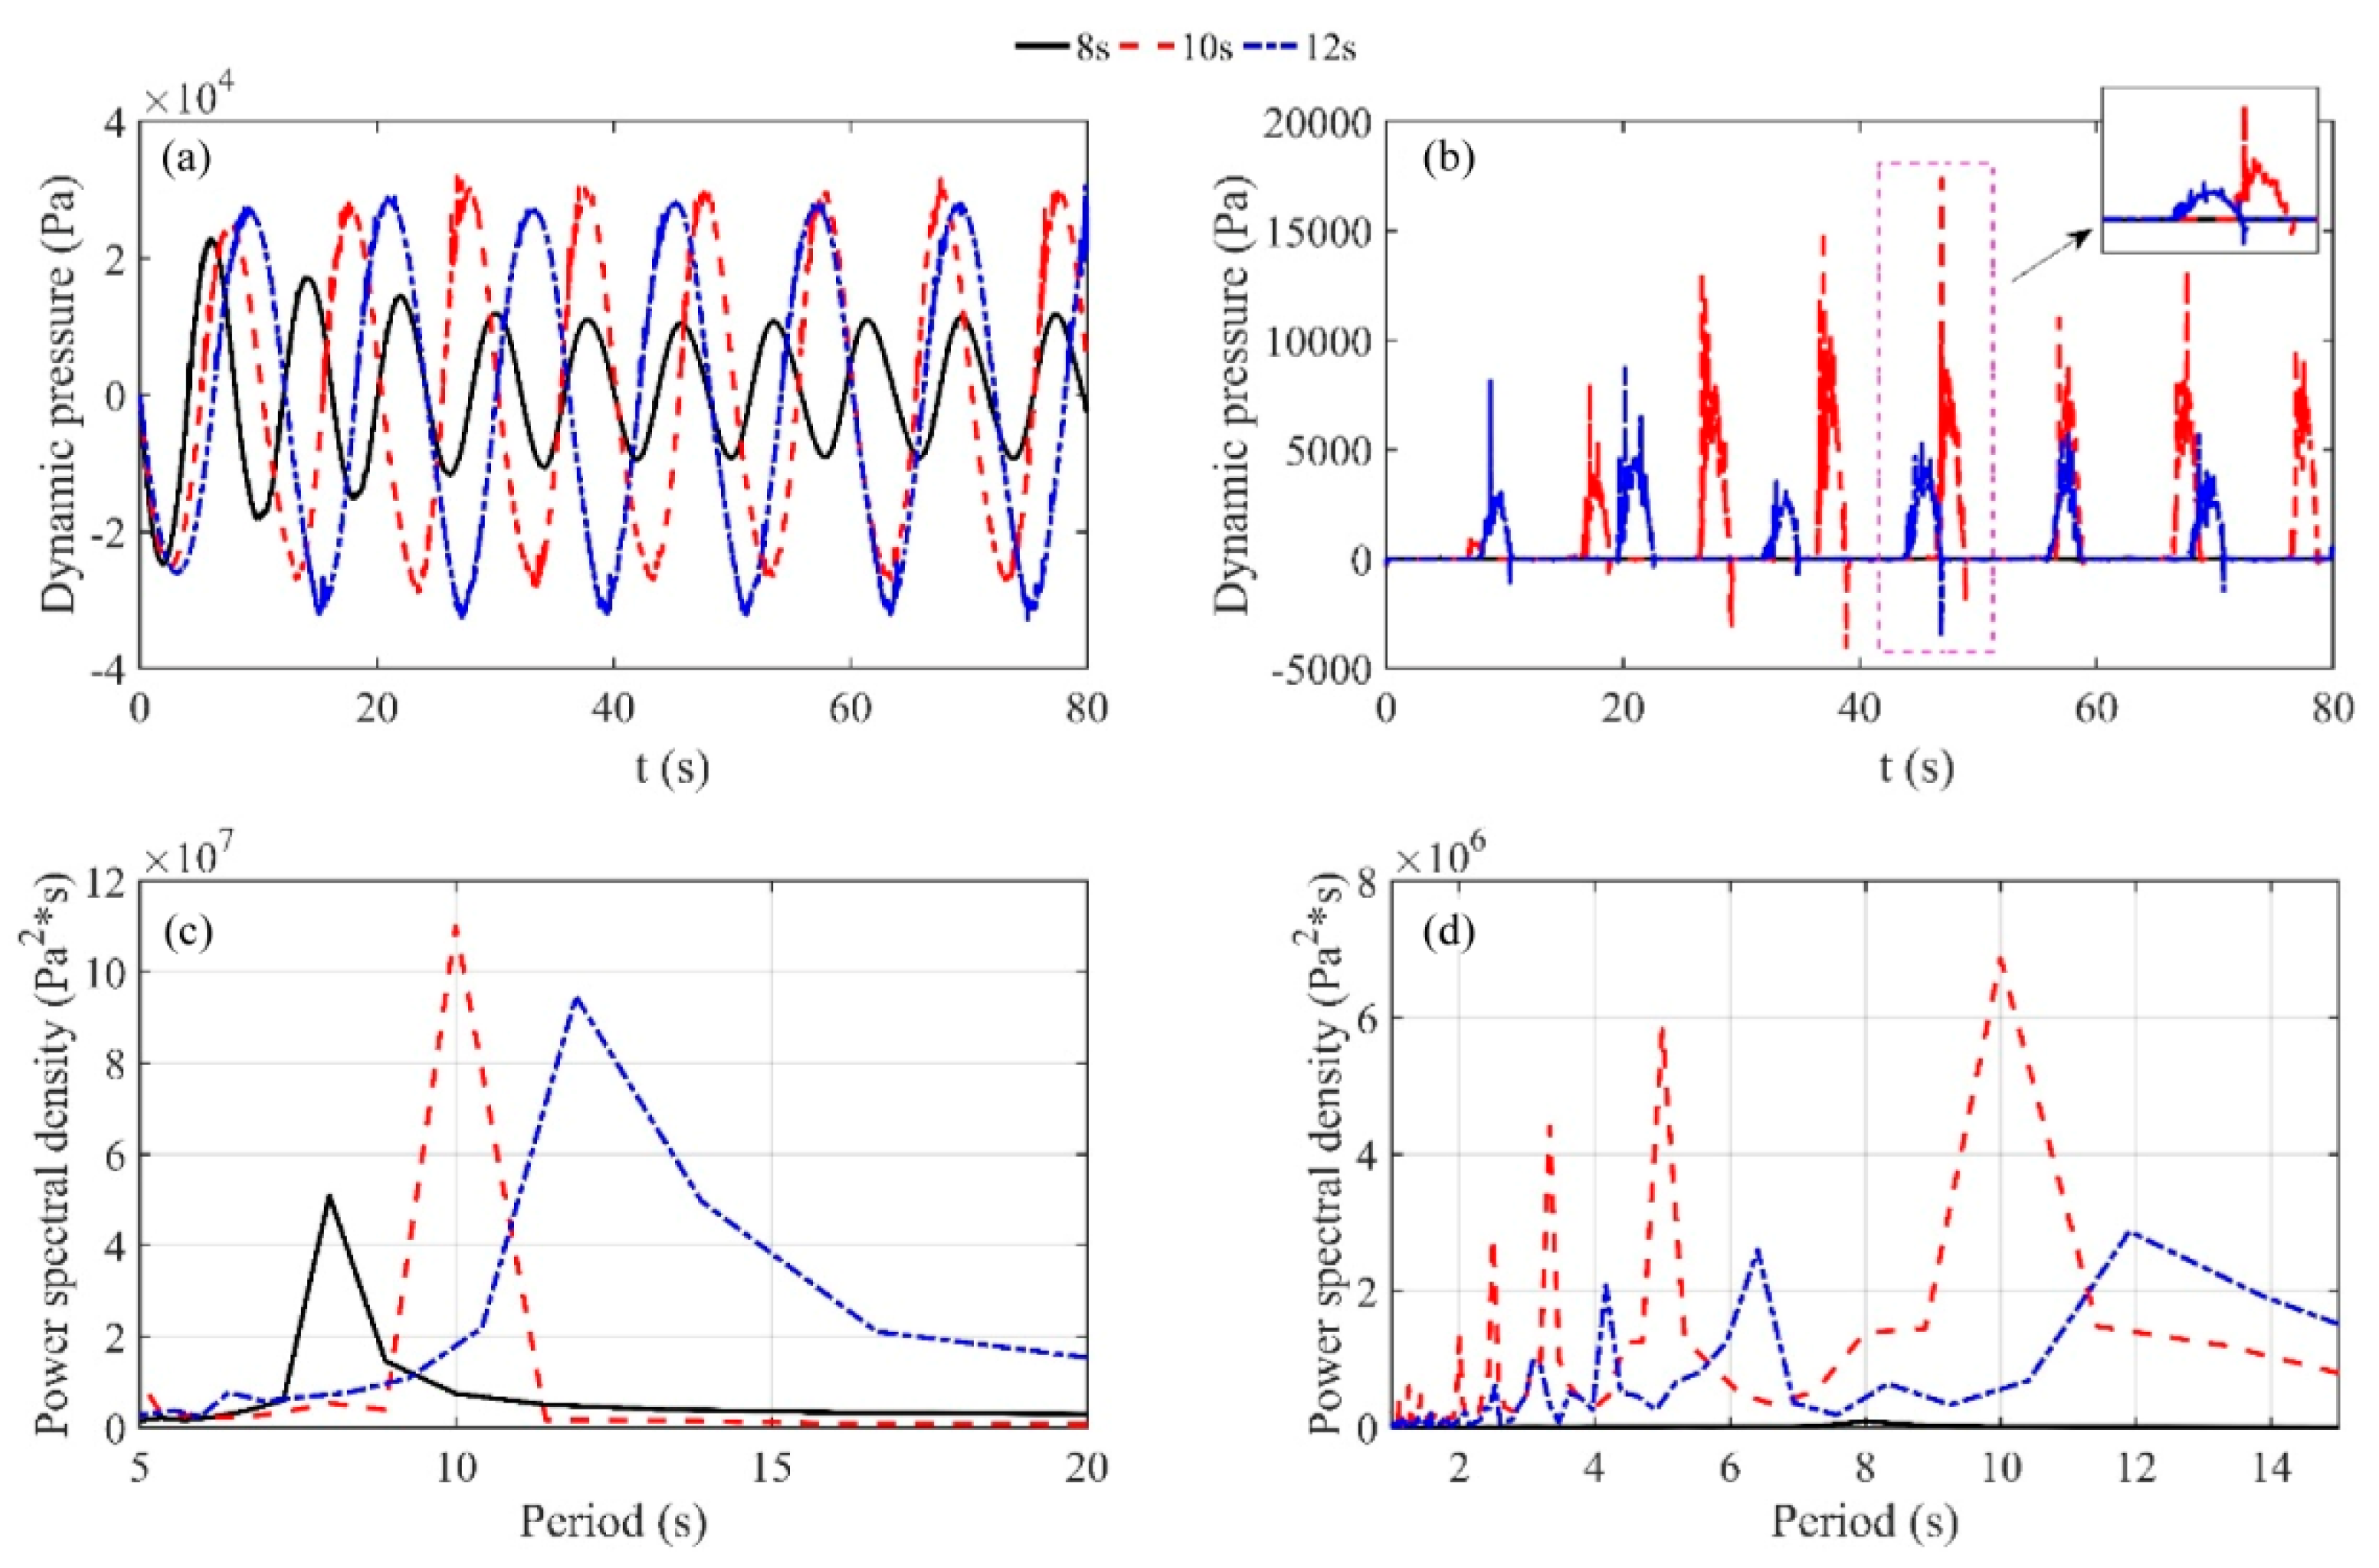
Besides the maximal response pressures, the frequency response is also of great importance in applications, which can guide the designers and manipulators to avoid incidents. To reveal the relationships among the forcing period and the response period, the fast Fourier transform (FFT) technique will be adopted to perform further investigation. Here three results under forcing periods 8.0 s, 10.0 s, and 12.0 s are demonstrated and discussed in detail.
The dynamic pressures of the case of 50% filling of tank height at P2 and P4 and the corresponding FFT (Fast Fourier Transform) results are shown in Figure 13a,b and Figure 13c,d respectively. It can be seen that the main dominant frequencies are 8.0 s, 10.0 s, and 12.0 s for the individual three cases which are also in accordance with the forcing periods for both pressures at P2 and P4. As for the results at P4, some obvious peaks at lower periods also exist especially for the cases T = 10.0 s and T = 12.0 s, which are contributed to slamming and breaking effects with shorter impact periods as shown and discussed in the former section. The spectra densities focused at lower frequencies of the case T = 12.0 s is relatively smaller than that of the case T = 10.0 s, which reveals that the slamming effect is weaker and it identifies that the case T = 10.0 s is more violent. From Figure 13c,d, it is obvious that the dominant frequency is the forcing period in all cases, however, we can find that there exist additional frequencies in Figure 13d in comparing to Figure 13c, equal to half, quarter, one-fourth and one-fifth of the forcing period, respectively, which is apparently different from the traditional low viscous fluid-water, with the response frequencies being the forcing period and the lowest natural frequency.
Except for the case of 50% filling of tank height, the dynamic pressures of the case of 70% filling of tank height at P4 and P5 and the corresponding FFT results are shown in Figure 14a,b and Figure 14c,d, respectively. Similar to the results of the case of 50% filling of tank height, the dominant frequency of all three cases is the forcing period. From Figure 14b, it is obvious that there exist several peaks, to better understand the response process, the dash section is zoomed. From the section zoomed in, we can find that the time interval between two peaks is small which results in a fast impact process. The corresponding FFT results of the dynamic pressures at P5 shown in Figure 14d display several peaks at lower periods. Taking the case of forcing period 10.0 s for example, besides the dominant frequency 10.0 s-equal to the forcing period, more peaks with values being 5.0 s, 2.5 s, and 2.0 s exist, close to half, a quarter and one-fourth of the forcing period, respectively. Except the mentioned four peaks, there also exists a period 3.5 s equal to half of the summation of 5.0 s and 2.0 s, contributing to the strongly nonlinear effect. Recalling the results of the 50% filling case in Figure 13, there exist fewer peaks with higher frequencies than that of the 70% filling case, which also reveals that the nonlinearity of 70% filling case is stronger than the 50% filling case.

5. Conclusions

Based on the Navier-Stokes numerical model, the sloshing of a highly viscous fluid in the full-scale prismatic tank is numerically investigated. The numerical model was validated against a self-conducted experiment and available numerical data, and rather good agreements have been guaranteed. Then the proposed numerical model is adopted to systematically study the full-scale sloshing of highly viscous fluid. Two different filling levels (50% and 70% of the tank height) are considered. The liquid kinematic viscosity 6.0 × 10⁻⁵ m2/s is chosen throughout this work. A wide range of forcing frequencies are used to identify the response process of pressures as well as free surface displacements. The frequency responses are further identified by the fast Fourier transformation technology. Through the discussions, some conclusions can be drawn:
  • The responses of dynamic pressures of the 50% filling height of the tank length behave larger values than that of the 70% filling height of the tank length for the same forcing period. The sloshing of the lower filling level behaves like a traveling wave and the sloshing of the higher filling level generally moves like a standing wave.
  • The free surface of the 70% filling case is more breaking than the lower filling case. There exist several peaks in the crests of the dynamic pressures for the 70% filling case, and the time intervals between peaks are very shot, which also reveals that the slamming effect is more obvious than the lower filling case.
  • Due to viscous effects, the nonlinearity is largely reduced compared to that of water but also exists by recalling the existence of the combinations of various frequencies. The dominant response frequencies of glycerin sloshing turn from the forcing period and lowest natural period to the forcing period and score times of the forcing period.

Author Contributions

Conceptualization, X.J. and S.M.; methodology, X.J.; software, X.J.; validation, S.M. and M.T.M.; investigation, S.M.; data curation, M.T.M.; writing—original draft preparation, M.L. and M.T.M.; writing—review and editing, X.J., S.M. and Z.H.; visualization, S.M. and M.L.; supervision, X.J.

Funding

This research received no external funding.

Acknowledgments

The experiment was conducted in Hohai University and supported by Mi-An Xue.

Conflicts of Interest

The authors declare no conflict of interest.

References

  1. Bass, R.L.; Bowles, E.B.; Trudell, R.W.; Navickas, J.; Peck, J.C.; Yoshimura, N.; Endo, S.; Pots, B.F.M. Modeling Criteria for Scaled LNG Sloshing Experiments. J. Fluid Eng. 1985, 107. [Google Scholar] [CrossRef]
  2. Kim, Y.; Shin, Y.-S.; Lee, K.H. Numerical study on slosh-induced impact pressures on three-dimensional prismatic tanks. Appl. Ocean Res. 2004, 26, 213–226. [Google Scholar] [CrossRef]
  3. Zou, C.-F.; Wang, D.-Y.; Cai, Z.-H.; Li, Z. The effect of liquid viscosity on sloshing characteristics. J. Mar. Sci. Technol. 2015, 20, 765–775. [Google Scholar] [CrossRef]
  4. Baudry, V.; Rousset, J.-M. Experimental Study of Viscous Cargo Behaviour and Investigation on Global Loads Exerted on Ship Tanks. In Proceedings of the ASME 2017 36th International Conference on Ocean, Offshore and Arctic Engineering, Trondheim, Norway, 25–30 June 2017; p. V07BT06A015. [Google Scholar]
  5. Faitinsen, O.M. A numerical nonlinear method of sloshing in tanks with two-dimensional flow. J. Ship Res. 1978, 22, 193–202. [Google Scholar]
  6. Faltinsen, O.M.; Rognebakke, O.F.; Lukovsky, I.A.; Timokha, A.N. Multidimensional modal analysis of nonlinear sloshing in a rectangular tank with finite water depth. J. Fluid Mech. 2000, 407, 201–234. [Google Scholar] [CrossRef]
  7. Hill, D.F. Transient and steady-state amplitudes of forced waves in rectangular basins. Phys. Fluids 2003, 15, 1576–1587. [Google Scholar] [CrossRef]
  8. Faltinsen, O.M.; Timokha, A.N. Resonant three-dimensional nonlinear sloshing in a square-base basin. Part 4. Oblique forcing and linear viscous damping. J. Fluid Mech. 2017, 822, 139–169. [Google Scholar] [CrossRef]
  9. Wu, G.; Taylor, R.E.; Greaves, D.J.J.o.E.M. The effect of viscosity on the transient free-surface waves in a two-dimensional tank. J. Eng. Math. 2001, 40, 77–90. [Google Scholar] [CrossRef]
  10. Rudman, M.; Cleary, P.W.; Prakash, M. Simulation of liquid sloshing in model LNG tank using smoothed particle hydrodynamics. Int. J. Offshore Polar Eng. 2009, 19, 286–294. [Google Scholar]
  11. Luo, M.; Koh, C.; Bai, W.J.O.E. A three-dimensional particle method for violent sloshing under regular and irregular excitations. Ocean Eng. 2016, 120, 52–63. [Google Scholar] [CrossRef]
  12. Zhao, Y.; Chen, H.-C.J.O.E. Numerical simulation of 3D sloshing flow in partially filled LNG tank using a coupled level-set and volume-of-fluid method. Ocean Eng. 2015, 104, 10–30. [Google Scholar] [CrossRef]
  13. Kim, J.K.W.; Shin, Y.; Sim, I.; Kim, Y.; Bai, K. Three-Dimensional Finite-Element Computation for the Sloshing Impact Pressure In LNG Tank. In Proceedings of the Thirteenth International Offshore and Polar Engineering Conference, Honolulu, HI, USA, 25–30 May 2003. [Google Scholar]
  14. Jin, X.; Lin, P. Viscous effects on liquid sloshing under external excitations. Ocean Eng. 2019, 171, 695–707. [Google Scholar] [CrossRef]
  15. Liu, D.; Lin, P. A numerical study of three-dimensional liquid sloshing in tanks. J. Comput. Phys. 2008, 227, 3921–3939. [Google Scholar] [CrossRef]
  16. Lin, P.; Li, C. Wave–current interaction with a vertical square cylinder. Ocean Eng. 2003, 30, 855–876. [Google Scholar] [CrossRef]
  17. Dongming, L. Numerical Modeling of Three-Dimensional Water Waves and Their Interaction with Structures; National University of Singapore: Singapore, 2008. [Google Scholar]
  18. Chorin, A.J. Numerical solution of the Navier-Stokes equations. Math. Comput 1968, 22, 745–762. [Google Scholar] [CrossRef]
  19. Gueyffier, D.; Li, J.; Nadim, A.; Scardovelli, R.; Zaleski, S.J.J.o.C.p. Volume-of-fluid interface tracking with smoothed surface stress methods for three-dimensional flows. J. Comput. Phys. 1999, 152, 423–456. [Google Scholar] [CrossRef]
  20. Yu, L.; Xue, M.-A.; Zheng, J. Experimental study of vertical slat screens effects on reducing shallow water sloshing in a tank under horizontal excitation with a wide frequency range. Ocean Eng. 2019, 173, 131–141. [Google Scholar] [CrossRef]
  21. Register, L. Guidance on the Operation of Membrane LNG Ships to Reduce the Risk of Damage Due to Sloshing; Technical report; Lloyds Register: London, UK, 2008. [Google Scholar]
  22. Cai, Z.-h.; Wang, D.-y.; Li, Z. Influence of excitation frequency on slosh-induced impact pressures of liquefied natural gas tanks. J. Shanghai Jiao Tong Univ. 2011, 16, 124–128. [Google Scholar] [CrossRef]
  23. Toba, Y.; Iida, N.; Kawamura, H.; Ebuchi, N.; Jones, I.S. Wave dependence of sea-surface wind stress. J. Phys. Oceanogr. 1990, 20, 705–721. [Google Scholar] [CrossRef]
  24. Earle, M.D. Extreme wave conditions during Hurricane Camille. J. Geophys. Res. 1975, 80, 377–379. [Google Scholar] [CrossRef]
  25. Pickrill, R.; Mitchell, J. Ocean wave characteristics around New Zealand. N. Zeal. J. Mar. Fresh 1979, 13, 501–520. [Google Scholar] [CrossRef] [Green Version]
  26. Araújo, C.E.; Franco, D.; MELO, E.; Pimenta, F. Wave regime characteristics of the southern Brazilian coast. In Proceedings of the Sixth International Conference on Coastal and Port Engineering in Developing Countries, COPEDEC VI, Colombo, Sri Lanka, 5–19 September 2003; p. 15. [Google Scholar]
  27. Biswal, K.; Bhattacharyya, S.; Sinha, P. Free-vibration analysis of liquid-filled tank with baffles. J. Sound Vib. 2003, 259, 177–192. [Google Scholar] [CrossRef]
  28. Xue, M.-A.; Lin, P. Numerical study of ring baffle effects on reducing violent liquid sloshing. Comput. Fluids 2011, 52, 116–129. [Google Scholar] [CrossRef]
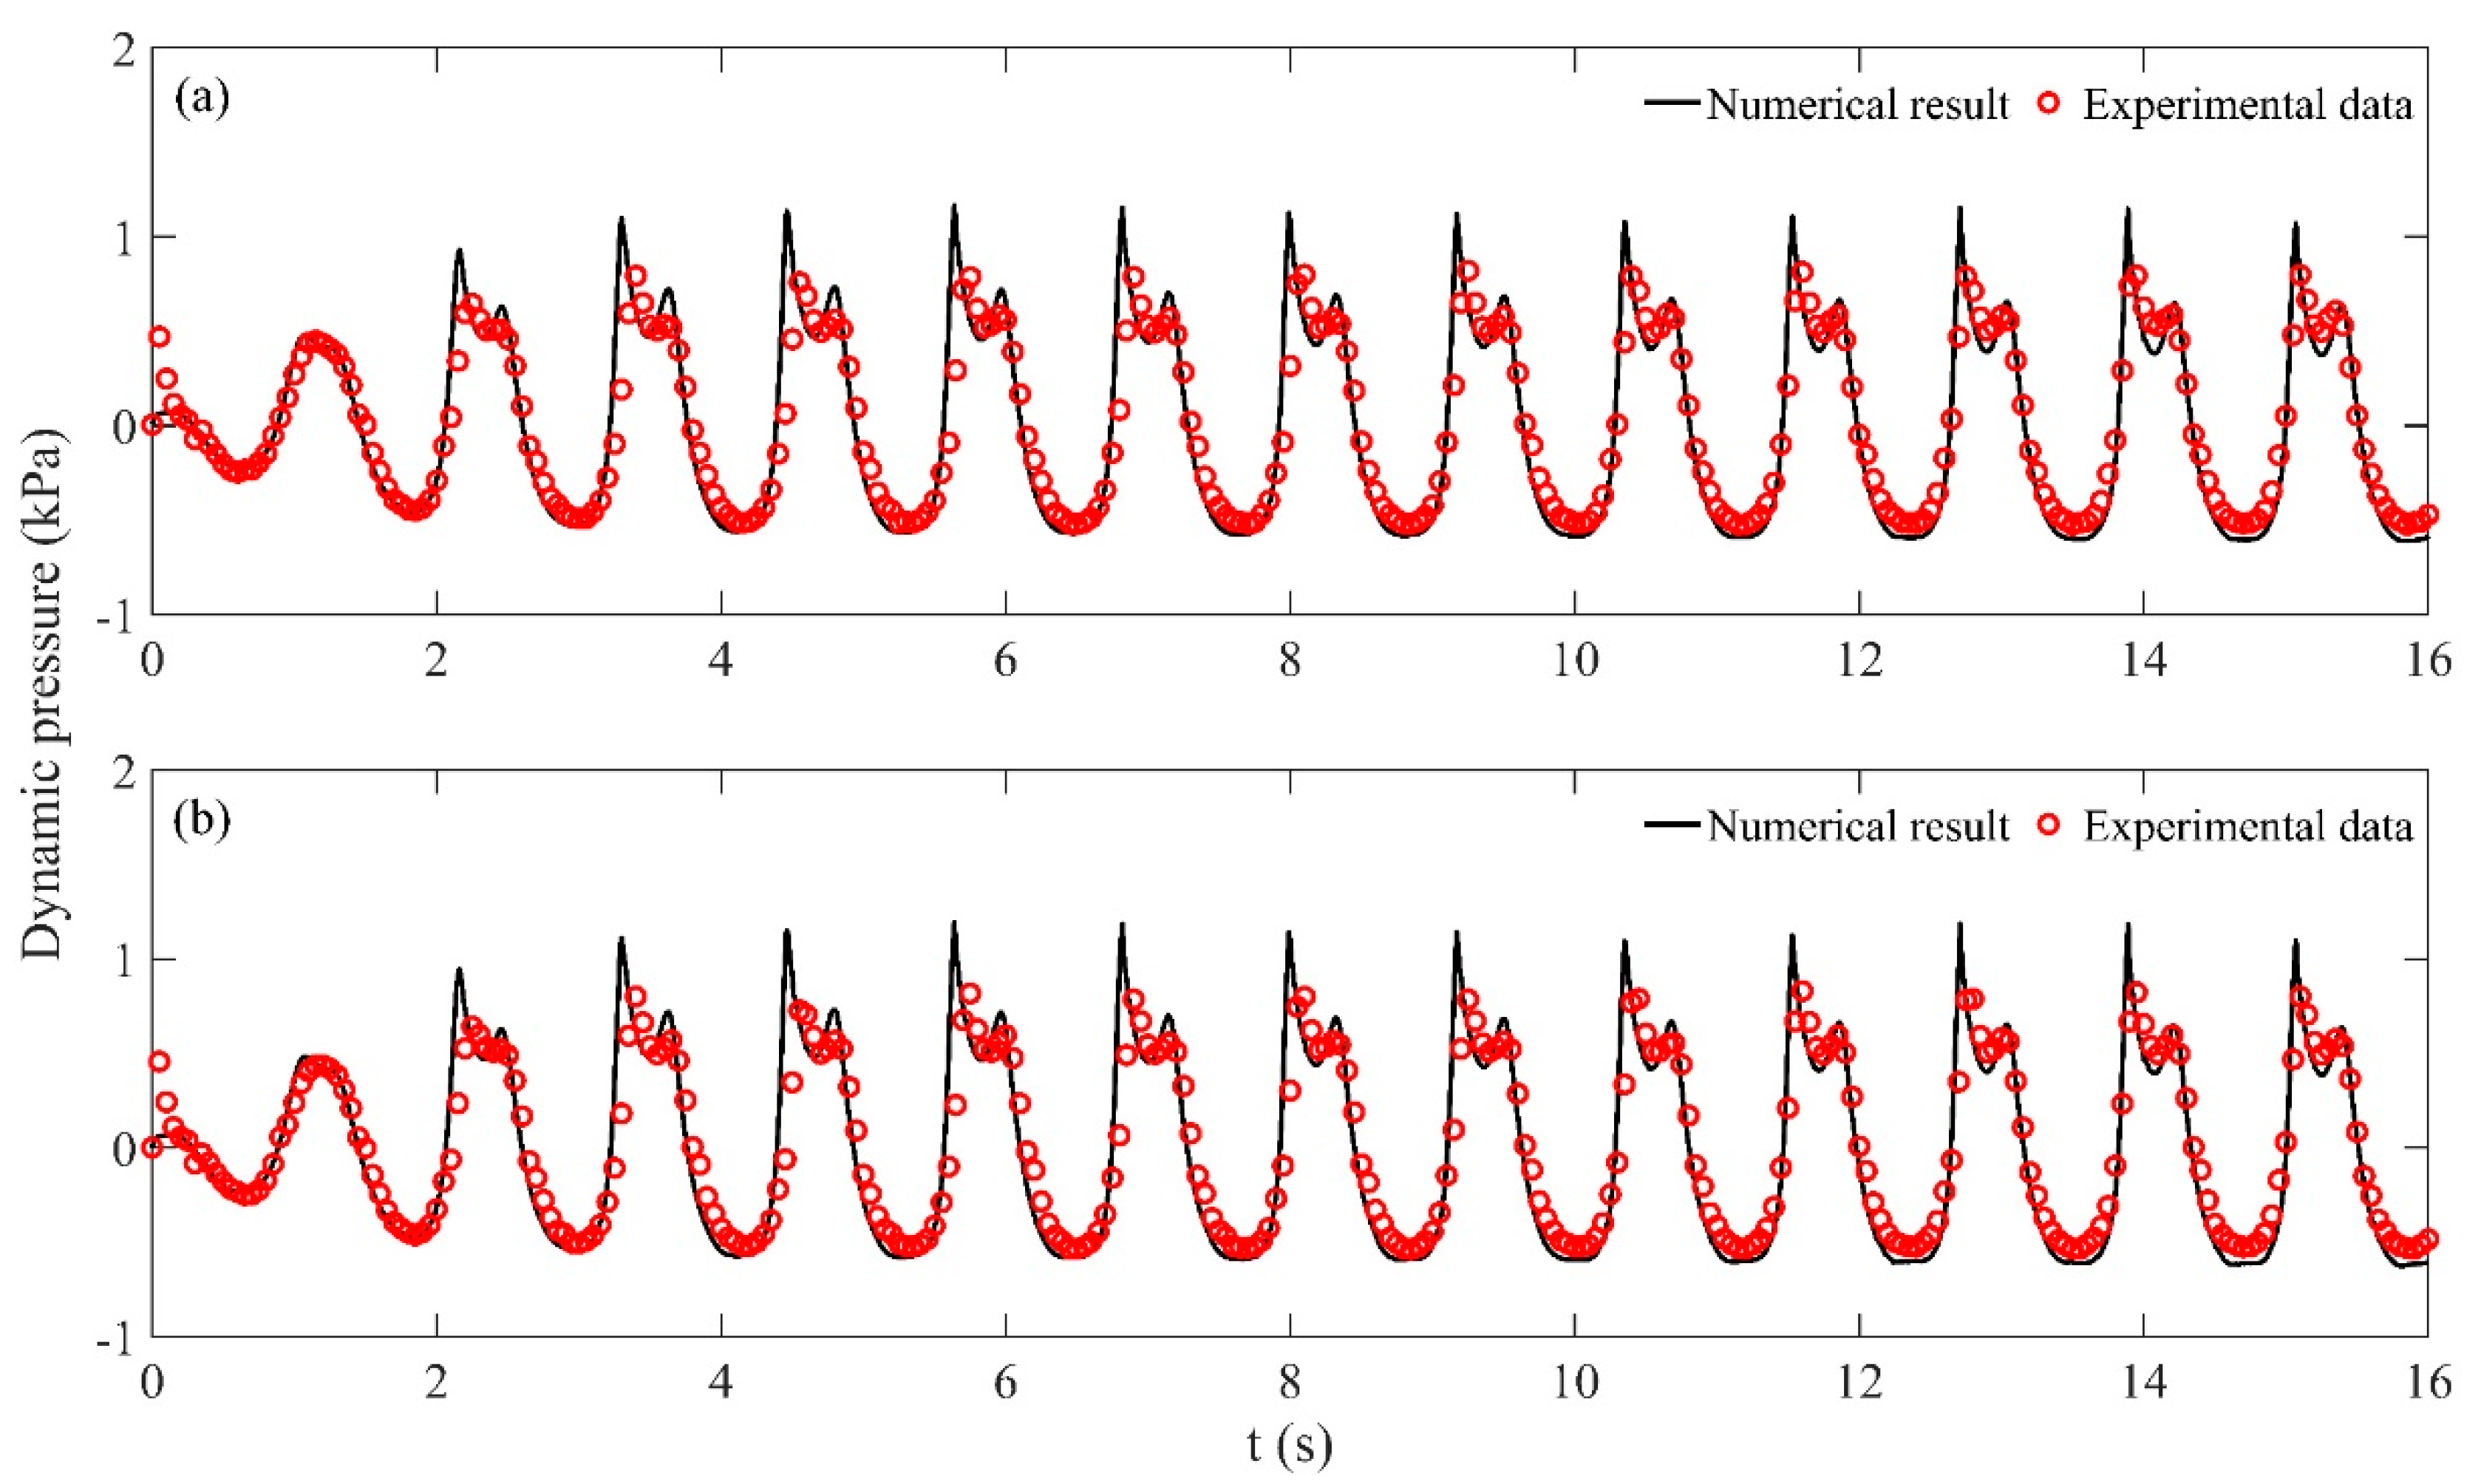
Figure 1. Comparisons of time histories of the dynamic pressures between the present numerical result (solid line) and experimental data (circle): (a) 3 cm away from the bottom, (b) 7 cm away from the bottom.
Energies 12 04244 g001
Figure 2. Numerical snapshots of the free surfaces at 2.5 s, 5.0 s, 10.0 s, and 15.0 s.
Energies 12 04244 g002aEnergies 12 04244 g002b
Figure 3. Diagram of the membrane-type tank and corresponding arrangements.
Energies 12 04244 g003
Figure 4. Comparison of time histories of the dynamic pressures between the present numerical result (solid line) and experimental data (circle) at P1.
Energies 12 04244 g004
Figure 5. Numerical snapshots of the free surfaces at 15.8 s, 16.0 s, 16.2 s, 16.3 s, 16.7 s, and 17.0 s.
Energies 12 04244 g005
Figure 6. Diagram of the membrane-type tank and corresponding arrangements.
Energies 12 04244 g006
Figure 7. Comparisons of dynamic pressures among various forcing periods 8.0 s, 9.0 s, 10.0 s, 11.0 s and 12.0 s at P2 (left column) and P4 (right column).
Energies 12 04244 g007
Figure 8. Snapshots of free surfaces (first line) and corresponding pressures (second line) in the case T = 10.0 s at various moments.
Energies 12 04244 g008
Figure 9. Snapshots of free surfaces (first line) and corresponding pressures (second line) in the case T = 11.0 s at various moments.
Energies 12 04244 g009
Figure 10. Comparisons of dynamic pressures among various forcing periods 8.0 s, 9.0 s, 10.0 s, 11.0 s and 12.0 s at P4 (left column) and P5 (right column).
Energies 12 04244 g010
Figure 11. Snapshots of free surfaces (first line) and corresponding pressures (second line) in the case T = 10.0 s at various moments.
Energies 12 04244 g011
Figure 12. Snapshots of free surfaces (first line) and corresponding pressures (second line) in the case T = 11.0 s at various moments.
Energies 12 04244 g012
Figure 13. Dynamic pressures for the case of 50% filling of tank height under forcing period 8.0 s (black line), 10.0 s (dash-dot line), and 12.0 s (dash line) at (a): P2, (b): P4. The corresponding power spectra (c) and (d).
Energies 12 04244 g013
Figure 14. Dynamic pressures for the case of 70% filling of tank height under forcing period 8.0 s (black line), 10.0 s (dash-dot line), and 12.0 s (dash line) at (a): P4, (b): P5. The corresponding power spectra (c) and (d).
Energies 12 04244 g014